


-
Psychological distance is a measure to evaluate the degree of fitting or blending between the perceptual subject and the perceptual object. The study of psychological distance helps us to clarify the way individuals evaluate events, and provides a scientific explanation tool for revealing the generation, control and regulation process of individual psychological perception.
Distance in natural science generally refers to the distance between objects in space or time. In 1912, Bullough[1] first introduced the concept of psychological distance and applied it to aesthetic principles, which means that the generation of aesthetic feeling comes from the psychological distance between the viewer's subjective perception and works of art. That is, we are familiar with the saying 'distance produces beauty'. Since then, the concept of distance is no longer limited to physical objects, and began to enter the researchers' field of vision as an abstract concept.
Schmeichel et al.[2] pointed out that distance and abstraction are cognitively related. In order to better explain how psychological distance affects individual thought and behavior, scholars introduced the level of interpretation theory which originates from the theory of time interpretation[3]. Time is included in psychological distance that will affect the level of individual interpretation, and then affect other cognition and behavior of individuals. Also, Trope and Liberman[4] pointed out that in addition to time distance, psychological distance in other dimensions related to events may also have a certain impact on psychological representation, and put forward a unified theory about psychological distance, which specifically expounds the impact of psychological distance on people's psychological representation. The unified psychological distance interpretation level theory interprets people's response mechanism to cognitive object cognition and evaluation decision-making by introducing the core concept of psychological distance.
Scholars have defined psychological distance from different perspectives and they have explained the connotation of psychological distance from different research fields. On the whole, psychological distance is considered as the perception of the formation of different objects at this moment. At present, the research on psychological distance mainly comprises the following four dimensions: spatial distance; temporal distance; social distance and hypotheticality or probability. When studying the relationship between employees and organizations, Chen and Li[5] divided the psychological distance into six dimensions: space-time distance; objective social distance; cognitive distance; emotional distance; behavior distance and experience distance.
Psychological distance has been widely used in trade, environment, health and other fields, which provides a new idea and perspective for uncovering the obstacle factors and their formation mechanism in various fields. Although research on psychological distance has made some progress, there are still many new fields to be applied.
Psychological safety is especially important in the workplace, such as the healthcare or aviation industries, as it has been shown to be critical in reducing employee errors and enhancing safety[6]. Although several definitions of psychological safety have been proposed, the majority of studies have followed Edmondson[7] by defining it as a shared belief amongst individuals as to whether it is safe to engage in interpersonal risk-taking in the workplace. In a psychologically safe work environment, employees feel that their colleagues will not reject people for being themselves or saying what they think, respect each other's competence, are interested in each other as people, have positive intentions to one another, are able to engage in constructive conflict or confrontation, and feel that it is safe to experiment and take risks[7]. Behaviorally, psychological safety leads employees to engage in open communication, voice their concerns, and seek greater feedback; all of which are interpersonally risky behaviors[8]. This, in turn, has been found to influence a range of workplace outcomes (e.g., learning and performance) at different levels of analysis. Although psychological safety shares some overlap with trust, psychological safety is conceptually different as it focuses on how group members perceive a group norm, whilst trust focuses on how one person views another.
In recent years, there are many studies on applications of psychological safety, such as measures of physical and psychological distance to suicide risk[9], response of psychological distance to occupational safety and health problems[10], effects of power, leadership and psychological safety on resident event reporting[11], double-edged sword effect of psychological safety climate[12], reaction of psychological distance to authoritarian leadership and employee silence[13], perceived influence of power distance, psychological safety, and team cohesion[14], moderating role of psychological safety[15], role of team information sharing, psychological safety, and power distance[16], structural relationship of inclusive leadership in hotel enterprise employees[17], unsafe behaviour formation mechanisms based on risk perception[18], role of psychological safety, feedback-seeking behavior, and power-distance[19], mediating effect of psychological safety and moderating role of power distance[20], understanding psychological safety in simulation-based learning[21], and so on.
Generally speaking, human psychology is the internal reflection of the objective reality, and is externally expressed in the form of human behavior. Statistics show that, in China, some 70% to 90% of industrial accidents that occurred are attributable to workers' unsafe behaviors, of which over 95% are closely related to various adverse psychological conditions[22]. Psychologists have long been engaged in the qualitative expression of different psychological distance. Methods mainly used by them include participant observation, in-depth interviews, documentary literature analysis, and case investigation. Although these methods are capable of authentic, comprehensive and profound presentation, there are some disadvantages like the inability to conduct quantitative descriptions of the human psychological reactions and failure to be strict on scientific and logical levels[23]. Also, most of the past studies on psychological safety distance were mainly focused on unintentional safety events and the studies of psychological distance to intentional security events were ignored. At present, integration of safety and security is a developing potential. It is very important to study the methodology of measuring the psychological safety and security distance (PSSD) and develop a quantitative measuring method for psychological safety and security area. The goal of investigation in this article is to achieve a quantitative expression method of PSSD.
-
According to Bernhardt et al.[24], commonly used quantitative methods in safety psychology include experimental study, the measuring scale method, statistical analysis and element analysis. Of all the existing research concerning psychological attributes, over 90% are carried out using the measuring scale method. In this article, the building of a new method for the PSSD expression is realized via statistical analysis and thus quantified as psychological distance from a new perspective.
Expression of PSSD
-
Human psychological distance that refers to a safety zone is unique to the individual, and this safety zone is defined by a psychological feeling instead of visual perception[25]. In most cases, people in the production area and other environments are the subject of the psychological distance study. Peoples' psychological conditions vary with different stimulus. When subjected to upward positive stimulus, we tend to be encouraged and become happily excited, a phenomenon known as positive impact. While when downward negative ones are presented, the phenomenon of negative impact occurs, and people develop the feeling of repulsion and feel as if they are oppressed. It should be noted that slight and gentle stimulus is believed to be trivial, and is therefore treated as if they did not really exist. We hold that the very small impact exerted by stimulus of this type upon human psychology can be conveniently neglected. To people's safety and security issues, we can proceed as described above.
The description in the above paragraph can be translated into the following mathematical language: suppose that N influencing factors exist. We can build a 2D coordinate framework, of which the lateral and vertical axis signifies the metric of a certain influencing factor and the PSSD; the first and third quadrant represents the positive zone and the negative impact zone corresponding to positive and negative psychological conditions respectively, as shown in Fig. 1; and the origin is deemed as the point of balanced impact where the stimulus is relatively small. We can build a method and obtain the curve of the function describing the relationship between the PSSD and the mentioned influencing factor. Working in the same fashion, for example, we can figure out a graph reflecting the PSSD of a man versus the detailed influencing variables of the coordinate system.
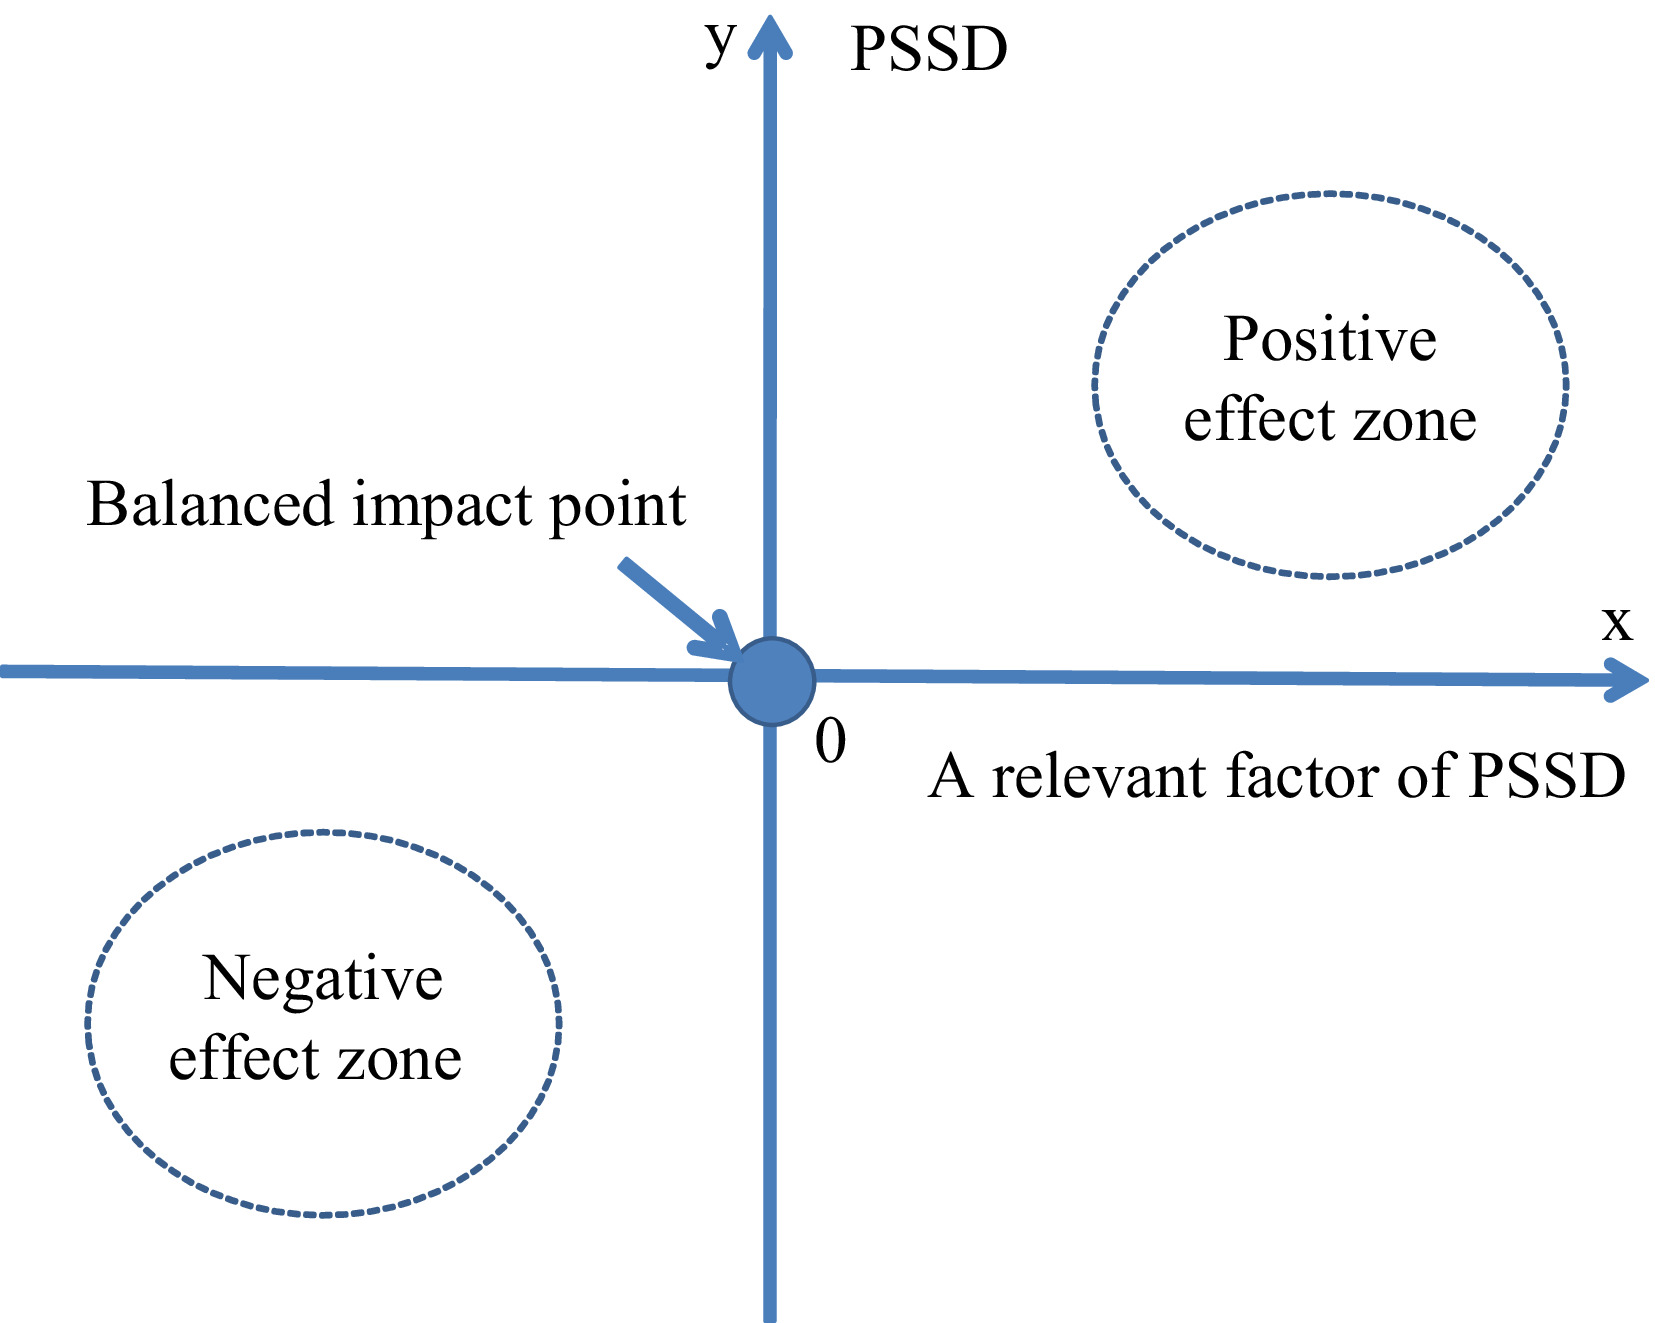
Figure 1.
2D coordinate framework for PSSD expression.
Factors influencing PSSD
-
By searching and analyzing the relevant articles concerned with the psychological research method in the database of Engineering Index (EI), it was found that researchers in power generation, construction and coal mining have reached a consensus, that the accidents are directly attributable to unsafe human behaviors which are closely related with the cognitive and psychological activities of the stakeholder when accidents take place. In our article, individual personality, social influences, environmental impacts and individual physical condition in some cases are believed to be the fundamental forces that form a synergy of unsafe psychology. Individual personality involves the psychological activities of a person in response to an intriguing event, which are reflected in the form of different outcomes[26]. Social influence is a combination of personal inter-relationship, family relationship, group behavior and the need for recreational activity. Environmental impacts are impacts brought about by the working and living environment as a whole[27]. When not in shape, people tend to be sluggish in feeling, perception, thinking and reacting, we are convinced that unsafe behaviors are caused by both psychological and physical influences, which instead of being isolated from each other, are mutally affected.
Based upon the above analysis, this article divides factors influencing PSSD into objective ones and subjective ones, among which the former includes individual personality and physical condition, and the latter social and environment influences.
Weighting the influencing factors
-
The most commonly used methods in factor weighting include the expert grading method, the hierarchy process (AHP) and the grey relation degree method. Considering the characteristics and usability of quantification of PSSD described in Introduction, we decide to adopt a rough sets-based weighting method. This method is more careful and it takes into consideration both subjective weight and experts' experience to accomplish its task.
(1) Rough sets theory
The rough sets theory put forward by Pawlak suggests the expressing, learning and summarizing of knowledge and data in an incomplete and uncertain manner[28].
The rough sets theory is as described below:
Set
$U $ $R $ $U $ $R $ $C $ $ X\subseteq C $ $X $ $ C$ $ x\in X $ $ {\left[x\right]}_{R} $ $ \left|IND\left(X\right)\right|=\cap R $ $X $ (2) Attribute significance
Definition 1: Set
$ K=\left(U,\;{{R}}\right) $ $R $ $\mathbb {R} $ $ GD\left(R\right) $ $ R\in {{R}} $ $ GD\left(R\right)=\frac{\left|R\right|}{\left|{U}^{2}\right|}=\frac{\left|R\right|}{|{U|}^{2}} $ (1) Definition 2: Set
$ K=\left(U,\;{{R}}\right) $ $R $ $\mathbb {{R}} $ $ Dis\left(R\right) $ $ R\in {{R}} $ $ Dis\left(R\right)=1-GD\left(R\right) $ (2) Definition 3: Set
$ X\subseteq C $ $C $ $ {Sig}_{X}\left(x\right) $ $X $ $ {Sig}_{X}\left(x\right) $ $ {Sig}_{X}\left(x\right)=1-\frac{|X\cup \left\{x\right\}|}{\left|X\right|} $ (3) where
$ \left|X\right| $ $ \left|IND\left(X\right)\right| $ $ \dfrac{U}{\left|IND\left(X\right)\right|}=\dfrac{U}{X}=\left\{{X}_{1},{X}_{2},\cdots ,{X}_{n}\right\} $ $ \left|X\right|=\left|IND\left(X\right)\right|=\sum _{i=1}^{n}{\left|{X}_{i}\right|}^{2} $ According to the above three definitions, if the incorporation of
$x $ $X $ $x $ $X $ Because we are more familiar with the full text database of the Chinese National Knowledge Infrastructure (CNKI) and it contains more full text articles relevant to various accidents than those of the Web of Science, we searched with the keywords 'factors influencing safety production' in CNKI for relevant articles. The resulting articles cover 40 disciplines. Articles concerning the following seven typical disciplines: industrial economy; electric industry; construction science and engineering; mining engineering; road transportation economy; railway transportation; and space flight and aviation science and engineering were searched. Together these seven disciplines are noted as
$u_1,\;u_2,\;u_3,\;u_4,\;u_5,\;u_6, $ $u_7 $ $U $ In this article, we define the finite universe
$U $ $ U=\left\{{{u}_{0},u}_{1},{u}_{2},{u}_{3},{u}_{4},{u}_{5},{u}_{6},{u}_{7}\right\} $ $ {u}_{0} $ $A =\left\{a,b,c,d,e\right\} $ $ C=\left\{a,b,c,d\right\} $ $ D=\left\{e\right\} $ $V =\left\{\mathrm{0,1}\right\} $ $A $ $a,\;b,\;c $ $d $ Table 1. Literature contribution to the PSSD information sets.
a b c d e u0 1 1 1 1 1 u1 1 0 1 1 1 u2 0 0 1 1 1 u3 1 0 1 0 1 u4 1 0 1 1 1 u6 1 0 0 1 1 u6 1 0 0 1 1 u7 1 1 1 1 1 Based on the information presented in Table 1, we are capable of determining the significance of all the variables in
$C $ Suppose
$ {X}_{1}=\left\{b,c,d,e\right\} $ $ \dfrac{U}{{X}_{1}}=\{\{{u}_{0},{u}_{7}\},\{{u}_{1},{u}_{2},{u}_{4}\}, \{{u}_{3}\},\{{u}_{5},{u}_{6}\}\} $ $ \left|{X}_{1}\right|={2}^{2}+{3}^{2}+{1}^{2}+{2}^{2}=18;\dfrac{U}{\left\{{X}_{1}\cup \left\{a\right\}\right\}}=\{\left\{{u}_{0},{u}_{7}\right\},$ $\left\{{u}_{1},{u}_{4}\right\}, \left\{{u}_{2}\right\},\left\{{u}_{3}\right\},\left\{{u}_{5},{u}_{6}\right\}\} ,\;{{\text{ and}}\;{\text{ we}}\;{\text{ have}}}$ ${|X}_{1}\cup \left\{a\right\}|= {2}^{2}+{2}^{2}+ $ $ {1}^{2}+{1}^{2}+{2}^{2}=14 $ $ {Sig}_{{X}_{2}}\left(b\right)=0.36,\; {Sig}_{{X}_{3}}\left(c\right)=0.36,\; {Sig}_{{X}_{4}}\left(d\right)=0.2 $ After figuring out the significance
$ {Sig}_{{X}_{i}}\left({x}_{i}\right) $ $ {Sig}_{{X}_{i}}\left({x}_{i}\right) $ $P_i $ $x_i $ $ {P}_{i}=\frac{{Sig}_{{X}_{i}}\left({x}_{i}\right)}{\sum _{i=1}^{n}{Sig}_{{X}_{i}}\left({x}_{i}\right)} $ (4) After normalization of the significances, we have
$ {P}_{1}=0.19, \;{P}_{2}=0.31,\; {P}_{3}=0.31,\; {P}_{4}=0.19 $ The ultimate index weight
$I $ $P $ $Q $ $I $ $ I=\alpha Q+\left(1-\alpha \right)P\;\;\;\;\;\;\left(0\le \alpha \le 1\right) $ (5) Where
$ \alpha $ $ \left(1-\alpha \right) $ $ \alpha =0.5 $ The subjective weights
$ Q=\left\{{Q}_{1},{Q}_{2},\cdots ,{Q}_{n}\right\} $ $ C=\left\{{x}_{1},{x}_{2},\cdots ,{x}_{n}\right\} $ $ \sum _{i=1}^{n}{Q}_{i}=1 $ $ Q=\left\{0.25,0.10,0.35,0.30\right\} $ Based on Q and P, we can calculate the overall weight for the four indexes individual personality, physical condition, social influence and environmental impact concerning the PSSD as
$ {I}_{1}=0.22,\; {I}_{2}=0.205, \;{I}_{3}=0.33 $ $ {I}_{4}=0.245 $ According to the calculated
$ {I}_{s} $ $ {I}_{3} $ -
(1) Triangular fuzzy theory
The triangular fuzzy theory was put forward by Zadeh in 1965[29], which suggests a membership function
$ {\mu }_{\tilde {B}}\left(x\right) $ $ {\mu _{\tilde B}}\left( x \right) = \left\{ \begin{array}{*{20}{l}} 0 & x \le {b_1} \\ \dfrac{{x - {b_1}}}{{{b_q} - {b_1}}}& {b_1} \lt x \le {b_q} \\ \dfrac{{{b_r} - x}}{{{b_r} - {b_q}}} & {b_q} \le x \lt {b_r} \\ 0 & x \ge {b_r} \end{array} \right. $ (6) Where
$ \tilde {B}=\left({b}_{1},{b}_{q},{b}_{r}\right) $ $ {b}_{1}\le {b}_{q}\le {b}_{r} $ $ \tilde {B} $ $ \left({b}_{1},{b}_{r}\right) $ $ \tilde {B}={b}_{q}. $ (2) Expert fuzzy evaluation
People use the expert fuzzy evaluation method to anonymously seek for, give feedback to and make adjustment of opinions from an expert panel. This method allows people to subjectively combine the personal experience and objective evaluation of members of the expert panel. Expert fuzzy evaluation is applicable to the study of issues of which pure quantitative methods fail to draw a conclusion. Due to the fuzzy characteristics of the PSSD in itself and relevant factors, and the intensity of the impact that relevant factors exert upon different experts, we adopt the expert fuzzy evaluation in this article to gain the evaluation for typical and specific influencing factors concerning the PSSD.
① Fuzzy sets of factors influencing the PSSD
In this article, the horizontal axis of the 2D coordinate system is taken to measure a certain influencing factor. The first and third quadrant represents the positive impact zone and the negative impact zone respectively. The origin of the coordinate system corresponds to the point of balanced impact. We can transform the four factors studied in this article into corresponding triangular fuzzy value by means of the triangular fuzzy technique.
Factors commonly believed to contribute to unsafe behavior include awareness, disposition and mood. Eight unsafe psychological conditions including negative mind and mental paralyses that are responsible for accidents are attributable to these said factors. In line with the classification of human disposition and personality as put forward by Rafiq and Fang[30], we categorize the individual personality into four types as follows: safety type; non-safe type; unsafe type and highly unsafe type. Table 2 presents the description of and the triangular fuzzy interval for these said types.
Table 2. Descriptions and triangular fuzzy intervals for different types of individual personality in PSSD expression.
Type of individual personality Description Triangular fuzzy interval Safe Normal and relaxed conscious state, brisk and calm, positive or intermediate emotion $ \left(5, +{\infty }\right) $ Non-safe Hyper-normal overstress, irritable impatient, negative emotion $ \left(-6, 6\right) $ Unsafe Subnormal conscious state, insensitive, negative emotion $ \left(-10, -4\right) $ Highly unsafe Unconscious, flippant, negative emotion $ \left(-{\infty }, -8\right) $ Since we are not capable of the exact distinction of human psychological conditions, certain intervals become commonly shared under different individual personality types when transformation of the four types of individual personalities into corresponding triangular fuzzy intervals is carried out.
Working in the same fashion, we give the summary of physical condition, social influence, and environmental impact and there are corresponding triangular fuzzy intervals as presented in Tables 3, 4 and 5 respectively.
Table 3. Descriptions and triangular fuzzy intervals for different types of physical conditions in PSSD expression.
Type of physical condition Description Triangular fuzzy interval Safe Ample sleep, energetic, no sign of fatigue, good psychological condition $ \left(5, +{\infty }\right) $ Non-safe Insufficient sleep, sign of fatigue, physically unwell $ \left(-6, 6\right) $ Unsafe Insufficient sleep, drooping spirit, obvious fatigue, physically unpleasant $ \left(-10, -4\right) $ Highly unsafe Sleep extremely insufficient, numbness, severe fatigue, physical impairment $ \left(-{\infty }, -8\right) $ Table 4. Descriptions and triangular fuzzy intervals for different types of social influence in PSSD expression.
Type of social influence Description Triangular fuzzy interval Safe Good interpersonal relationships, loving family, amicable group atmosphere, supportive national policy $ \left(5, +{\infty }\right) $ Non-safe Bad interpersonal relationships, unloving family, group atmosphere unkind, unsupportive national policy $ \left(-6, 6\right) $ Unsafe Bad interpersonal relationships, unloving family, group atmosphere strained, unsupportive national policy $ \left(-10, -4\right) $ Highly unsafe Interpersonal relationships extremely bad, severe family conflict, group atmosphere exceeding unharmonious, forbidding national policy $ \left(-{\infty }, -8\right) $ Table 5. Descriptions and triangular fuzzy intervals for different types of environmental impact in PSSD expression.
Type of environmental impact Description Triangular fuzzy interval Comfortable Working and living environment perfectly suits ergonomic requirement for comfort $ \left(10, +{\infty }\right) $ Safe Comfortable working environment, good living environment $ \left(5, 10\right) $ Non-safe Barely comfortable working environment, barely satisfactory living environment $ \left(-6, 6\right) $ Unsafe Uncomfortable working environment, poor living environment $ \left(-10, -4\right) $ Highly unsafe Extremely unpleasant working environment, exceedingly poor living environment $ \left(-{\infty }, -8\right) $ ② Fuzzy sets of PSSD
The vertical axis of the 2D coordinate system as presented in this article is used for PSSD measurement. When it comes to the classification of PSSD, we refer to the felicific calculus proposed by Bentham[31]. Bentham put forward intensity, certainty, proximity, influence, purity, and extensity as the seven evaluative criteria in calculating felicity. These seven criteria are also used in this article to calculate the PSSD. Of all these seven criteria, certainty refers to the probability of security in production; proximity of the time interval between two adjacent occasions of security feeling; influence of the likelihood of triggering another feeling after an immediate feeling occurs in the wake of a series of actions; purity, the extent of antagonistic feeling a person has when security is obtained; and extensity, the scope influenced by actions taken for security acquirement. In line with these said seven evaluative criteria, we classify the PSSD into eight categories as: absolutely safe; highly safe; safe; relatively safe; relatively unsafe; unsafe; extremely unsafe and absolutely unsafe.
In practice, we acquire relevant safety parameters through investigation and research. We weight these parameters and sum up the safety index of which the larger the value, the higher the level of the PSSD. We also present the description of and fuzzy triangular intervals for these said eight categories of PSSD[29] in Table 6.
Table 6. Descriptions and triangular fuzzy intervals for different types of PSSD.
Type of PSSD Description Triangular fuzzy
intervalAbsolutely safe Extremely high safety index $ \left(100, +{\infty }\right) $ Highly safe Very high safety index $ \left(80, 100\right) $ Safe High safety index $ \left(40, 80\right) $ Relatively safe Relatively high safety index $ \left(0, 40\right) $ Relatively unsafe Relatively low safety index $ \left(-40, 0\right) $ Unsafe Low safety index $ \left(-80, -40\right) $ Highly unsafe Very low safety index $ \left(-100, -80\right) $ Absolutely unsafe Extremely low safety index $ \left(-{\infty }, -100\right) $ The knowledge background and preference varies with the expert. In this article, we set
$ {E}_{ij} $ $ jth $ $ k $ $ ith $ $ {E}'_{ij} $ $ {E}_{ij} $ $ {E}'_{ij} $ $ \left({e}_{ij1},{e}_{ijq},{e}_{ijr}\right) $ $ \left({e}'_{ij1},{e}'_{ijq},{e}'_{ijr}\right) $ $ \widetilde {{E}_{i}}=\left(\frac{1}{k}\sum _{j=1}^{k}{e}_{ij1},\frac{1}{k}\sum _{j=1}^{k}{e}_{ijq},\frac{1}{k}\sum _{j=1}^{k}{e}_{ijr}\right) $ (7) We can also calculate
$ \widetilde {{E}'_{i}} $ To figure out the corresponding triangular fuzzy value, the Gravity of Center Defuzzification method is applied. The formula for this method is equation (8) as described below:
$ {E}_{i}=\frac{{\int }_{0}^{1}x\widetilde {{E}_{i}\left(x\right)}d\left(x\right)}{{\int }_{0}^{1}\widetilde {{E}_{i}\left(x\right)}d\left(x\right)} $ (8) Through equation (8), we can figure out
$ {E}_{i} $ $ {E}'_{i} $ $ \widetilde {{E}_{i}} $ $ \widetilde {{E}'_{i}} $ $ {E}_{i} $ $ {E}'_{i} $ $ \left({E}_{i},{E}'_{i}\right) $ Mathematical modeling
-
An extensive review of relevant literature reveals that mathematical modeling in the discipline of safety science usually goes to risk assessment and computer dynamic model development ensuring personnel safety[32], while research concerning PSSD mathematical modeling is rarely seen. In light of this situation, we make some assumptions and build a mathematical model for PSSD with the help of computer software.
(1) Modeling assumptions
① The research subject in this article is confined to people who are psychologically normal. Those few people who suffer from mental problems including psychopathy, serious inferiority complex and autism are not considered.
② The normal pattern of mental reflection of Stimulus → Objects → Reactions is followed in this article. Under certain circumstances, extreme unsafe factors might lead to safe psychology, whereas exceedingly safe elements could result in unsafe psychology. Cases like these are excluded from this article.
③ When evaluating the fuzzy sets of the PSSD and the various factors influencing it,
$ {\infty } $ ④ The origin of the N dimensional coordinate system is the transition point (also known as the point of balanced effect) which divides the safe zone and the unsafe zone.
(2) Data collection
The data needed in this article is concerned with factors influencing the PSSD. For a given factor Ci, we shall give description to its constituents under different backgrounds and figure out their corresponding triangular fuzzy values. The expert fuzzy evaluation method is then used, based on the gained fuzzy values, to assess the said backgrounds. The triangular fuzzy value given by all the experts shall be considered together. Take individual personality as an example, it consists of the awareness, working attitude, disposition, characteristics, mood, capacity and temperament. Orthogonal experiments will then be conducted to pick up representative constituents from these.
-
In this article, we chose individual personality as the subject factor influencing the PSSD. By using the expert fuzzy evaluation method, we gain the triangular fuzzy value for the said factor under a different background. Table 7 presents part of the 2D coordinates acquired by defuzzification of the evaluative results.
Table 7. Part of original data of 2D coordinate points obtained by expert fuzzy evaluation in PSSD expression.
Description 2D coordinates Conscious, relaxing, cautious, responsible, extroverted, outgoing, positive, quick learning capacity (10, 120) Conscious, relaxing, cautious, responsible, introverted, calm, positive, quick learning capacity (9.67, 116.67) Conscious, slightly nervous, careless, outgoing, irritable, positive, average learning capacity (1.33, 16.67) Conscious, slightly nervous, careless, introverted, insensitive, intermediate mood, average learning capacity (−2.67, −33.33) Conscious, hyper-normal stressed, responsible, cautious, introverted, calm, negative, relatively quick learning capacity (−0.67, −16.67) Conscious, hyper-normal stressed, careless, outgoing, extroverted, intermediate mood, poor learning capacity (−1.33, −20) Fuzzy consciousness, relaxing, responsible, cautious, introverted, calm, intermediate mood, quick learning capacity (−2, −30) Fuzzy consciousness, slightly nervous, careless, outgoing, irritable, positive, average learning capacity (−8, −73.33) Fuzzy consciousness, hyper-normal stressed, careless, outgoing, extroverted, positive, poor learning capacity (−11.33, −123.33) Slack consciousness, relaxed, careless, outgoing, extroverted, intermediate mood, quick learning capacity (2.67, 16) Fig. 2 shows a scatter diagram example of original data. We can determine from Fig. 2 that the original data given by the expert panel are mainly distributed in three areas[21]. This distribution of data is due to individual personality and the corresponding triangular fuzzy interval of the PSSD as set in this article. We can figure out the changing trend of the PSSD that varies with individual personality. This trend will be complimentary to the expert fuzzy evaluation method. By using the least square method, we conducted curve fitting upon these 2D coordinates and obtained the results[33] as presented in Fig. 3 by computer software.
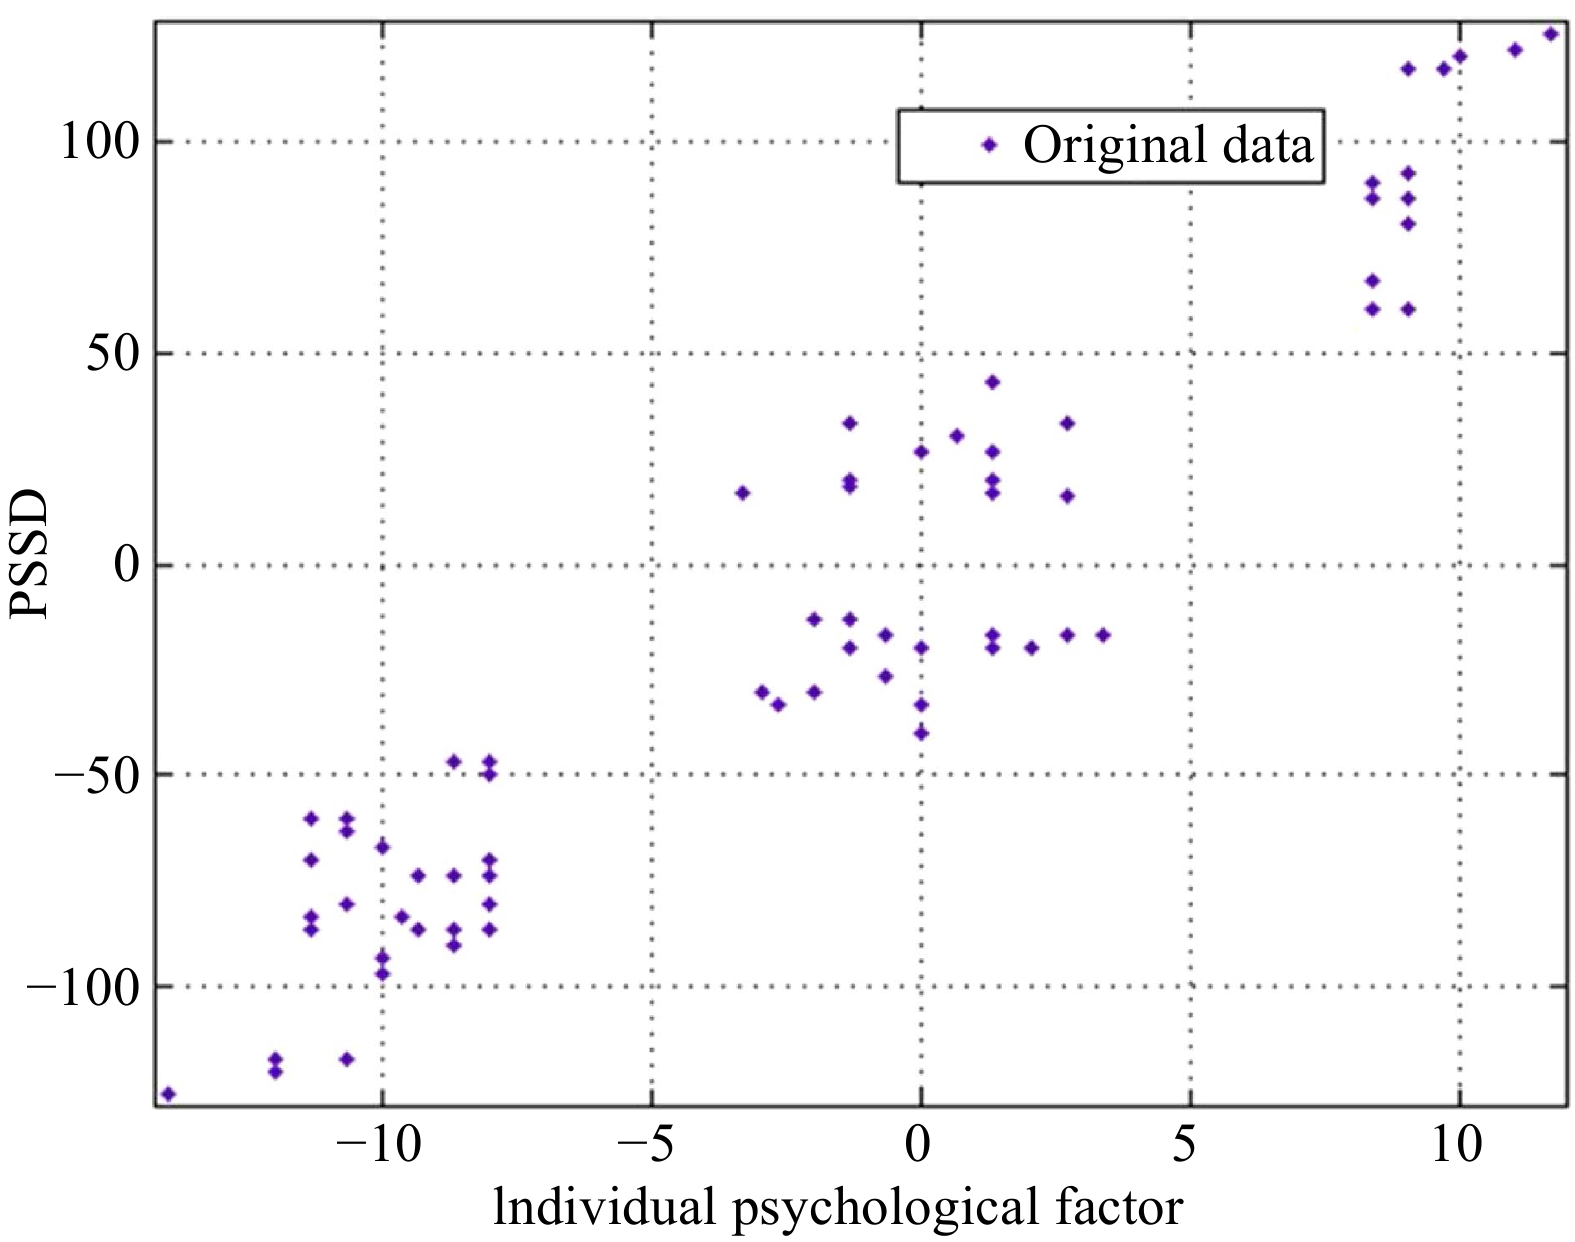
Figure 2.
Scatter diagram example of original data for PSSD expression.
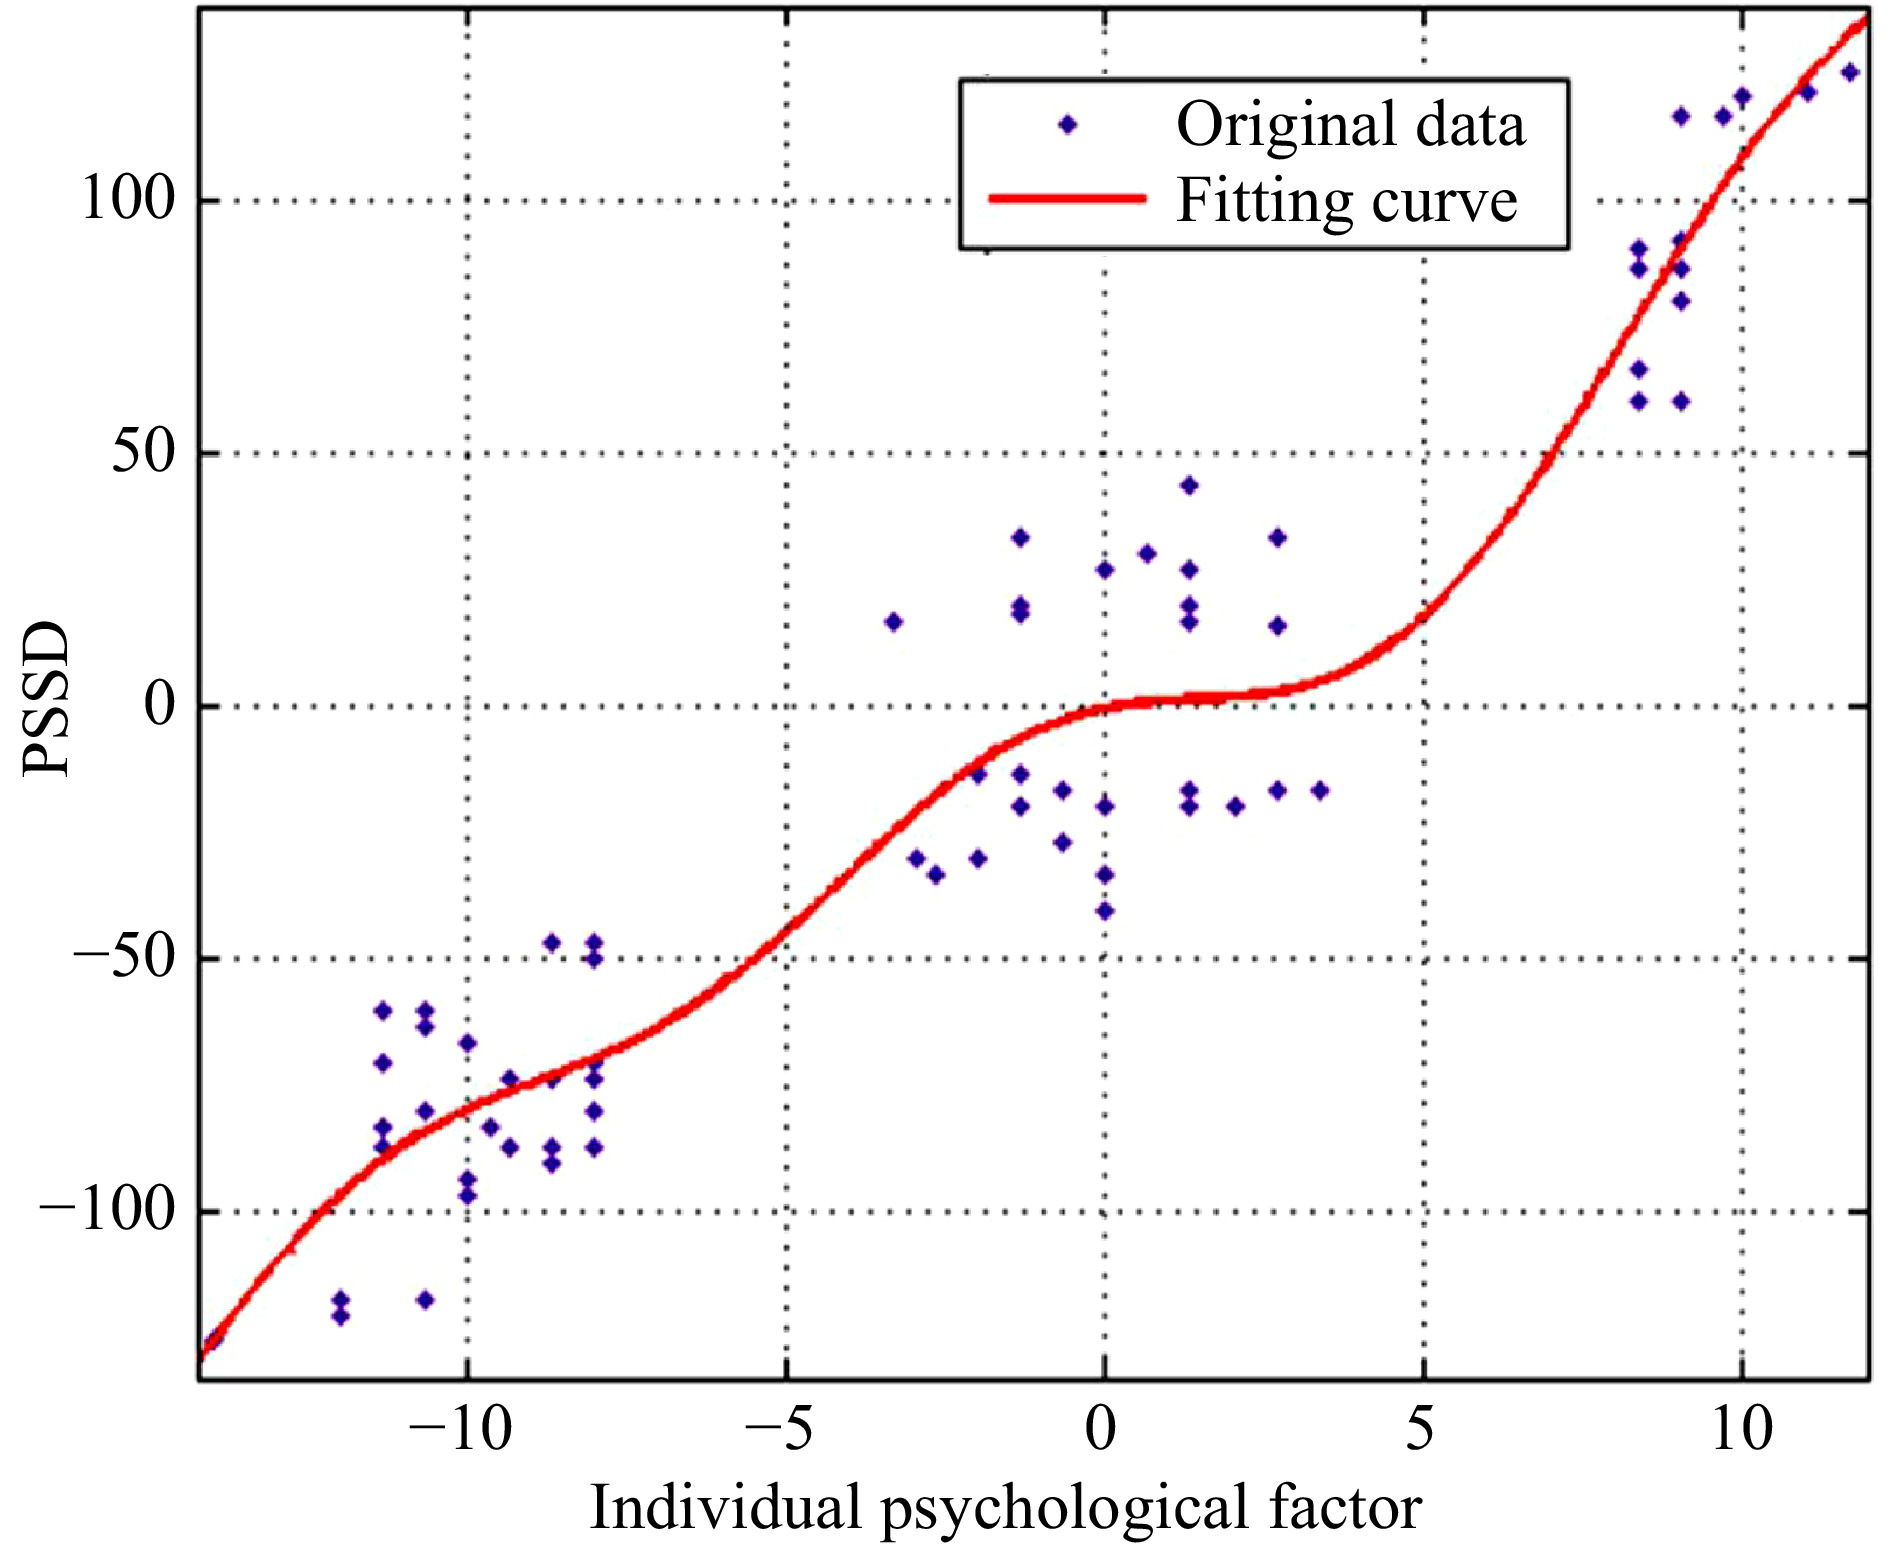
Figure 3.
Fitting curve example for PSSD and individual psychological factors.
Fig. 3 shows the fitted curve, which can be expressed as equation (9) described below:
$ \mathrm{y}={a}_{1}\mathrm{sin}\left({b}_{1}x+{c}_{1}\right)+{a}_{2}\mathrm{sin}\left({b}_{2}x+{c}_{2}\right)+{a}_{3}\mathrm{sin}\left({b}_{3}x+{c}_{3}\right) $ (9) Where
${a}_{1}=546,\; {b}_{1}=0.1496, \;{c}_{1}=0.0651,\; {a}_{2}=457.4, \;{b}_{2}= 0.1672,\; {c}_{2}=-3.042,\;{a}_{3}=10.81, \;{b}_{3}=0.558, \;{c}_{3}=2.074$ As is presented in Fig. 3, individuals who are stable in characteristics, clear in consciousness, mindful in their work and other circumstances, and steady in mood are expected to gain higher safety indexes. Their safety indexes increase steadily, and they are believed to be working under safe conditions. It is also revealed in Fig. 3 , that when active elements including positive attitude, enthusiasm and sobriety are added into the individual personality, the safety index grows exponentially. However, when negative elements are added, the safety index will nosedive. It is possible that the slope of the safety index decline will be lowered when several negative elements overlap with each other, yet when certain negative index stand out prominently or the number of negative elements is large, the safety index will again plummet sharply.
Furthermore, a positive analysis upon the relationship between individual personality and PSSD can be investigated. With the same fashion, the relationship between PSSD and other relevant factors can be plotted. The function of PSSD with n variables in a n+1 dimensional coordinate system can also be deduced.
-
The steps of the method that we adopted to quantify PSSD expression can be summarized as follows:
1) Determination of the type of factors that influences PSSD;
2) Weighting factors related to PSSD;
3) Describing factors influencing PSSD and calculating the triangular fuzzy value;
4) Building 2D coordinate systems and plotting the fitness curves for the PSSD versus every single relevant factor, or building a n+1 dimensional coordinate system and plotting a single fitness curve for the PSSD and n factors;
5) Analyzing the trend of PSSD, and putting forward relevant safety and security measures.
If the obtained research results cannot meet the expected requirements, the above steps can be modified or repeated until the research objectives are satisfied.
-
(1) Safety psychology is an interdiscipline between psychology and safety science. As psychology mainly belongs to social science and its research method in most cases is qualitative, previous research in safety psychology was almost all of the qualitative level. Therefore, quantitative research method innovation of PSSD is significant for promoting its development.
(2) Individual personality, physical condition, social influence and environmental impact are all factors influencing the PSSD. In the case study, it was found that the adding of positive elements into individual personality, results in exponential growth of the safety index, while the addition of negative ones leads to the reserve result.
(3) Qualified analysis based on the PSSD expression improves the study on psychological safety and security issues and makes it more scientific. The method can be replicated with similar cases, making it more objective and intuitive, which to a certain degree, enriches the qualitative and quantitative study of safety and security psychology.
(4) The method used for measuring PSSD in the current article can be applied and used in other social science issues.
The authors would like to thank reviewers and editors cordially for their comments and suggestions. This study is supported by the Hunan Natural Science Foundation of China (No. 2021JJ40799).
-
The authors declare that they have no conflict of interest.
- Copyright: © 2022 by the author(s). Published by Maximum Academic Press on behalf of Nanjing Tech University. This article is an open access article distributed under Creative Commons Attribution License (CC BY 4.0), visit https://creativecommons.org/licenses/by/4.0/.
-
About this article
Cite this article
Wu C, Liu C, Kang L. 2022. Method for quantitative expression of psychological safety and security distance (PSSD) using fuzzy theory. Emergency Management Science and Technology 2:2 doi: 10.48130/EMST-2022-0002 

Method for quantitative expression of psychological safety and security distance (PSSD) using fuzzy theory
- Received: 19 December 2021
- Accepted: 07 March 2022
- Published online: 24 March 2022
Abstract: Usually psychological safety and security distance (PSSD) is difficult to express quantitatively as it belongs to the field of social science. This article presents a mathematical approach for the PSSD expression using fuzzy theory. In the building of this method, the rough sets theory is applied to weight the influencing factors concerning the PSSD. The triangular fuzzy theory and the expert fuzzy evaluation method are utilized to address the fuzziness and uncertainty that might arise in assessing the relevant factors of PSSD. Fitting a curve for depicting the relationship between the PSSD and individual psychological factors is carried out using computer software. Also, the procedures of measuring PSSD are summarized as a general method and it is therefore of validity for the quantitative measurement of other relevant qualitative issues.