


-
Air contamination isn't just an al fresco matter[1], but its enclosed spaces, for instance workplaces, habitats or schools can also be contaminated via contagions emitted through outdoor and indoor sources[2−4]. Furthermore, some categories of air contagion may be worse for indoors than outdoors, for instance chemicals discharged from synthetic textiles, cigarettes, and fittings and home-use products[3, 5]. Contamination of the environment by particulates, effluents, metals and other pollutants is of major concern due to their toxicity and risk to environment and human life[6, 7]. Particulate and emissions toxicity seems to be dependent on exposure route, duration, dose and exposure frequency. For instance, when oil is explored in water sparse zones the water resources become strained. Off-shore oil exploration creates threats to oceanic[8−10] life whereas oil circulation and haulage will create extreme hazards for the ecosystem in case of seepage or accidents[2, 11−13]. When oil spills-out or when there is waste matter expulsion, it percolates into the soil and blends with the underground water system. It has been ascertained that contaminated underground water takes many years before it can be cured[4, 14−17]. Nonetheless this underground water moves into brooks, streams, rivulets and boreholes or wells which are the key sources of local water supply in the neighborhood which consequences are an upsurge of water-borne sicknesses[18−20]. This has disturbed the traditional rapport of the inhabitant within the oil-bearing enclaves[21−23]. There is a discernible trepidation that instead of being the life-giver, these water scenarios have become sources of death, misery, and sicknesses[24−27].
-
Delta state is one of the nine states created in 1991, excised from the old Bendel State (Figs 1 & 2). At its inception it has 19 Local Government Areas (LGAs). Delta state as revealed in the 2006 census, has a population of 4,112,445; comprising 2,069,309 males and 2,043,136 females; distributed over about 890,312 households. It also encompasses a landmass or area of over 17,239,24 km2, with average density of 238.6 persons per km2 (NPC 2006). According to the 2006 census, Delta state like the nation Nigeria has witnessed an increase in population, ranks the 12th most populous state in the country and the 2nd most inhabited among the nine oil producing states that comprises the Niger Delta Region. The population is being estimated to be growing at an annual growth rate of 3.2% just as that of the entire country[28].
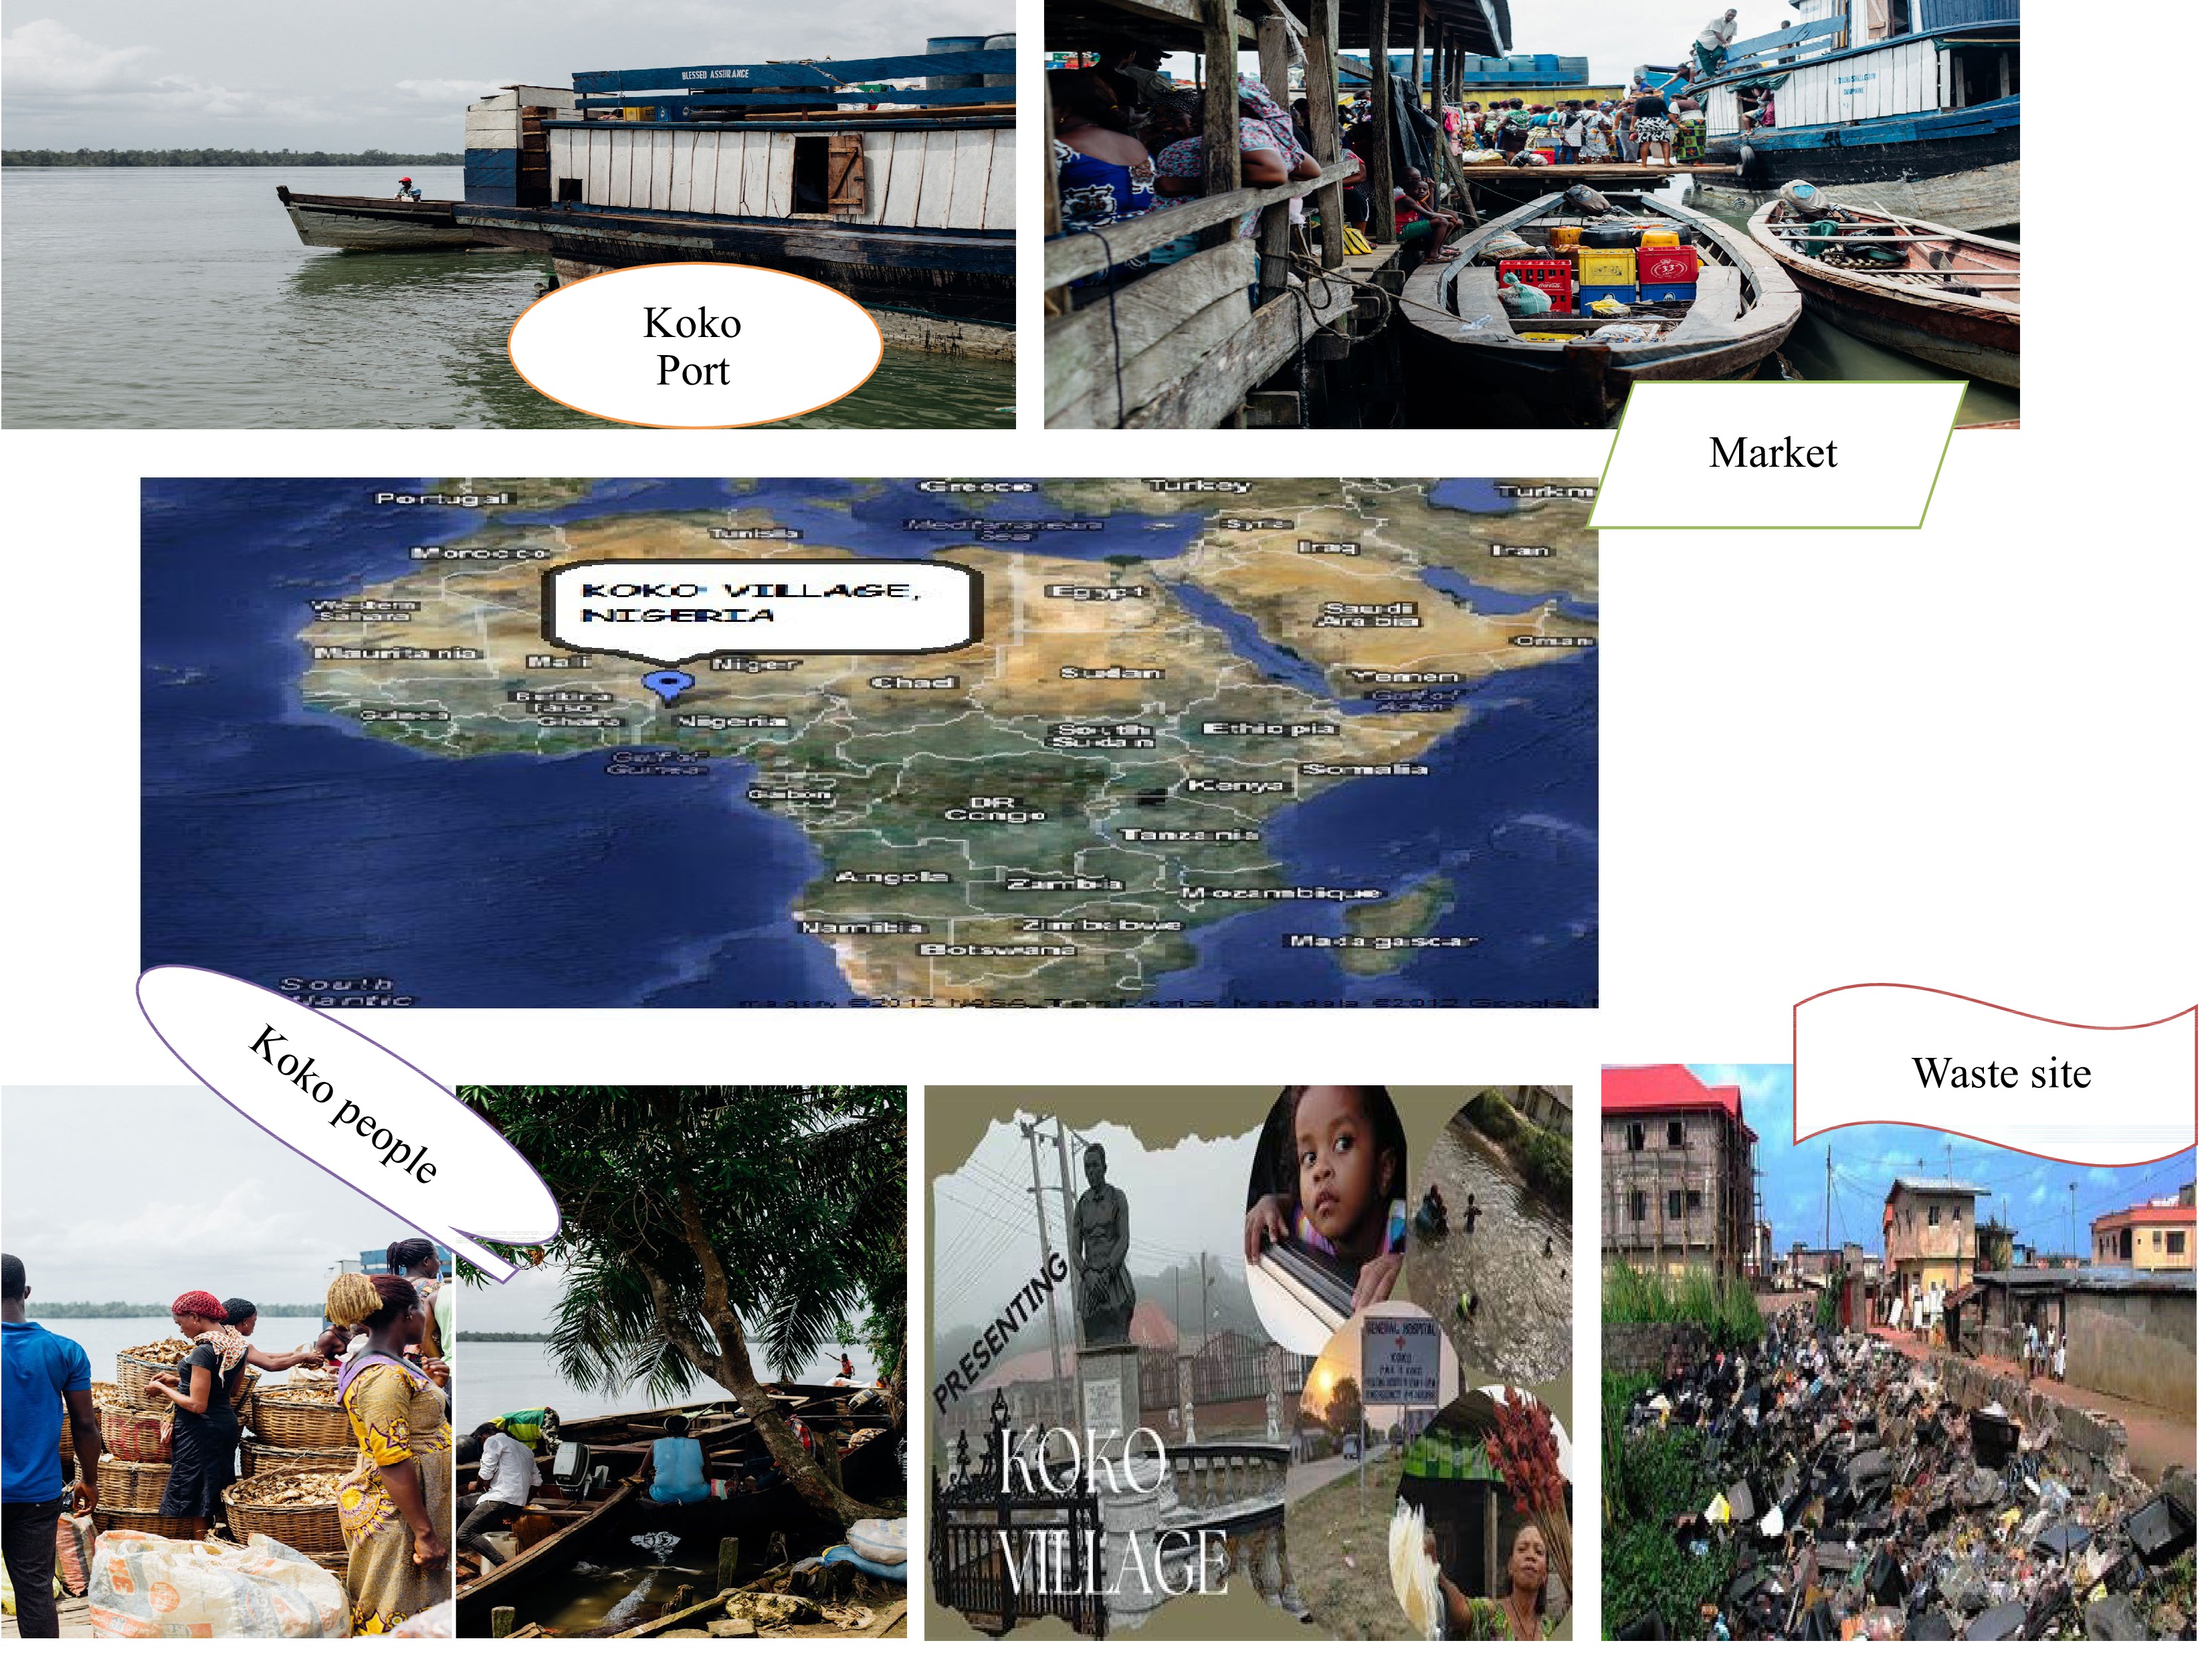
Figure 1.
Study region showing Koko village in Warri North Local Government Area, Nigeria.
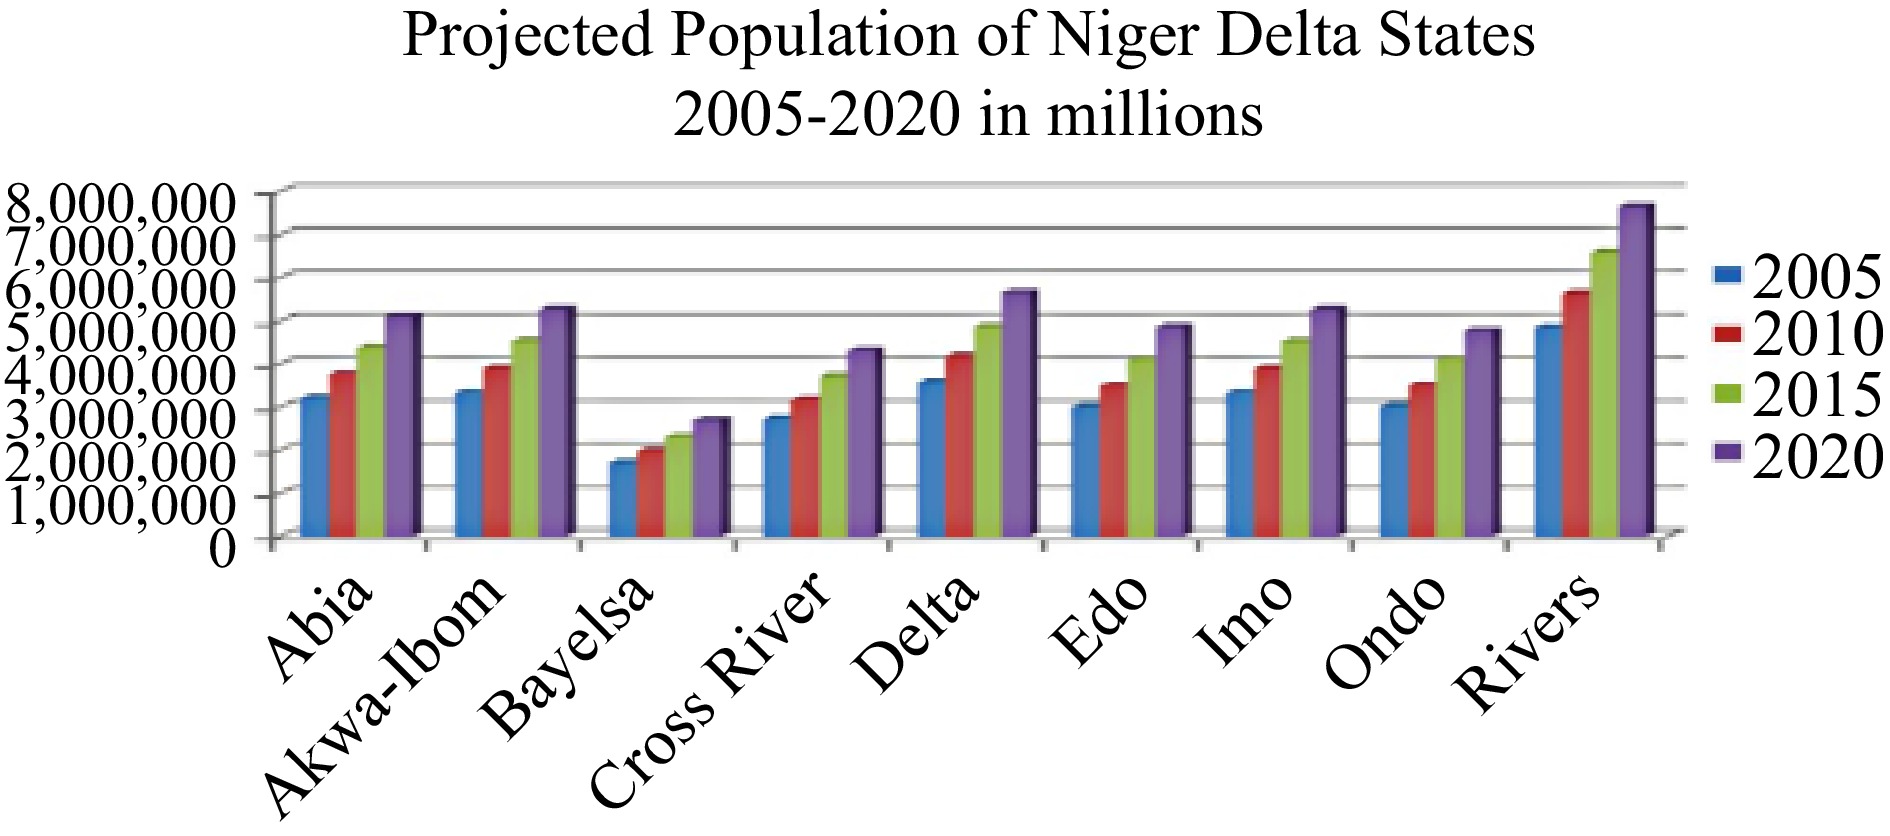
Figure 2.
Niger Delta state population projection based on NPC data and growth rates.
Techniques
-
A pilot origin categorization and separation was carried out at the company and its environ in Lagos metropolis of Nigeria from July 2021 to October 2022 for gathering of data on water attributes as well as composition, generation level and compliance rate of waste management.
Air emission
-
Air emissions associated with the operations of the study zones are basically gaseous emissions and particulate matter. The sources of particulate emissions include the general depot operations, loading and offloading activities and truck movement (Fig. 3), while sources of gaseous emissions within zones includes working losses, fugitive losses and generator operations, as well as operations of trucks. Therefore, Suspended Particulate Matter (SPM), Volatile Organic Compounds (VOCs), Carbon monoxide (CO), Carbon monoxide (CO), Sulphur dioxide (SO2), Hydrogen Sulphide (H2S), Oxides of Nitrogen (NOx), in the ambient environment were measured during the study. The in-situ ambient air quality measurements were carried out in line with regulatory requirement to ascertain outdoor air condition of the facility’s environment (Tables 1 & 2).
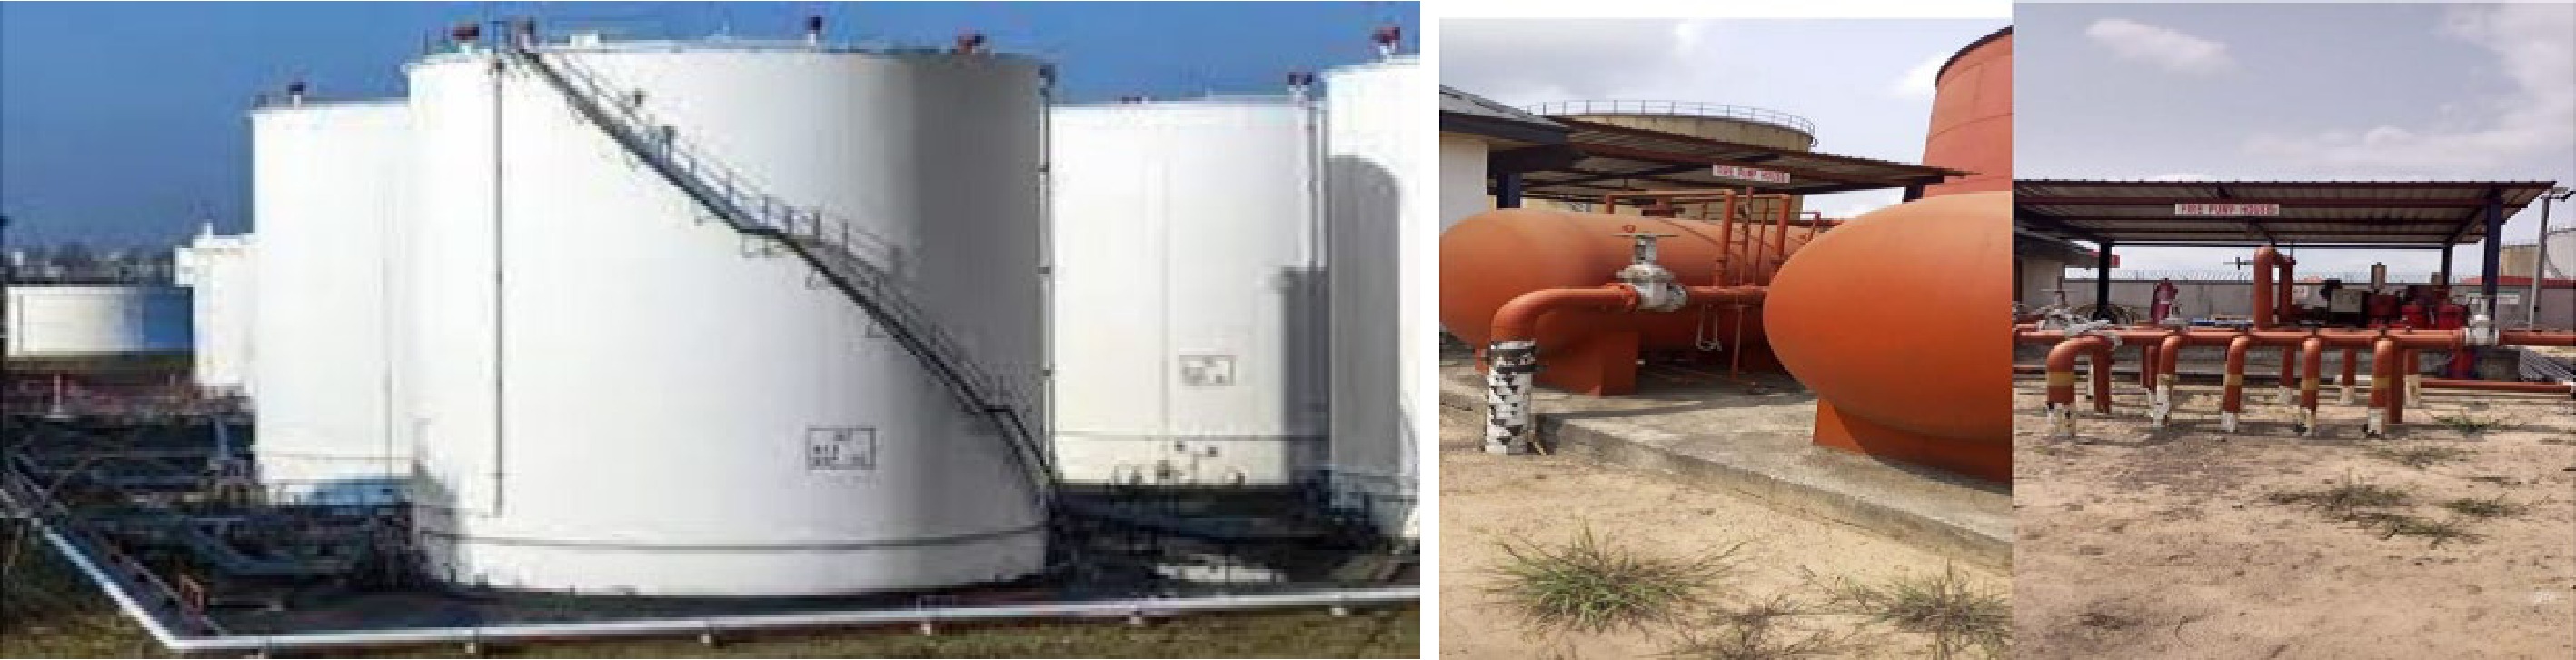
Figure 3.
Typical tank farm and fire pump station.
Table 1. Measurement techniques with its water attributes physiognomies.
Parameters Unit Acronyms Techniques and instruments Total Suspended Particle TSP Temptop PMD 351Handheld air borne aerosoil meter,
(HPPC 6+) sum efficiency –50.0% @0.30µmTemperature, dew point, relative humidity and wind speed T (°C), DP, RH
and WSKestrel 5500 weather meter was utilized for the microclimate measurement. Heavy metals Manganese, Lead, Copper, Nickel, Cadmium, Cobalt, Zinc Mg, Pb, Cu, Ni,
Cd, Co, ZnAPHA 3111B, UNICAM 969 AAS Microbiology (cfu/mi) Coliform, Ecoli, Staphylococcu, Vibrio, Total coliforms, Aerobic plant count, Yeast & Mould APHA 9215C Anions Nitrate, Nitrite (mg/l) ${\text{NO}^-_3},\; {\text{NO}^-_2} $ APHA 4500, UN spectrophotometer Sulphate, Phosphate (mg/l) SO4, ${\text{PO}^{3-}_4} $ APHA 4500B, UN spectrophotometer Calcium (mg/l) Ca APHA 4500A, UN spectrophotometer Physico-chemical Hydrogen ion concentration pH pH meter/insitu Colour (Pt.Co) APHA 2120A Dissolved oxygen (mg/l) DO APHA 5220A, DO meter Conductivity (µs/cm) Cond APHA 2510A, multi- parameter Chloride (mg/l) Cl− APHA 4500 B, titration Total dissolve solids (mg/l) TDS APHA 2540A, gravimetric Total suspended solids (mg/l) TSS APHA 2540D Appearance APHA 2110 Acidity (mg/l) APHA 2310B Ammonia Nitrogen (mg/l) NH3C APHA 4500 Turbidity (mg/l) Turb APHA 2130B, turbidity meter Bacterial oxygen demand (mg/l) BOD APHA 5210B, Incubator/winkler Chemical oxygen demand (mg/l) COD APHA 5220D, K2C-207 reflux Alkalinity (mg/l) Alk APHA 2320B, Titration Detergent (mg/l) APHA 5540C Oil and grease (mg/l) APHA 5520B Table 2. Scrutiny techniques and some health impact of contagions.
Parameters Instrument Techniques Above permissible limit health impact Sulphur IV oxide (SO2) SO2 Gas Alert test meter Direct reading Causes irritation of the respiratory tract Particulate matter (PM) Gas Alert test meter Gravimetric Causes catarrh, cough, lung infections and other respiratory diseases Combustible gas (CHN) Gas Alert test meter Direct reading Induces a despondent and depressed state Carbon monoxide (CO) CO test meter Direct reading Lessens the oxygen-carrying blood capability to damage of the central nervous system Oxides of Nitrogen (NOX) NOx test meter Direct reading Causes inflammation of the lungs but less toxic Noise Noise meter, Rion sound
level meter, NA modelDirect Reading Particulate, gaseous emission and environmental conditions level measurement
-
Airborne particulates were collected from several sampling locations using a Bosean Airborne Particulate Counter. The dust monitor was zeroed and set at the run mode 15 s. This is to directly measure the exact concentration of the air borne particulates in 1 l of air. The concentrations of the air borne particulates were then read off the screen of the monitor. Sampling and measurement for temperature and humidity was carried out using same Bosean Equipment (Fig. 4). Noise level was carried out using the Bosean Noise Level Monitor capable of measuring wind speed and wind flow, equipped with back-lit LCD dual display and a variety of choice of readings in kM/h, knots, or m/s. These instruments like any other digital instrument is powered by a battery cell and is hand held.
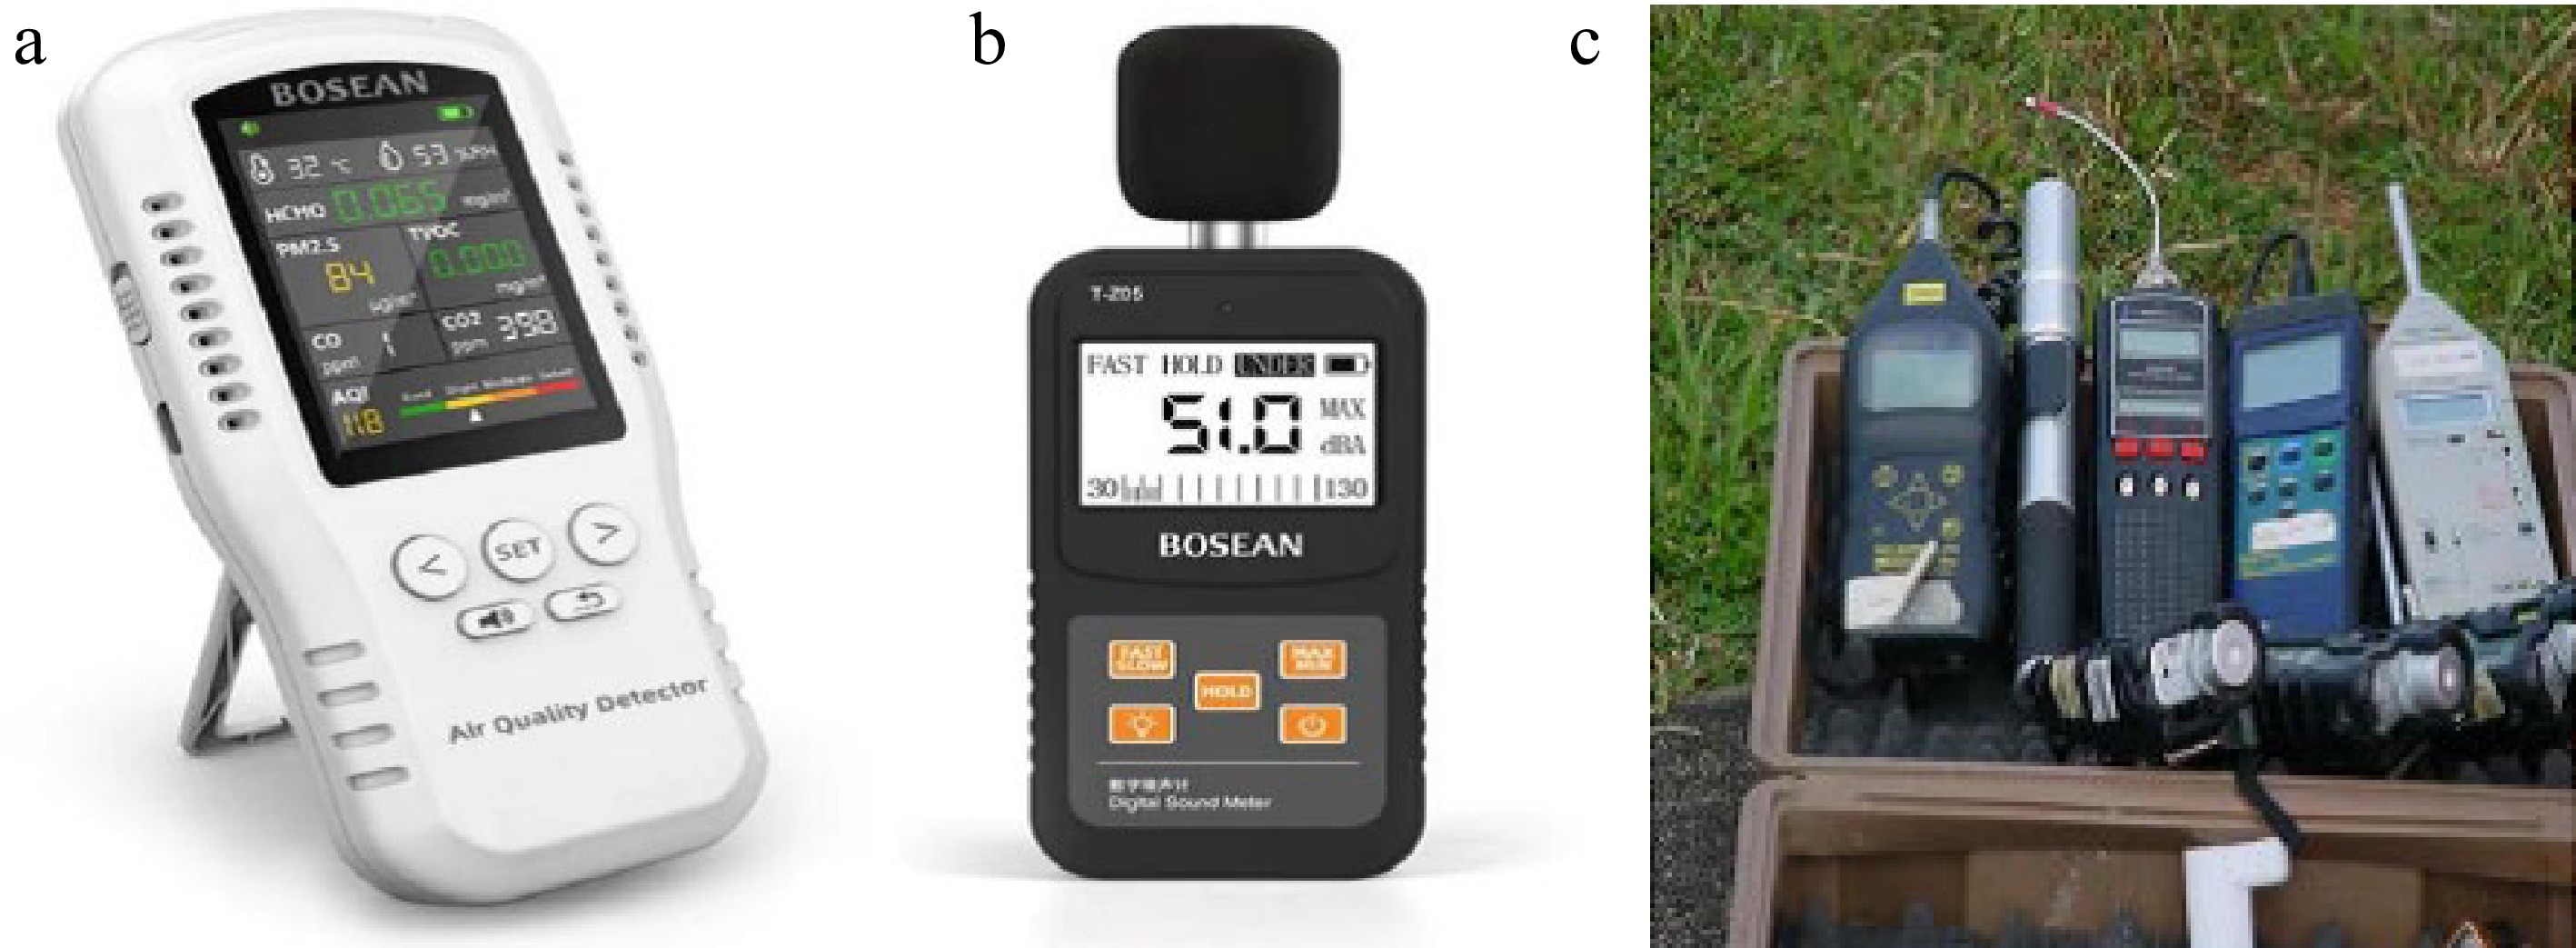
Figure 4.
Bosean. (a) Airborne particulate. (b) Noise level monitor counter. (c) Multigas monitor.
-
Parameters measured to determine air quality in the study area include, sulphur dioxide, nitrogen dioxide, carbon monoxide and suspended particulate matter (SPM), volatile organic carbon (VOC) and so forth, the results and contagion effects are displayed in Fig. 5 and Tables 3 & 4. SPM are particles ranging from aggregates of a few molecules to pieces of dust readily visible to the eyes, which are found in the atmosphere. The particles (dust, smoke and other aerosols) may be of anthropogenic and/or natural origin. The most significant of these are the particles of less than 10 μm in diameter, usually referred to as PM10.
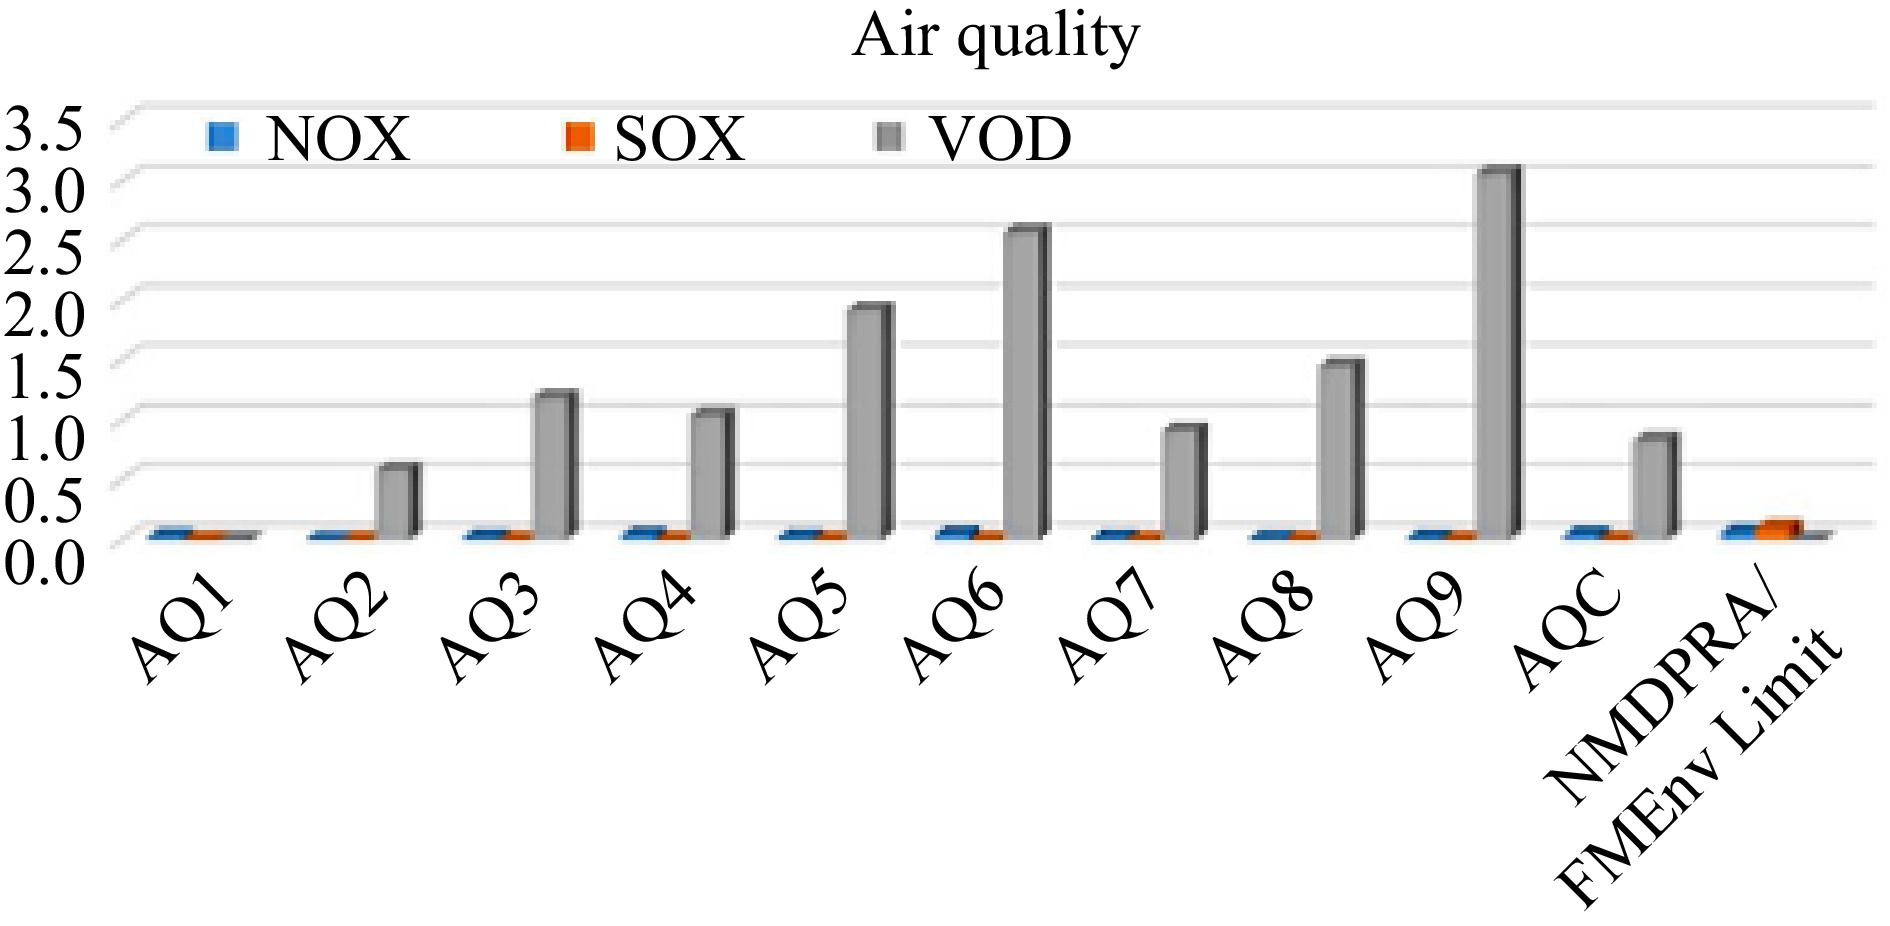
Figure 5.
Comparison of VOC, NO2 and SO2 concentrations with regulatory standards.
Table 3. Some contagions and effects.
Contagions Health impacts Short term Long term Ethylbenzene Dizziness, eye and throat irritation Blood disorders Benzene Skin blister and irritation, upper respiratory tract Developmental and reproductive disorders n-Hexane Headache, giddiness and nausea. Blurred vision, fatigue, extremities and headaches
Birth defectsToluene Sleep difficulty, dizziness, skin and eyes irritation Nervous system disorder Xylenes Nose, gastric and throat irritation, neurological, vomiting and nausea Table 4. Outcome of ambient air and noise quality at Delta state.
Parameter Unit NMDPRA/
FMEnv LimitSites Limit (%) A1 A2 A3 A4 A5 Within Not Ambient temp °C 30 31.7 32.4 33.2 32.8 30.7 0 100 Wind velocity m/s N/A 2 1.8 1.5 1.9 1.7 − − Wind direction N/A SW SW SW SW SW − − Atm. pressure hPa N/A 1,011 1,011 1,012 1,011 1,011 − − Rel. humidity % N/A 72.4 67.2 64.1 66.5 76.9 − − Noise level dBA 80−100 58.7 62.8 52.0 50.5 53.7 100 0 SPM μg/m3 90/250 69.8 72.7 81.4 70.1 85.4 100 0 NOx ppm 0.04−0.06 0.026 < 0.001 0.018 0.035 0.02 100 0 SOx ppm 0.01 0 0 0 0 0 − − CO2 ppm 425 289 296 320 288 279 100 0 CO ppm 0.03 2 1.65 0.38 1.24 1.96 0 100 H2S ppm 0.008 0.01 0.01 0.01 0.01 0.01 0 100 VOC ppm 8.53 0.75 0.58 1.19 1.04 1.92 100 0 Ozone ppm N/A 0.05 0.05 0.06 0.06 0.05 − − NH3 ppm No limit < 0.001 < 0.001 < 0.001 < 0.001 < 0.001 − − CH4 ppm 250 < 0.001 < 0.001 < 0.001 < 0.001 < 0.001 − − These smaller particles have greater tendency to scatter light and are mostly inhaled into the lungs[21, 25]. Exposure to these particles may result in respiratory disorders and susceptibility to respiratory infections. The SPM levels in the study ranges from 69.8–85.4 μg/m3 for PM10. The values obtained in the current study were below FMEnv and NMDPRA limit of 250 and 90 μg/m3 respectively. Hydrogen sulphide (H2S) is a toxic, odorous and corrosive gas, which is rapidly oxidized to sulphur dioxide (SO2) in the atmosphere[3, 7]. Anthropogenic sources include hydrocarbon storage tanks and process vents. Exposure to concentrations in excess of 0.01 ppm can be fatal, the value observed for this research was nil. Volatile Organic Compound (VOC) such as methane (CH4), ethane (C2H4), propane (C3H8), and other derivates of aliphatic and aromatic organic compounds are emitted from man-made and natural sources (fugive emissions, emissions from vents and incomplete combustion of fuels), particularly where fuel to air ratio is high. Most members of the group are significantly toxic, and exposure to high concentrations (> 8.53) could interfere with oxygen intake[29] and cause acute leukaemia. VOC concentration in the study region ranged from 0.58–0.58 ppm.
Nitrogen dioxide (NO2) is a member of the family of highly reactive gases called nitrogen oxides or oxides of nitrogen. Together with hydrocarbons, oxides of nitrogen are the basic chemical constituents in photochemical reactions leading to formation of ground-level ozone and smog which directly impact human health. Nitrogen dioxide like other members of the oxides of nitrogen family is a strong oxidizing agent that reacts with air and water to form nitric acid as well as toxic organic nitrates. Anthropogenic emissions of NO2 such as fuel combustion at high temperatures from motor exhaust have been reported to cause adverse health effects including pulmonary diseases[10, 19]. Nitrogen dioxide recorded in the study region below 0.001 ppm.
Oxides of sulphur are components of trace gases and aerosols occurring in gaseous and particulate forms which include sulphur monoxide, sulphur dioxide and sulphur trioxide. Sulphur oxide have both natural (sea-salt, volcanic emissions) and anthropogenic (biomass burning, industrial combustions) sources. Sulphur oxides have been observed to cause a wide variety of health and environmental impacts as they react with other substances in the atmosphere to form acid rain. It has been reported to affect the cardio respiratory system, causing respiratory irritation, broncho-constriction and several cardiovascular abnormalities[21, 26]. Exposure to above 0.01 ppm is considered immediately dangerous to life and health. SO2 was not detected in this research. Carbon monocide (CO) is an atmospheric pollution that is generally formed from incomplete combustion of fossil fuels (gas, oil, coal and wood). Natural sources of CO include volcanoes, wildfires and man-made fires. CO is colourless and odourless but highly toxic. It displaces oxygen from oxyhaemoglobin to produce carbon haemoglobin causing suffocation[1, 6] and can be fatal at concentrations above 0.03 ppm or 12–17 ppm for 8 h[30]. Prolonged exposure to CO concentration of 200 ppm and 800 ppm for about 45 min to 3 h may result in severe headache, dizziness, nausea and convulsion. All CO values measured above the limit tolerated, ranging from 0.38–2.00 ppm. Noise is usually sound that bears no information and whose intensity usually varies randomly over time. Noise is often used to mean unpleasant sound, which interferes with human hearing and is likely to be physiologically harmful. The use of ear-protectors is mandatory in areas where noise levels are 90 dBA or above. Noise measurements from all the sampling stations ranged from 51.5 dBA to 69.8 dBA, which is within NMDPRA as well as FMEnv limit of 90 dB (A) for an 8 man-h exposure.
Outcome of water physico-chemistry
-
The outcomes of physico-chemical variables obtained from groundwater within the project region (Table 5 & Fig. 6) indicated that the conductivity (1,094.0, 1,695.0 and 1,695.1 mg/l), Calcium (109.1, 108.9 and 109.2 mg/l), Ammonia (0.48, 0.47 and 0.49 mg/l), DO (2.07, 2.06 and 2.07 mg/l) and total dissolved solid (847.2, 847.4 and 847.3 mg/l)) values were high, indicating freshwater aquifer. The turbidity values (1.00–1.13 NTU) reveal that all the sampled boreholes were well within the standard for hygienic water criterion of 5 NTU. The pH values displayed neutral measurements due to the bicarbonate quantity with values within 30.0–500.0 mg/l CaCO3 WHO limit. The carbonate alkalinity perceived in the sampling was very low. TD values of the groundwater samplings vary between 51.8 mg/L CaCO3 as well as 48.6 mg/L CaCO3. Discrepancy between the TD values for the boreholes was awfully low, signifying recharge from the equivalent origin. Hardness in water encompasses calcium plus magnesium as the key constituents. For instance, magnesium ions quantified in the groundwater varied from 39.7–39.8 mg/L respectively, Small phosphate, chloride, and sulphate amounts were seen in groundwater samplings compared to the WHO limits. Likewise, small anions quantities substantiate the airiness of groundwater from the research site. Sulphide and Nitrate ions were not perceived in the groundwater sampling. Oil and grease (O&G) were not detected within the facility area, two of the sample points were below instrument detection limit. Total hydrocarbon was not detected in the ground water samplings of the project influence zone. The origin can, however, be ascribed to biogenic instead of anthropogenic involvement since petroleum hydrocarbon correlated deeds was not seen in the region during this period of research.
Table 5. Outcome of water attributes.
Variables Unit Sites Limits Compliant status (%) 1 2 3 FEPA WHO USEPA NIS EU Compliant Non-within pH 7.08 7.09 7.07 6.5−8.5 6.5−8.5 100 0 Conductivity µs/cm 1,694.9 1,695.0 1,695.1 1,000 − 1,000 1,000 2,500 0 100 Calcium mg/l 109.1 108.9 109.2 − 75 0 100 Phosphate mg/l 1.01 1.00 1.00 < 5.0 − − NS − 100 0 Ammonia mg/l 0.48 0.47 0.49 0.05 0 100 TSS mg/l 0.09 0.08 0.10 < 10 − − NS − 100 0 Temperature °C 25.4 25.5 25.3 Ambient 100 0 Turbidity NTU 0.01 0.02 0.01 5 5 5 5 − 100 0 Total acidity mg/l 61.4 61.3 61.4 NS − TDS mg/l 847.2 847.4 847.3 500 − 500 500 − 0 100 Total hardness mg/l 272.4 272.3 272.4 200 80-100 − 150 − 0 100 Total alkalinity mg/l 408.4 408.2 408.3 − − − 200 − 0 100 Total solids mg/l 1,039.9 1,040.2 1,040.3 NS − Magnesium mg/l 39.8 39.7 39.8 20 0 100 Sodium mg/l 10.7 10.8 10.6 200 100 0 Chloride mg/l 26.8 26.9 26.7 250 250 250 250 250 100 0 DO mg/l 2.07 2.06 2.07 2 0 100 Nitrite mg/l 0.13 0.14 0.12 0.2 100 0 Manganese mg/l 0.23 0.22 0.21 0.2 0 100 Total iron mg/l < 0.01 < 0.01 < 0.01 0.3 100 0 Sulphate mg/l 50.2 50.3 50.1 500 250 250 250 250 100 0 Silica mg/l 3.93 3.94 3.92 40 100 0 Salinity % 0.09 0.08 0.07 NS − Nitrate mg/l <0.01 <0.01 <0.01 50 50 50 50 50 100 0 Total oil/grease mg/l 0.08 0.09 0.10 10 100 0 Colour TCU 15 100 0 Appearance Colourless Colourless Odour Objectionable Unobjectionable Taste Objectionable Unobjectionable 
Figure 6.
Water attribute scrutiny outcome for: (a) DO, (b) BOD, (c) calcium and (d) TSS.
Outcome of sediment physico-chemistry
-
The outcome of physicochemical parameters observed is displayed in Fig. 7 and Table 6 which signifies that pH values obtained for sediment ranged from 7.47 to 7.92, while electrical conductivity values observed varied between 0.61 and 0.87 with mean value of 0.74 mS. For nutrient status, the mean concentrations of chloride, sulphate, phosphate, ammonium, nitrate, and nitrate were 201.06, 9.61, 1.57, 0.95, 0.29 and 1.75 mg/l respectively. Likewise exchangeable cations that are essential for optimal primary and secondary productivity in aquatic ecosystems such as sodium (Na), potassium (K), calcium (Ca) and magnesium (Mg) in sediments samples were 37.35 to 53.27 mg/l, 11.82 to 16.86 mg/l, 65.86 to 93.93 mg/l and 16.91 to 24.23 mg/l respectively.
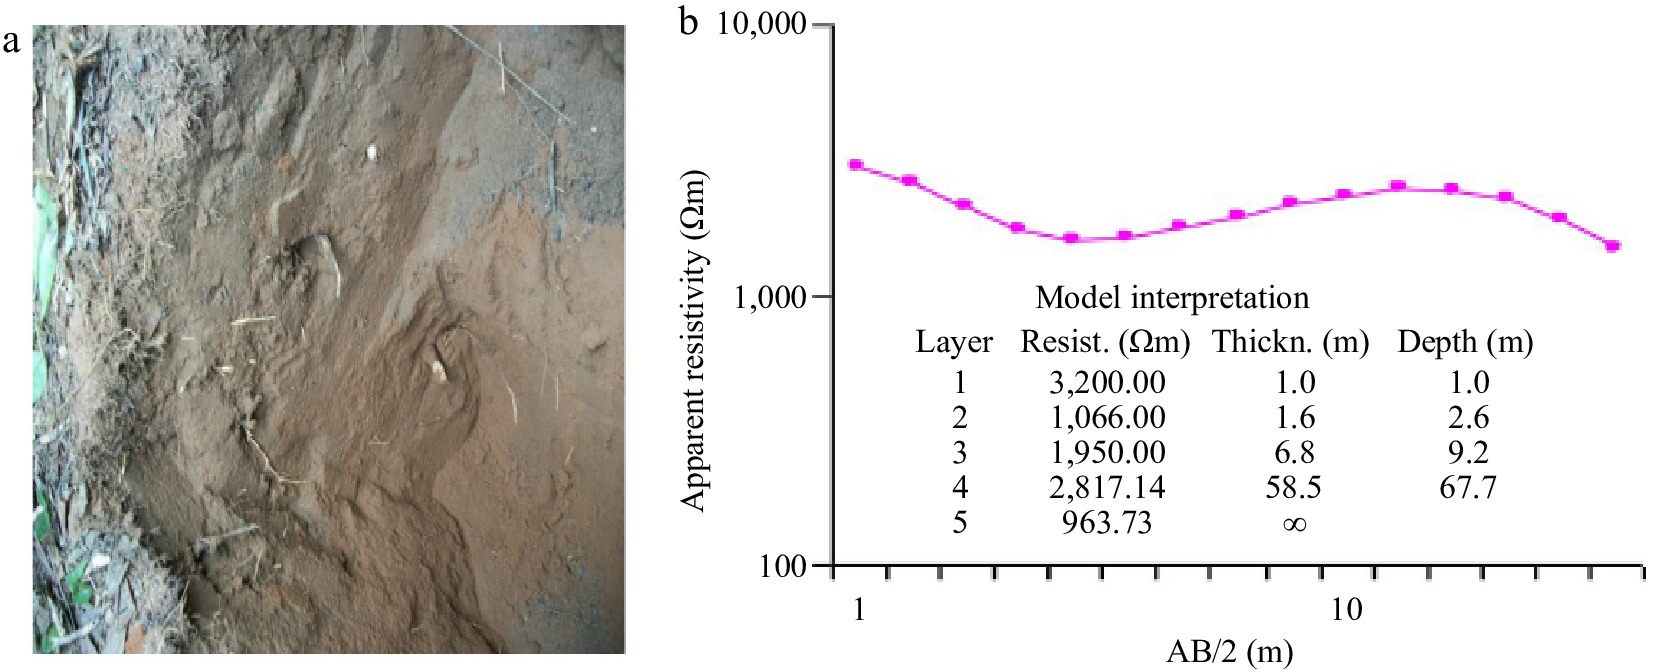
Figure 7.
(a) Friable poorly sorted loose sandy-silt (0.05–0.002) with moderately frequent roots inclusions and, (b) response PNG-VES data for environmental geophysical investigation.
Table 6. Outcome of physicochemical characteristics of sediments within the study vicinity.
Parameter Unit Site 1 Site 2 Site 3 Mean Limit EC mS 0.87 0.63 0.74 0.74 pH 7.47 7.90 8.21 7.87 6−9 TOC % 2.12 1.72 2.39 2.08 R/POL mV −167.8 −181.2 −298.8 −215.93 Salinity Psu 0.04 0.03 0.04 0.04 Cl mg/kg 236.38 165.74 201.06 201.07 100 CO3 mg/kg < 0.01 < 0.01 < 0.01 < 0.01 T/N % 0.09 0.06 0.08 0.08 10 PO4 mg/kg 1.84 1.29 1.58 1.59 SO4 mg/kg 11.30 7.93 9.61 9.62 100 NO3 mg/kg 2.11 1.48 1.65 1.76 NO2 mg/kg 0.35 0.25 0.27 0.28 NH4 mg/kg 1.15 0.81 0.90 0.95 Na mg/kg 53.27 37.35 45.31 45.31 K mg/kg 16.87 11.82 14.33 14.34 Ca mg/kg 93.93 65.87 79.70 79.71 Mg mg/kg 24.23 16.99 20.61 20.62 1.0 THC mg/kg < 0.01 < 0.01 < 0.01 < 0.01 TPH mg/kg < 0.001 < 0.001 < 0.001 < 0.001 BTEX mg/kg < 0.001 < 0.001 < 0.001 < 0.001 Phenol mg/kg < 0.001 < 0.001 < 0.001 < 0.001 PAH mg/kg < 0.001 < 0.001 < 0.001 < 0.001 THB cfu/g 5.78 4.74 5.12 5.22 THP cfu/g 1.56 1.28 1.38 1.41 HUB cfu/g 2.83 2.33 2.54 2.56 HUF cfu/g 0.65 0.54 0.58 0.59 Fe mg/kg 506.69 355.26 130.97 330.98 1.0 SKB cfu/g 1.97 1.6 1.74 1.78 Cu mg/kg < 0.001 < 0.001 < 0.001 < 0.001 Cr mg/kg 0.64 0.45 < 0.001 0.25 Pb mg/kg 0.12 0.09 < 0.001 0.10 Cu mg/kg 92.68 50.96 61.82 68.50 1.0 Ni mg/kg 4.82 3.45 < 0.001 4.14 V mg/kg < 0.001 < 0.001 < 0.001 < 0.001 Zn mg/kg 265.62 186.24 37.23 163.03 5.0 Hg mg/kg < 0.001 < 0.001 < 0.001 < 0.001 Ba mg/kg < 0.001 < 0.001 < 0.001 < 0.001 Clearly the results shows that parameters such as chlorine, ammonia, iron, copper, zinc and magnesium have extreme values that are above the recommended values by the regulatory authorities, which indicates a negative impact on the environment and the populace.
Total Hydrocarbon Content (THC) describes hydrocarbon content in sediment, Total Petroleum Hydrocarbon (TPH) and BTEX was below the equipment detection limit of 0.01. The complexes and forms in which different metals occur in sediments have a profound effect on their bioavailability and toxicity to aquatic organisms. Most metals in solid, stable forms in sediments are derived from natural weathering, erosion and surface runoff. However, anthropogenic inputs from such sources as mine tailings, dredged material and oil well drilling may be important locally. More important sources of metals in sediments are physical and chemical reactions taking place in the water column. Metals introduced in soluble or colloidal forms into estuarine and coastal waters tend to either precipitate or adsorb to suspended particulate and colloidal or dissolved organic matter. These precipitate, adsorbed or complex metals may be deposited in a more or less labile, bioavailable form in surficial sediments[10, 18].
Outcome of soil characteristics
-
Table 7, Figs 7 and 8 display the outcome of analysis carried out on a total of eight samples collected, profiled at surface and sub-surface depths of 0–15 cm and 15–30 cm respectively. The soil and its components are essential resources to human life. It influences the distribution of plant species and provides a habitat for a wide range of organisms. However, the pressure due to population growth has made these resources scarce and resulted in its abuse in many parts of the world. Therefore, proper allocation of this resource based on its capability necessitates detailed soil studies.
Table 7. Outcome of soil properties within the study vicinity.
Parameters Unit Sites 1 2 3 4 5 6 7 8 Limit Sand % 41.2 34.7 46.3 41.1 86.4 86.3 37.3 33.8 Silt % 37.3 40.9 36.8 37.5 6.8 6.3 43.1 42.7 Loam % 21.4 24.4 17.7 21.4 4.8 7.4 19.6 23.3 pH 6.9 7.55 6.22 6.12 6.01 5.99 5.76 6.00 6.5−8.5 EC mS 0.17 0.09 0.08 0.06 0.05 0.01 0.09 0.07 TOC % 2.87 2.38 2.64 2.16 0.64 0.47 3.05 2.47 T/N % 0.07 0.06 0.06 0.05 0.01 0.01 0.07 0.06 NO3 mg/kg 13.34 7.07 6.27 4.70 3.92 2.35 7.12 4.66 NO2 mg/kg 1.82 0.91 0.79 0.59 0.49 0.30 0.92 0.58 NH4 mg/kg 6.94 3.58 3.11 2.33 1.94 11.7 3.55 2.38 Na mg/kg 5.71 2.96 2.62 1.97 0.84 0.50 3.02 1.97 28.0 K mg/kg 1.34 0.67 0.58 0.44 0.36 0.22 0.71 0.45 0.05 Ca mg/kg 13.8 7.28 6.45 4.84 1.03 0.62 7.31 4.85 Mg mg/kg 44.49 23.40 20.78 15.38 6.99 4.19 23.55 15.60 THB cfu/g 5.46 3.51 5.04 3.25 1.36 0.97 5.80 3.72 THF cfu/g 1.47 0.95 1.36 0.87 0.37 NO 1.36 1.08 HUB cfu/g 2.68 1.72 2.47 1.59 0.67 0.48 2.84 1.82 HUF cfu/g 0.61 0.39 0.67 0.37 NO NO 0.65 0.43 Fe mg/kg 1142 864.5 1719 1214 74 52.03 265.5 311 1.0 Cd mg/kg < 0.001 < 0.001 < 0.067 < 0.058 < 0.001 < 0.001 < 0.001 < 0.001 Cr mg/kg 2.48 1.96 2.30 1.57 < 0.001 < 0.001 2.78 2.32 Pb mg/kg <0 .001 < 0.001 < 0.001 < 0.001 < 0.001 < 0.001 < 0.001 < 0.001 Cu mg/kg 1.68 0.49 0.82 0.78 1.37 1.05 0.58 1.47 0.01 N mg/kg 3.83 2.96 2.19 1.76 < 0.001 < 0.001 < 0.001 < 0.001 V mg/kg < 0.001 < 0.001 < 0.001 < 0.001 < 0.001 < 0.001 < 0.001 < 0.001 Zn mg/kg 3.83 2.65 3.43 2.47 0.27 0.17 3.90 3.21 0.1 Texture Loam Loam Loam Loam Loam Loam Loam Loam 
Figure 8.
Delta soil contents in borehole log.
However, parameters such as Iron, Zinc, potassium and copper were above their prescribed limits as stated in Guidelines for Noise, Industrial Effluent, and Gaseous Emissions Limitations[31]. A pH of between 5.76–7.55 indicates that the sample is moderately acidic and also within the stipulated regulatory limit of 6.5–8.5 (Tables 6 & 7). Microbial analysis was also carried out on the raw water sample and the result for Salmonella was negative. Wastewater (effluent) from the region encompasses depot operations which arises from mixture of minor spills and water as well as wastewater from the laboratory, kitchen, equipment maintenance etc. can impact negatively on the environment if discharged directly to public drains without treatment. The contagions in such wastewater might encompass soluble macrobiotic chemicals creating exhaustion of heavy metals, DO, suspended solids plus volatile materials, hydrocarbons, bases or acids (displayed as small or high pH). Though some depot’s installed OWS works to skim out the oil from the water and ensure it is tested and treated before discharge.
Outcome of conflict analysis and resolution
-
Conflict investigation and its possible resolution are demonstrated in Table 8, Figs 9 and 10. Community consultations, focus group discussion (FGD) and responses from the administered questionnaires indicated that the resident populations are not in any way against oil and gas tank farms and their operations in the host community. Continued fulfillment of promises and terms as contained in MoU is regarded as vital in maintaining and improving the oil and gas companies relations to the host communities. It is important to point out here that, one of the causes of the crises that affected the whole Niger Delta region was attributed to unemployment; although unemployment is becoming a global issue. Often seen are youth delinquency, land dispute, chieftaincy tussle, inter-family problems, inter-village conflict, alcoholism/prostitution. Youth delinquency and unemployment are identified to be among the highest of the social problems in the area corresponding to 35.2% and 20.2% respectively. Also 12.4% (land dispute), 19.55 (alcoholism/prostitution), 3.4% (chieftaincy tussle), 3.7% (inter-family problems) and 5.6% (inter-village conflict). From the study region narratives, conflicts and contentious issues are often resolved in the community in conjunction with the traditional head, Council of Elders, Community Management Authority, youth groups and women groups. The rungs of power are many as revealed by the well-organized leadership structures from the family heads, quarter heads, all through the various organs and ends at the feet of His Royal Highness[4, 12−14]. In the case that a community member goes contrary to the law, the issue is handled from the lower organ, youth or womens group and whoever is found guilty pays fines or is punished according to the level of the offence.
Table 8. Weight and height of the populace in the studied community.
Age
(months)Mean weight
(kg)Mean height
(m)Weight for age
(normal range) (kg)0−11 6.72 0.55 3.5−9.5 12−23 9.18 0.77 9.6−12.3 24−35 11.46 0.91 12.6−14.5 36−47 12.61 0.95 14.6−17.5 48−60 13.97 1.03 17.6−19.5 
Figure 9.
Outcome of various conflict issues.
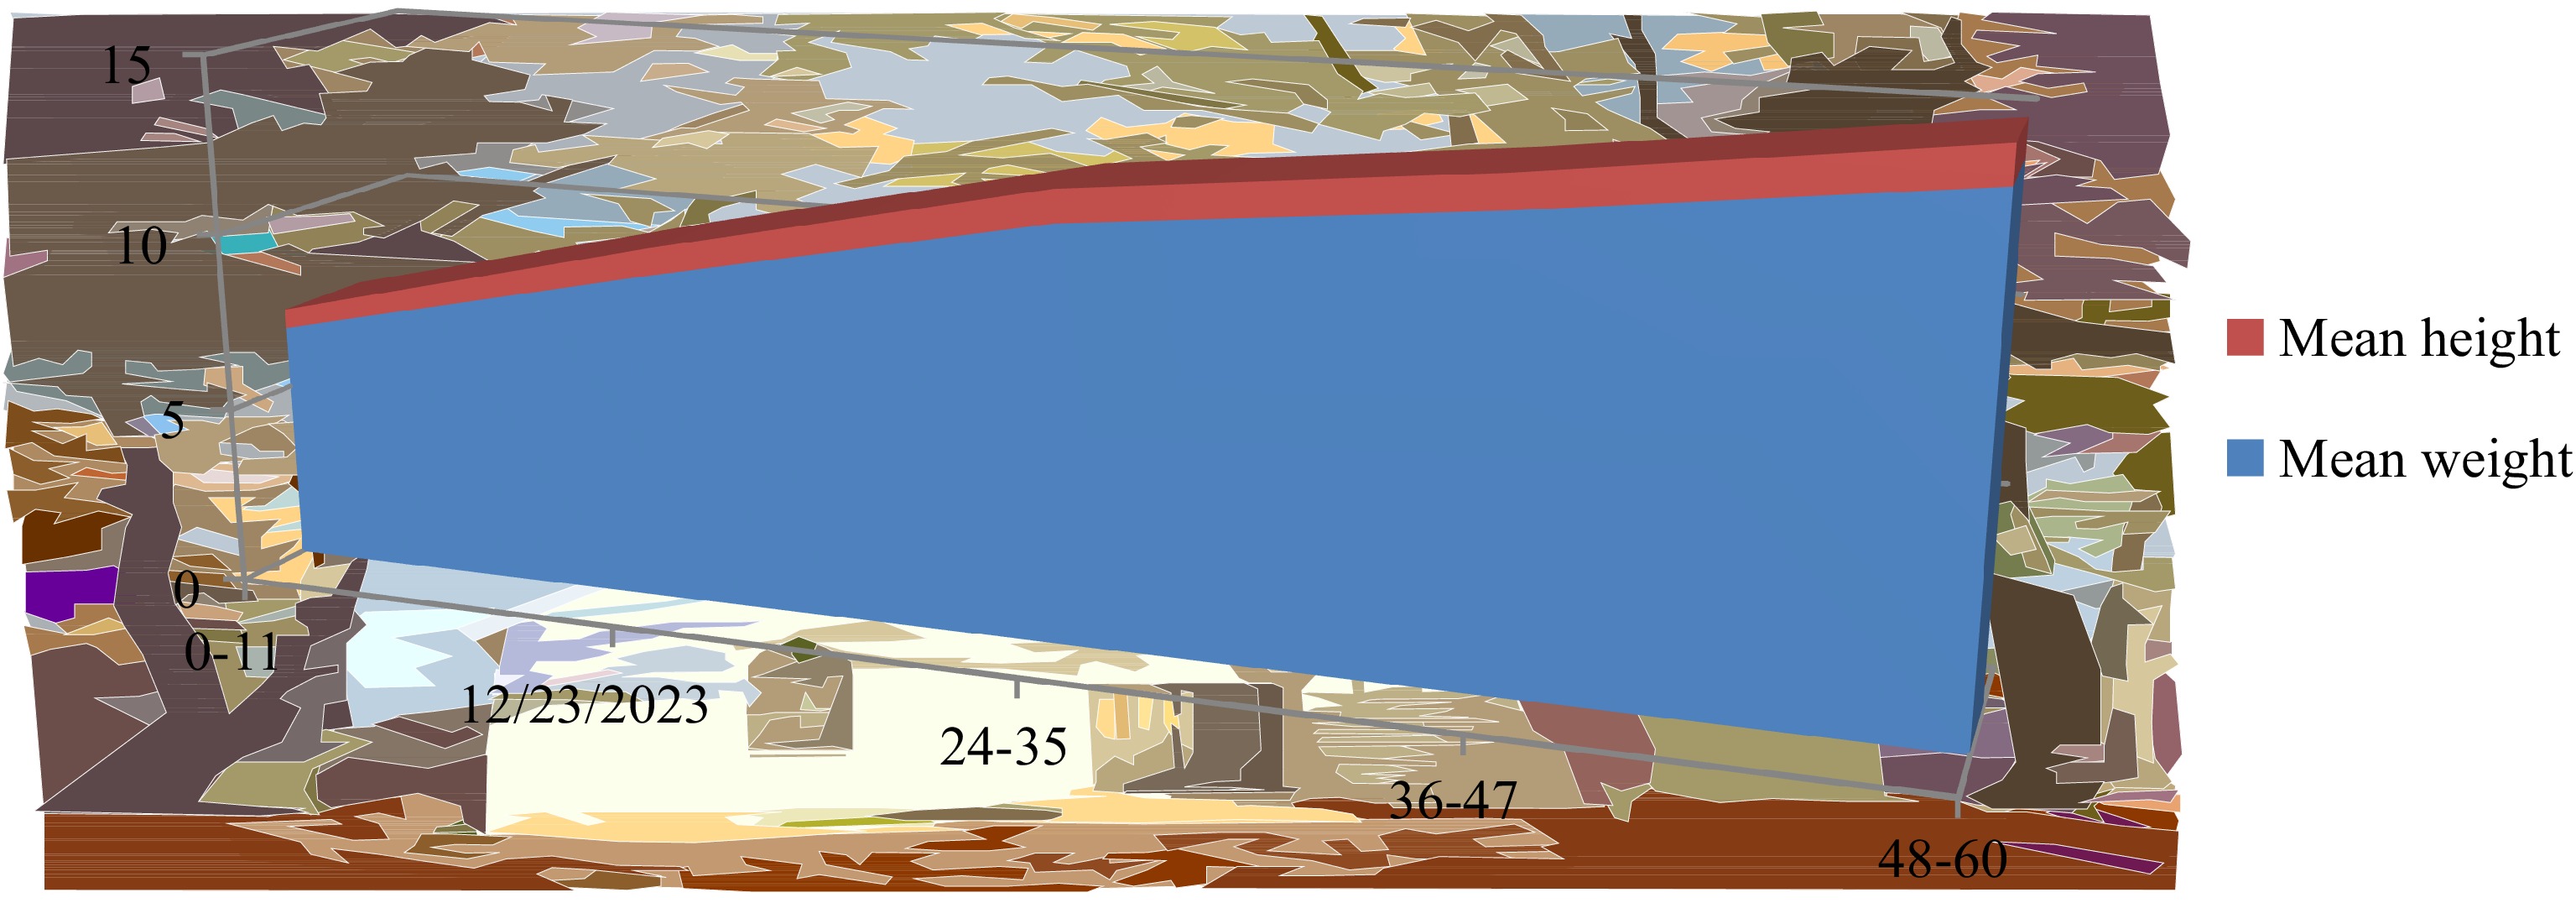
Figure 10.
Graphical displaying of weight and height of the populace in the scrutiny commune.
Agricultural produce and productivity
-
Though agriculture is not the main occupation of the resident population in the scrutiny region owing to oil and gas hazard, about 9.4% respondents are farmers however (Table 9 & Fig. 10). Crops grown in the area are yam, plantain, cassava, oil palm, banana, maize, melon, pepper and vegetables. Agricultural yield within the surveyed community showed reduction over the years and over time oil exploration activities in the area were attributed to the reduction. More so, analysis shows insufficient land 23.2%, inadequate capital 43.4%, poor technology 20.2%, insufficient labour 7.5% and others 5.7% were reasons for lower farm production (Fig. 11).
Table 9. Common medicinal plants and their uses in the region.
Local names Botanical names Medicinal uses Alligator pepper plant Afromomum melegueta Sore throat, malaria,
purgativeBanana plant Musa spp. Fever treatment Lemon orange Citrus aurantium Abdominal upset and a base
for other treating malariaPawpaw leaves Carica papaya Malaria treatment Cashew fruit, leaf & bark Amarcadium occidentale Malaria treatment Guava tree leaves & bark Psidium guajava Treatment of malaria,
diarrhoea & menstrual disorders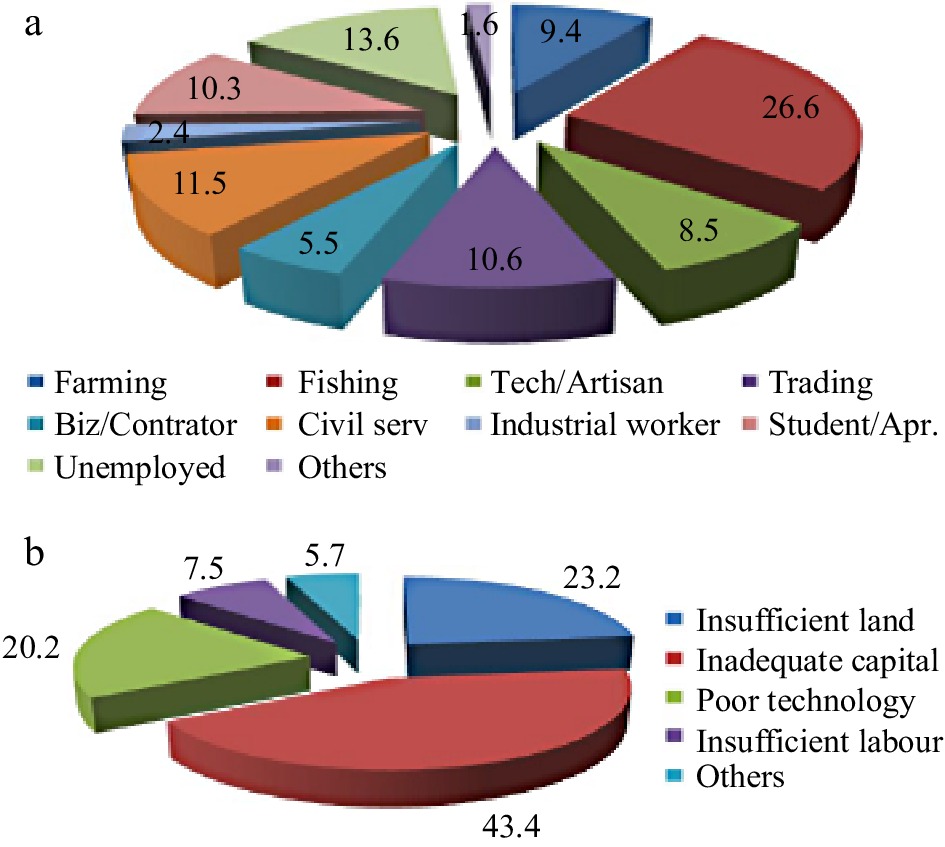
Figure 11.
Respondent (a) occupations and (b) farmer constraints.
Outcome of impact scrutiny
-
Impact analysis on delta inhabitants recognizing the political leadership of the community as the stakeholders which can in one way or another create much relevance in community leadership (Tables 10−12 & Fig. 12). The perceived benefits attached to these positions have made elections into these positions very competitive and fierce, and this has given rise to violent behaviors that breeds bitterness and hostility among community members. The acquisitions of land for various purposes especially for the project site and its operations even though it has been acquired for years may have resulted in a loss of farm land and minimizing sources of fishing, wildlife and forest products. And so, every land acquired for whatever purpose should be adequately compensated to the appropriate individual, family or community. Also in-migrant workforce and oil and gas operations increase the quest for accommodation within the host communities. This leads to competition on local housing, toilet facilities, market, school enrolment, water supply and other basic amenities with its attended increase in natural resource depletion[12−15]. Thus the companies should make effort to recruit and train especially unskilled workforce from the community and its environs, as this can reduce to a large extent the migrant workforce.
Table 10. Monitoring programme for environmental matrices (components).
Environmental components Indicator parameters Frequency Responsibility Soil pH, salinity, heavy metals, TPH etc. Monthly HSE/Regulator Air quality, noise and Vibration SO2, NO2, CO, VOC, particulate etc. Weekly HSE/Regulator Surface/ground water quality pH, nutrients content, BOD, suspended solids, hydrocarbon Monthly HSE/Regulator Vegetation Diversity and abundance of flora and fauna, endangered species Quarterly HSE/Regulator Common health Contagion diseases within the host communities Quarterly Oil & gas medical officer Components Techniques Responsibility Evidence Solid waste Excavation waste should be reused or backfilled. The site should have waste receptacles With bulk storage facilities at convenient Points to prevent littering. Management Presence of well-maintained eceptacles and central collection point. Security Control of secondary businesses
Round the clock security
Adequate lighting and an alarm
System installed at strategic pointsContractor & Management Number of business around the site and level of crime in the region. First Aid Maintaining of well-stocked first aid kit by qualified personnel Management Contents of the first aid kit Table 11. Impacts and proposed mitigation measures.
Environmental Proposed mitigation measures Monitoring indicator Air contagion Control speed and operation of vehicles, prohibit idling of vehicles, spray water on dusty areas. Workers should be provided with dust masks when working in sensitive regions. Amount of dust produced and level Noise contagion Maintain plant equipment Workers to wear ear muffs if working in noisy sections. Noise should be kept within reasonable Amount of noise Soil erosion & compaction Provide soils conservation structures on the areas prone to soil. There should be designated pathways and driveways for movement. Paved and landscaped areas Table 12. Probability trends and impact consequences on the Delta populace.
Consequence Increasing probability A B C D E Severity People Asset damage Environmental
effectReputation Never heard of
in the industryHas occurred in the industry Incident has occurred in Happens several times/year Happens several times/year 0 No injury None None None Low risk 1 Slight injury Slight Slight Slight 2 Minor injury Minor Minor Limited 3 Major Injury Localised Localised Considerable Medim risk 4 Single fatality Major Major National 5 Multiple fatalities Extensive Massive International High risk 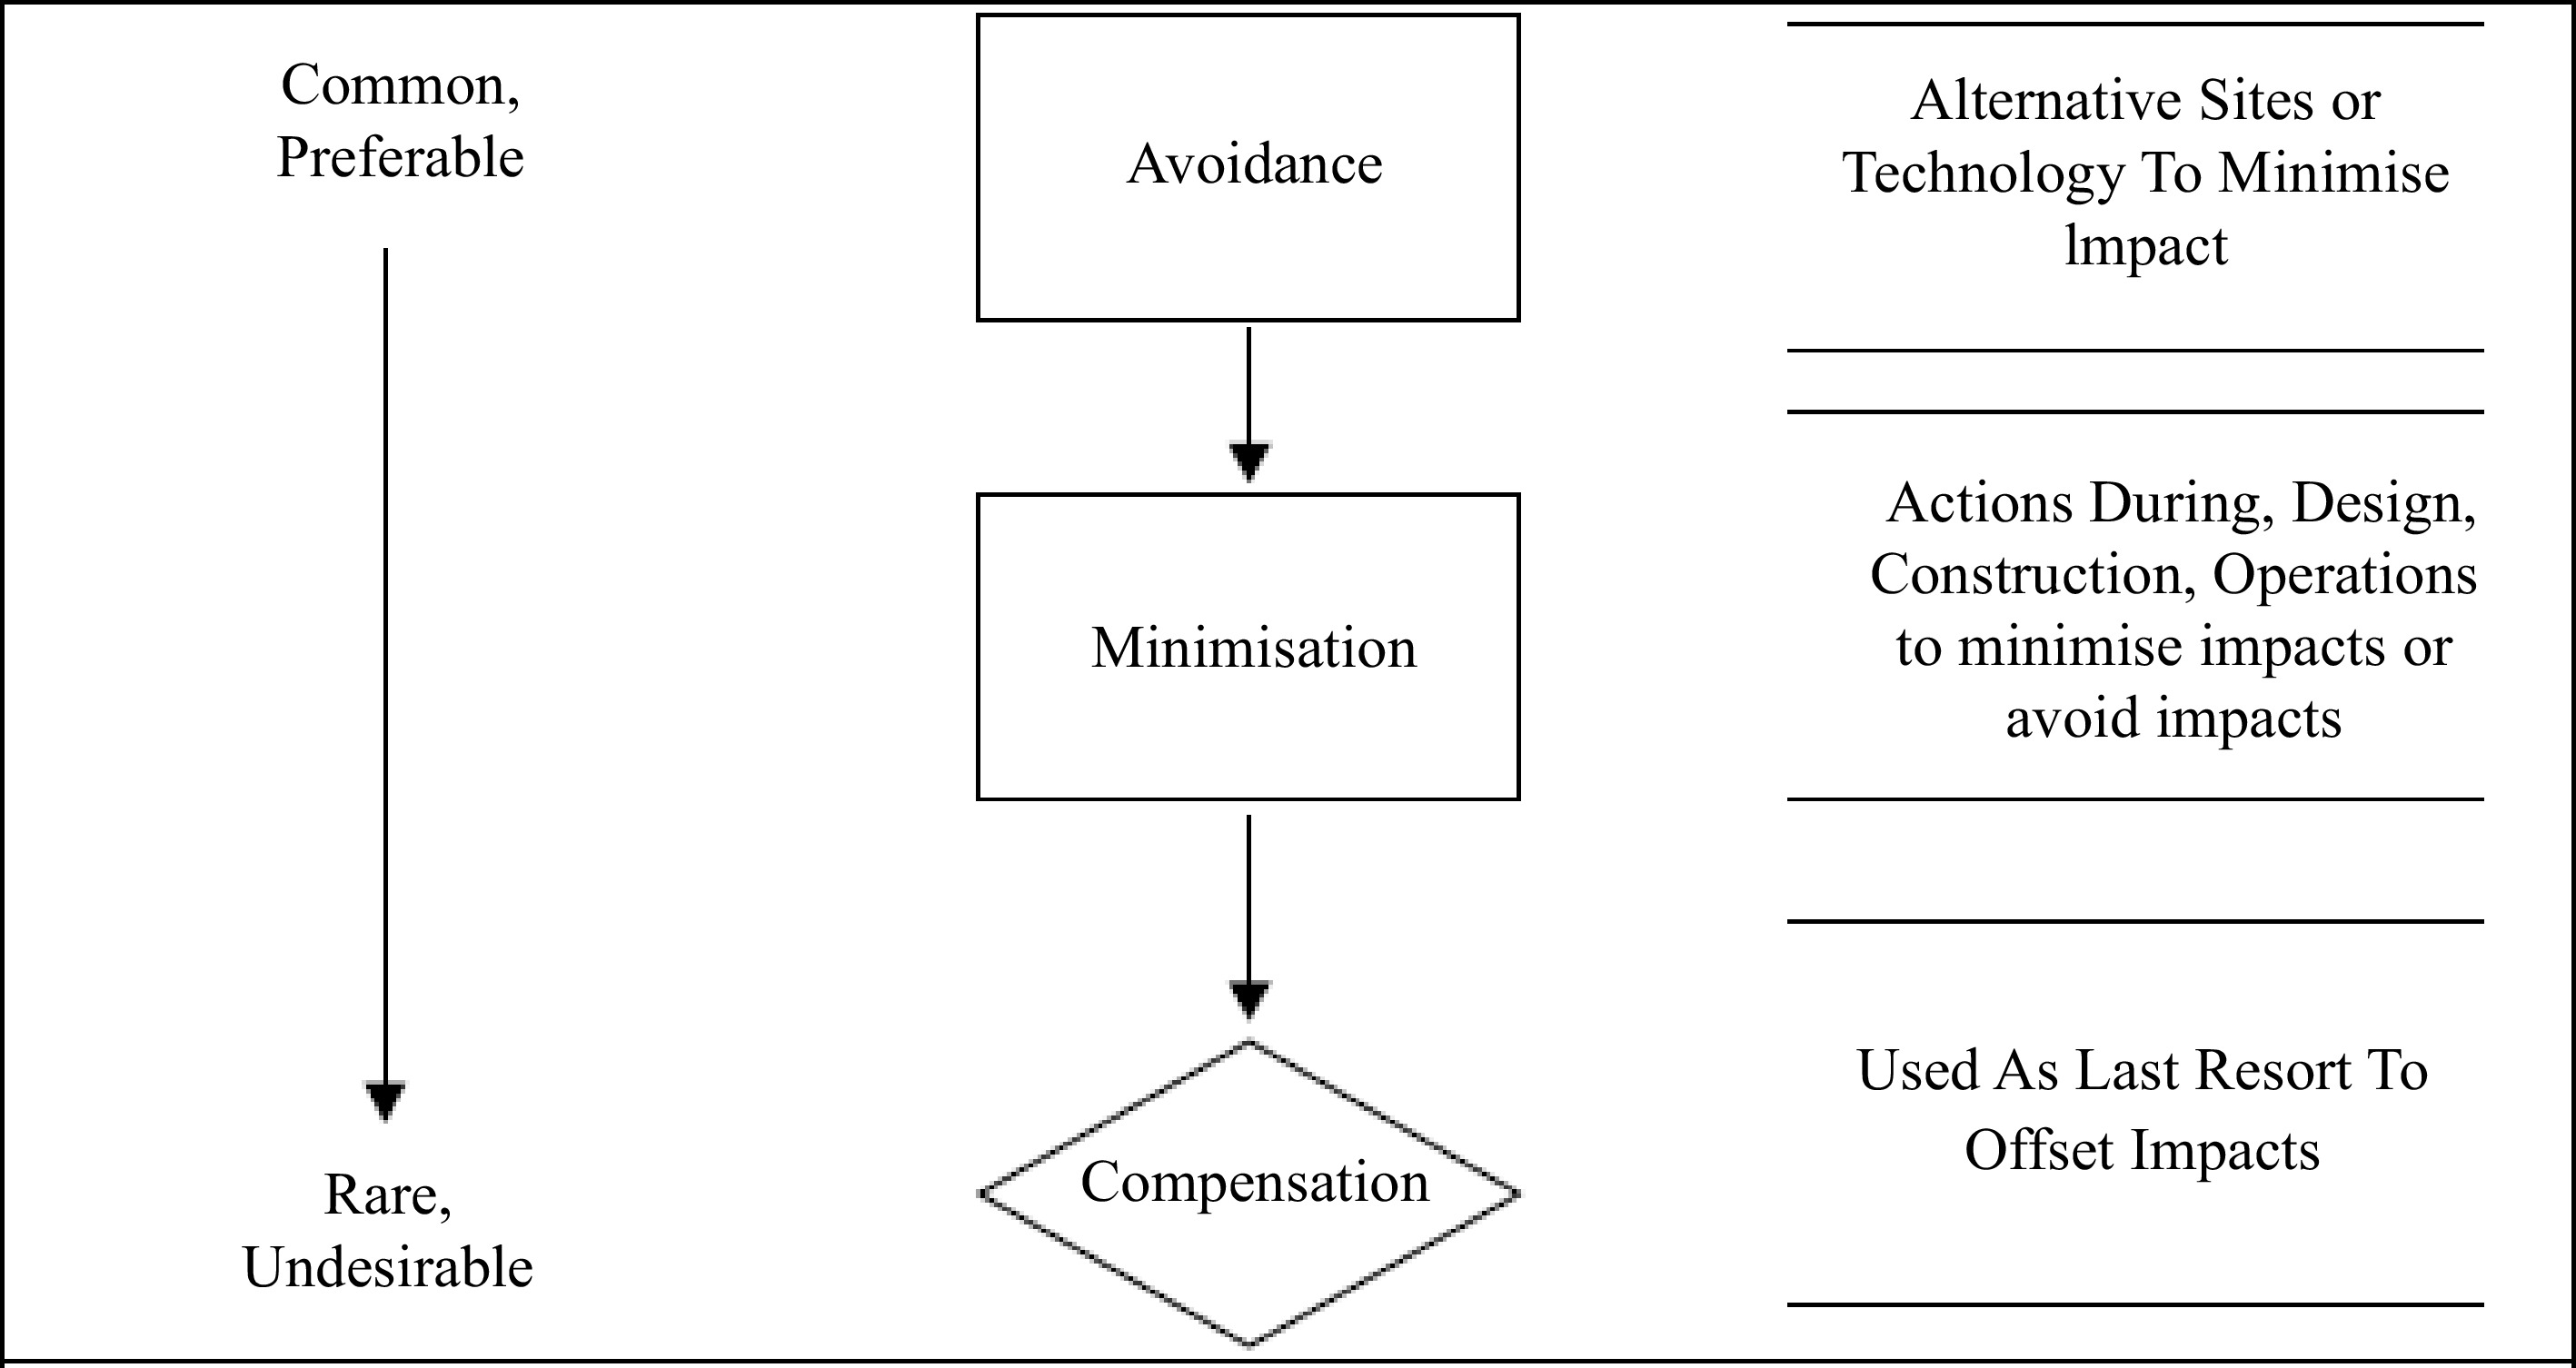
Figure 12.
Outcome of mitigation fundamentals for Delta.
Outcome of health management, projection and mitigation
-
Most of the villages where oil and gas tank farms are don't have good health care but depend on herbal medicine practices or go to other towns for their health care issues. Some medicinal plants abound in the area, their uses and health management are given in Table 9. Generally, where a structure is already on ground, the chances for impact aversion are constricted and the main issue is how to curtail and reimburse for inevitable impacts. Conversely, these dissimilarities are not inflexible and chances for artistic mitigation must be determined at all phases of assessment and task management. The rudiments of mitigation are structured into a hierarchy of deeds (Fig. 8) based on the principle of avoidance, minimize/reduce, remedy and/or compensate namely: Circumvent helpful impacts as far as possible via use of precautionary actions; curtail undesirable impacts to ‘as low as convincingly practicable’ (ALARP) states. Likewise, main ethics for the usage of mitigation must be unswerving and to include: preference to avoidance together with preventive measures; choose realistic substitutes for the proposal as well as ascertain the preeminent practicable ecosystem preference; spot outmodified measures to lessen each of the key impacts envisaged; appropriate environment reverberation and cheap; and use reimbursement or curative measures as a final remedy[2, 10].
-
The analytical results for soil, surface and ground water compared favourably with regulatory limits. The results obtained for aquatic studies indicated abundances in relation to the nutrients and chemical composition of the ecosystems. This generally implies that, the existing tank farm and the associated facilities have minimal negative impacts on the biophysical environment.
The outcomes flaunt that the presence and concentration of Nitrogen -iv- oxide (NO2) were less than 0.01 ppm thus within stipulated limit of 0.113 ppm, whereas 100% CO and 30% of CO2 measured was above regulatory limits. Prolonged exposure to CO concentration of (200 and 800 ppm) for about 45 min to 3 h may result in severe headache, dizziness, nausea and convulsion. All CO values measured above the tolerated limit, ranging from 0.38–2.00 ppm, while total hydrocarbon content (THC), total petroleum hydrocarbon (TPH) and BTEX was below the equipment detection limit of 0.01. Mitigation and enhancement measures were proffered to ensure that the operations of the tank farm continue in an environmental friendly and suitable manner.
-
The authors confirm contribution to the paper as follows: study conception and design: Igibah CE, Agashua LO, Ufuah E; data collection: Ilaboya IR, Iyeke SD; analysis and interpretation of results: Igibah CE, Agashua LO, Ilaboya IR; draft manuscript preparation: Igibah CE, Agashua LO, Iyeke SD. All authors reviewed the results and approved the final version of the manuscript.
-
All data generated or analyzed during this study are included in this published article.
-
The authors declare that they have no conflict of interest.
- Copyright: © 2023 by the author(s). Published by Maximum Academic Press on behalf of Nanjing Tech University. This article is an open access article distributed under Creative Commons Attribution License (CC BY 4.0), visit https://creativecommons.org/licenses/by/4.0/.
-
About this article
Cite this article
Igibah CE, Ilaboya IR, Iyeke SD, Ufuah E, Agashua OL. 2023. Deleterious impacts of tank farms on Delta neighbourhoods: mitigation and environmental matrices. Emergency Management Science and Technology 3:20 doi: 10.48130/EMST-2023-0020 

Deleterious impacts of tank farms on Delta neighbourhoods: mitigation and environmental matrices
- Received: 10 August 2023
- Accepted: 06 December 2023
- Published online: 26 December 2023
Abstract: The magnitude of the identified impacts of the ongoing activities of tank farms on climate, air, water, soils, vegetation, waste management, socio-economic and health were rated and the results indicated that the facilities have minimal negative impacts on the recipient environment. Results display that SPM levels in the study range from 69.8–85.4 μg/m3 for PM10, while CO and H2S were both 100% not within regulatory limits, consequently leading to asthma, coughing and breathing difficulties. Besides, H2S is corrosive gas, which is rapidly oxidized to sulphur dioxide (SO2) in the atmosphere, whereas sulphur oxides have been observed to cause a wide variety of health and environmental impacts as they react with other substances in the atmosphere to form acid rain, then affect cardio respiratory system, causing respiratory irritation, broncho-constriction and several cardiovascular abnormalities. Based on age, the greatest impact (53%) was seen in ages varying from 0 to 16 while that of the age set 16 to 60 was 47%. Curb of oil and gas particulate pollutants and requesting a buffer region between the tank farms and neighborhood complemented with regulatory enforcement and persistent monitoring, should be top precedence for the regulatory authority.
-
Key words:
- Impact /
- Oil and gas /
- Farm tank /
- Emission /
- Delta.