


-
Adipic acid is a basic raw material to produce chemical products such as chemical fiber, nylon 66 and engineering plastics, and is widely used in the pharmaceutical, food and chemical industries. The synthesis of adipic acid by oxidation of cyclohexene with hydrogen peroxide (H2O2) catalyzed by sodium tungstate (Na2WO4) is a common green synthesis process of adipic acid, as shown in Fig. 1[1−3]. Since H2O2 is easy to decompose and exothermic and the high exothermic amount of this reaction can easily lead to thermal runaway of the reaction[4], improvements in the safety of the process is of great significance for the popularization and application of this green process.
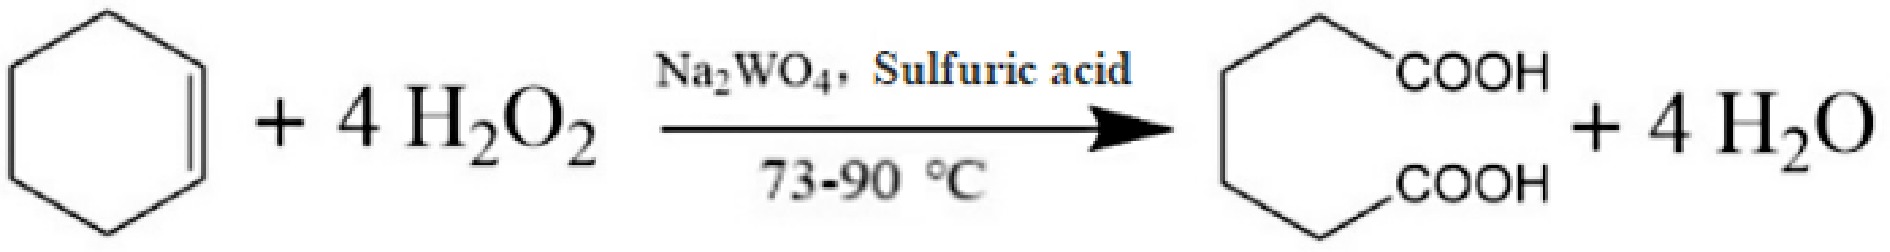
Figure 1.
Reaction equation for the synthesis of adipic acid by oxidation of cyclohexene with H2O2 catalyzed by Na2WO4.
In H2O2, unstable -O-O- exists, which can easily decompose to produce O2 under certain conditions, and many researchers have conducted studies related to the stability and thermal hazards of H2O2. Eto et al.[5] studied and evaluated the influence law of various metal compounds on the reaction runaway hazard of H2O2 aqueous solution, and found that: iron, copper and chloride ions accelerated the thermal runaway of the decomposition of H2O2, however, nickel, potassium, sulfate and nitrate ions played an inhibitory role in the thermal runaway of the decomposition of H2O2. Wu et al.[6] mixed 20 wt.% H2O2 aqueous solution with different concentrations of sulfuric acid (H2SO4), utilized various thermal analyzers to study the thermal decomposition characteristics of H2O2 and obtained the thermodynamic parameters. It was found that the decomposition of H2O2 could be inhibited to a certain extent when the concentration of H2SO4 was 0.2, 1, and 2 mol/L. However, the addition of 96 wt.% H2SO4 to the solution led to a rapid increase in the rate of H2O2, and the whole exothermic reaction of the decomposition of H2O2 was violent. Adding stabilizers can improve the stability of H2O2. Domestic and foreign research on H2O2 stabilizer is mainly applied in the field of paper bleaching. The mechanism of H2O2 stabilizer includes complexation theory and colloidal adsorption theory. Complexation theory suggests that metal ions in solution and multivalent chelating agents can chelate to form stable water-soluble complexes, so that metal ions do not catalyze the decomposition of H2O2. And the theory of colloid adsorption suggests that heavy metal ions can be adsorbed through the polymer colloid nationality electrostatic or hydrogen bonding to achieve stability[7]. Zhang et al.[8] investigated the effect of adding different combinations of H2O2 stabilizers on the decomposition of H2O2 by free manganese ions and manganese ions in the presence of precipitated lignin, and the results of the study found that the addition of the H2O2 stabilizer, ethylenediaminetetraacetic acid (EDTA), alone significantly reduced H2O2 decomposition under both conditions. Jung et al.[9] evaluated the stability of H2O2 in the Fenton reaction using phthalic acid as a stabilizer. It was found that at low pH of the solution, iron ions (Fe3+) in the solution complexed with phthalic acid to form stable complexes, which inhibited the catalytic activity of Fe3+ and prolonged the service life of H2O2.
In recent years, domestic and international scholars, based on a variety of technical means from the material characteristics, reaction process and mechanism analysis of the safety of the oxidation process related research, and according to the results of the study put forward corresponding improvement measures. Li[10] used a reaction calorimeter to investigate the effect of different charging methods on the thermal parameters during the reaction of H2O2 oxidation of acetic acid to prepare peroxyacetic acid. The 'one-pot' charging method was found to have a lower reaction risk than the 'drop-in' method. In addition, the secondary decomposition reactions of the products and feedstocks of the process were investigated using adiabatic accelerated calorimetry. The results of the study show that the possibility of secondary decomposition of peroxyacetic acid and H2O2 is higher, and the control should be focused on in the actual process. Liu[11] investigated the thermal hazards in the synthetic process for the production of N-methylmorpholine oxide by H2O2 oxidation using a simultaneous thermal analyzer (STA), an adiabatic accelerated calorimeter (ARC) and a fully automated reaction calorimeter (RC1e). It was found that the product N-methylmorpholine oxide has a certain instability, and the decomposition reaction has a large amount of heat release, which is potentially explosive. In the reaction process, compared with the intermittent charging, the semi-intermittent charging method can effectively avoid the accumulation of material in the system and reduce the probability of thermal runaway. Parker et al.[12] investigated the exothermic properties of the process of oxidation of 2-butanol by hydrogen peroxide for the preparation of 2-butanone using RC1e in terms of initial concentration, reaction temperature and catalyst dosage. The results showed that the initial concentration of 2-butanol had a more significant effect on the total exothermic amount of the reaction, on the basis of which it was concluded that this synthesis process should be carried out at a relatively low concentration of 2-butanol and moderate temperature and catalyst dosage.
Microchannel reactors are structures in which chemical reactions are accomplished within a lateral dimension of less than 1 mm, which is different from the 'three passes and one reversal' of conventional reactors and offers significant advantages in chemical applications. Such as large specific surface area, good heat transfer efficiency, good mass transfer, precise control of reaction time and flexible production methods. In recent years, more and more domestic and international scholars have been studying it. Zhao et al.[13] used a microchannel reactor to develop a continuous flow process for the preparation of phenol from benzene oxidized by H2O2, considering the effects of material molar ratio, reaction temperature, catalyst concentration and residence time on phenol selectivity and yield, respectively. Under the conditions of H2O2 to benzene molar ratio of 1.7:1, reaction temperature of 55 °C, catalyst concentration of 0.01 mol∙L−1, and residence time of 60 min, 94% phenol selectivity was obtained, however, due to the low conversion of benzene the final phenol yield was only 15%. Constantinou et al.[14] designed and constructed a combined microchannel reactor combining a microchannel reactor and a membrane reactor for the synthesis of benzaldehyde by oxidizing benzyl alcohol with oxygen. In the experiments, by adjusting the residence time and reaction pressure, a benzyl alcohol conversion of 44.1% and a selectivity of 73.0% for benzaldehyde were obtained at the reaction temperature of 120 °C. At present, there are many studies on the thermal decomposition and oxidation reaction of hydrogen peroxide, but there is a lack of research on how to improve the stability of hydrogen peroxide in the reaction and how to improve the safety of the process of adipic acid preparation by oxidizing cyclohexene with hydrogen peroxide. For this reason, this study investigates the effect of stabilizer EDTA on the stability of hydrogen peroxide in the adipic acid preparation reaction and develops a microchannel continuous flow synthesis process for adipic acid to improve the intrinsic safety of the process.
-
This study involved 30% hydrogen peroxide solution, sodium tungstate, concentrated sulfuric acid, and ethylenediaminetetraacetic acid as shown in Table 1; all medications were used directly without further purification.
Table 1. Material information used in decomposition experiments.
Material Molecular formula Fineness CAS No. Manufacturer H2O2 aqueous solution H2O2 30.0% 7722-84-1 Sinopharm Chemical Reagent Co., Ltd. Sodium tungstate Na2WO4 ≥ 99.5% 10213-10-2 Shanghai Macklin Biochemical Co., Ltd. Concentrated H2SO4 H2SO4 ≥ 98% 7664-93-9 Sinopharm Chemical Reagent Co., Ltd. EDTA C10H16N2O8 AR 60-00-4 TCI (Shanghai) Development Co., Ltd. Experimental instrumentation
Reaction calorimeter
-
Relevant sensors can record the temperature, exothermic rate and other parameters during the whole reaction process in real time, and through the determination of the heat transfer coefficient and specific heat capacity, the thermodynamic parameters such as reaction enthalpy can be calculated by integration.
Homemade high pressure microchannel reactor
-
The high-pressure microchannel reactor constructed in this study is shown in Fig. 2, which mainly consists of a premixing module, feeding module, reaction module, pressurization module and discharge module. The premixing module includes a digital thermostatic water bath and the three-necked flask to realize the premixing of the reaction materials. The feed module consists of a high-pressure advection pump ,which flow rate range is 0.1−80 ml/min and its pressure range is 0−7 MPa, a check valve (to prevent backflow of material during the reaction process) and a ball valve. The reaction module includes a 316 L stainless steel reaction coil (tube I.D. (1 mm) * O.D. (3 mm), the volume is 13.4 mL), and an oil bath (temperature range of −20 ~ 100 °C to provide reaction temperature for chemical reactions). The pressurization module consists of a nitrogen cylinder and a pressure-reducing valve (to provide the required working pressure for the reaction system). The discharge module consists of a filter (to adsorb fine particles in the reaction tube and prevent clogging of the HP backpressure valve), and a HP backpressure valve (to control the pressure in the tube).
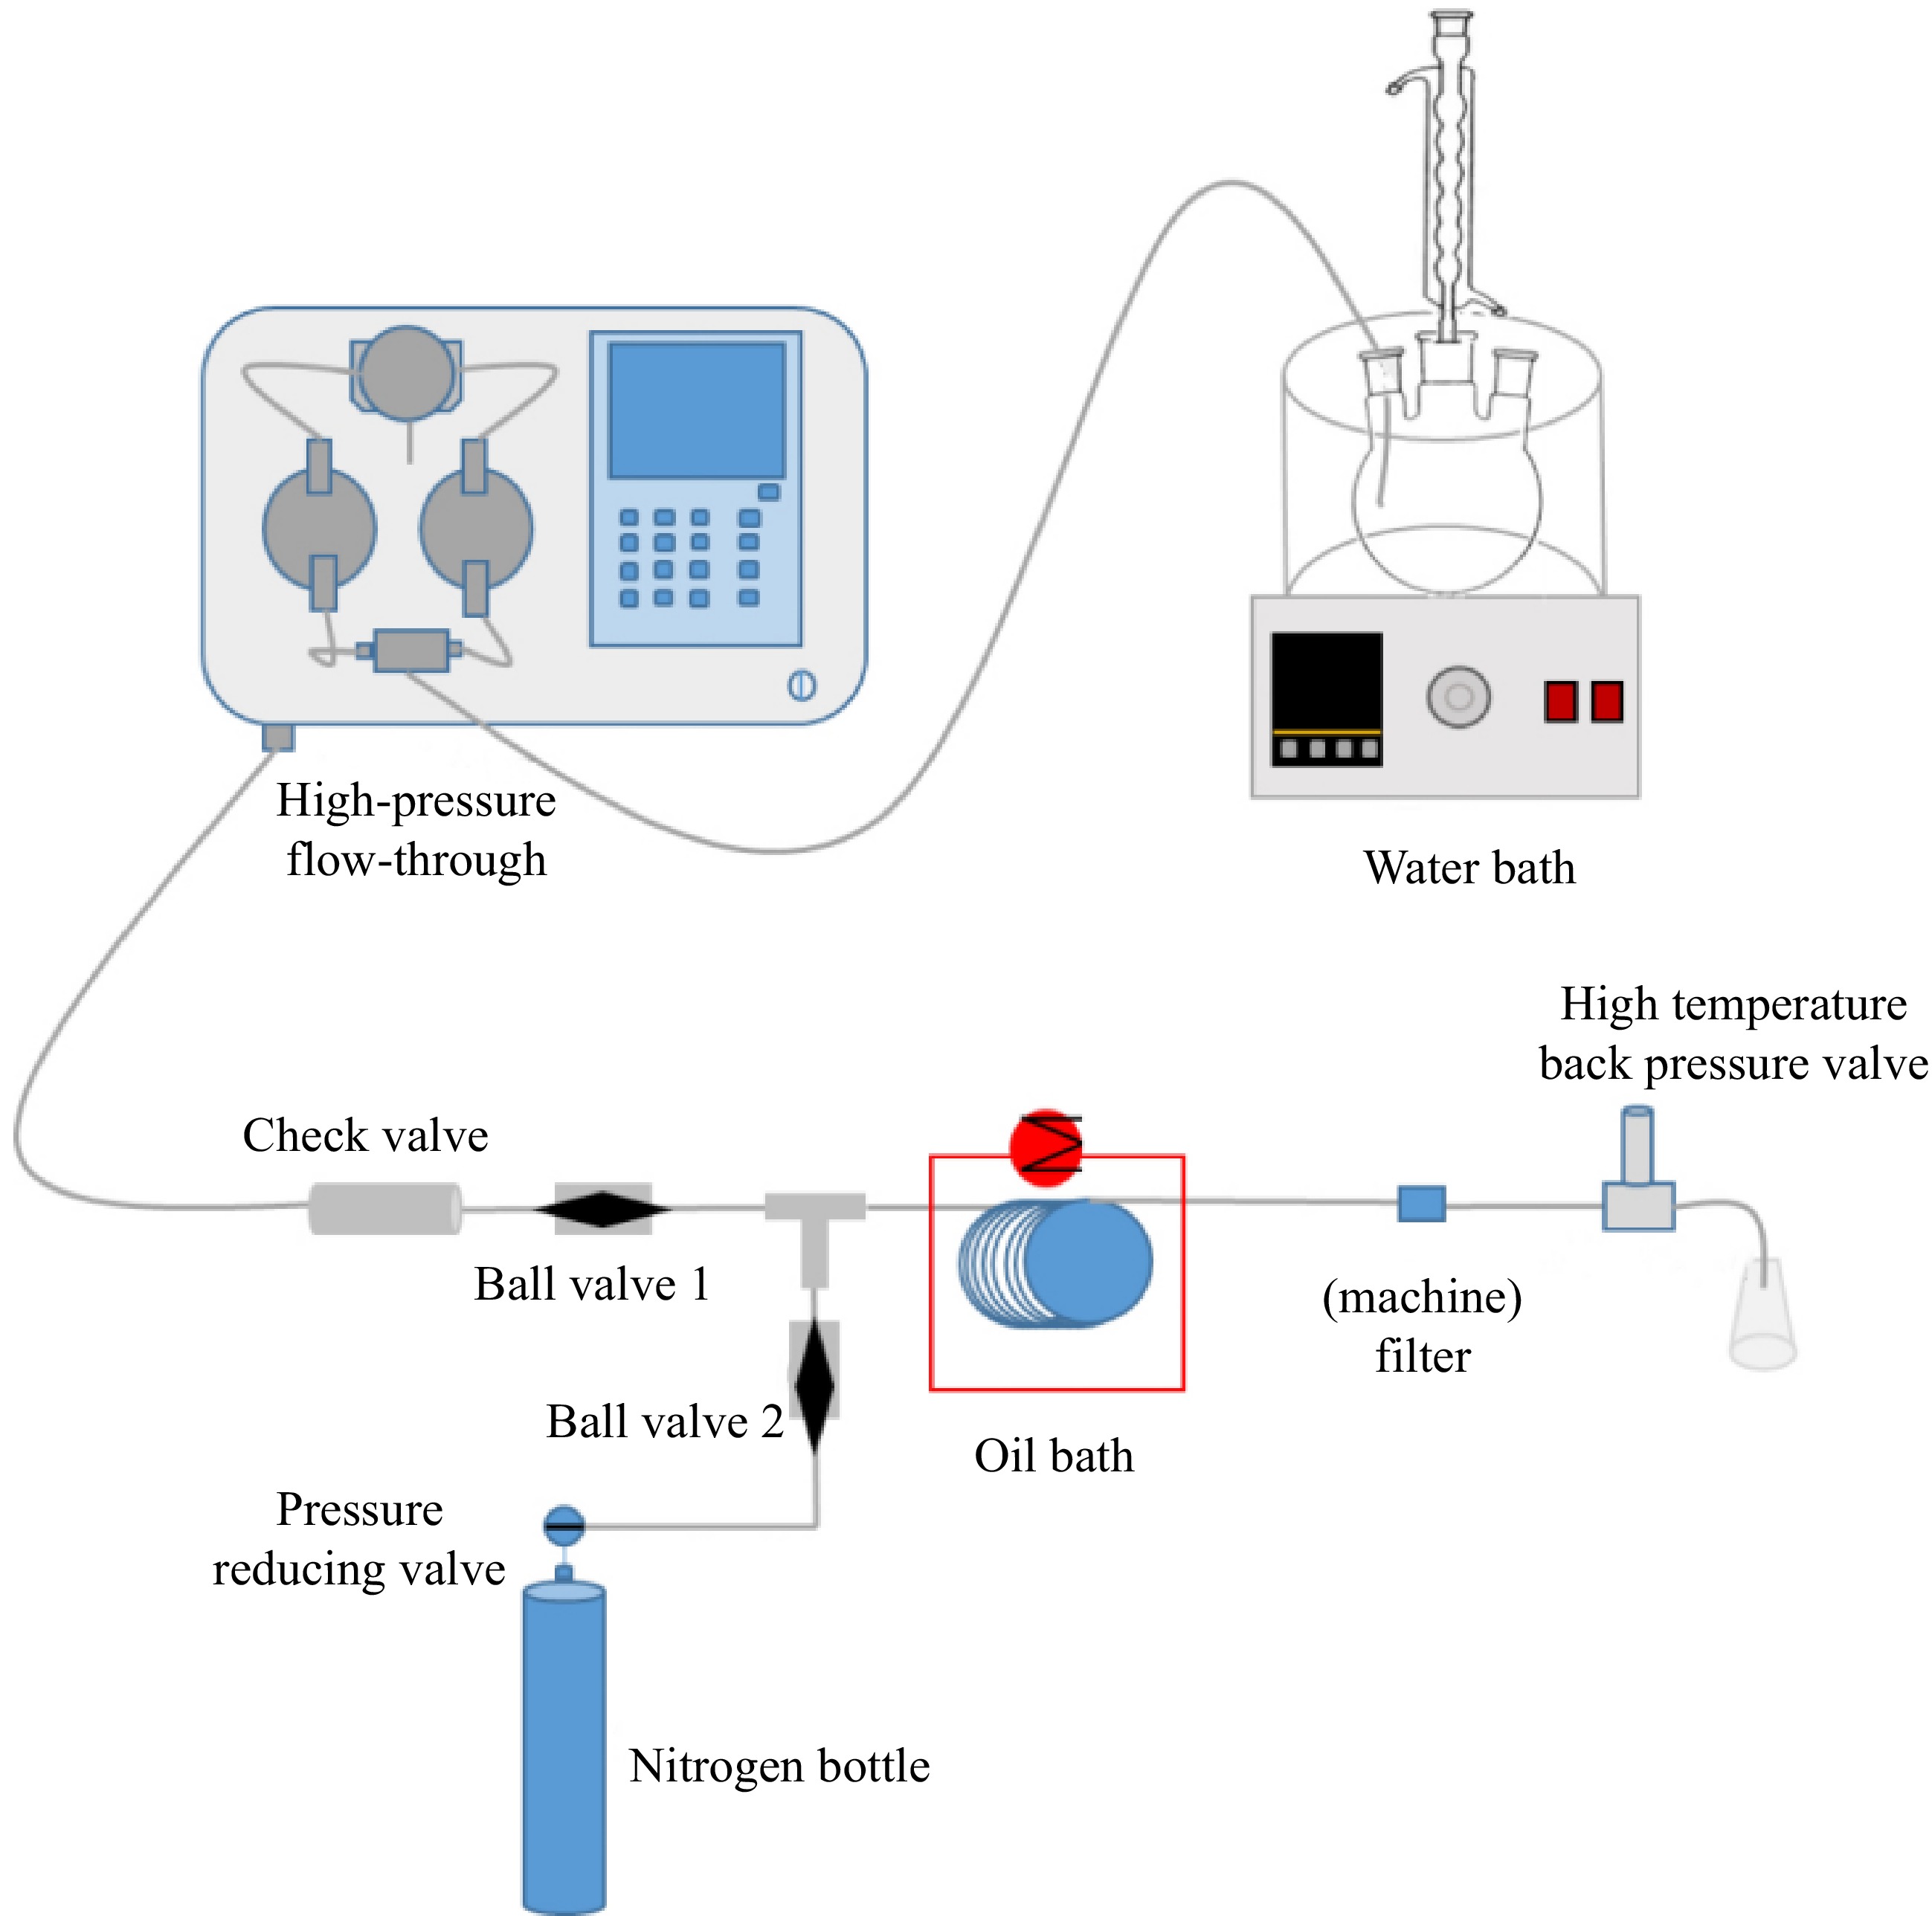
Figure 2.
High pressure microchannel reactor.
Experimental methods
Reaction calorimetric experimental method
-
In the experiment, the molar ratio of H2O2, cyclohexene and Na2WO4 was 4.4:1:0.06, the concentration of H2SO4 was 0.12 mol/L, the mass concentration of SDS was 9.15 g/ L and the mass concentration of EDTA was 1.83 g/L. 728.68 g of 30 wt.% H2O2, 28.908 g of Na2WO4, 7.96 g of concentrated H2SO4, 6 g of SDS, 12 g of EDTA and 120 g of cyclohexene were weighed. After all materials were mixed at room temperature, stirring was turned on, and the isothermal mode was selected to increase the temperature to 73 °C and reflux reaction for 2 h. After that, the reaction was continued to increase the temperature to 90 °C for 5 h, and then the experiment was finished.
Experimental methodology for Na2WO4-catalyzed H2O2 decomposition reaction in microchannel reactor
-
The specific experimental setup is shown in Fig. 2, and the experimental steps are as follows:
(1) Close the feed port ball valve 1, open the nitrogen port ball valve 2, nitrogen into the stainless steel coil then adjust the high temperature and high pressure back pressure valve, so that the pressure inside the pipe to maintain a stable 5MPa after closing the nitrogen port ball valve 2;
(2) Prepare H2O2 decomposition reaction solutions for reaction conditions 2 and 3, respectively. Stirring was turned on in a water bath and an ice bath was used to minimize H2O2 decomposition;
(3) Adjust the temperature of oil bath 90, 95, 100 °C and the flow rate of high-pressure advection pump 2.68, 1.34, 0.893, 0.67 ml/min, and the volume of microchannel reactor is 13.4 ml, corresponding to the theoretical retention time of 5, 10, 15, and 20 min, respectively. Open the inlet ball valve 1 to start the H2O2 decomposition experiments under 2 reaction conditions. opening the inlet ball valve 1, and start the H2O2 decomposition experiments under 2 reaction conditions, see Table 2.
Table 2. Information table of different reaction conditions.
Reaction condition n (H2O2) : n (Na2WO4) Molar concentration of H2SO4 (mol/L) Mass concentration of EDTA (g/L) 1 4.4:0.06 0.22 − 2 4.4:0.06 0.22 18.3 Adipic acid continuous flow experiment
-
The experimental steps of the continuous flow synthesis process of adipic acid are as follows:
(1) The molar ratio of H2O2 : C6H10 : Na2WO4 = 4.4:1:0.06, the concentration of H2SO4 is 0.12 mol/L, the mass concentration of surfactant SDS is 9.15 g/L, and the mass concentration of H2O2 stabilizer EDTA is 18.3 g/L were configured. The reaction is carried out at reflux for 120 min by turning on the stirrer in a water bath and raising the temperature to 73 °C.
(2) Close the feed port ball valve 1, and open the nitrogen port ball valve 2, the nitrogen will be passed into the microchannel stainless steel reaction tube, adjust the high-temperature backpressure valve to control the pressure in the tube for 5, 6, 7 MPa waiting to stabilize after closing the nitrogen port ball valve.
(3) Adjust the temperature of oil bath 100 °C and the flow rate of the high-pressure advection pump to ensure that the theoretical residence time is 5, 10, 15, 20, 25, and 30 min, respectively. Open the inlet ball valve 1 for the experiment.
-
Table 3 shows the thermal parameters of the adipic acid synthesis reaction in the RC1e experiment, and Fig. 3 shows the graphs of temperature (Tr), jacket temperature (Tj) and heat flow rate (qr) in the reactor during the pilot scale-up of the adipic acid green synthesis reaction RC1e. Cyclohexene is gradually oxidized to epoxycyclohexane by H2O2 under reflux conditions starting at 73 °C, followed by rapid hydrolysis to 1,2-cyclohexanediol. As the cyclohexene is gradually consumed, the cooling effect due to reflux becomes less and less effective, so the temperature difference and heat flow rate of the reaction system gradually increase. The maximum temperature difference in stage A reach 14.69 °C. When the reflux reaction is finished and the temperature of the reaction system is increased to 90 °C, 1,2-cyclohexanediol is gradually oxidized by H2O2 and hydrolyzed to the final product adipic acid[15]. There is no reflux phenomenon in this process, the exothermic heat of the reaction is very large, and the maximum temperature difference in the B stage reaches 50.19 °C, therefore, in the process of industrialized application of green synthesis of adipic acid, the emergency cooling down of the B stage should be done.
Table 3. Thermal parameters of adipic acid synthesis reaction in RC1e experiment.
Phase −ΔHr
(kJ)Cp
(J·K−1·g−1)ΔTad,r
(°C)MTSRr (°C)
(Adding EDTA)MTSRr (°C)
(No EDTA)A 103.21 3.8 37.23 104.76 209.77 B 504.77 4.1 168.74 268.81 345.61 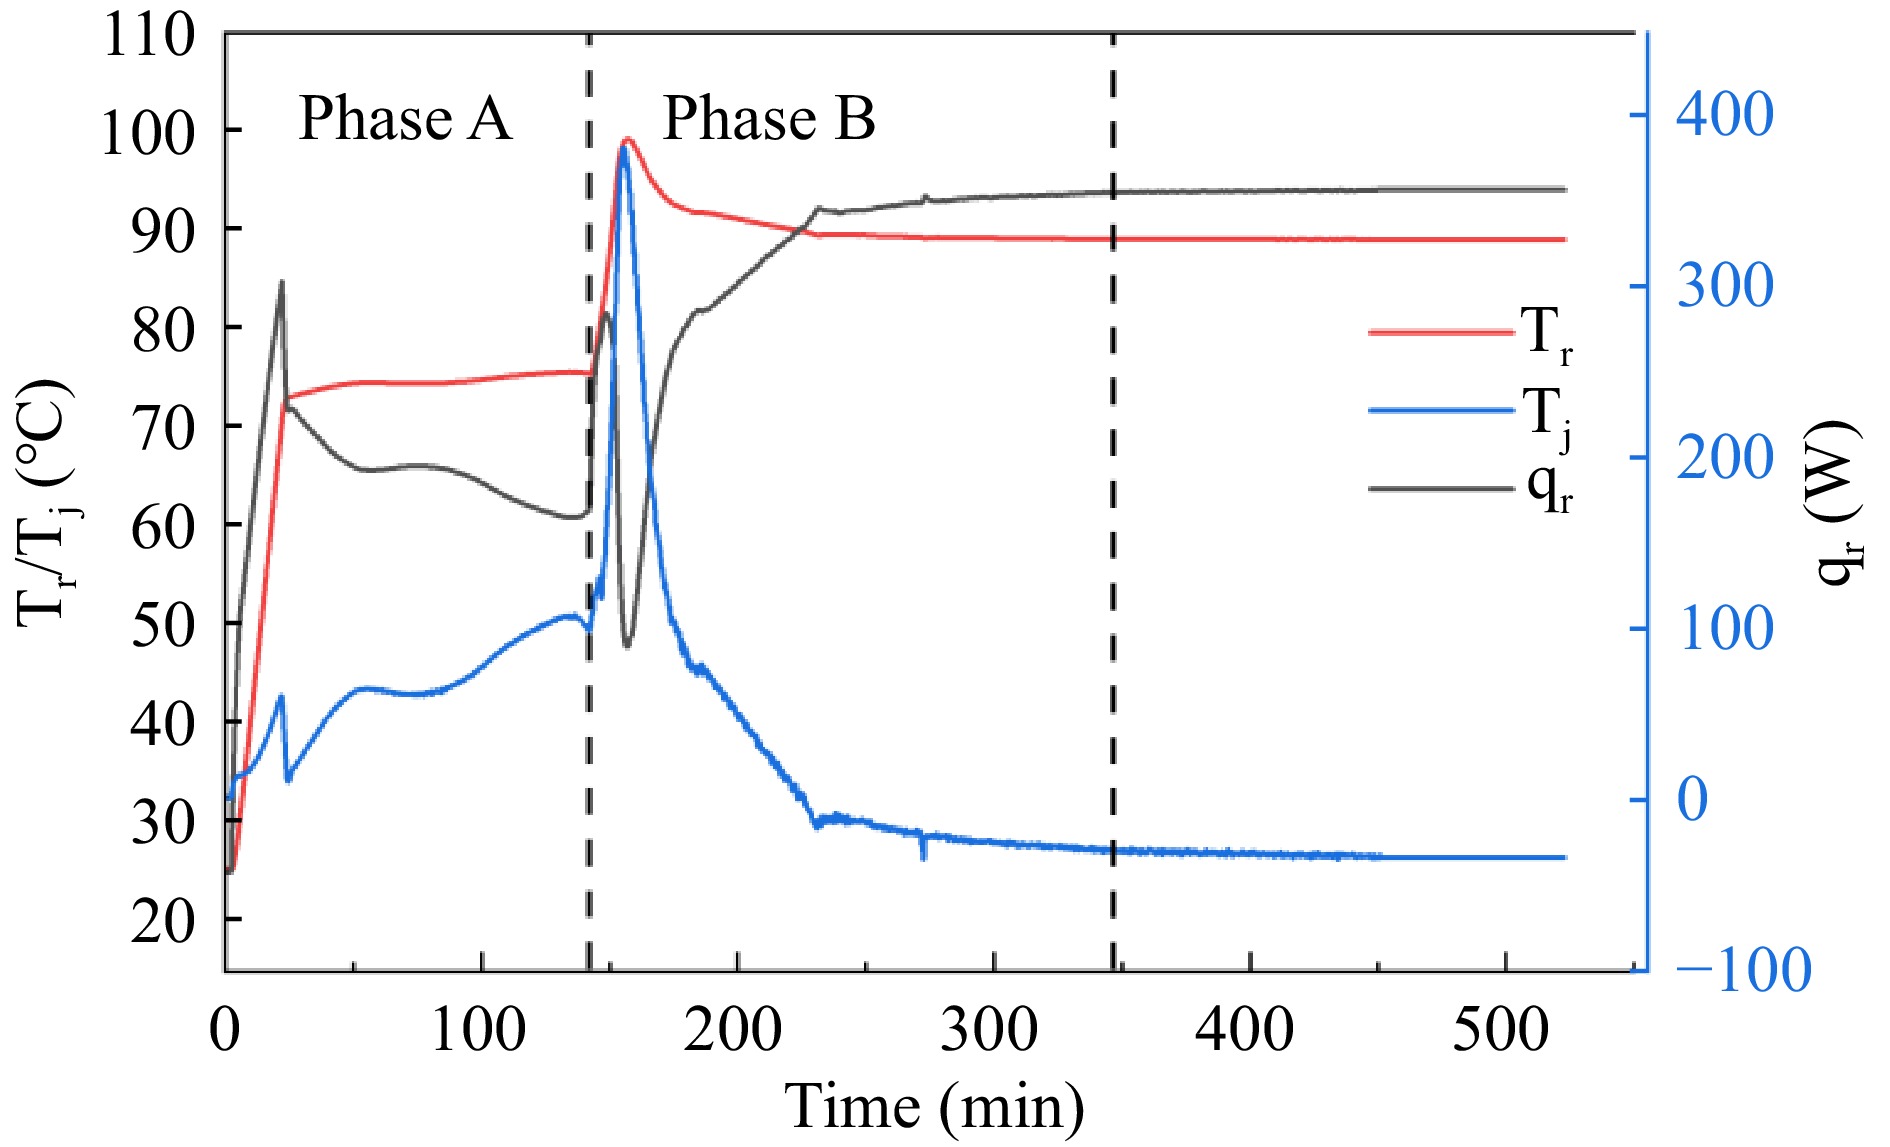
Figure 3.
The Tr, Tj, and qr curves of adipic acid synthesis reaction in RC1e experiment.
In this thesis, the thermal hazard analysis is performed for the two stages A and B of the green synthesis process of adipic acid, respectively. The severity of reaction loss of control is usually measured by the adiabatic temperature rise due to the exothermic nature of the target reaction, and the yield YAA of adipic acid was calculated to be 80.75% according to HPLC, which indicates that there are still unconverted intermediates, and when the system temperature is warmed up to the target temperature here, the reaction will still continue to exothermic. Therefore in order to assess the most hazardous case of the reaction process, the adiabatic temperature rise ΔTad needs to be corrected using the yield YAA[16]. ΔTad and ΔTad,r are calculated by Eqns (1) and (2). RC1e calorimetric test data and results are shown in Tables 4 and 5, where ΔHr is the heat of the oxidation reaction, kJ; mr is the total mass of the oxidation reaction system, g; and Cp is the specific heat capacity of the system after the oxidation reaction, J/(K·g).
Table 4. Average values of reaction rate constants at different temperatures in a stainless steel capillary microreactor calculated based on the first order reaction assumption under different reaction conditions.
Reaction temperature (°C) Reaction condition 2 calculated rate constant average k1 (10−3 s−1) Reaction condition 2 calculated rate constant average k1 (10−3 s−1) 90 0.2595 0.2082 95 0.7772 0.5695 100 1.3304 0.9690 Table 5. Average values of reaction rate constants at different temperatures in a stainless steel capillary microreactor calculated based on the zero order reaction assumption under different reaction conditions.
Reaction temperature (°C) Reaction condition 2 calculated rate constant average k0 (10−3 mol/(L·s) Reaction condition 3 calculated rate constant average k0 (10−3 mol/(L·s) 90 2.3380 1.9032 95 6.1659 4.7752 100 9.4732 7.38445 $ \Delta {T}_{ad}=\dfrac{{\Delta H}_{r}}{{C}_{p}{m}_{r}} $ (1) $ \Delta {T}_{ad,r}=\dfrac{{\Delta H}_{r}}{{C}_{p}{m}_{r}{Y}_{AA}} $ (2) $ {T}_{cf}={T}_{p}+\dfrac{{\Delta H}_{r}-{\int }_{0}^{t}{q}_{r}\left(t\right)dt}{{C}_{p}{M}_{t}} $ (3) $ {T}_{cf,r}={T}_{p}+\dfrac{\dfrac{{\Delta H}_{r}}{{Y}_{AA}}-{\int }_{0}^{t}{q}_{r}\left(t\right)dt}{{C}_{p}{M}_{t}} $ (4) In Eqns (3) and (4): Tp is the temperature in the kettle during the synthesis process, °C; Mt is the total mass of the oxidized reactive substance; Tcf is the temperature that can be reached at a certain moment after the cooling failure of the reaction system, and the maximum value of Tcf is the MTSR, and the Tcf is also corrected by the yield YAA; MTSR is the maximum temperature of the reaction and characterizes the severity of hardening out of control[17]. Figure 4 shows the variation of Tcf, Tcf,r in stages A and B, yielding a MTSRr of 104.76 °C in stage A and 263.81 °C in stage B. The MTSRr of stage A is 104.76 and 263.81 °C in stage B, respectively. However the process without the addition of the H2O2 stabilizer EDTA resulted in an MTSRr of 209.77 °C for stage A and 345.61 °C for stage B[15]. The values of MTSRr in this experiment are all reduced in comparison. Combined with the literature[18] to illustrate that the addition of H2O2 stabilizer EDTA can effectively reduce the severity of adipic acid green synthesis reaction out of control, with adipic acid green synthesis application prospects.
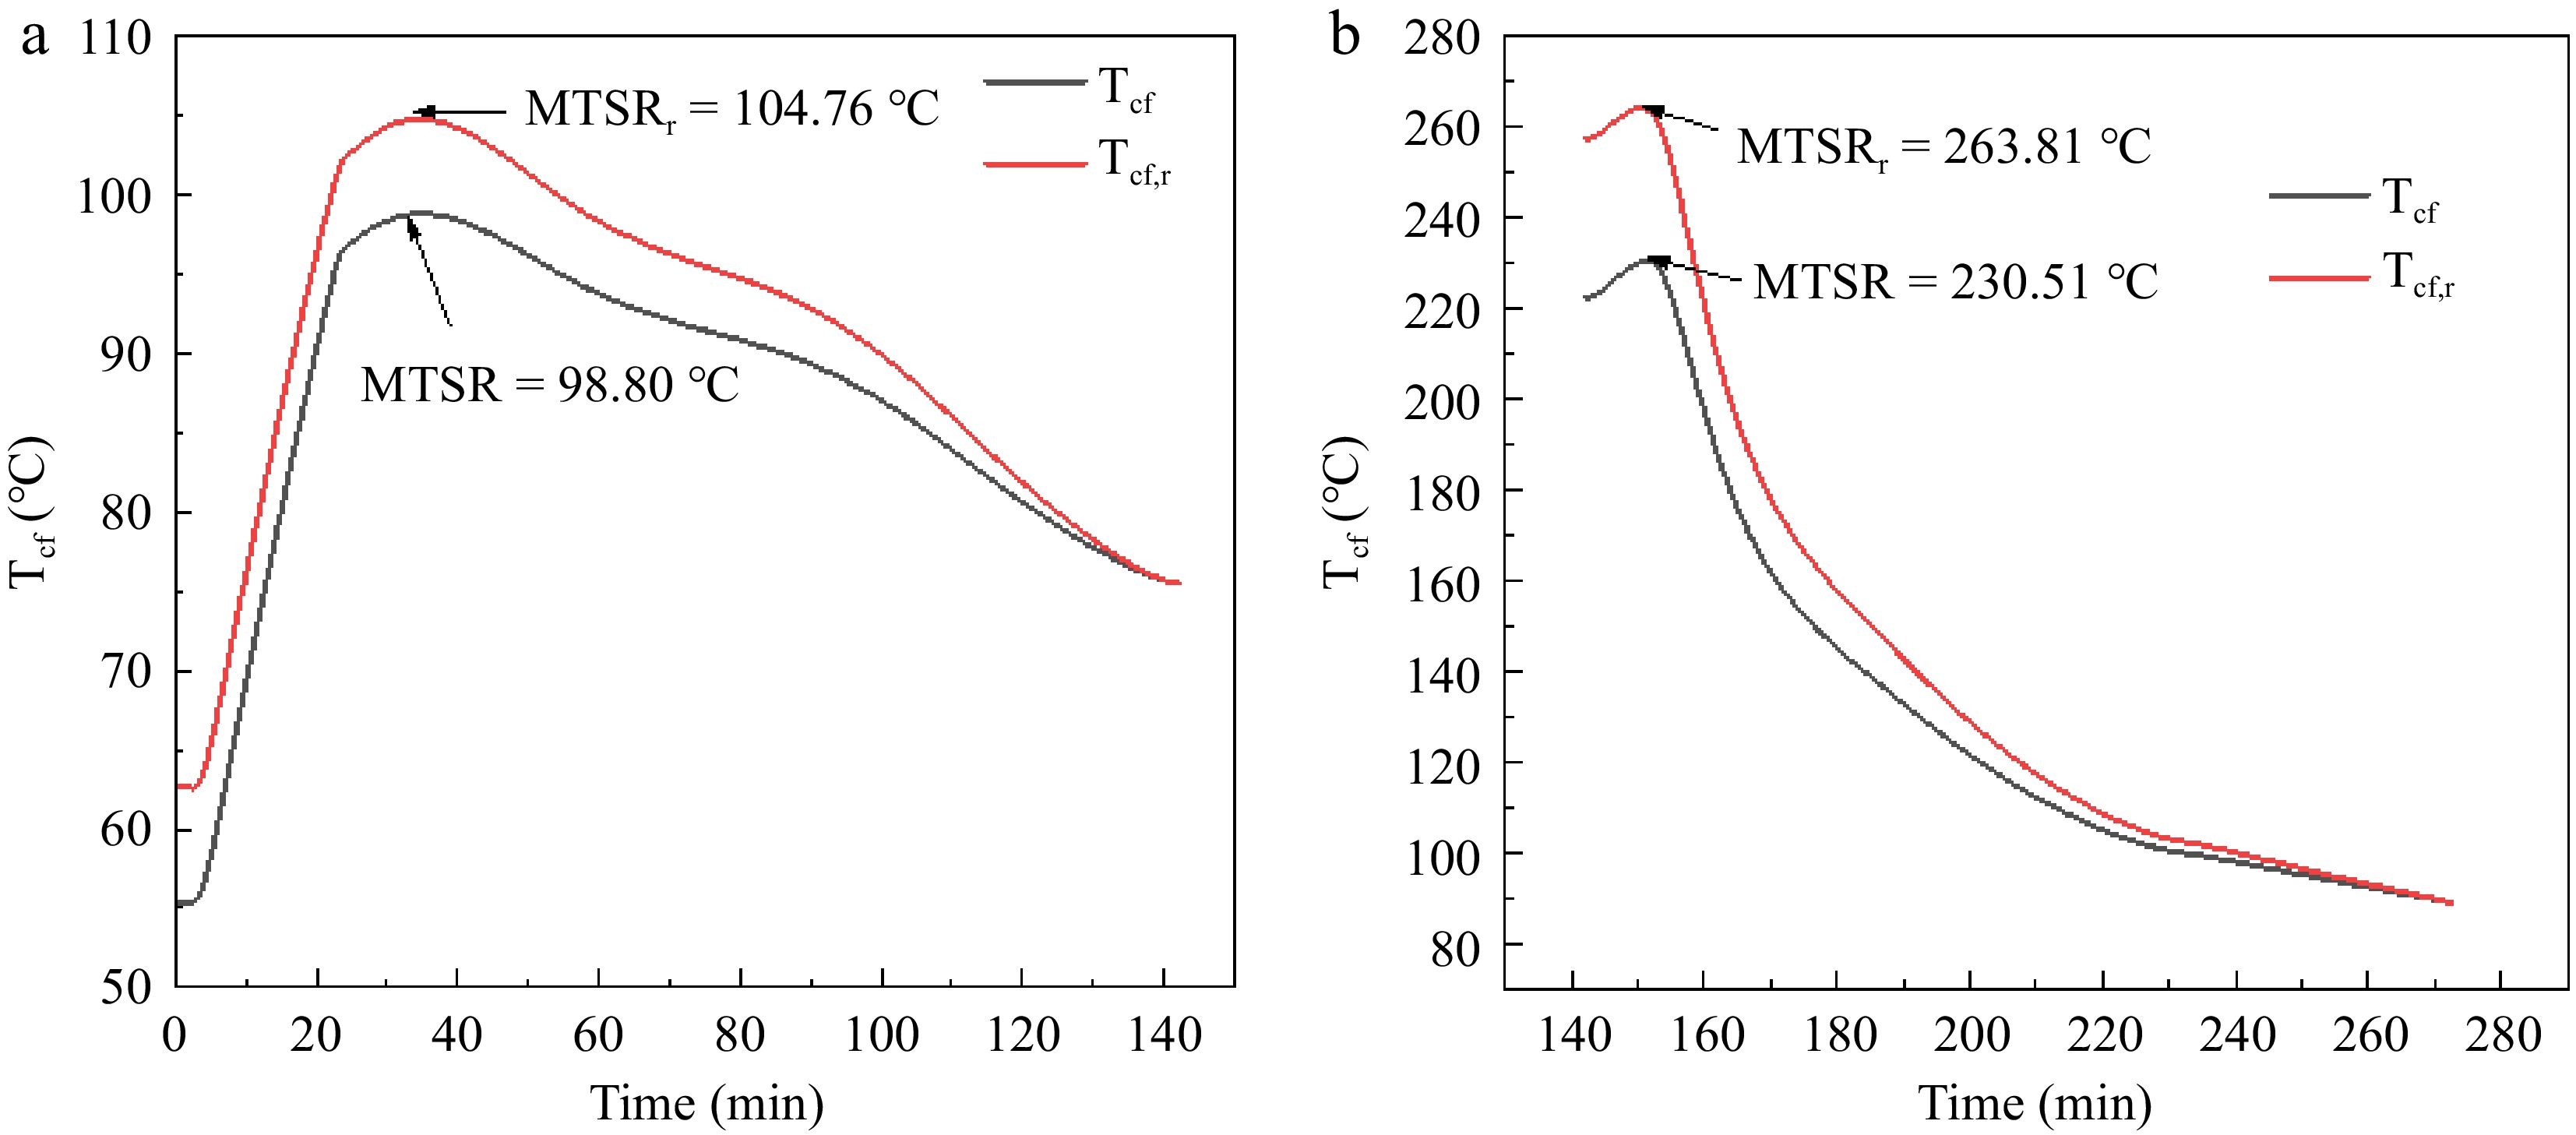
Figure 4.
Tcf curves and MTSR of adipic acid synthesis reaction (a) Phase A; (b) Phase B.
-
In the continuous flow process where H2O2 is involved, the higher reaction temperature causes the decomposition of H2O2 to produce oxygen. Gas expansion pushes the fluid through the microreactor quickly, which makes the gap between actual and theoretical residence times too large. The significant reduction in residence time leads to incomplete reaction, which can be addressed by increasing the reaction pressure to compress the gases produced by decomposition in order to minimize their effect on the residence time[19]. In this section, the effect of adding and not adding the H2O2 stabilizer EDTA on the decomposition reaction of H2O2 in a capillary microreactor is investigated. The H2O2 decomposition kinetics at high temperature and pressure in the microchannel reactor are studied to obtain the reaction rate constant k, the activation energy of the decomposition reaction Ea, and the finger-forward factor A.
Figure 5 shows the relationship between the catalytic decomposition rate and the theoretical residence time of H2O2 for reaction conditions 1 and 2 with different reaction temperatures. The conversion of H2O2 under both conditions increase with increasing temperature and theoretical residence time. The conversion of H2O2 after 100 °C and theoretical residence time of 20 min is 60.72% and 51.07%, respectively. It can be seen from Fig. 5 that the addition of EDTA result in a decrease in H2O2 conversion at both the same temperature and flow rate. The higher the temperature, the more pronounced the inhibition of H2O2 decomposition by EDTA. Therefore, the addition of EDTA can also improve the utilization of H2O2 in the microchannel continuous flow process.
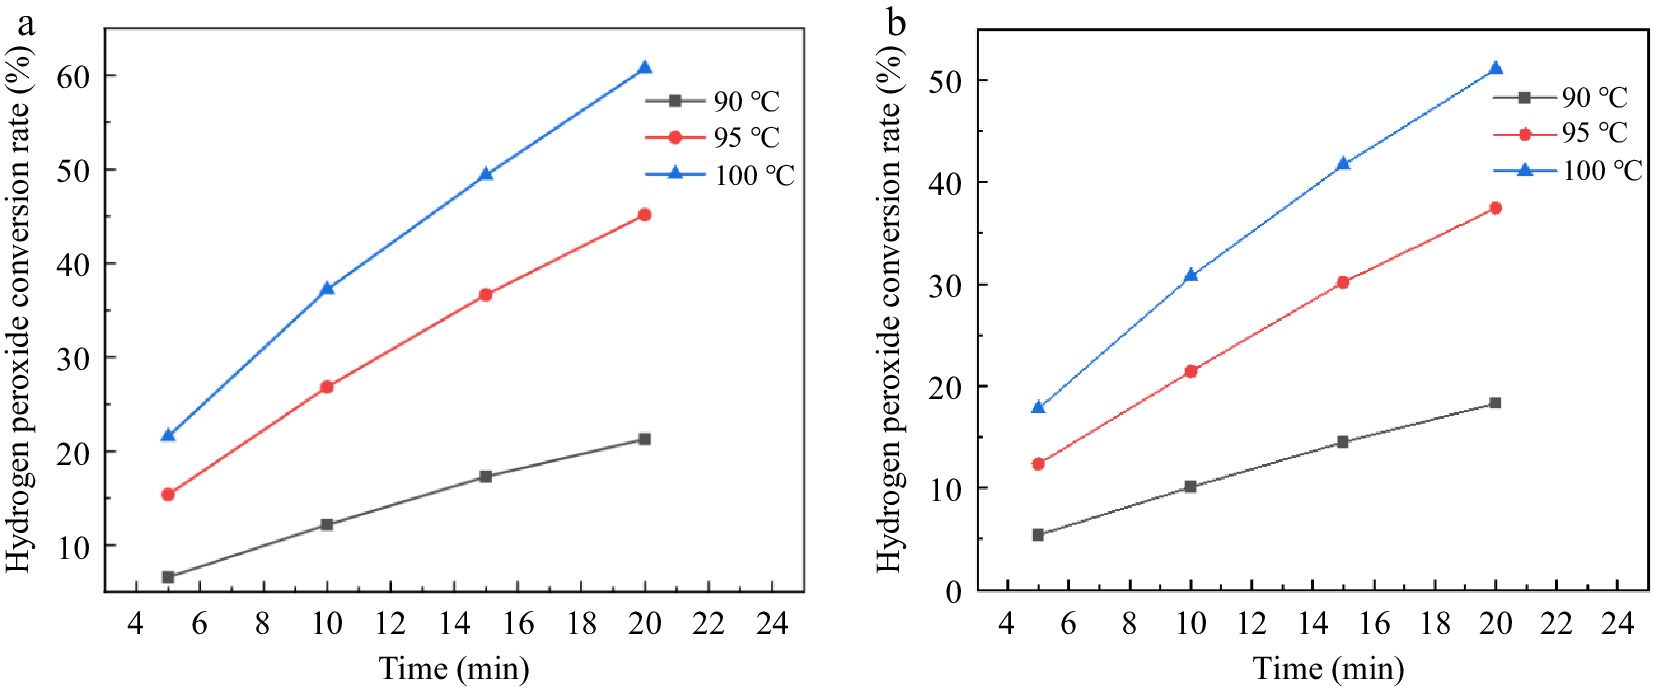
Figure 5.
Effect of reaction temperature and residence time on hydrogen peroxide ecomposition in a stainless steel capillary microreactor. (a) Reaction condition 1; (b) Reaction condition 2.
As the O2 is produced during the decomposition of H2O2, the actual residence time of the reaction cannot be determined in the absence of kinetic information. In this study, a plunger flow model is used to describe the extent of H2O2 decomposition in a stainless steel capillary microreactor, focusing on the effect of gas production on residence time (reaction time). For the continuous flow system, the average volumetric flow rate (v) of the fluid, in unit m3/s, can be expressed by Eqn (5):
$ \mathrm{v}=\dfrac{dV}{d\tau } $ (5) $ \mathrm{\tau } $ $ {\int }_{0}^{{V}_{reactor}}dV={\int }_{0}^{\tau }vd\tau $ (6) For the decomposition of H2O2, v can be expressed by Eqn (7):
$ \mathrm{v}={v}_{gas}+{v}_{liquid} $ (7) $ {v}_{gas} $ $ {v}_{liquid} $ $ {\int }_{0}^{{V}_{reactor}}dV={\int }_{0}^{\tau }({v}_{gas}+{v}_{liquid})d\tau $ (8) For the resulting gas phase flow rate, the ideal gas-state equation is used to convert to obtain Eqn (9):
$ {v}_{gas}=\dfrac{nRT}{P}=\dfrac{{n}_{0\left({H}_{2}{O}_{2}\right)}XRT}{2P} $ (9) $ {\mathrm{n}}_{0\left({\mathrm{H}}_{2}{\mathrm{O}}_{2}\right)} $ $ {n}_{0\left({H}_{2}{O}_{2}\right)} $ $ \mathrm{R} $ $ \mathrm{P} $ $ \mathrm{T} $ $ {\int }_{0}^{{V}_{reactor}}dV={\int }_{0}^{\tau }\left({v}_{liquid}+\dfrac{{n}_{0\left({H}_{2}{O}_{2}\right)}XRT}{2P}\right)d\tau $ (10) $ {V}_{reactor}={\int }_{0}^{\tau }\left({v}_{liquid}+\dfrac{{n}_{0\left({H}_{2}{O}_{2}\right)}XRT}{2P}\right)d\tau $ (11) $ {\mathrm{V}}_{\mathrm{r}\mathrm{e}\mathrm{a}\mathrm{c}\mathrm{t}\mathrm{o}\mathrm{r}} $ $ -\dfrac{dc}{d\tau }=k{c}^{x} $ (12) Where k is the reaction rate constant relative to H2O2, including the effect of the catalyst on it, and is the concentration of H2O2 in the liquid phase in mol/L. In the literature, H2O2 decomposition is mostly considered as a primary reaction equivalent to H2O2[20,21]. If the first order rate law is followed (Case 1) Eqn (12) can be transformed into Eqn (13):
$ \dfrac{dc}{c}=-{k}_{1}d\tau $ (13) Integrating Eqn (13) yields,
$ \mathrm{ln}\left(\dfrac{{c}_{0}}{c}\right)={k}_{1}\tau $ (14) The concentration of H2O2 can be calculated based on the initial concentration and the conversion rate which is shown in Eqn (15), The H2O2 in this decomposition experiment is 30 wt.% converted to give a
$ {\mathrm{c}}_{0} $ $ \mathrm{c}={\mathrm{c}}_{0}(1-\mathrm{X}) $ (15) $ \mathrm{ln}\left(\dfrac{{c}_{0}}{{\mathrm{c}}_{0}(1-\mathrm{X})}\right)={k}_{1}\tau $ (16) $ \frac{1}{{k}_{1}}\mathrm{ln}\left(\dfrac{1}{1-X}\right)=\tau $ (17) $ \mathrm{d}\mathrm{\tau }=\dfrac{1}{{k}_{1}(1-X)}dX $ (18) Eqn (19) is obtained by combining Eqns (18) and (11). With known temperature T, H2O2 conversion X and inlet liquid volume flow rate, the integral term is calculated from experimental data and Eqn (20).
$V_{reactor}=\int_0^X\left(v_{liquid}+\dfrac{n_{0(H_2O_2)}XRT}{2P}\right)\left[\dfrac{1}{k_1(1-X)}\right]dX$ (19) $k_1V_{reactor}=\int_0^X\left(v_{liquid}+\dfrac{n_{0(H_2O_2)}XRT}{2P}\right)\left[\dfrac{1}{(1-X)}\right]dX$ (20) The function of k1*Vreactor and H2O2 conversion rate X is calculated according to Eqn (20), and the results are shown in Fig. 6. From Fig. 6 it can be seen that k1*Vreactor depends strongly on the H2O2 conversion rate. Thus for the catalytic decomposition of H2O2 under reaction conditions 1 and 2, the first-order rate fixing rate in H2O2 does not seem to be observed. The average values of the reaction rate constants (k1) at the three reaction temperatures are shown in Table 4.
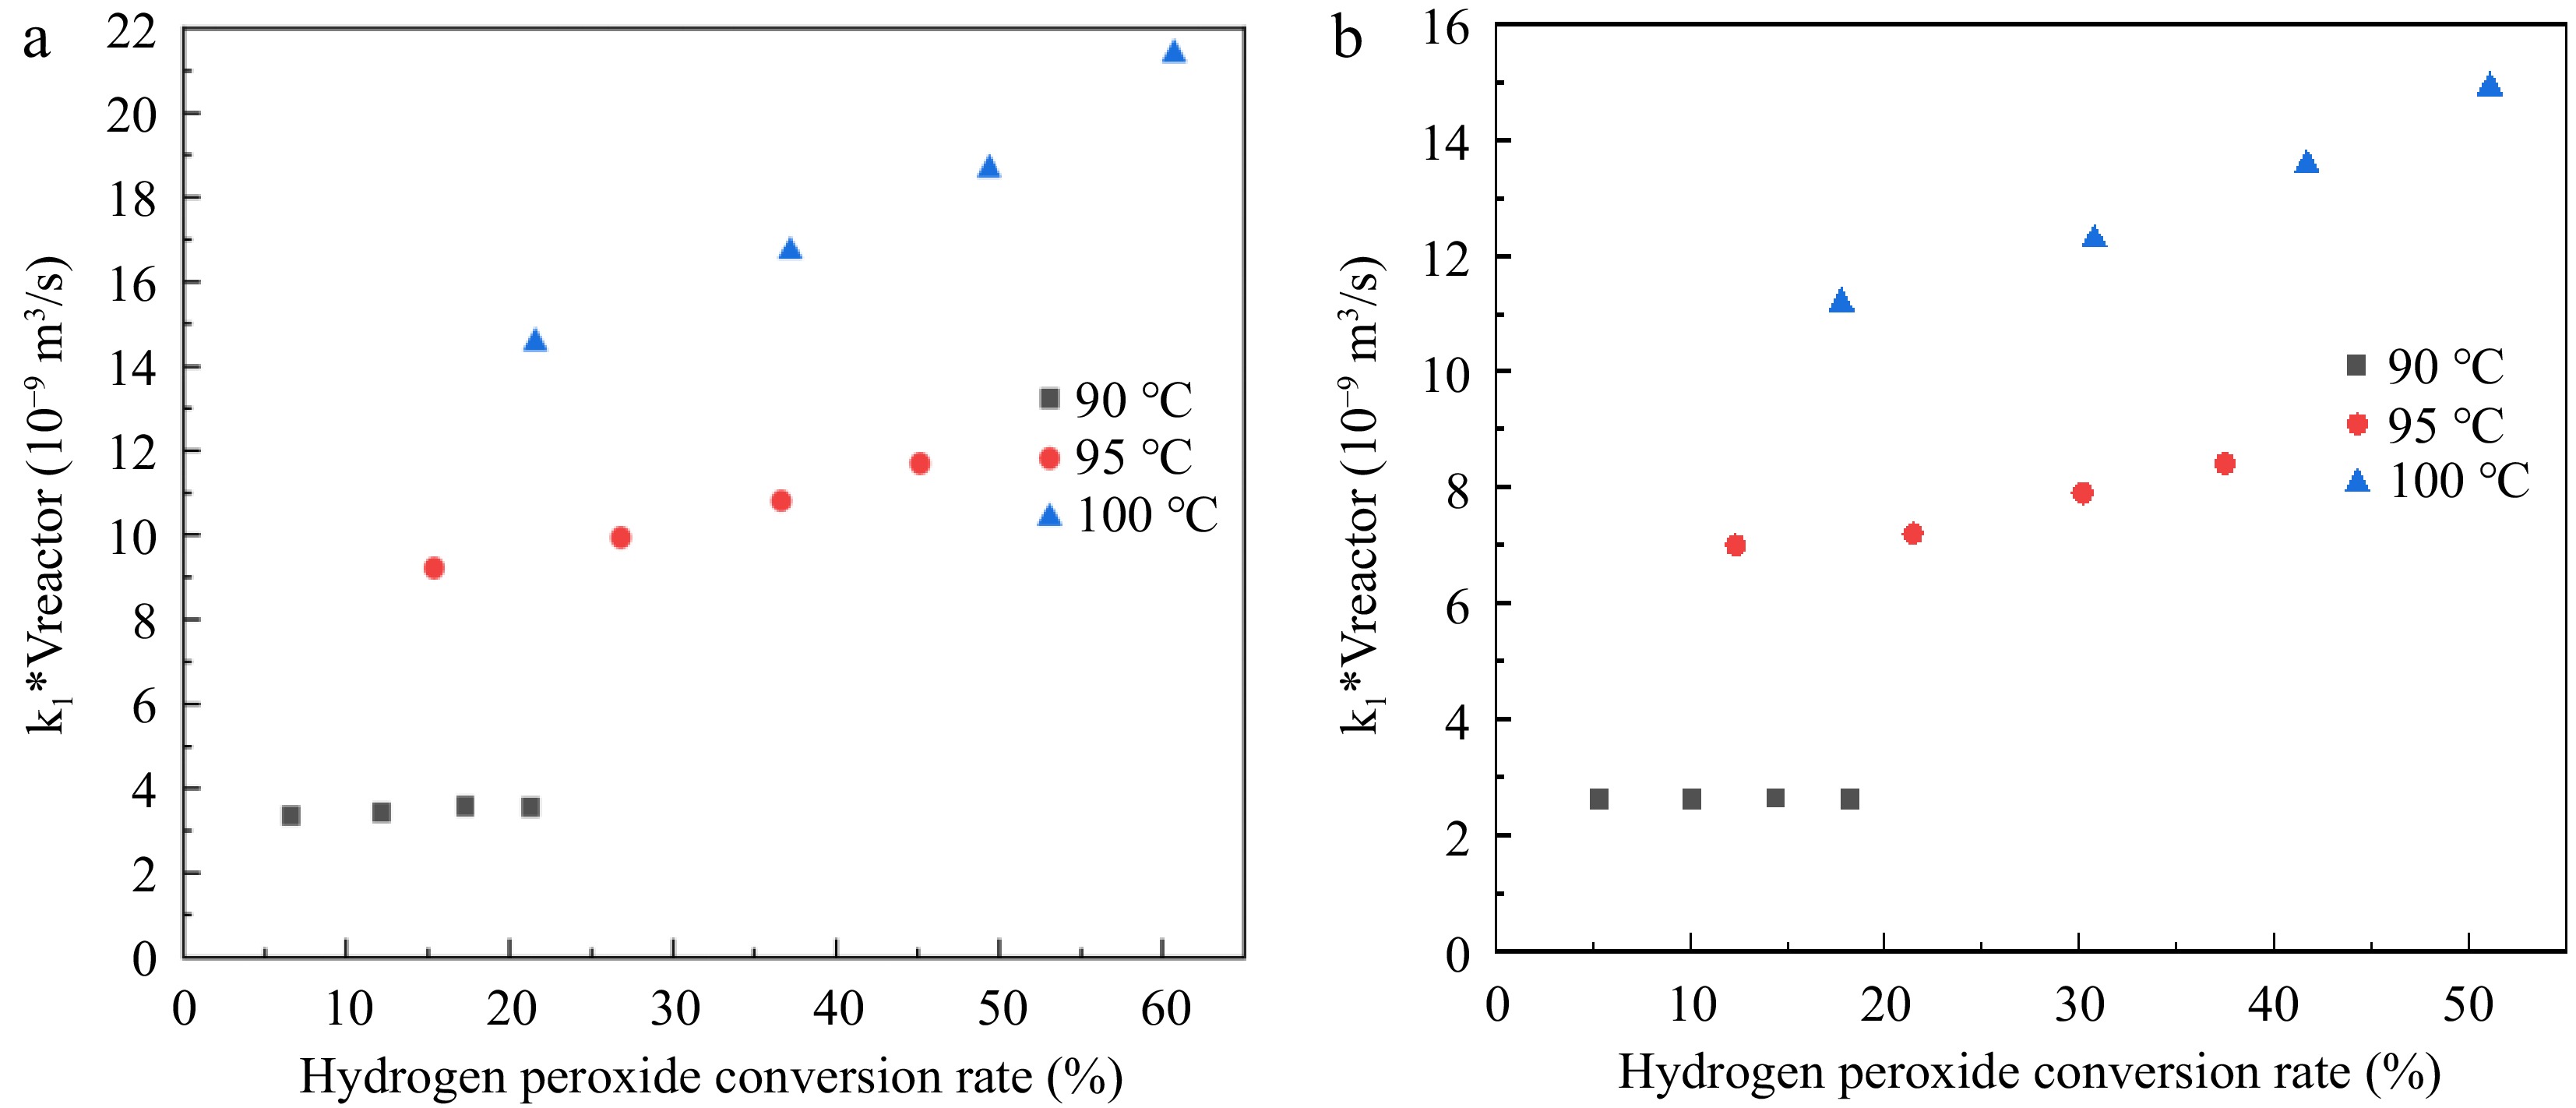
Figure 6.
Relationship between k1*Vreactor and H2O2 conversion rate. (a) Reaction condition 1; (b) Reaction condition 2.
In the literature, the decomposition of H2O2 is zero order compared to H2O2 when the initial concentration of H2O2 is 35.5 wt.%[22]. The initial concentration used for the experiment is 30 wt.%, so assuming that the decomposition reaction in H2O2 is zero-order, following the zero-order rate law (Case 2), Eqn (12) can be transformed into Eqn (21), and Eqn (15) is brought into Eqn (21) to give Eqn (22). Equation (22) and (11) are combined to obtain Eqn (23).
$ -\dfrac{dc}{d\tau }={k}_{0} $ (21) $ d\tau =\dfrac{{\mathrm{c}}_{0}dX}{{k}_{0}} $ (22) $ {k}_{0}{V}_{reactor}={\mathrm{c}}_{0}{\int }_{0}^{X}\left({v}_{liquid}+\dfrac{{n}_{0\left({H}_{2}{O}_{2}\right)}XRT}{2P}\right)dX $ (23) According to Eqn (23), the function of k0*Vreactor and H2O2 conversion rate X is calculated, and the results are shown in Fig. 7. The value of k0*Vreactor is not related to the H2O2 conversion within the experimental error. The results show that H2O2 decomposition under reaction conditions 1 and 2 is a zero-order reaction. The average values of the reaction rate constants (k0) at the three reaction temperatures are shown in Table 5.
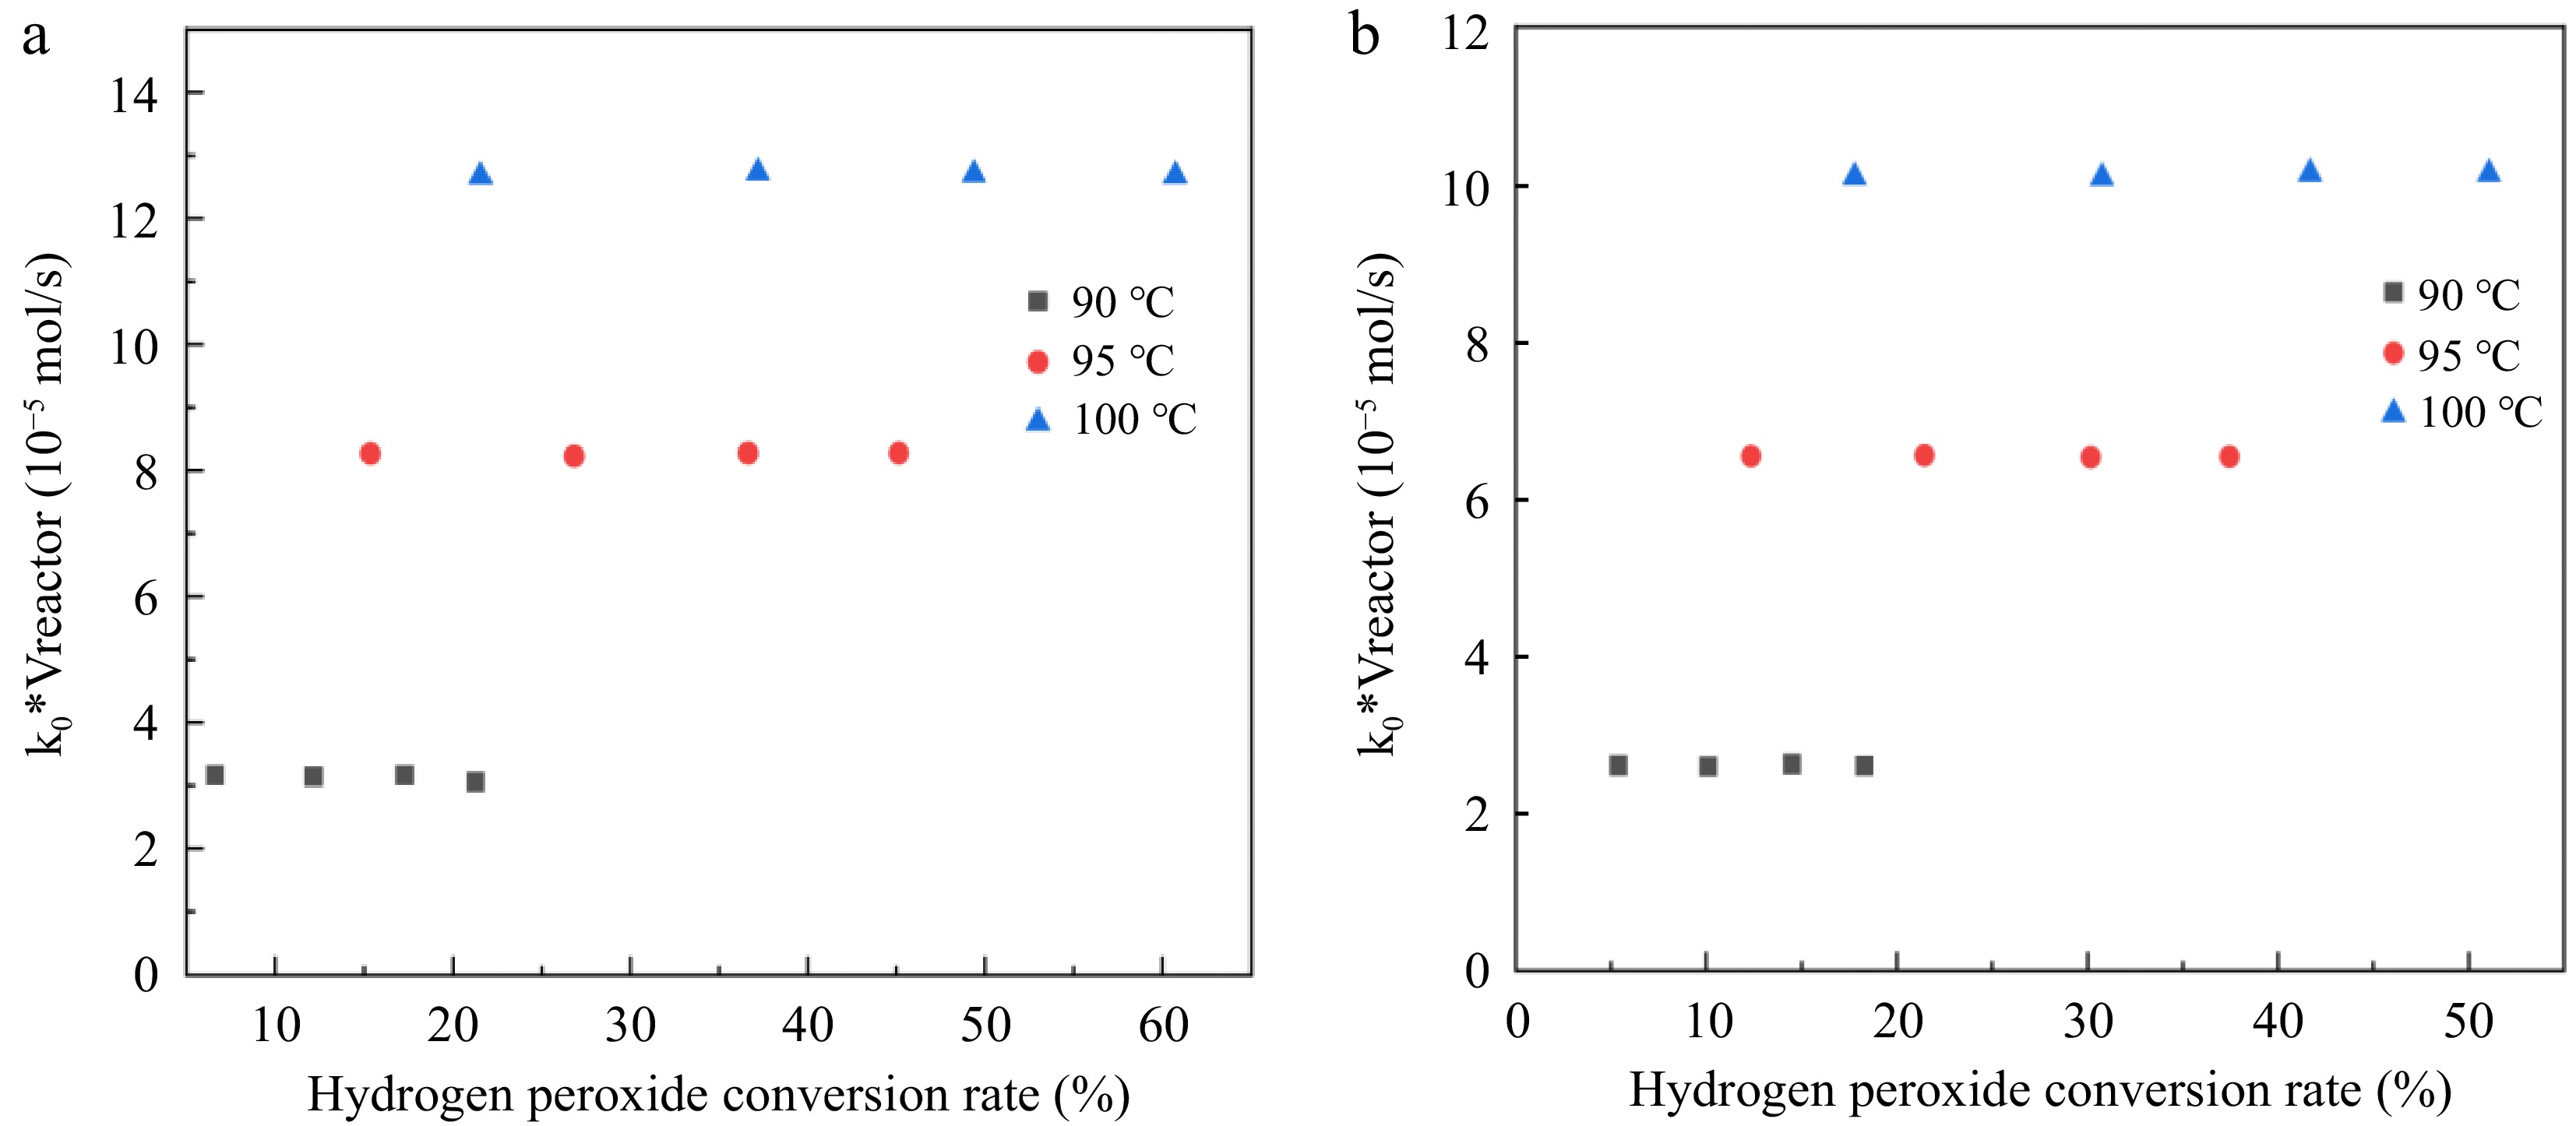
Figure 7.
Relationship between k0*Vreactor and hydrogen peroxide conversion rate. (a) Reaction condition 1; (b) Reaction condition 2.
To further verify that Case 2 (zero-stage reaction of H2O2) is more reasonable than Case 1 (one-stage reaction of H2O2) in the catalytic decomposition of H2O2 under reaction conditions 1, 2, the standard deviation (SD) between k for each residence time and its corresponding mean value at the same reaction temperature is calculated using Eqn (24):
$ \mathrm{S}\mathrm{D}=\sqrt{\dfrac{1}{n-1}\displaystyle\sum _{i=1}^{n}{({k}_{i}-{k}_{m})}^{2}}=\sqrt{\dfrac{1}{3}\displaystyle\sum _{i=1}^{4}{({k}_{i}-{k}_{m})}^{2}} $ (24) From Tables 6 & 7 it can be seen that for different temperatures based on zero level reaction the SD values are below 5%. These SD values are significantly lower than the SD assumed for the first-order reactions. The values obtained for the 95% confidence intervals are also closer to the reaction rate constant k values. Thus it can be concluded that in a stainless steel capillary microreactor the initial H2O2 concentration of 30 wt.%. The H2O2 decomposition reaction with Na2WO4 as catalyst under reaction conditions 1 and 2 is a zero-order reaction compared to H2O2.
Table 6. Comparison of the calculated reaction rate constant k, standard deviation (SD), and confidence interval of the calculated reaction rate constant k based on the assumption of first and zero order reactions in a stainless steel capillary microreactor under reaction condition 2.
Reaction temperature (°C) k1(10−3 s−1) SD 95% confidence interval of k1 k0 (10−3 mol/L·s) SD 95% confidence interval for k0 90 0.2595 0.1045 0.2471−0.2719 2.3380 0.0493 2.2806−2.3953 95 0.7772 1.0754 0.6495−0.9049 6.1659 0.0225 6.1397−6.1920 100 1.3304 2.9035 0.9856−1.6752 9.4732 0.0271 9.4417−9.5048 Table 7. Comparison of the calculated reaction rate constant k, standard deviation (SD), and confidence interval of the calculated reaction rate constant k based on the assumption of first and zero order reactions in a stainless steel capillary microreactor under reaction condition 3.
Reaction temperature (°C) k1 (10−3 s−1) SD 95% confidence interval of k1 k0 (10−3 mol/L·s) SD 95% confidence interval for k0 90 0.2082 0.0719 0.1967−0.2196 1.9032 0.0098 1.8875−1.9188 95 0.5695 0.4871 0.4920−0.6470 1.9032 0.0068 4.7644−4.7861 100 0.9690 0.1201 0.7778−1.1601 4.7752 0.0205 7.3518−7.4171 According to the Arrhenius equation, the relationship between the reaction rate constant and temperature can be expressed as Eqn (25).
$ \mathrm{ln}k=\mathrm{ln}A-\dfrac{{E}_{a}}{RT} $ (25) A is the prefactor, Ea is the activation energy of the reaction, and the fit of lnk to 1/T is shown in Fig. 8.
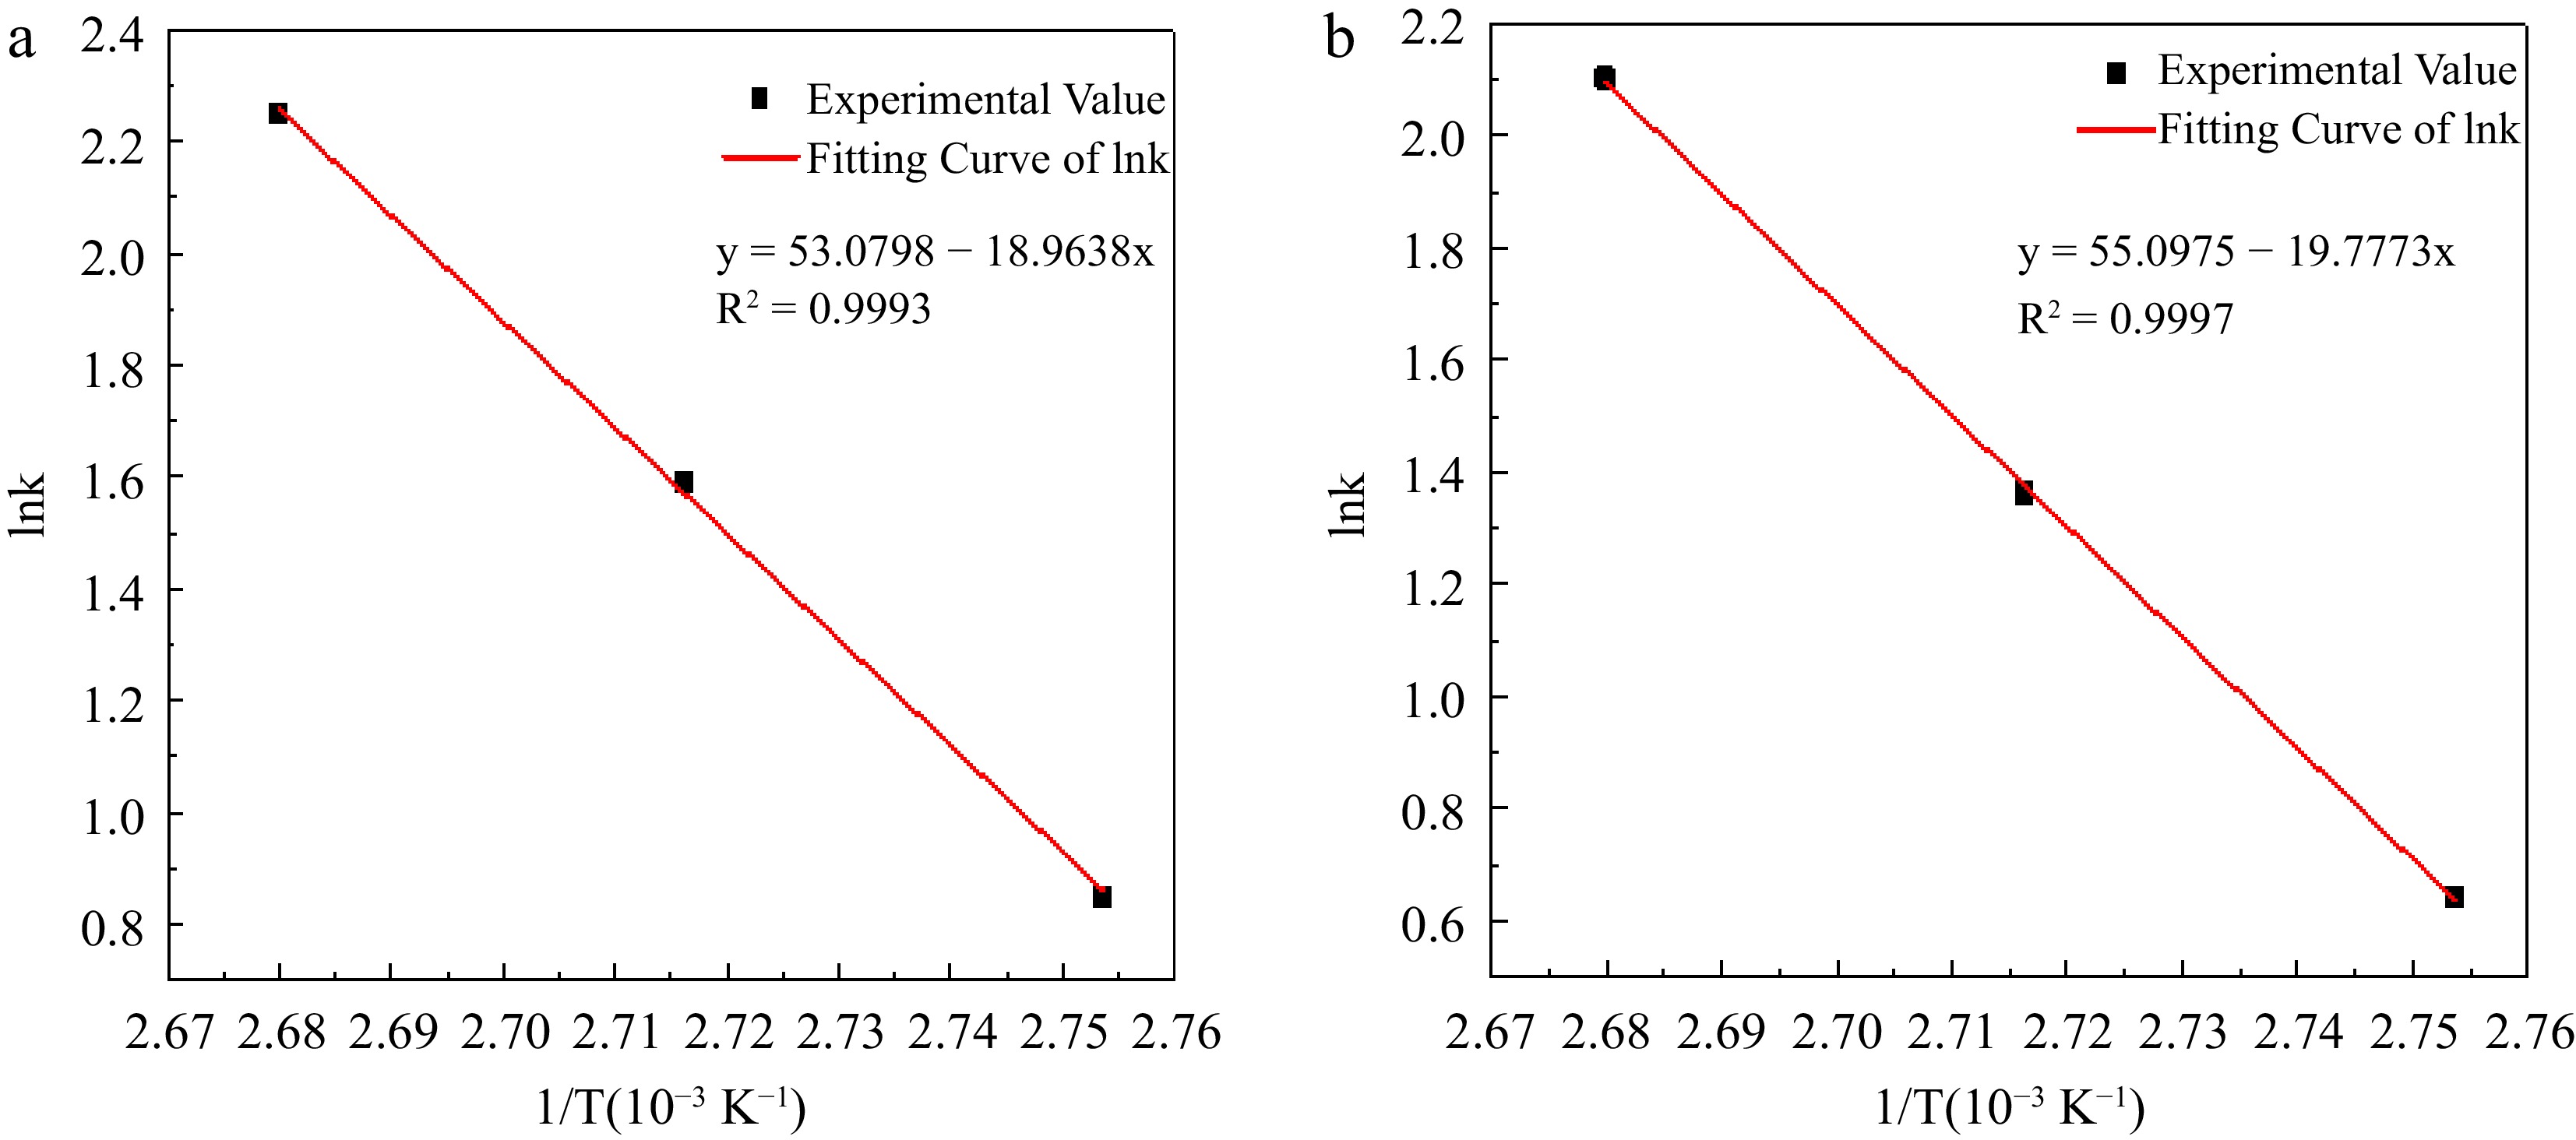
Figure 8.
Experimental value and fitting curve of lnk to 1/T in hydrogen peroxide decomposition. (a) Reaction condition 1; (b) Reaction condition 2.
The activation energy Ea of the H2O2 decomposition reaction under reaction condition 1 is calculated to be 157.665 kJ/mol from the slope of the straight line in Fig. 8, and the intercept is calculated to give a pre-finger factor A of 1.128 × 10²³ mol· L−1·s−1. The value of this activation energy is significantly higher than that obtained in Gaussian calculations and reaction calorimetry of H2O2 decomposition in the reaction system, because the addition of H2SO4 inhibits the H2O2 decomposition cycle, so that the value of the activation energy of its reaction is high. The activation energy Ea of the H2O2 decomposition reaction under reaction condition 2 is 164.428 kJ/mol, which is higher than that derived from reaction condition 1, indicating that the addition of the H2O2 stabilizer EDTA could be able to reduce the decomposition of H2O2 to a certain extent, and the intercept calculation yielded the finger forward factor A is 0.848 × 10²³ mol· L−1·s−1.
-
From the results in the previous section, it can be seen that although the addition of H2O2 stabilizer EDTA can improve the stability of hydrogen peroxide and reduce the temperature of MTSR, the reaction is still prone to thermal runaway, resulting in the violent decomposition of H2O2 and thus triggering the phenomenon of flushing material. Therefore, in order to further enhance the intrinsic safety of green synthesis process of adipic acid, the batch process of green synthesis of adipic acid is improved into a continuous flow synthesis process by utilizing the characteristics of microchannel reactor with small liquid holding capacity and excellent mass and heat transfer, with the aim of realizing intrinsic safety of the process.
In the process of the preliminary experimental exploration, it was found that under the conditions of atmospheric pressure and reaction temperature, the reaction material in the reaction tube is violently decomposed and gasification of the material, resulting in the residence time of the reaction is far less than the theoretical residence time. Increasing the residence time by increasing the reaction pressure and thus compressing the volume of gas produced by decomposition is a common solution. The ratio of bubbles to liquid in the tubes for different reaction pressures is shown in Fig. 9. Therefore, in this study, the reaction pressure of 5−7 MPa and the reaction temperature of 100 °C were chosen for the microchannel continuous flow synthesis experiments with different residence times.
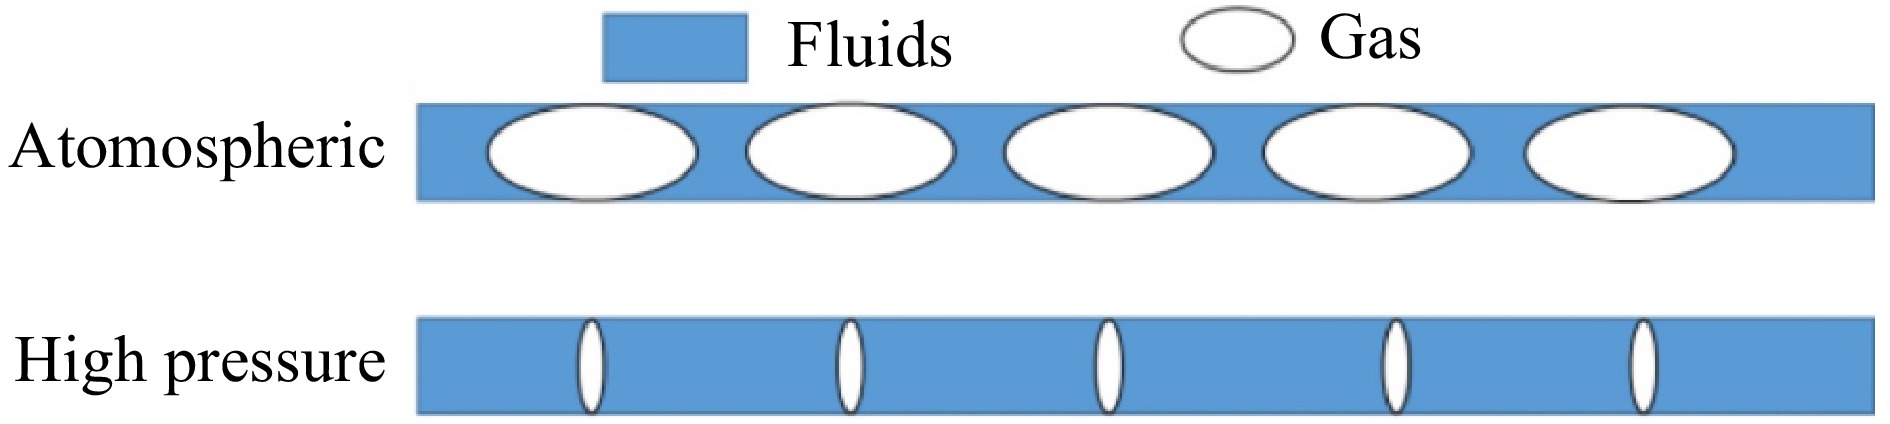
Figure 9.
Schematic diagram of gas to liquid ratio in pipelines.
It can be seen from Fig. 10 that with the reaction pressure increasing so that the gas produced in the pipeline is gradually compressed, the actual residence time of the reaction increases, and the yield of adipic acid also gradually increases. In addition, the actual residence time of the reaction is also influenced by the theoretical residence time, which is constantly increased to make the yield of adipic acid also increase gradually. Finally, the yield of adipic acid is 63.25% at 7 MPa reaction pressure and 30 min theoretical residence time, and the reaction time of the microchannel continuous flow experiment was greatly shortened compared with the reaction calorimetry time.
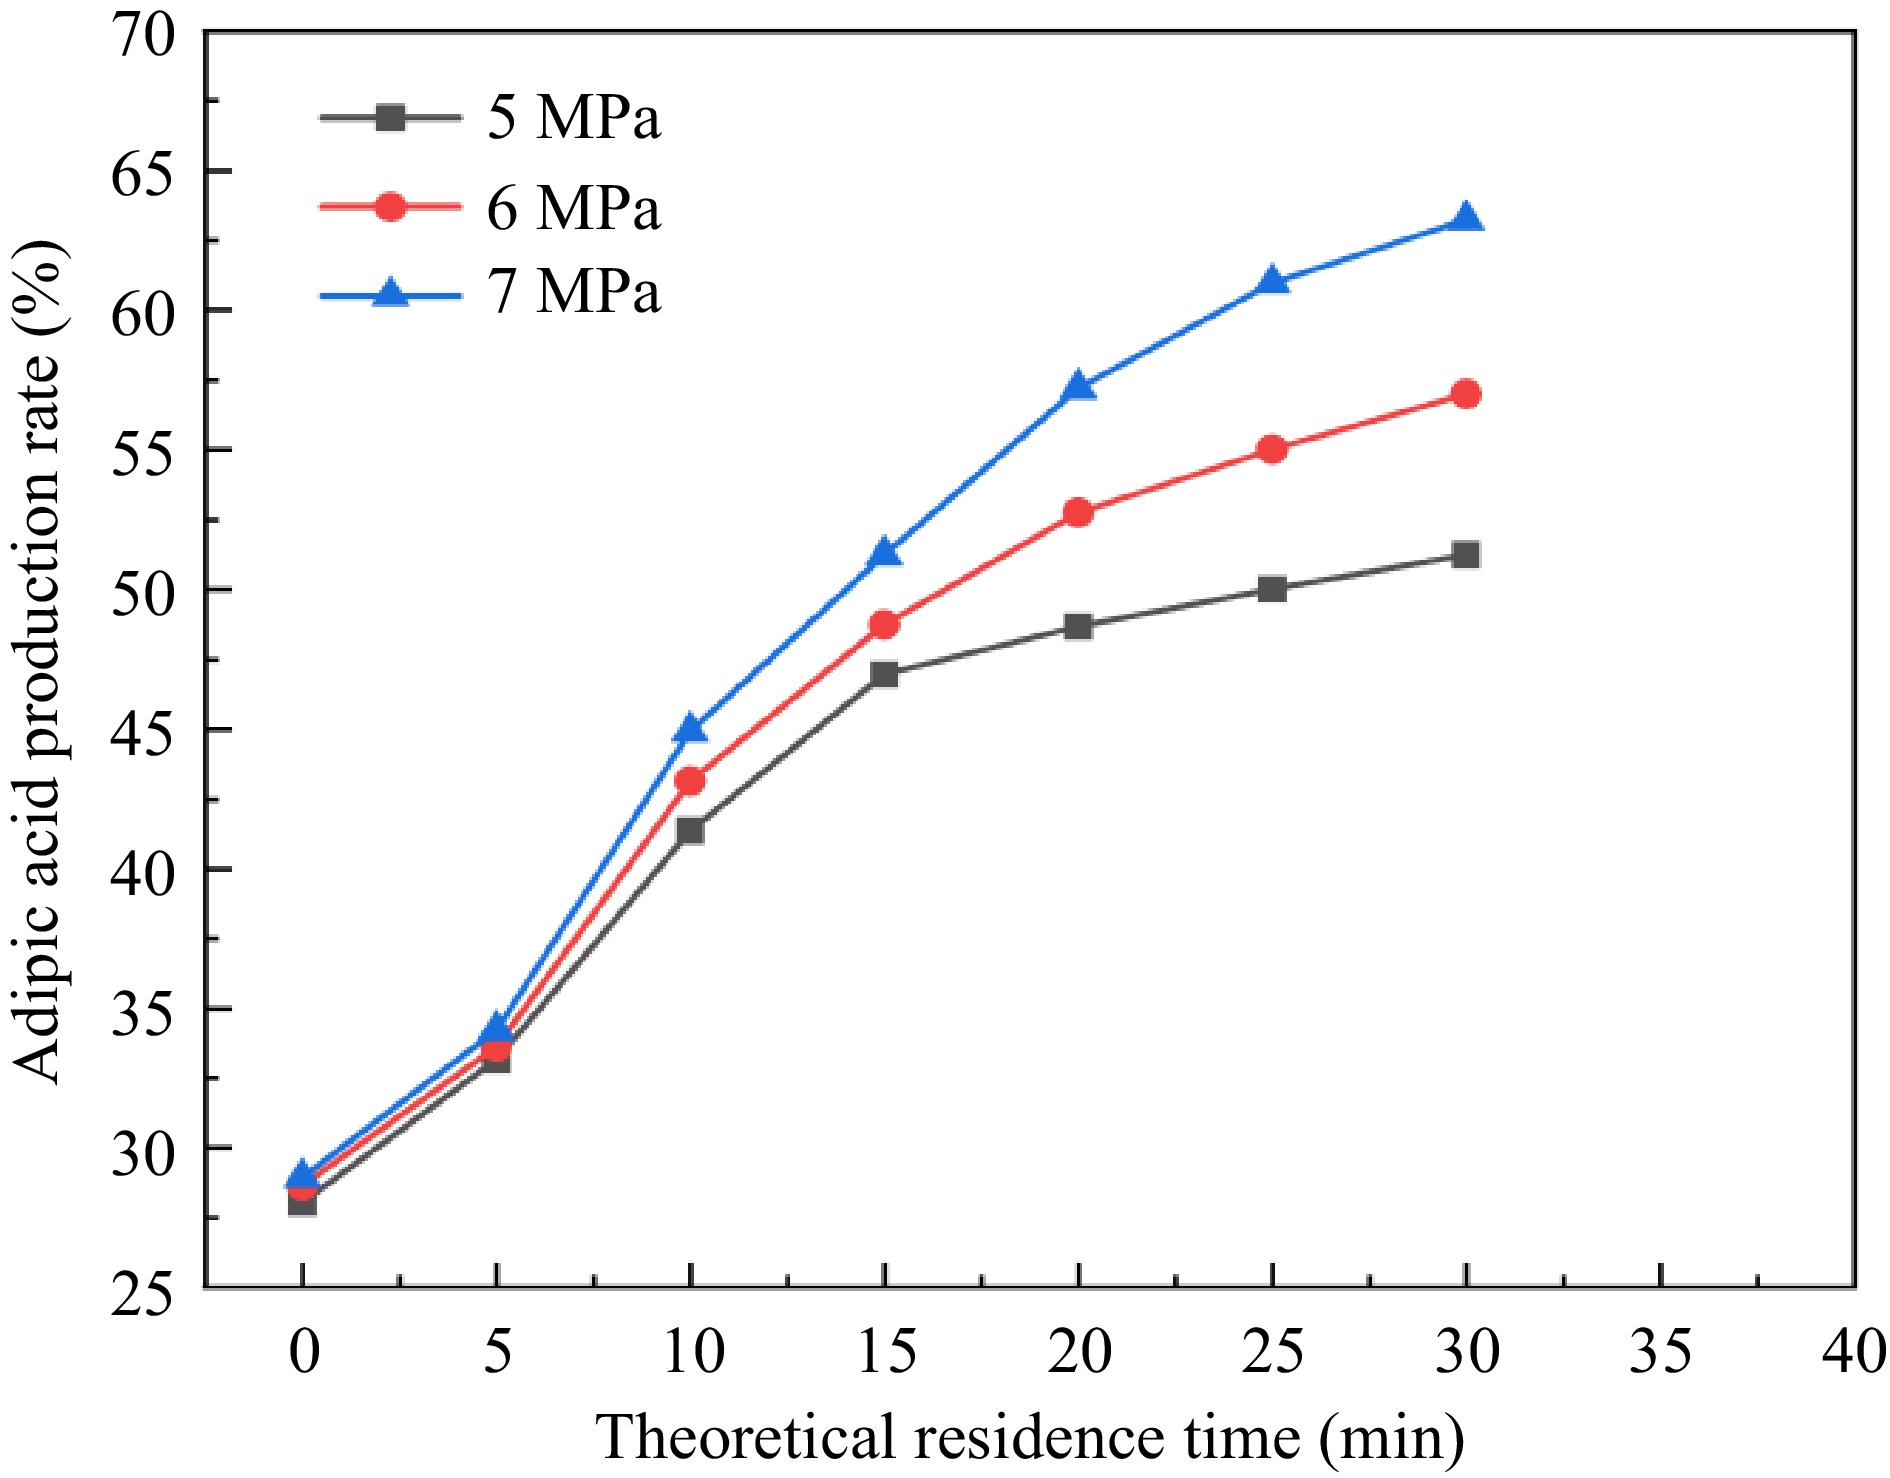
Figure 10.
Green synthesis yield of adipic acid under different pressures and residence times.
-
(1) Through the calorimetric experiments of adipic acid synthesis, the MTSR of phase A (isothermal stage at 73 °C) is 104.76 °C, and that of phase B (concentrated exothermic stage in the first 3 h at 90 °C) is 263.81 °C, which is reduced compared with that of the process without adding EDTA.
(2) Through the study of EDTA in continuous flow Na2WO4-catalyzed H2O2 decomposition, it is found that the decomposition of H2O2 increases with the increase of residence time and temperature, and the addition of EDTA can effectively reduce the decomposition. The activation energies for the decomposition of 30 wt.% H2O2 with and without EDTA in stainless steel capillary microchannels are 164.428 and 157.665 kJ/mol, respectively.
(3) Continuous flow synthesis process of adipic acid in a homemade high-pressure microchannel reactor, obtaining the highest yield of adipic acid up to 63.25%. The microchannel continuous flow process shortened the reaction time of the intermittent experiment in terms of reaction time, but the yield is significantly lower than that of adipic acid in the intermittent experiment of 82.79%, mainly because of the waste of reaction materials and shortening of reaction time due to the violent decomposition of H2O2. It is recommended to pay attention to H2O2 decomposition when subsequently optimizing the continuous flow process.
-
The authors confirm contributions to the paper as follows: study conception and design: He W, Ni L; data collection: Li Y; analysis and interpretation of results: He W, Ni L; draft manuscript preparation: Li Y, Zhu W, Ni L. All authors reviewed the results and approved the final version of the manuscript.
-
All data generated or analyzed during this study are included in this published article.
This work is supported by the National Natural Science Foundation of China (52274209).
-
The authors declare that they have no conflict of interest.
- Copyright: © 2023 by the author(s). Published by Maximum Academic Press on behalf of Nanjing Tech University. This article is an open access article distributed under Creative Commons Attribution License (CC BY 4.0), visit https://creativecommons.org/licenses/by/4.0/.
-
About this article
Cite this article
He W, Li Y, Ni L, Zhu W. 2023. Effect of stabilizer EDTA on the thermal hazard of green synthesis process of adipic acid and development of microchannel continuous flow process. Emergency Management Science and Technology 3:22 doi: 10.48130/EMST-2023-0022 

Effect of stabilizer EDTA on the thermal hazard of green synthesis process of adipic acid and development of microchannel continuous flow process
- Received: 23 November 2023
- Accepted: 16 December 2023
- Published online: 27 December 2023
Abstract: In the green synthesis reaction of adipic acid, the oxidant H2O2 undergoes exothermic decomposition easily and the high exothermic amount of the reaction can easily lead to thermal runaway. This study carries out calorimetric experiments on the green synthesis reaction of adipic acid, studies the effect of the stabilizer ethylenediaminetetraacetic acid (EDTA) on the safety of the synthesis reaction, and further explores the effect of EDTA on the Na2WO4-catalyzed decomposition reaction of H2O2 under the conditions of continuous flow, and develops the microchannel continuous flow process of green synthesis of adipic acid containing EDTA, in order to provide theoretical support for the improvement of intrinsic safety of green synthesis of adipic acid.
-
Key words:
- Green synthesis /
- Adipic acid /
- H2O2 stabilizer /
- Microchannel reactor