


-
In recent years, great attention has been paid by consumers to meat safety[1,2]. In some countries, a high rate of pathogens can be detected in fresh meat or carcasses, especially of Staphylococcus, Salmonella, Shigella, Enterococci, Escherichia, Acinetobacter and Corynebacteriwn spp. on pork carcasses or cuts[3−7], Clostridium, Brochothrix thermosphacta, Lactic acid bacteria and Pseudomonas spp. on beef carcasses and primals[8]. It has been of great concern to control the contamination of spoilage and pathogenic microorganisms during the whole chain of meat production.
Microbial contamination originates in farms and is transferred from animals to carcasses in the slaughter process and increases in meat in boning rooms and sale markets[4,9]. Slaughtering procedures have been shown to be critical points for the microbial contamination of carcasses, particularly the following areas: scalding tank, scraper, dry polisher blades band-saw and butcher's hands which can harbour Enterobacteriaceae and Escherichia coli populations[10,11]. Chilling and fabrication steps also give higher risk to carcass contamination[12−14] due to high air contamination from workers and aerosol[15]. However, postmortem chilling is a very important step to reduce the levels of Listeria monocytogenes and Salmonella Typhimurium[16]. Cutting and deboning operations may introduce Pseudomonas spp. to the surface of meat cuts[17]. Microbial contamination varies with meat companies and packaging. Pseudomonas was dominant in wrapped meat but Brochothrix was dominant in modified atmosphere packed meat[18]. Microbial contamination also shows great variations among different parts of pig carcasses[19]. Li et al. found that Pseudomonas spp. and Brochothrix thermosphacta were the dominant microorganisms in tray-packed pork while Lactobacillus spp. was dominant in vacuum-packed meat[20]. Jiang et al. applied PCR-DGGE to identify eight lactic acid bacteria in vacuum-packaged pork during storage, three of which (Carnobacterium divergens, Lactobacillus sakei, and Lactococcus piscium) were dominant at the end of storage[21]. In fact, transportation from the meat company to market is also very important for contamination due to the changes in environmental temperature and humidity and human handling during transfer. However, few data is available regarding this.
The methodologies for the study of microbial changes alongside meat production are important to realize precise control of microorganisms. Traditional culture-dependent methods are good, but they provide very limited information and the accuracy may be affected by sampling techniques[22,23]. Ghafir and Daube found a lower recovery of E. coli counts (36%) and aerobic plate counts (81%) for the swabbing method compared with the destructive method, but no significant difference existed between the sampling methods in the recovery of Salmonella or Campylobacter[24]. In recent years, high throughput sequencing methods have been applied to check microbial changes in meat during storage without culture. Zhao et al. explored changes of microbial composition in vacuum-packed chilled pork during 21 days of storage using metagenomic sequencing, and found that the seventh day was a critical time point for microbial diversity[25]. Li et al. investigated changes of microbial populations during storage of unpacked chilled pork and found that the diversity of microbiota decreased with storage time[26]. Peruzy et al. applied 16S rRNA gene sequencing to characterize the microbial composition on the ham, back, jowl and belly of pork carcasses, and they found that Staphylococcus, Pseudomonas, and Escherichia coli were dominant[27]. Such methods have great potential for the analysis of microbial diversity and composition on meat.
In this study, we investigated changes in the microbiota diversity and composition on pig carcasses during cold-chain transportation of different distances (200, 300, 400, and 500 km), and correlations among air temperature and humidity in vehicles, the core temperature of pig carcasses and total colony counts.
-
This study was performed in summer. One hundred pig carcasses were hung in a cold-chain cabinet and transported to 200, 300, 400, or 500 km destinations (ten vehicles for each distance). The temperature and humidity in the vehicle was measured using a GPRS remote temperature and humidity recorder connected with four temperature probes and four humidity probes (Renke, Shandong, China). The temperature probes have a range from −40 to 80 °C with an accuracy of ± 0.3 °C. The humidity probes have a range from 0 to 100% with an accuracy of ± 2%. The temperature and humidity data were acquired during the whole transportation at intervals of 5 s. The probes were fixed at three different places under the top of the vehicle. The temperature of pig carcasses was monitored by inserting a temperature logger (Yuanhengtong, Shenzhen, China) into the semimembranosus muscle, which has a range from −40 to 125 °C and an accuracy of 0.1 °C.
Microbial colony counting on the surface of pig carcasses
-
Samples for microbial colony counting were obtained from five sites of the carcasses as shown in Fig. 1, (inside the hind leg, outside the hind leg, abdominal cavity, inside the shoulder and outside the shoulder) before carcasses were loaded onto the vehicle, when the vehicle arrived at the transfer point, and at the market point. Sterile swabs containing peptone solution (0.15%) were used to wipe the pig carcass surface (100 cm2). In each refrigerated vehicle for the same transportation distance, 20 to 30 swab samples were collected at each sampling site. The experiments were repeated three times. Microorganisms were washed from swab samples in a stomacher (400, Seward, West Sussex, UK) for 1 min. Serial dilutions were prepared and plated onto Plate Count Agar (PCA, Land Bridge Company, China) plates to determine total aerobic plate counts (APC). The plates were incubated for 48 h at 37 °C. The number of microbes was expressed as log10 (counts).

Figure 1.
A diagram of sampling sites for microbial counting.
16S rRNA sequencing
-
Total genome DNA was extracted from the above-mentioned swabbed samples using the CTAB/SDS method. The swabbing microorganisms on the surface of pig carcasses were taken. Microbial DNA was extracted from samples using an EZNA DNA kit (Omega Bio-tek, Norcross, GA, USA) according to manufacturer's instructions. The V4-V5 region of the bacterial 16S ribosomal RNA gene was amplified by PCR (95 °C for 2 min, followed by 25 cycles at 95 °C for 30 s, 55 °C for 30 s, 72 °C for 30 s, and a final extension at 72 °C for 5 min) using primers 515F: 5'-barcode-GTGCCAGCMGCCGCGG)-3' and 806R: 5'-GGACTACHVGGGTWTCTAAT-3', where barcode is an eight-base sequence unique to each sample. PCR reactions were performed in triplicate in a mixture (20 μL) containing 4 μL of 5 × FastPfu buffer, 2 μL of 2.5 mM dNTPs, 0.8 μL of each primer (5 μM), 0.4 μL of FastPfu polymerase, and 10 ng of template DNA. Amplicons were extracted from 2% agarose gels and purified using AxyPrep DNA gel extraction kit (Axygen Biosciences, Union City, CA, USA) according to the manufacturer's instructions.
The DNA content was measured using a Nano-drop1000 spectrophotometer (Thermo Fisher Scientific, Waltham, MA, USA). The 16S ribosomal RNA gene was amplified using the primers: 515F 5'-GTGCCAGCMGCCGCGG-3′ and 806R 5'-GGACTACHVGGGTWTCTAAT-3′. All PCR reactions (30 μL) were carried out with 15 μL of Phusion high-fidelity PCR master mix (New England Biolabs, Ipswich, MA, USA), 0.2 μM of forward and reverse primers, and 10 ng template DNA. Thermal cycling consisted of initial denaturation at 98 °C for 1 min, followed by 30 cycles of denaturation at 98 °C for 10 s, annealing at 50 °C for 30 s, elongation at 72 °C for 60 s and maintenance at 72 °C for 5 min. An equal volume of 1X loading buffer containing SYB green was mixed with the PCR products. The samples were then loaded on 2% agarose gel and electrophoresis was performed. Bands with 400−450 bp were cut for further analyses. The PCR product mixture was treated with the GeneJET gel extraction kit (Thermo Scientific, Waltham, MA, USA). Sequencing libraries were generated using NEB Next®Ultra™ DNA library Prep kit for Illumina (NEB, Ipswich, MA, USA) following manufacturer's recommendations and index codes were added. The library quality was assessed on the Qubit@ 2.0 Fluorometer (Thermo Scientific, Waltham, MA, USA) and Agilent Bioanalyzer 2100 system (Santa Clara, CA, USA). Finally, the library was sequenced on an Illumina MiSeq platform (San Diego, CA, USA) and 250−300 bp paired-end reads were generated.
Paired-end reads from the original DNA fragments were merged using FLASH (
http://ccb.jhu.edu/software/FLASH/ ), which was designed to merge paired-end reads when at least some of the reads overlap the reads generated from the opposite end of the same DNA fragments. Paired-end reads was assigned to each sample according to the unique barcodes. Sequence analysis was performed by UPARSE software package using the UPARSE algorithms. In-house Perl scripts were used to analyze alpha (intra-samples) and beta (inter-samples) diversities. Sequences with ≥ 97% similarity were assigned to the same OTUs. Representative sequences for each OTU were picked and the RDP classifier was used to annotate taxonomic information for each sequence. Alpha diversity was evaluated by community richness (rarefaction curves, Chao1 and ACE indices) and diversity (Shannon index). Cladograms were applied to visualize the relative abundance of bacterial diversity from phylum to species. The beta diversity was evaluated by unweighted unifrac distance for principal coordinate analysis (PCoA) and unweighted pair group method with arithmetic mean (UPGMA) clustering under the QIIME software package.Metastats software was utilized to identify differences in the abundances of individual taxonomy between the two groups and LEfSe was used for the quantitative analysis of biomarkers within different groups.
Statistical analyses
-
Effects of transportation distance on the temperature and humidity of the vehicles, carcass temperature and total colony count on the carcass surface were evaluated by a multiple analysis of variance. Means were compared by Tukey's t test and the difference was considered significant if the P value was smaller than 0.05. Pearson's correlation coefficients were calculated. The analyses were performed under the SAS 8.1 software (SAS Institute, Cary, NC, USA), and the images were prepared by the GraphPad Prism 8 (GraphPad Software, La Jolla, USA). Principal component analysis was performed to identify the differences among samples and associations among measured variables using the SIMCA 14.1 software (Sartorius, Göttingen, Germany).
-
Although the air temperature was high in summer (29.46 ± 3.85 °C), the temperature and humidity in the refrigerated vehicles remained relatively constant during the pig carcass transportation to 200, 300, 400 and 500 km (Fig. 2a & b). The values at the end points of transportation were significantly different with the temperature being the greatest for the 500 km group but the smallest for the 400 km group (3.62 ± 0.21 °C vs. 3.34 ± 0.21 °C, P < 0.05, Table 1), while the humidity was the greatest for the 200 km group and the smallest for the 400 km group (91.10 ± 9.87% vs. 83.73 ± 5.26%, P < 0.05, Table 1).

Figure 2.
Changes in vehicle temperature and humidity and carcass temperature during transportation. (a) Vehicle temperature, (b) vehicle humidity, (c) carcass temperature.
Table 1. Temperature and humidity values in refrigerated vehicles.
Transportation distance /km Vehicle temperature/ºC Vehicle humidity/ºC Carcass temperature/ºC 200 3.49 ± 0.21ab 91.10 ± 9.87a 2.87 ± 0.54ab 300 3.42 ± 0.19ab 88.83 ± 5.70ab 3.04 ± 0.51ab 400 3.34 ± 0.21b 83.73 ± 5.26b 2.70 ± 0.43b 500 3.62 ± 0.21a 88.16 ± 5.81ab 3.25 ± 0.35a a,b Different letters in the same column indicate significant differences among distance groups (P < 0.05). The carcass temperature showed similar changes to the air temperature in refrigerated vehicles (Fig. 2c). At the end points, the carcass temperature was the greatest for the 500 km group but the smallest for the 400 km group (3.25 ± 0.35 °C vs. 2.70 ± 0.43 °C, P < 0.05, Table 1).
Changes of microbial colony counts on the surface of pig carcasses
-
At the starting point of transportation, the average colony forming count per square millimeters (CFU/cm2) on the surface of pig carcasses was 1.48 ± 0.19. The values were the greatest on the outside of the shoulder of pig carcasses and the smallest on the inside of the belly (P < 0.05, Fig. 3a), but there was no significant difference in microbial colony count among other sampling sites (P > 0.05, Fig. 3a).

Figure 3.
Microbial colony counts on the surface of pig carcasses. (a) Before transportation, (b) at the end point of transportation, (c−f) at the different market points. a,b Different letters indicate significant differences among groups (P < 0.05).
At the end points of transportation, the sampling sites showed significant difference between the inside of the belly and the outside of the shoulder when the carcasses were transported to 200 and 400 km (P < 0.05, Fig. 3c & e). The values of the 200 km group were similar to those of the starting point of transportation (P > 0.05), while the other groups were higher than the 200 km group (P < 0.05, Fig. 3d, e & f). These results indicate that short-time refrigerated transportation did not affect the microbial growth on the surface of pig carcasses.
At the market points, the microbial colony counts on the surface of cuts were not significantly different (P > 0.05, Fig. 3b). The values were 1.96 ± 0.27, 2.38 ± 0.20, 2.35 ± 0.19 and 2.27 ± 0.36 log10(CFU/cm2) for the 200, 300, 400 and 500 km, respectively.
Changes of microbiota composition on the surface of pig carcasses
-
A total of 3,982,386 reliable reads were obtained. The PCA scores plot showed that the first two principle components accounted for 58.45% of the total variance among the samples. The first principal component reflected the variation of transportation distance, and the second principal component indicated the variation of samples within the same distance group (Fig. 4). The samples in the starting point group (T0km) were well separated from other samples, indicating that the microbiota composition on the surface of pig carcasses underwent a significant change during refrigerated transportation and subsequent handling. The samples in the end point of transportation groups (T200km-a, T300km-a, T400km-a, and T500km-a) remain similar within the group but show a good separation from the samples of the market point groups (T200km-b, T300km-b, T400km-b, and T500km-b). For the samples in the market point groups, the 200 km and 400 km groups (T200km-b, T400km-b) are well separated from the 300 km and 500 km groups (T300km-b, T500km-b). This indicates that carcasses could be contaminated during transfer at the end points of transportation and the market points.

Figure 4.
PCA scores plot of samples. T0km, the start point of transportation; T200km-a, T300km-a, T400km-a, T500km-a, the end points of 200, 300, 400 and 500 km transportation; T200km-b, T300km-b, T400km-b, T500km-b, the market points after 200, 300, 400, and 500 km transportation.
On the phylum level, Proteobacteria, Firmicutes, Bacteroides, and Actinomycetes are the predominant bacteria in all samples (Fig. 5a). At the start point, the T0 km samples had high relative abundance of Proteobacteria, Bacteriodes, Firmicutes and Actinomycetes. In addition, three samples had a high relative abundance of Fusobacteria. At the end point of transportation, the relative abundance of Proteobacteria and Firmicutes increased compared with T0km samples, and Proteobacteria was dominant. The relative abundance of Actinobacteria decreased slightly in the 200, 300 and 400 km samples. Compared with the samples at the end points of transportation of each distance, the samples at the marketing points had lower relative abundance of Actinobacteria. On the other hand, the relative abundance of Proteobacteria increased significantly (Fig. 5a).
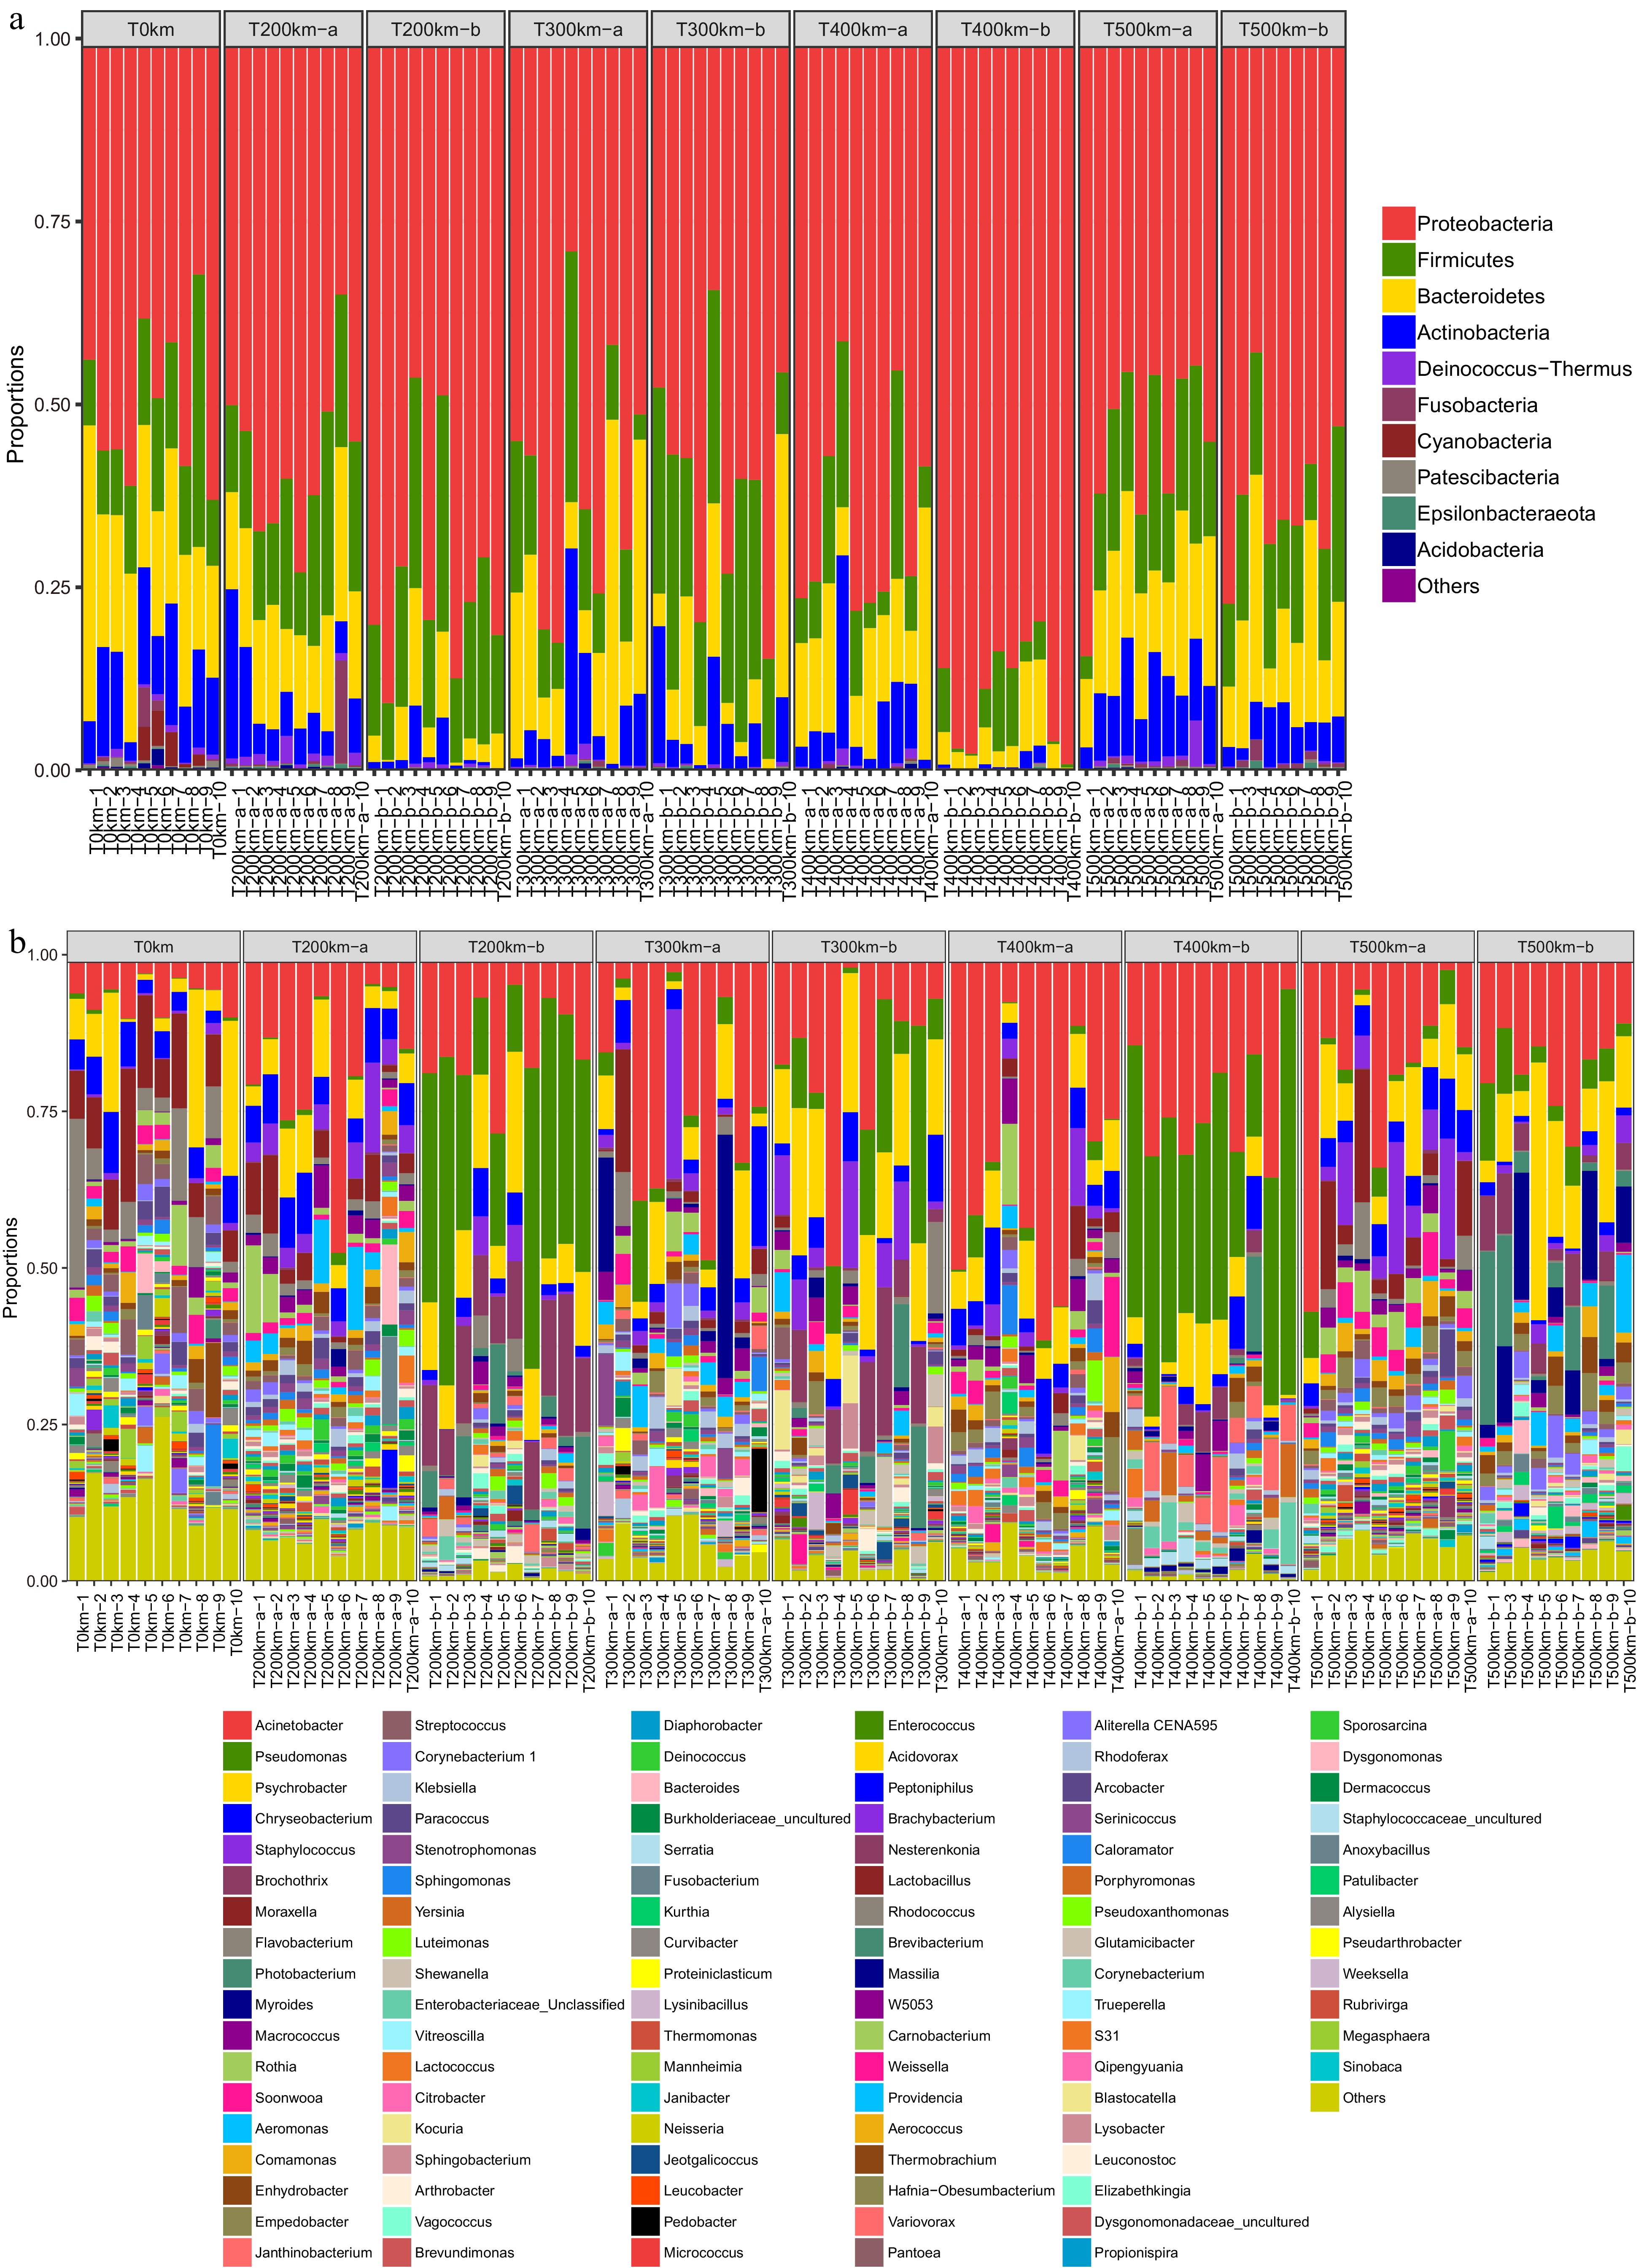
Figure 5.
Microbial composition in samples. (a) Phyla; (b) genera. T0km, the start point of transportation; T200km-a, T300km-a, T400km-a, T500km-a, the end points of 200, 300, 400 and 500 km transportation; T200km-b,T300km-b, T400km-b, T500km-b, the market points after 200, 300, 400, and 500 km transportation.
On the genus level, Acinetobacter, Pseudomonas, Psychrobacter, Chryseobacterium, Staphylococcus, Brochothrix, Moraxella, and Flavobacterium were the predominant bacteria (Fig. 5b). Acinetobacter, Psychrobacter, Chryseobacterium, Staphylococcus, Brochothrix, Morexella, and Flavobacterium were dominant in the T0km samples. The relative abundance of Acinetobacter increased significantly and Psychrobacter was also highly abundant in T200km-a and T300km-a samples. At the market points, the diversity of microbiota decreased significantly, but the relative abundance of Acinetobacter and Pseudomonas increased substantially. In the T200km-b and T400km-b groups, Acinetobacter and Pseudomonas account for 75% of the total abundance of microbiota. In the T300km-b samples, the relative abundance of Acinetobacter, Pseudomonas, and Psychrobacter was higher. In the T500km-b samples, Acinetobacter and Psychrobacter were highly abundant. Notably, Pseudomonas is the main environmental polluting bacterium. During carcass transportation, meat handling and storage, the microbiota dynamically changes. This phenomenon is consistent with the findings of Zhao et al.[25].
LDA analysis showed that the relative abundance of Proteobacteria was high at the starting point and significantly decreased at the end points of transportation (Supplemental Fig. 1a). Compared with the samples at the end points of transportation, the samples at the market points had different relative abundance of Proteobacteria and Firmicutes (Supplemental Fig. 1b). The microbiota composition in T200km-a and T400km-a samples was quite different from that in the T0km samples.
-
Humidity and temperature are very important to ensure food quality and safety, in particular to inhibit the growth of bacteria[28−31]. Cold chain, along with proper humidity control and anti-condensation measures dramatically improve food safety, quality and shelf-life[32]. In the present study, the vehicle temperature and carcass core temperature of all distance groups were lower than 4 °C. The humidity in the vehicle increased gradually and then remained constant during transportation. The total colony count was positively correlated with the carcass temperature and the air temperature in the vehicle. And thus, high temperature and humidity will promote the growth of bacteria, while low temperature inhibits the growth of bacteria[23]. However, microorganisms active at low temperatures during cold-chain transportation can still cause the spoilage of meat. In this study, the total colony count on the pig carcass surface was low at the start point, but increased with the extension of cold-chain transportation distance. In practice, chilled and fabricated meat has a higher risk of contamination than hot-boned meat in terms of mean aerobic plate counts and total coliform counts[12].
Sequencing results indicated that the microbial diversity was the greatest at the start point of transportation and decreased during transportation and subsequent transfer to the market. Low temperatures (4 °C) favored the growth of mesophilic, psychrophilic and psychrotrophic bacteria, including Lactobacillaceae, Enterobacteriaceae and Micrococcaceae. Fourteen different genera were represented in clones from fresh meat, with 36.5% of the clones mostly resembling Acinetobacter and 17.3% resembling Staphylococcus and Macrococcus. This is in agreement with the results of Olsson et al. which stated that the predominant bacteria in chilled meat comprise of 44.3% Pseudomonas, 17.1% Aeromonas and 14.3% Acinetobacter[33].
In our previous study of vacuum-packed fresh pork, Micrococcaceae, Flavobacteriaceae, Enterobacteriaceae, Lactobacillaceae and Carnobacteriaceae were found to be the major spoilage microorganisms[25]. Li et al. identified 259 bacterial genera in chilled pork using 16S rRNA sequencing and found that Pseudomonas, Acinetobacter and Photobacterium were dominant after five days of storage[26]. Meat could be contaminated by pseudomonas and other bacteria during storage. Among these bacteria, some bacteria grow rapidly, inhibiting the growth of other bacteria, and become dominant bacteria. In this study, Acinetobacter, Psychrophilus, Pseudomonas, Flavobacterium, Brochothri, Moraxella and other spoilage bacteria were observed in high relative abundance in all samples, suggesting the risk of pork spoilage was higher at the end of the cold-chain. Controlling storage temperature is vital in maintaining the quality and safety of perishable foods for consumption by inhibiting the growth of aerobic spore-forming bacteria[34]. During transportation and storage, spoilage microorganisms consume nutrients in meat to produce metabolites to cause spoilage[35]. The type of meat spoilage depends on what spoilage bacteria dominate the competition. In the present study, the relative abundance of Pseudomonas was high in meat samples at the market points. Pseudomonas is an aerobic gram-negative bacterium, existing extensively in fresh water, soil and other environments. This bacterium has a high metabolic and physiological diversity, strong environmental adaptability, a short generation cycle, and strong reproduction ability[36]. Pseudomonas decomposes carbohydrates and amino acids in meat, and produces volatile and non-volatile metabolites including esters, ketones, alcohols, aldehydes, organic acids, sulfur compounds and amines, causing discoloration, stickiness and off-flavor of meat. Temperature is an important environmental factor regulating the growth of Pseudomonas which can endure low temperatures (4 °C)[37]. Therefore, the hygienic conditions of cold-chain transportation and market places should be improved to avoid contamination by Pseudomonas. Additionally, the vehicle temperature and carcass core temperature during cold-chain transportation must be strictly controlled to avoid temperature fluctuations to inhibit the growth of Pseudomonas.
In addition, on the same carcasses, the outside seems to be contaminated more seriously than the inside. This was confirmed by Zweifel, Fischer and Stephan as they reported that the outside of pig carcasses tended to yield higher total viable counts[38].
-
The air temperature and humidity of vehicles, and the carcass temperature was relatively constant during cold-chain transportation. The total colony counts showed significant differences among samples sites on the surface of pig carcasses at the start and end points of cold-chain transportation, and increased with the transportation distance from 200 km to 400 km. During transportation, microbial diversity on the carcass surface decreased. Acinetobacter, Pseudomonas, Brochothrix, and Moraxella were dominant microorganisms.
This study was supported by Ministry of Agriculture and Rural Affairs and Ministry of Finance (CARS-35).
-
The authors declare that they have no conflict of interest.
- Supplemental Fig. S1 Cladograms showing microbiota differences among the starting point, the end points of transportation, and the marketing points. T0km, the starting point of transportation; T200km-b, T300km-b, T400km-b, T500km-b the end points of 200, 300, 400 and 500 km transportation; T200km-b, T300km-b, T400km-b, T500km-b the marketing points after 200, 300, 400, and 500 km transportation.
- Copyright: © 2021 by the author(s). Published by Maximum Academic Press on behalf of Nanjing Agricultural University. This article is an open access article distributed under Creative Commons Attribution License (CC BY 4.0), visit https://creativecommons.org/licenses/by/4.0/.
-
About this article
Cite this article
Wu J, Li R, Zhang M, Shan K, Jia X, et al. 2021. Microbiota changes on the surface of pig carcasses during refrigerated transportation and marketing. Food Materials Research 1: 4 doi: 10.48130/FMR-2021-0004 

Microbiota changes on the surface of pig carcasses during refrigerated transportation and marketing
- Received: 30 November 2021
- Accepted: 23 December 2021
- Published online: 30 December 2021
Abstract: We investigated changes in the microbiota composition on the surface of pig carcasses during refrigerated transportation of different distances (200, 300, 400, 500 km) and further transferring to the market place. Microbial samples were obtained by sterile swabs at the starting point, the end points of transportation and the market points. Core temperature of pig carcasses, temperature and air humidity in refrigerated vehicles were also tracked. The air temperature and humidity in the refrigerated vehicles remained relatively constant during transportation. However, the air temperature and carcass temperature at the end points of transportation were the highest for the 500 km group and the lowest for the 400 km group (P < 0.05), while the air humidity was the highest for the 200 km group and the lowest for the 400 km group (P < 0.05). Microbial colony counts showed a slight increase during transportation and differed among five sampling points on the surface of pork carcasses with the highest for the outside of the shoulder and the lowest for the inside of the belly (P < 0.05). Microbiota composition changed greatly and Acinetobacter, Pseudomonas, Psychrobacter, Chryseobacterium, Staphylococcus, Brochothrix, Morexella, and Flavobacterium were the predominant genera. Pseudomonas was the most predominant during transportation.
-
Key words:
- Pork carcass /
- Microbiota /
- Transportation /
- Pseudomonas /
- Temperature