


-
Fruit ripening is a genetically programmed series of coordinated processes enabling the dispersion of seeds[1-4]. During this phase, several physiological changes occur, making the fruit more palatable and desirable by consumers, such as a progressive loss of firmness, the release of volatile organic compounds and the accumulation of a wide range of secondary metabolites[5, 6]. In climacteric fruit, such as apple, all these modifications are orchestrated by ethylene, a simple unsaturated hydrocarbon acting as a gaseous hormone in higher plants. Although ethylene is involved in the physiological regulation of several biological processes, its main role is the induction and control of the fruit ripening process[7, 8]. The biosynthetic pathway of ethylene (known as the Yang's cycle) takes place from methionine via the S-adenosyl-L-methionine (AdoMet)[9] and the action of two enzymes, such as ACC synthase (ACS) and ACC oxidase (ACO)[7, 10, 11]. Ethylene is then perceived by a family of membrane-localized receptors[12−15] enabling a downstream signal transduction operated by CTR1 and EIN2[16−18]. The ethylene signal is ultimately transducted to a family of transcription factors (EIN3, EILs and ERFs) that binding specific promoter genes activate a cascade of important ethylene related response[19, 20].
Although most of the fruit ripening modifications are dominated by ethylene and abscisic acid[2, 21, 22], an interesting possible crosstalk between ethylene and auxin has been recently proposed. Auxin is notably involved in the initial steps of fruit development, and levels of indole-3-acetic acid (IAA or free auxin) generally decline prior the maturation phase, in order to allow fruit ripening to commence[23]. After its synthesis, the auxin signaling involves a targeted degradation by 26S proteasome[24]. At low concentration, auxin stabilize the interaction between Aux/IAA and TIR/AFB that, together with the co-repressor TPL, repress the transcription of auxin response factors (ARFs). Increased level of auxin, instead, guides the Aux/IAA proteins to a 26S proteasome degradation releasing ARFs to trigger the activity of auxin responsive genes[25−28]. The homeostatic regulation of auxin is thereafter controlled either by a de-novo synthesis or through a conjugation/de-conjugation mechanism[29, 30] principally guided by the GH3 family proteins[31−35].
Evidence of a synergic crosstalk between auxin and ethylene have been recently presented. Ethylene can induce the auxin response in root elongation[36−39], and other important roles have been assigned to auxin also in preparing the fruit to ripen. In rin tomato mutant, the level of auxin was higher compared to its wild type, and increasing level of auxin were observed in concomitance with the production of ethylene during the ripening of tomato and peach[40−43]. Although the auxin-ethylene crosstalk during fruit ripening has been mainly investigated in these crops, the information on apple are still limited. Important studies reported that, similarly to rin tomato, in MADS8/9 (rin homolog) suppressed apple lines a high level of IAA was observed[44], and six genes belonging to both ARF and Aux/IAA families were expressed at the onset of ripening in fruit of 'Royal Gala' apple cultivar[45]. In the work of Tadiello et al.[46], it was also shown that exogenous application of 1-MCP in apple fruit, beside repressing ethylene-related genes, de-repressed and stimulated genes involved in auxin signaling (AUX/IAA) and transcription factors (mainly NAC domain and MADSbox).
In this work we presented a comprehensive analysis integrating hormonal and transcriptomic profiles addressed to investigate the auxin-ethylene crosstalk in three apple cultivars, illustrating a possible hormonal reprogramming taking place during the impaired postharvest ripening operated thorough an interference at the level of the ethylene receptors.
-
The fruit collected from 'Golden Delicious', 'Granny Smith' and 'Fuji' were initially employed to investigate the ethylene biosynthesis. Among the three cultivars, 'Golden Delicious' showed the highest ethylene production, with a peak of 56.09 μl kg−1 h−1 measured in 2W control stage (Fig. 1a). The cultivar 'Granny Smith' showed an intermediate profile between 'Golden Delicious' and 'Fuji'. In fact, the amount of ethylene produced by the fruit was comparable to 'Fuji' (with a maximum of 0.35 μl kg−1 h−1), but the pattern was similar to 'Golden Delicious', showing a peak at 2W control stage (Fig. 1b). 'Fuji', instead, showed the lowest amount for this hormone, with a maximum level of 0.152 μl kg−1 h−1, measured at H stage (Fig. 1c), that remained at a basal level over the entire hormonal monitoring. The same difference in ethylene production was observed also in the samples stored for 2 months at cold temperature (2M stage), with the highest ethylene production detected in 'Golden Delicious' (74.02 μl kg−1 h−1; Fig. 1d), and a lower level of ethylene for 'Fuji' and 'Granny Smith' (4.37 and 4, 54 μl kg−1 h−1, respectively; Fig. 1e & f). The production of ethylene resulted to be heavily impaired by the application of the ethylene competitor 1-MCP. Especially during the room temperature shelf-life ripening, the ethylene dynamics remained at a basal level (average of 0.11 μl kg−1 h−1 considering all the treated samples) indistinctively for the three cultivars. Similar values were also observed for the treated samples 'Fuji' and 'Granny Smith' after 2 months of cold storage, while 'Golden Delicious' showed a higher value (4.32 μl kg−1 h−1).
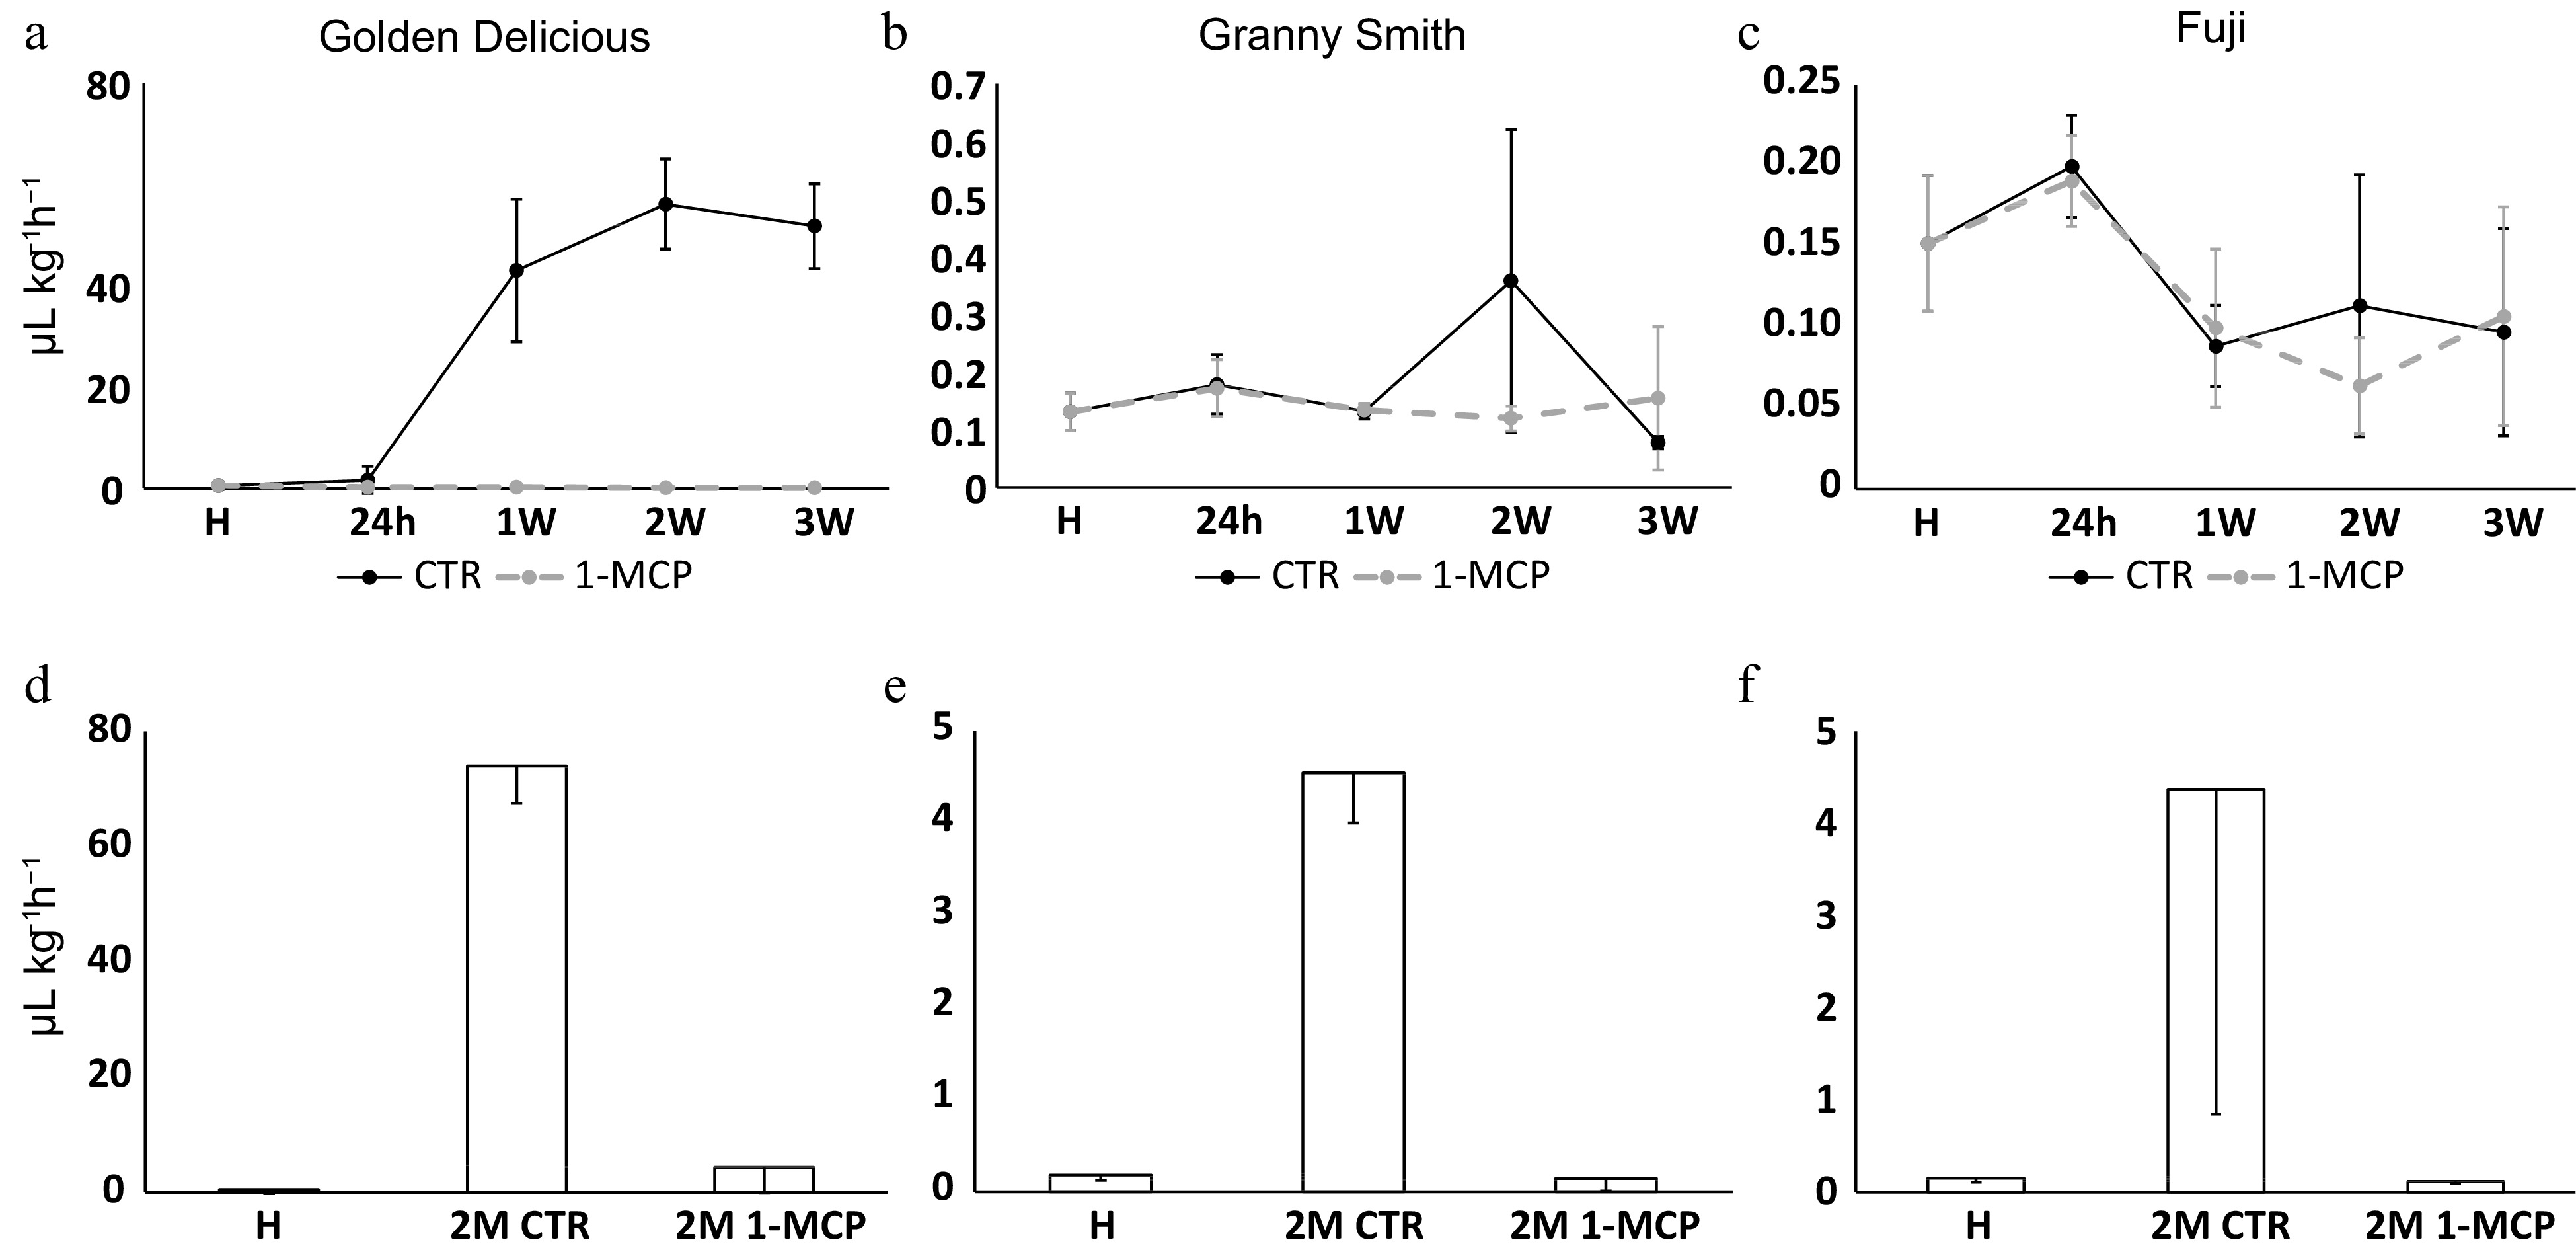
Figure 1. Ethylene production in 'Golden Delicious', 'Granny Smith' and 'Fuji' apple cultivars. Panels (a), (b) and (c) indicate the ethylene level monitored during the shelf-life ripening, while panels (d), (e) and (f) are for the samples assessed after 2 months of cold storage. The time points presented are: H (harvest), 24h (24 hours after harvest in room temperature shelf-life), 1-2-3W (for 7, 14 and 21 d after harvest in shelf life, respectively) and 2M (for 2 months in cold storage). In the upper panels, solid lines indicate the ethylene production in control samples (CTR), while the dashed lines are for samples treated with the ethylene competitor (1-MCP). In the lower panels, CTR and 1-MCP samples assessed after 2 months of cold storage are shown. For each point, bars indicate the standard deviation.
Monitoring of auxin over the postharvest ripening
-
In 'Golden Delicious' and 'Fuji' the accumulation of auxin showed a similar pattern over the time course. In the 24h stage, the higher amount of auxin was observed in the 1-MCP treated samples (2.28 and 2.96 ng g−1 of fresh weight for 'Golden Delicious' and 'Fuji', respectively; Fig. 2a & c) with regards to the control counterparts (1.63 and 2.42 ng g−1, respectively). From the samples collected after the 1W stage, an inversion in the accumulation pattern between control and 1-MCP treated samples was instead observed. In 'Granny Smith', although the highest concentration of auxin was assessed at 24h 1-MCP stage (2.55 ng g−1 of fresh weight; Fig. 2b) the level of this hormone remains higher compared to control samples until the end of the shelf-life ripening (2W stage). After 2 months of cold storage, the three cultivars showed a common behaviour, with a higher level of auxin in control samples with regards to 1-MCP (Fig. 2d, e & f).
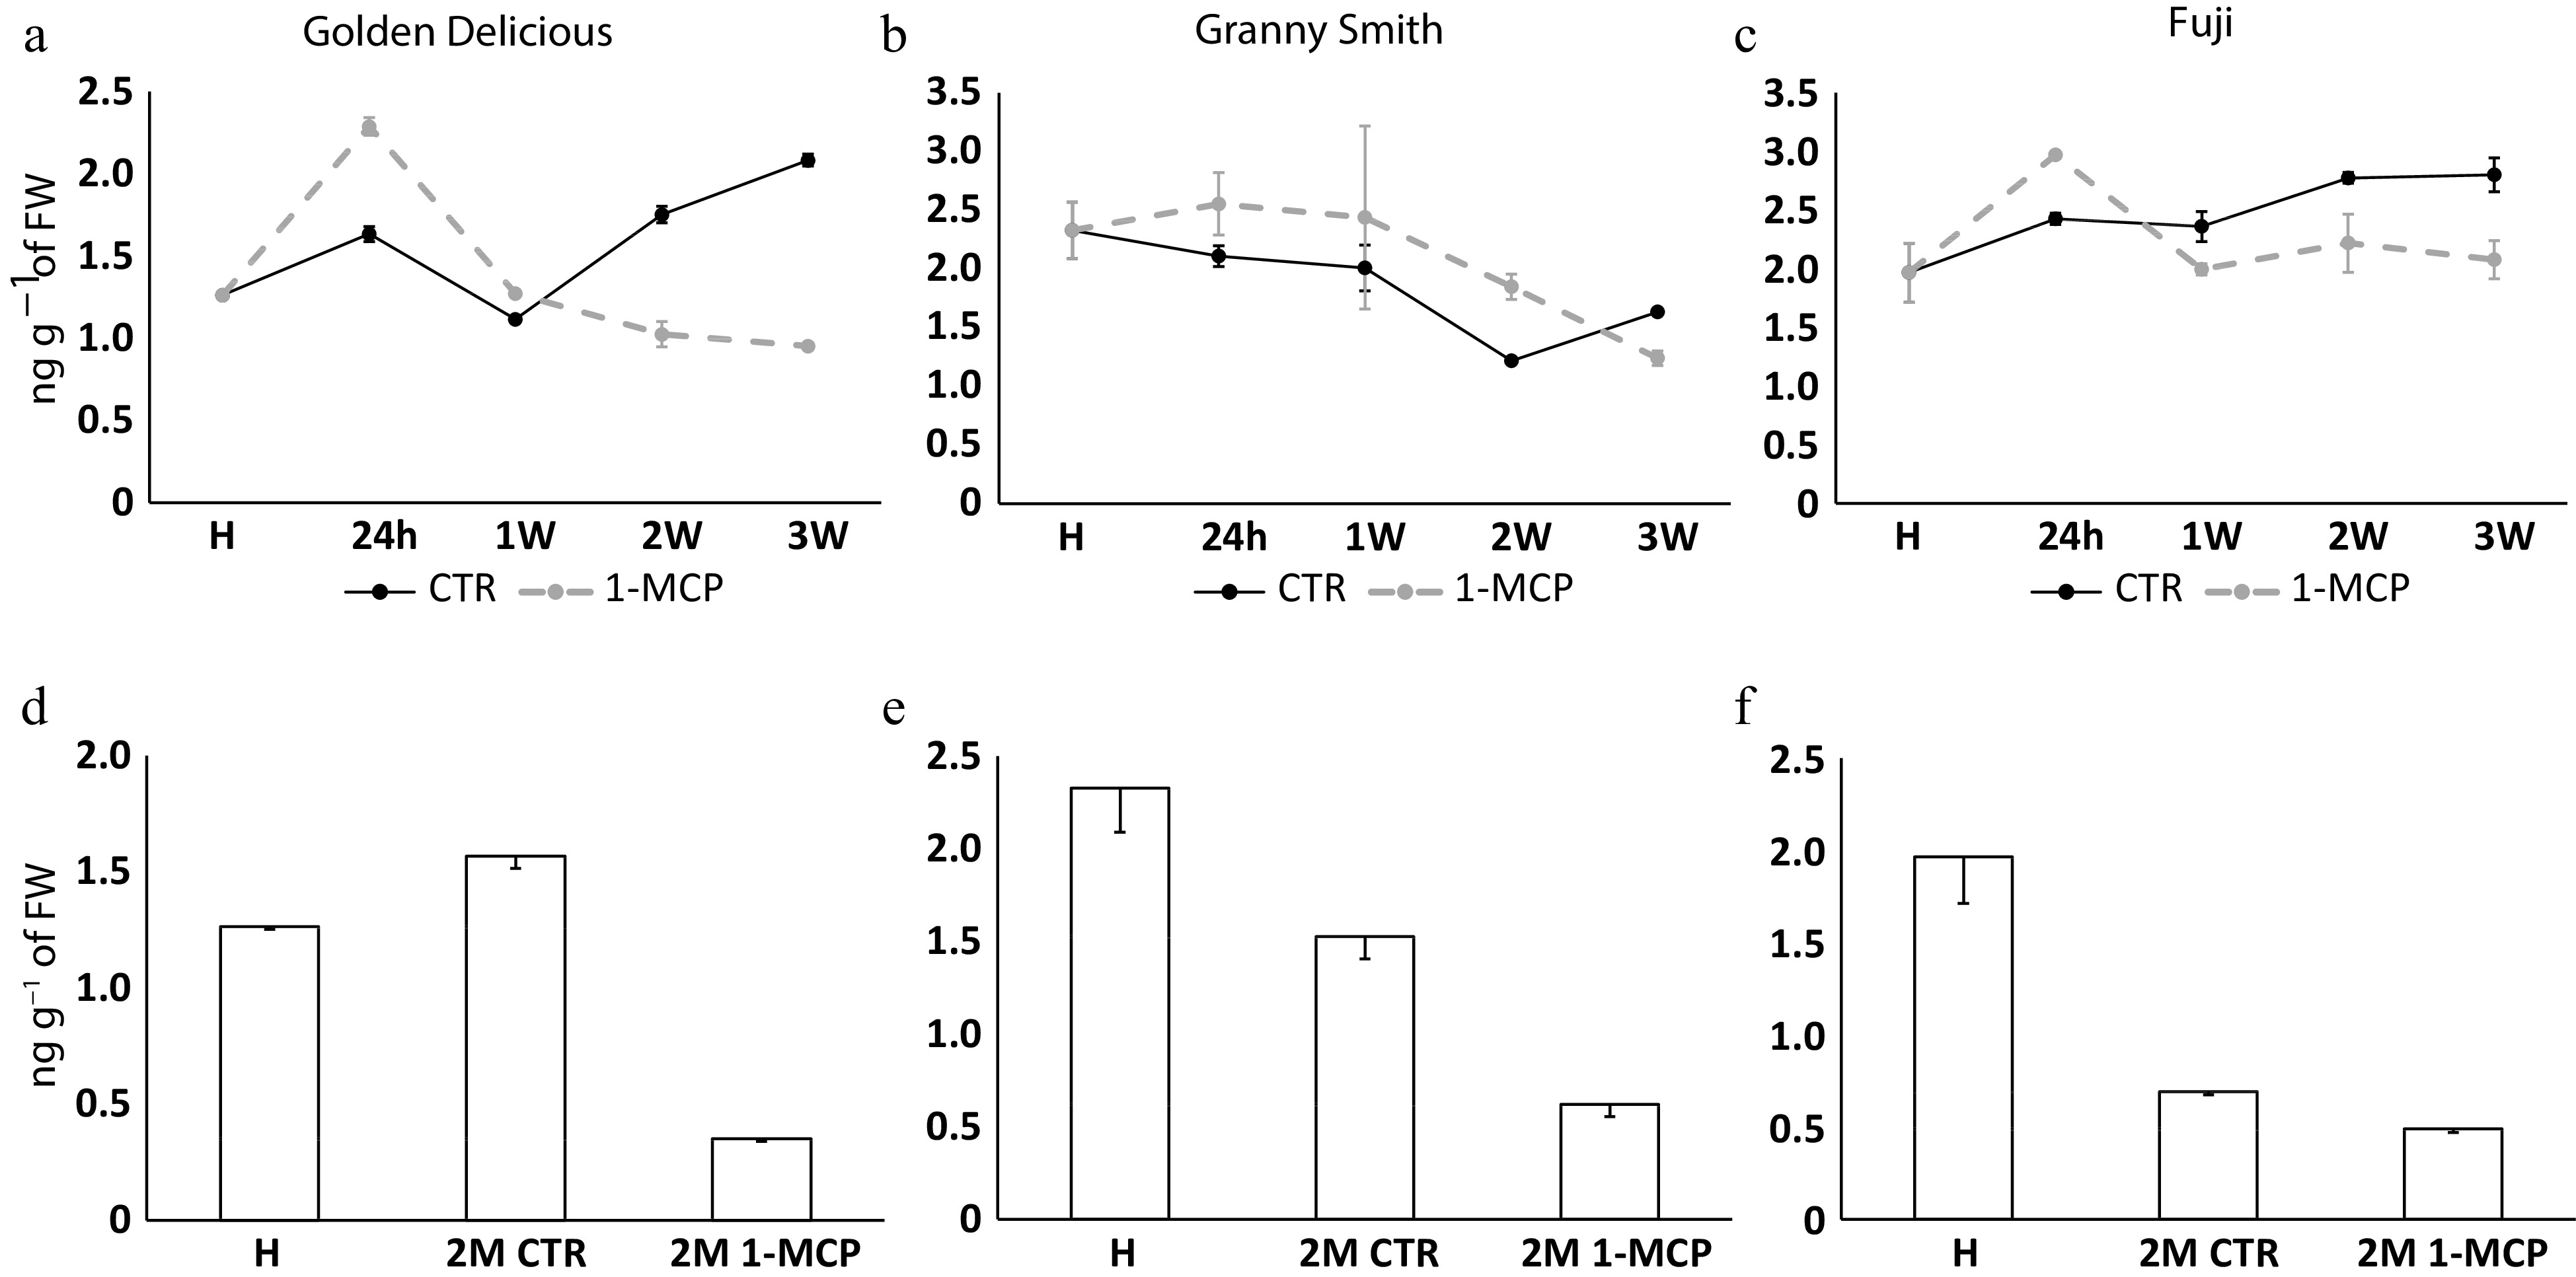
Figure 2. Auxin production in 'Golden Delicious', 'Granny Smith' and 'Fuji' apple cultivars. Auxin level assessed in the same experimental design as illustrated in Fig. 1. Auxin is quantified in ng g−1 of fresh weight. For each point, bars indicate the standard deviation.
Fruit quality assessment
-
Apples collected from each stage of the three cultivars were also used for a phenotypic investigation of specific fruit quality aspects, such as fruit texture, volatile organic compounds (VOCs) and secondary metabolites. The fruit texture variability for each of the three cultivars was assessed through a principal component multivariate statistical analysis (PCA) that revealed a specific phenotypic behaviour. 'Golden Delicious' showed the highest fruit texture variability (91.9% of the total variance, with PC1 77.8% and PC2 14.1%) and a clear distribution of the samples over the 2D-PCA plot, with samples collected at harvest (H) and treated with 1-MCP located in the negative area of PC1, while the control samples were instead located in the positive part of the PC1 area (Supplemental Fig. S1a). In the plot of 'Golden Delicious', it is also interesting to note that both sets of samples monitored over the postharvest shelf-life (control and treated) are ordinally distributed along the PC2. In the plot it is also depicted the difference observed between the two stages assessed after 2 months of cold storage. 'Granny Smith' showed a lower texture variability (87.2% of total variance, with PC1 and PC2 accounting for 69.7 and 17.5% respectively) with regards to 'Golden Delicious'. The distribution of the samples, although with a less clear pattern, is still consistent with the previous cultivar, with treated samples closely positioned to H in the PC1 negative area of the plot, exception made for the 2M 1-MCP treated samples. The behaviour of the control samples were different, which resulted in a more general distribution over the 2D-PCA plot, without showing any specific grouping (Supplemental Fig. S1b). The cultivar 'Fuji' was distinguished by the lowest texture variability, explaining 79.8% of the total phenotypic variance. The two PCs implemented to define the 2D plot showed a lower difference in variability explained with regards to the other two cultivars, with PC1 and PC2 accounting for 47.7% and 32.1%, respectively (Supplemental Fig. S1c). Also in this case, the treated samples were ordinally plotted in the negative PC1 quadrants, but distant from the H sample, while the control samples were positioned in the negative part of the PC2. The joint texture variability (accounting for 88.1% of the phenotypic variability) showed the contribution of PC1 (76.1%) in distinguishing the control samples of 'Golden Delicious' and PC2 (12%) to cluster all the samples of the other two cultivars together with 1-MCP treated fruit of 'Golden Delicious' (Supplemental Fig. S1d and detailed in Supplemental Fig. S2). The several texture profiles assessed for each cultivar showed a different correlation level with the amount of ethylene. The major change in fruit texture observed in 'Golden Delicious' was strongly and negatively correlated with the amount of ethylene produced during shelf-life ripening in the control sample (r: −0.98). 'Fuji' showed instead a positive relationship (r: 0.62), while 'Granny Smith' showed a lower correlation value between these two entities (r: 0.17), highlighting a non-linear relationship.
The different ethylene production observed among the three cultivars is consistent with the array of VOCs produced by the three cultivars. From the overall variability it is evident as the control samples of 'Golden Delicious' were also distinguished by a more intense VOC production with regards to the other samples (Supplemental Fig. S3a and Supplemental Fig. S4). In the 2D-PCA plot, beside the differences in magnitude of VOC emissions, it is also evident a distinct VOC fingerprinting. 'Granny Smith' and 'Fuji', although characterized by a lower production of VOCs, were distinctively plotted on two different quadrants in the PC1 positive part of the plot, with 'Fuji' located in the positive PC2 quadrant and 'Granny Smith' in the negative PC2 quadrant (with few exceptions), respectively. Especially for 'Golden Delicious', the general production of VOCs was heavily repressed by the application of the ethylene competitor 1-MCP.
With regards to the fruit quality assessment, we also investigated the phenolic compound profile. The multivariate analysis illustrated as the three cultivars were grouped over the PC1 axes, with 'Golden Delicious' and 'Granny Smith' mapped at the two extremes of the 2D-PCA plot and 'Fuji' in a more intermediate area of the plot (Supplemental Fig. S3b and Supplemental Fig. S5). In contrast to what was observed for the fruit texture and VOCs, the production of phenolic compounds was not affected by the exogenous application of 1-MCP.
Transcription dynamics among three apple cultivars
-
The genome-wide transcriptome analysis generated 2,206,508.7 total averaged number of reads among the 99 libraries, out of which 88% (1,939,656.79) were successfully mapped over the apple genome. From the analysis of transcripts, 'Golden Delicious' showed the highest number of differentially expressed genes (DEGs, 8,783), followed by 'Granny Smith' (7,899) and 'Fuji' (3,316). For each cultivar, the distribution of the several samples/cultivars based on the transcriptomic analysis was illustrated through a 2D-PCA plot (Fig. 3a−c). The transcriptomic variability captured by the first two PCs were homogeneous and consistently distributed across cultivars, with a range of variability explained spanning from 69.7% to 71.8%. For each cultivar, the PC1 clearly distinguished the control from the samples treated with 1-MCP. The PC2, instead, profiled the transcriptomic dynamics of the time course for the two sets of samples collected during the shelf-life storage and the 2 months cold storage. For each cultivar assessed in this survey, the transcriptome of 24h samples were more closely plotted to the harvest stage samples (H) than the other samples.
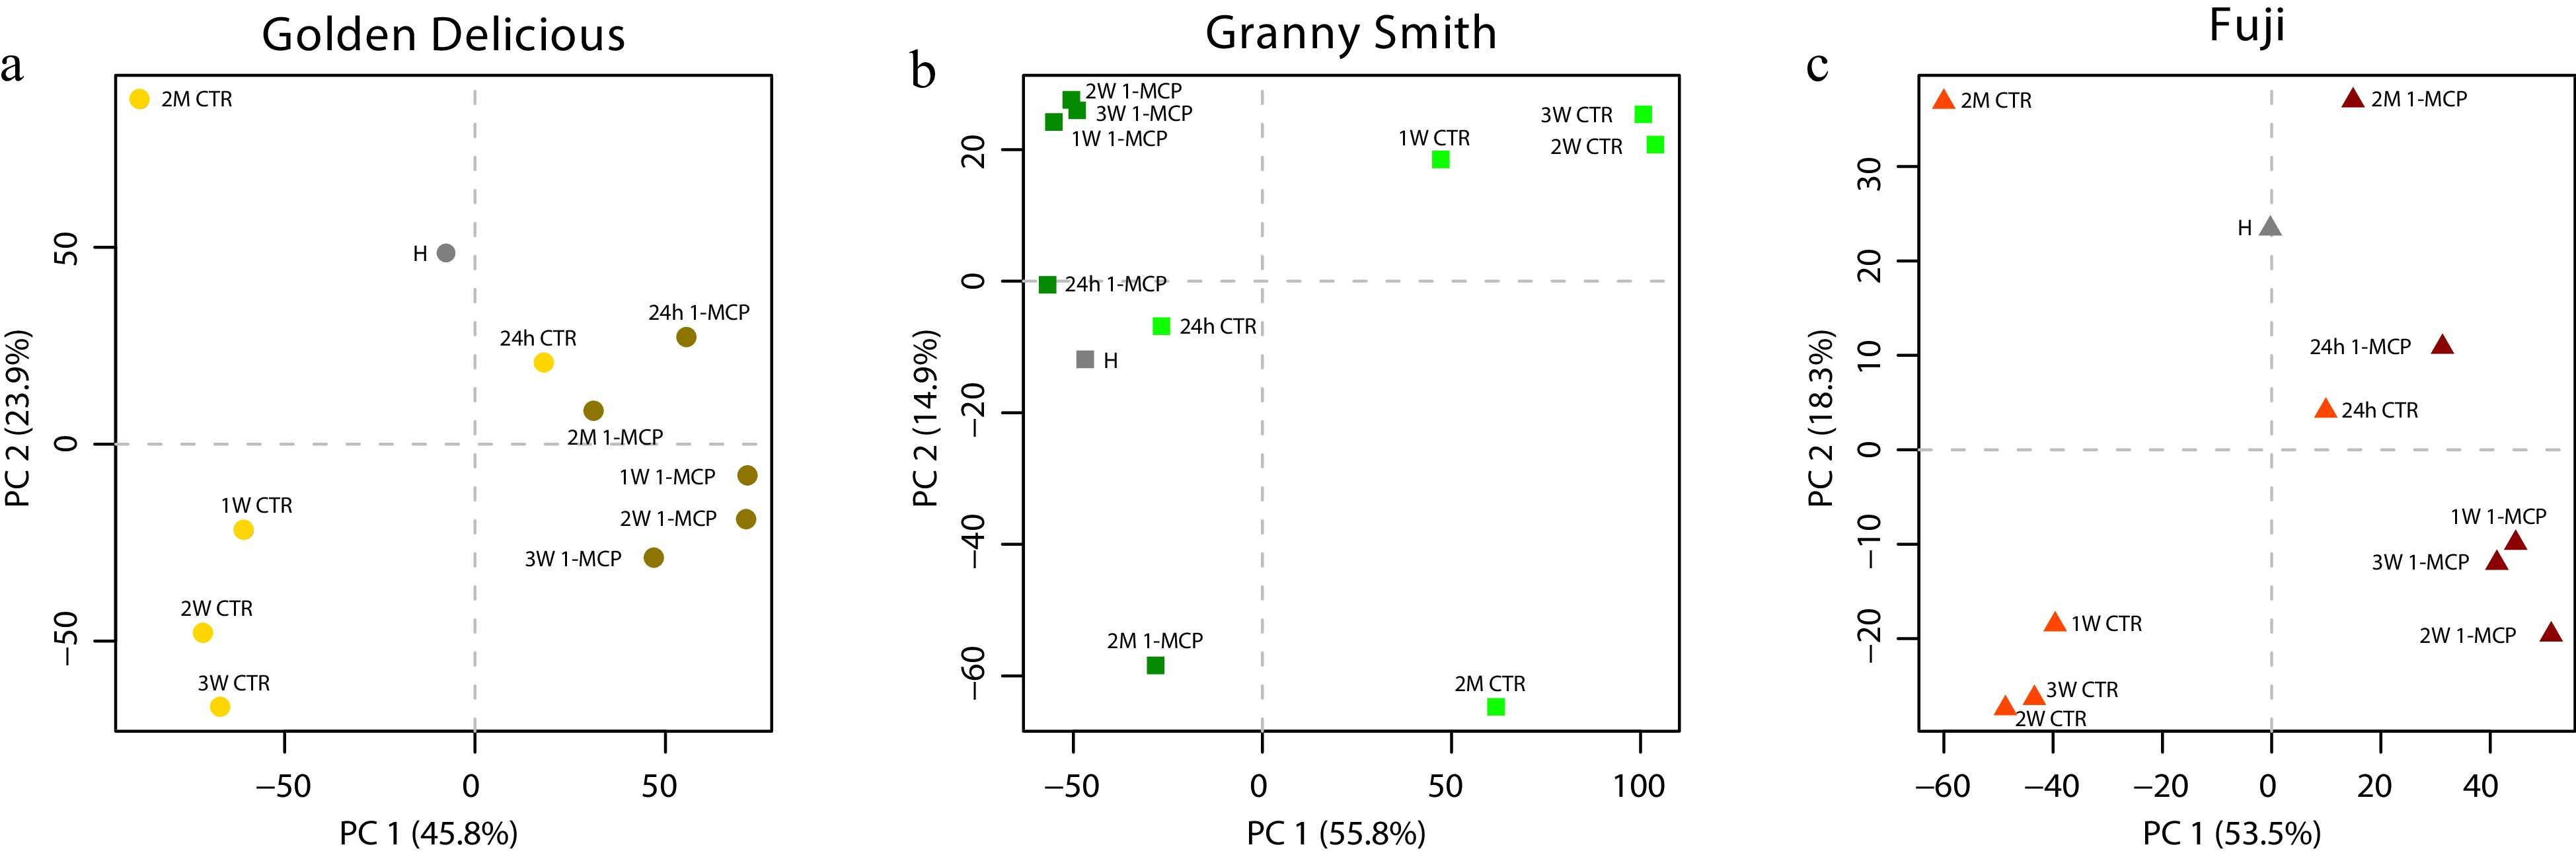
Figure 3. Multivariate PCA analysis of the apple transcriptome. Principal component analysis of the transcription variability captured by the analysis of the expression profile of the genes differentially expressed in 'Golden Delicious' (a), 'Granny Smith' (b) and 'Fuji' (c), respectively. The three cultivars are distinguished by different colors and shapes as follow: 'Golden Delicious' in yellow (●), 'Granny Smith' in green (■) and 'Fuji' in red (▲). CTR and 1-MCP samples are depicted with light and dark colors respectively. The harvest samples (H) are represented with grey color. The PCA plots were defined by the implementation of the first two principal components.
From the overall set of DEGs identified for each cultivar, we selected a subset of genes based on a fold change ratio established to magnify the role of 1-MCP in interfering with the normal ethylene perception and, therefore, with the ripening progression. To this end, the expression fold change was computed between the transcriptomic pattern of the three samples collected over the three weeks of shelf-life observation for control and 1-MCP treated samples, respectively. For the three cultivars, the new subsets of DEGs were selected with a Fold change ≤ 0.7 and ≥ 1.3, defined through the inspection of the normal distribution (Supplemental Fig. S6), and representing 34.8%, 34.9 and 34.1% of DEGs for 'Golden Delicious', 'Granny Smith' and 'Fuji', respectively. These elements were characterized by a higher magnitude in the transcriptional signature as response to the application of the ethylene competitor 1-MCP, as shown in the heatmap illustrated in Fig. 4. The genes included in these subsets of DEGs showed in fact a common expression within the three samples of the shelf-life ripening for both conditions, control and 1-MCP treated.
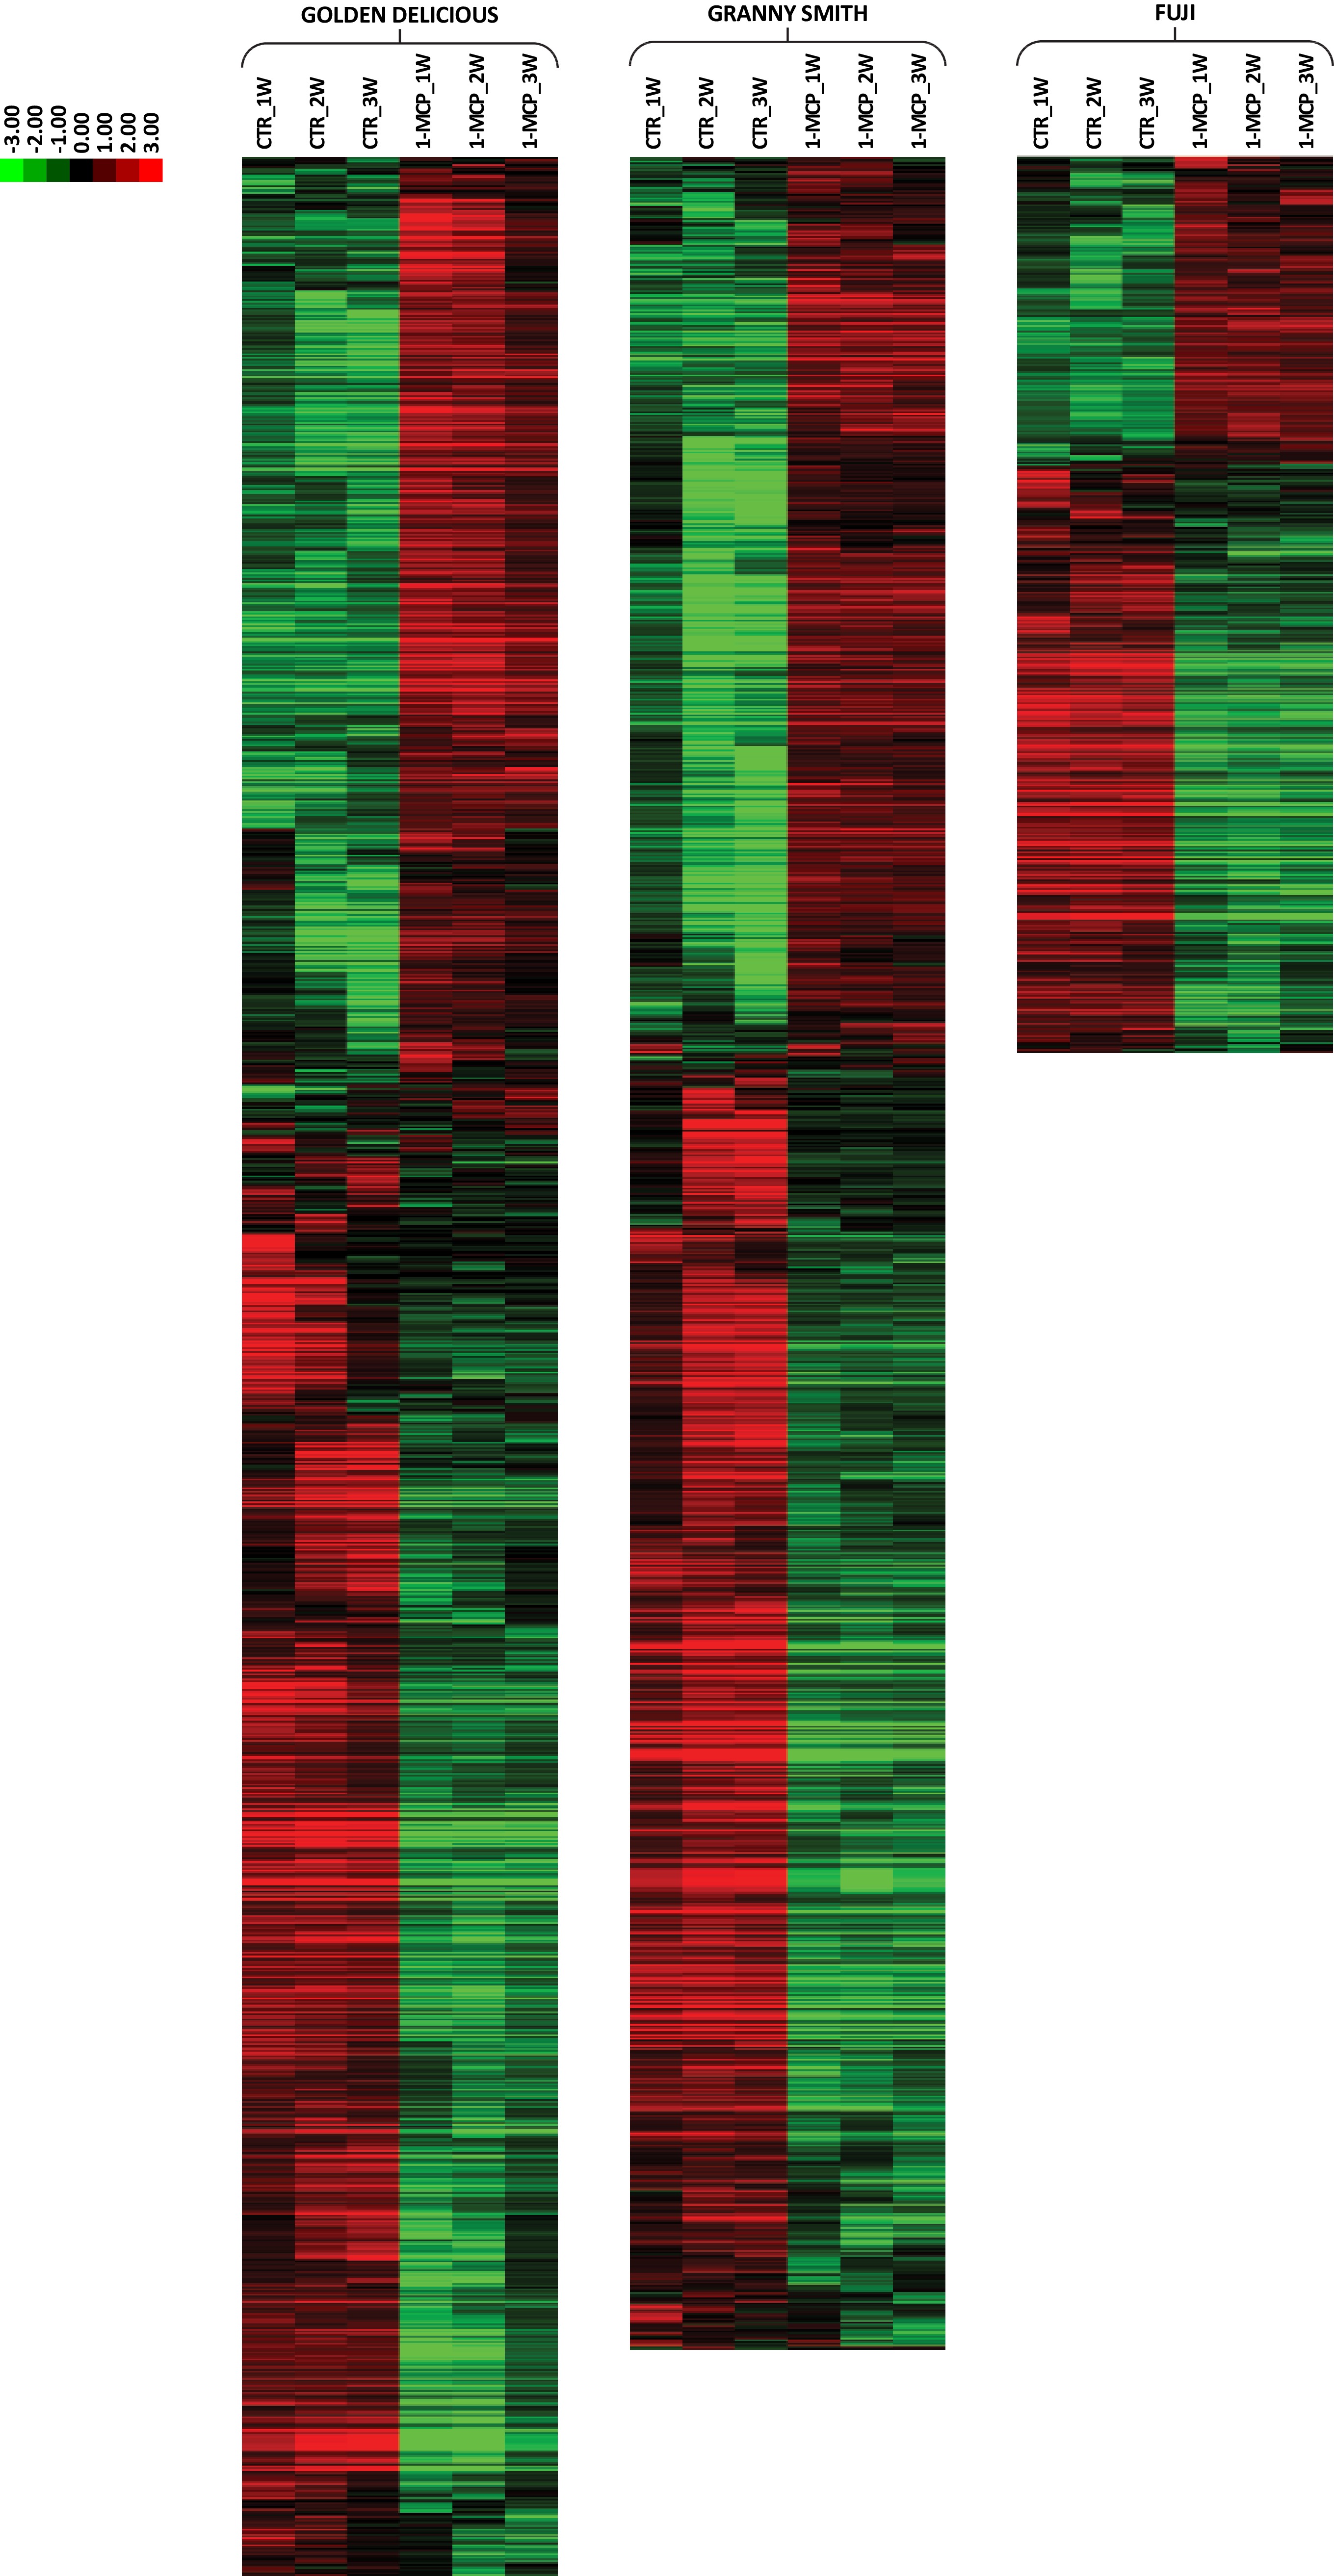
Figure 4. HeatMap of the expression analysis in 'Golden Delicious', 'Granny Smith' and 'Fuji' apple cultivars. The heatmap illustrated the expression of the selected list of DEGs and comparing CTR and 1-MCP samples. The transcriptome variation induced by the exogenous application of 1-MCP was evidenced only in the time points related to the postharvest shelf-life ripening. Expression level is reported according to the colored scale reported in the top left part of the figure.
Functional classification of DEGs in the three apple cultivars
-
The fine-tuned list of DEGs were further investigated through a sequence-similarity search against the KEGG database to explore the significant biological pathways involved in the regulatory mechanism of the ethylene perception system in the three apple cultivars, in both normal and impaired ripening physiology. According to the annotation analysis, 'Golden Delicious' showed the highest number of genes (18) involved in the Plant hormone signal transduction (KO04075), while 'Granny Smith' and 'Fuji' were characterized by a lower number (16 and 12, respectively) (Supplemental Table S1) For each cultivar, the most abundant KEGG Ortholog Annotations were related to auxin (K14484, K14485, K14486, K14487 and K14488) and ethylene (K14509) signal transduction. The expression of DEGs over the KEGG pathway for the three cultivars is illustrated in Supplemental Fig. S7.
The candidate gene expression survey reveals a cultivar dependent auxin induction as response to the inhibition of the ethylene signaling pathway
-
The relationship between the two hormones and hormone-related genes was assessed through a transcriptome candidate gene approach of 20 genes selected from the KEGG pathway, the list of DEGs and other elements known to be involved in these physiological processes (Supplemental Table S2). The expression pattern (Fig. 5) clustered these elements in two fundamental groups. The first, including genes related to ethylene biosynthesis and signaling (such as ACS, ACO, ERS and ERF) or ethylene associated pathways (such as PG1, for cell wall metabolism, LOX2 and ADH3 for VOC biogenesis), was more expressed in control samples characterized by an ethylene burst during the postharvest climacteric ripening. Among the three cultivars, the expression pattern of these ethylene-related genes showed however a distinct magnitude, with 'Golden Delicious' and 'Fuji' characterized by the highest and lowest transcript accumulation, and 'Granny Smith' with an intermediate level of gene expression. A different transcription level among cultivars was also detected for the second group of genes involved in the auxin signaling. This set of genes was in fact more expressed in the samples treated with 1-MCP rather than control, but with the same transcriptional pattern observed for the ethylene related genes, hence with a decreasing pattern from 'Golden Delicious' to 'Granny Smith' and 'Fuji'. The expression pattern was further correlated with the profile of the two hormones. The Pearson correlation analysis highlighted the role of the different genetic background of the three cultivars in orchestrating the postharvest ripening behaviour (Supplemental Fig. S8). In 'Golden Delicious', the two groups of genes showed a negative correlation among them, however, each group was positively correlated with its specific hormone, ethylene, and auxin, respectively (Supplemental Fig. S8a). This observation was supported by the correlation value computed between these two hormones (r: -0.58), with auxin increasing in the first week of shelf-life after the application of 1-MCP with a fold change, respect to control samples, of 1.4. The correlation analysis in 'Granny Smith' (Supplemental Fig. S8b), still confirm the distinction between the two groups of genes, but with exception. For this cultivar, it is worth noting that the expression of three genes related to the control of auxin homeostasis, such as GH3.5, GH3.6 and ILL. While GH3 genes were more positively correlated with the pattern of ethylene related elements, the expression level of ILL was more consistent with the auxin related group of genes (Fig. 6). In 'Fuji', cultivar characterized by a low level of ethylene, the correlation analysis was only partially consistent with the other two cultivars (Supplemental Fig. S8c).
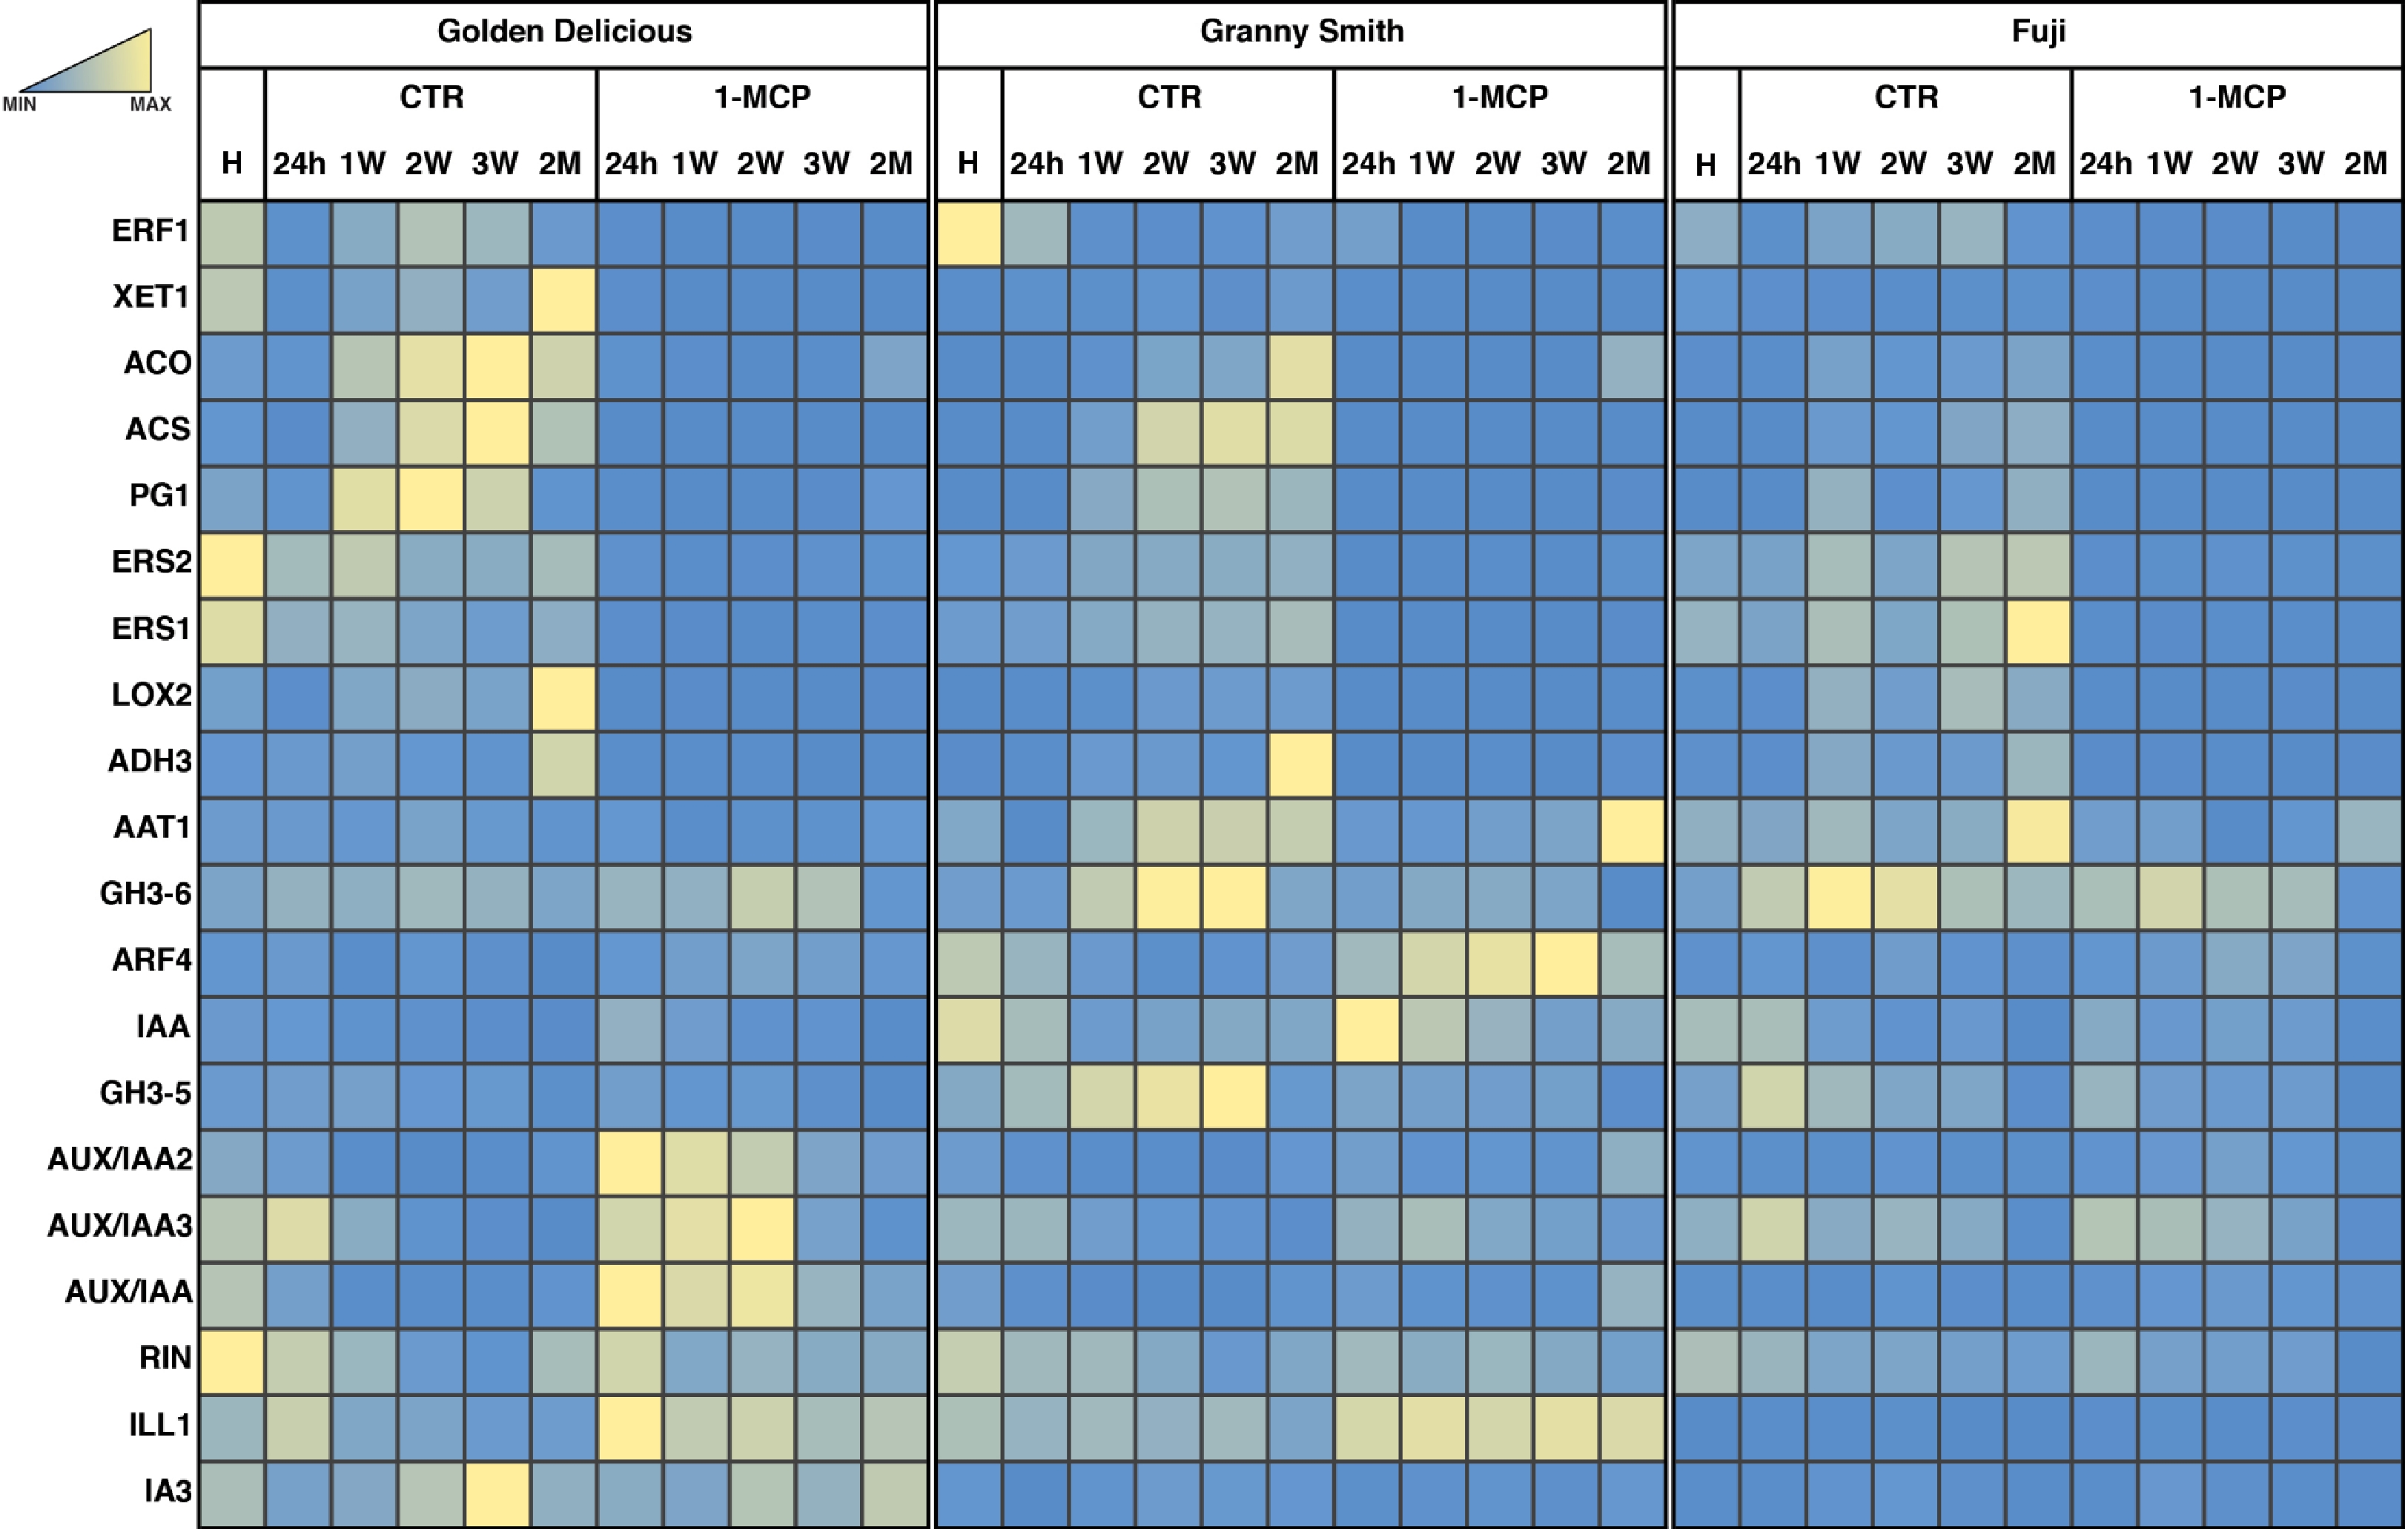
Figure 5. Transcription profile of a set of candidate genes related to ethylene and auxin pathways. The expression detected by a qRT-PCR was illustrated as a relative expression and represented through a heatmap according to the color scale reported. The expression pattern for each gene and cultivar, was reported comparing the two time-course: control and 1-MCP treated, respectively.
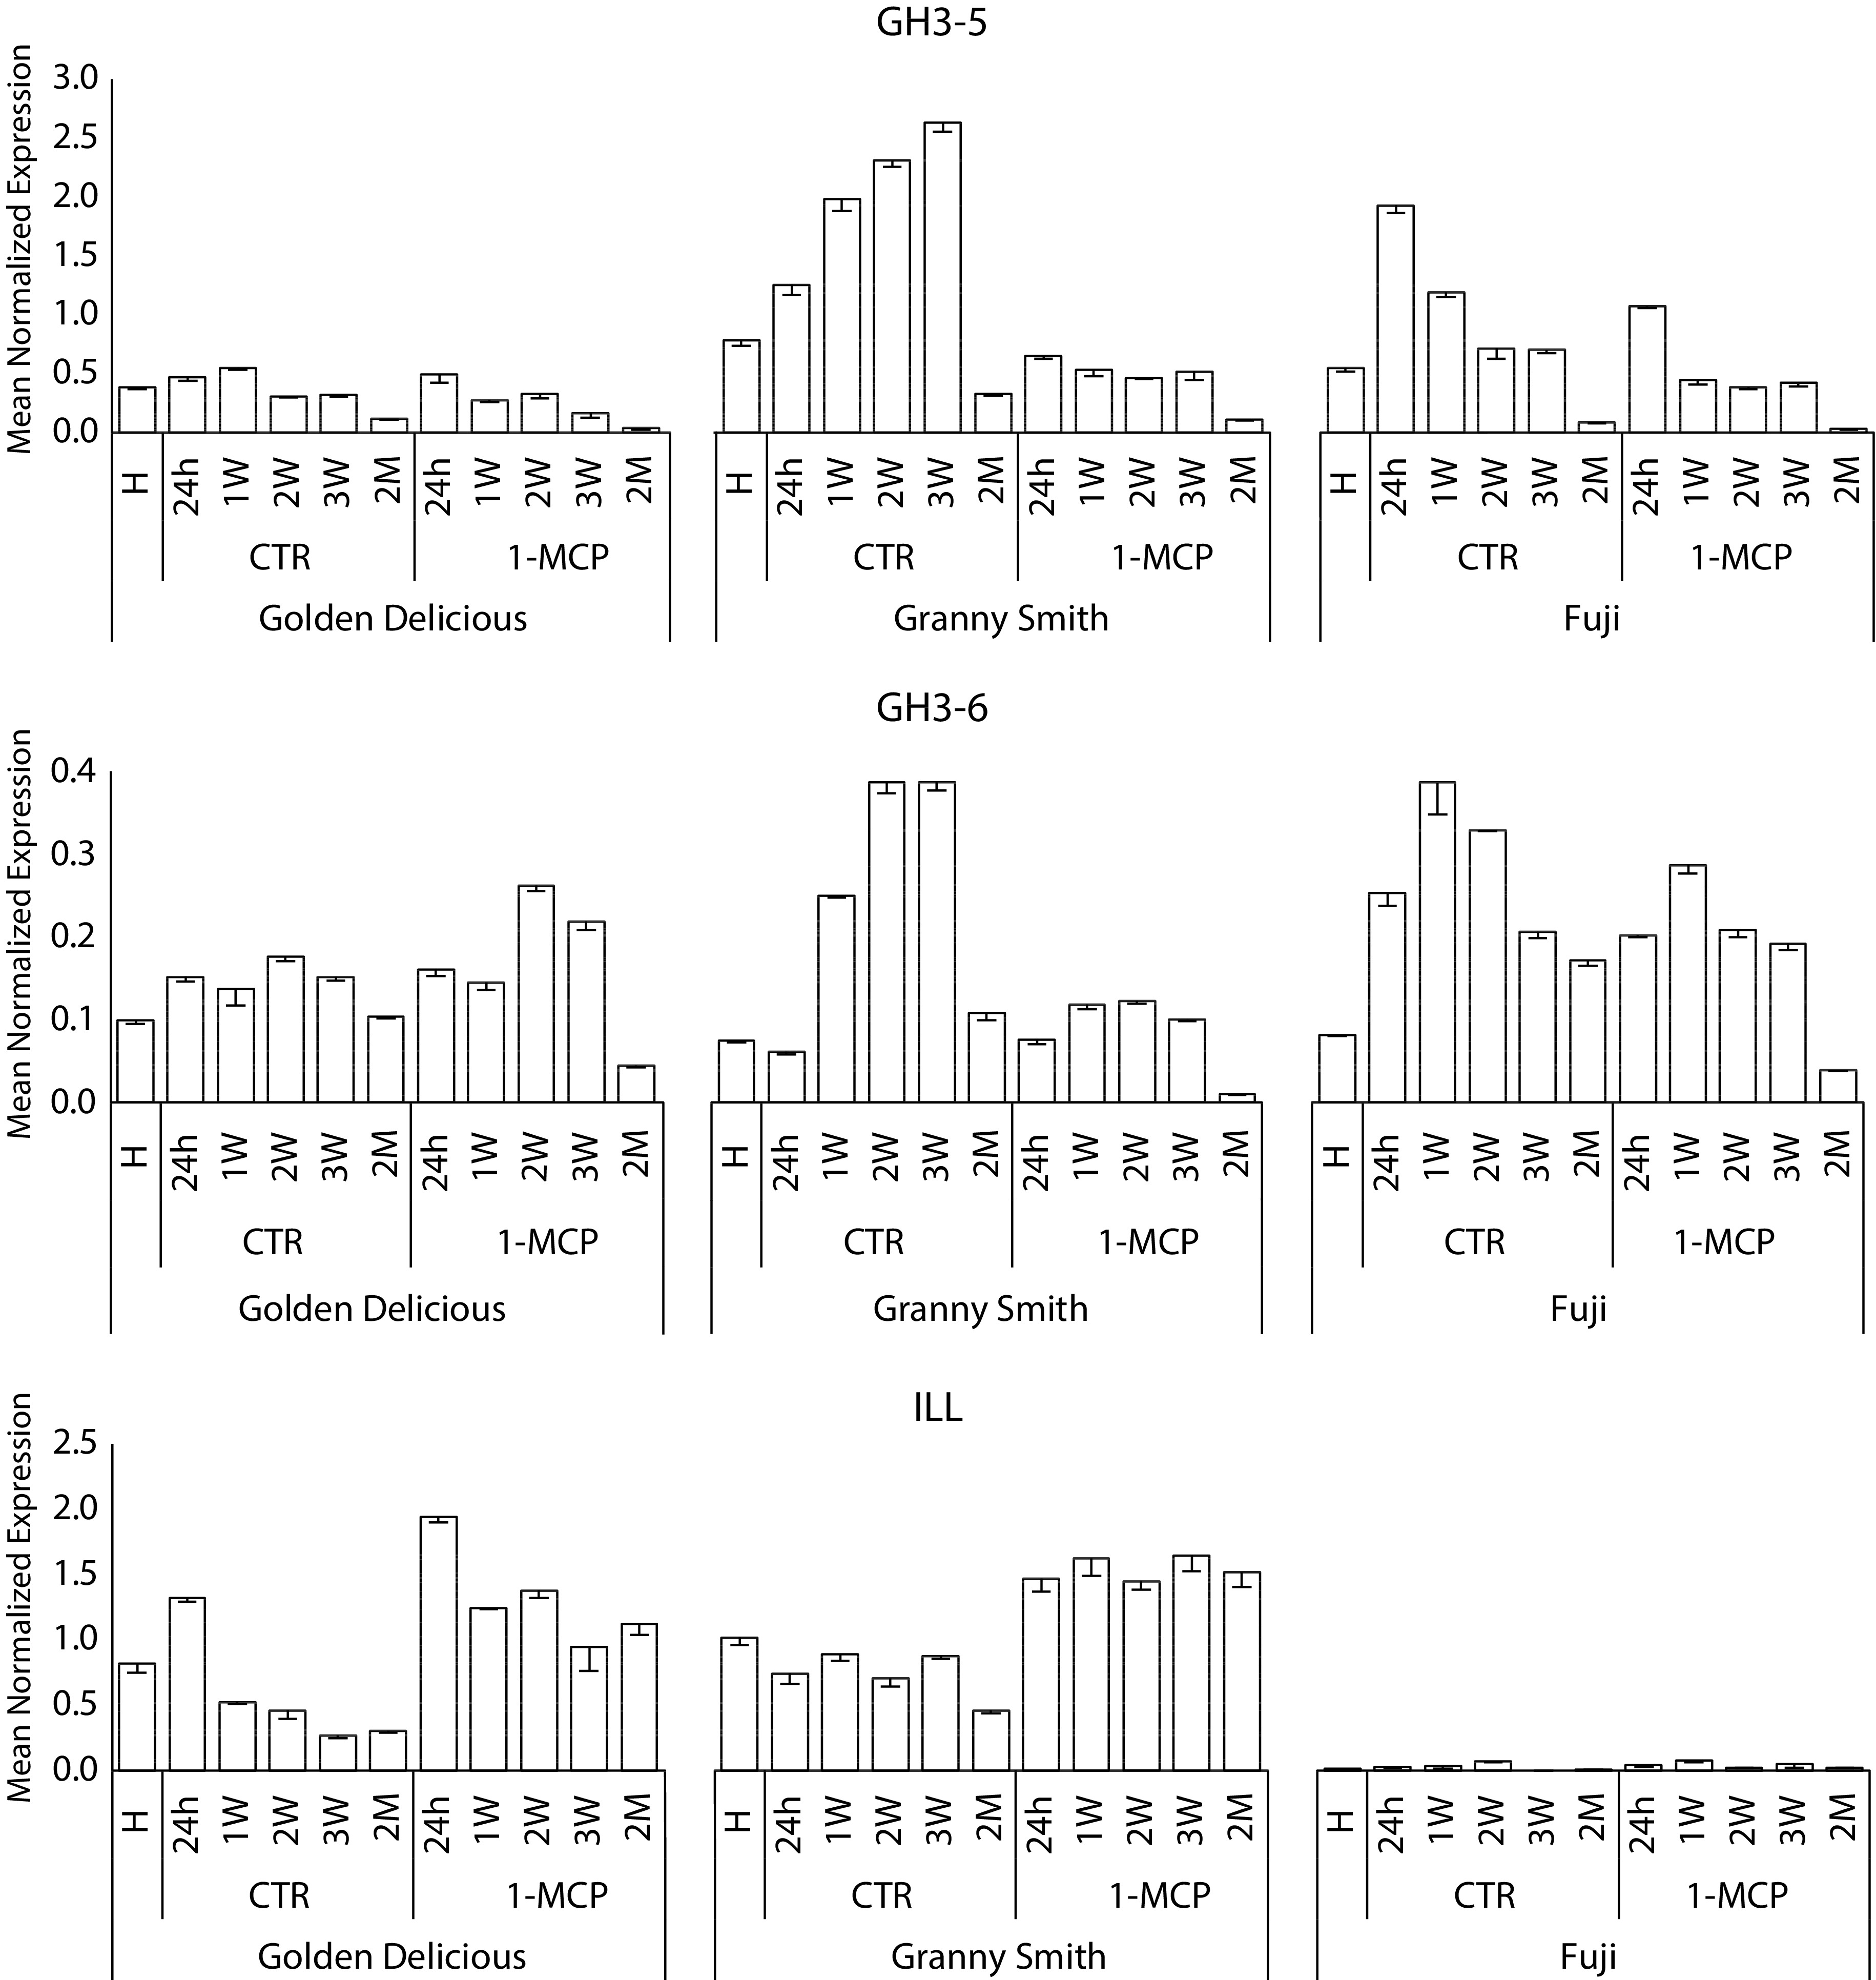
Figure 6. Relative expression analysis of three genes, namely GH3-5, GH3-6 and ILL, involved in the auxin homeostasis mechanism. The expression profile was illustrated for both time-course (control and 1-MCP treated) and for each of the three cultivars, 'Golden Delicious', 'Granny Smith' and 'Fuji', respectively. Bars indicate standard deviation.
-
The entire life cycle of a plant, from growth and development to the maturation of seeds and ripening of fruit is regulated by a molecular circuit orchestrated by plant hormones[22, 47]. These regulators comprehend a wide range of different molecules acting at low concentration and circulating in specific organs or in the whole organism. The single mode of action originally attributed to each class of hormone has been recently replaced by a more complex physiological model, underlying a crosstalk interaction. From the growing family of plant hormones, we focused our attention on the profile of ethylene and auxin that are differentially accumulated during the ripening of apple. Auxin, in particular, was originally known as an antagonist of ethylene retarding the ripening process[48, 49], however, recent findings have reviewed its mechanism, suggesting its participation also in the triggering of the fruit maturation process[47]. To this end, an increase in IAA was observed in concomitance with the burst of ethylene during the ripening of two climacteric species, such as peach and tomato[40−43]. In the present study, we investigated the possible crosstalk between ethylene and auxin in a shelf-life postharvest stage, shedding light on the auxin response when the perception of ethylene was impaired by the exogenous application of 1-MCP. Initially, the level of ethylene showed a contrasting pattern between 'Golden Delicious' and 'Fuji', in agreement with previous observation[50]. 'Granny Smith' showed, instead, an intermediate ethylene profile, with a trend similar to 'Golden Delicious' (with a peak at 2 weeks) but with absolute ethylene value closer to 'Fuji'. The application of 1-MCP effectively reduced the level of the hormone monitored both during the shelf-life period and cold storage. It is worth noting that the exogenous treatment with the ethylene competitor 1-MCP stimulated the auxin accumulation in each of the three cultivars, especially during the first week of postharvest ripening. In 'Golden Delicious' and 'Fuji', the burst of auxin peaked at 24 h after the treatment to decline progressively over the time course, while in 'Granny Smith' it remains at a higher level until the second week after harvest. It is also interesting to note that in the control samples of 'Golden Delicious' an increased level of auxin was detected during the postharvest shelf-life ripening in concomitance with the time of the ethylene burst, supporting the role of this hormone as an active molecule participating to control the climacteric ripening also in apple. The dynamic of auxin we observed is also consistent with the results described by Tatsuki et al.[42] and Schaffer et al.[44] for peach and apple. Yue et al.[51], moreover, demonstrated that exogenous application of naphthalenacetic acid (a synthetic auxin) promoted the production of ethylene and accelerated the ripening of 'Golden Delicious' apples. The results we presented complemented this scenario, suggesting the increase of auxin also in 1-MCP treated fruits, as an attempt of the fruit to restore a normal physiological ripening progression through the activation of the ethylene machinery.
Fruit ripening comprehend ethylene dependent and independent processes
-
In climacteric fruits, a rise of ethylene normally occurs to govern several physiological processes leading to important fruit quality traits. In this regard, we assessed different quality attributes such as texture, aromatic volatiles and secondary metabolites, especially phenolic compounds. As expected, fruit texture, dissected in mechanical and acoustic components, according to the methods reported in Costa et al.[52, 53], as well as VOCs, were directly associated with the level of ethylene and therefore defined as ethylene-dependent phenomenon. To confirm this result, the cultivar characterized by the highest ethylene production, 'Golden Delicious', showed in fact, the highest emission of VOCs and loss of firmness during the postharvest shelf-life ripening, both heavily repressed by the exogenous application of the ethylene competitor 1-MCP. The kinetics observed for the phenolic compounds were different. For this class of metabolites, the accumulation pattern was more associated to the different genetic background, rather than to the effect of ethylene. Previous work reported that 1-MCP can reduce and counter the loss of phenols[54], although the effect was different for each specific metabolite[55]. However, the effect of the ethylene competitor on this class of secondary metabolites was only assessed in one cultivar. In this work, we considered three commercially known apple cultivars with a different ripening behaviour and underlined the negligible role of 1-MCP in controlling the accumulation of these compounds when compared with the difference existing among distinct genetic backgrounds. This finding emphasized the complexity of the regulatory mechanism of fruit ripening processes and suggested the need for a more exhaustive comprehension of these phenomena to improve the quality of horticultural fruit crops such as apple.
Auxin is induced by 1-methylcyclopropene according to a genetically determined ethylene production pattern
-
The analysis of the whole transcriptome identified a series of DEGs differentially regulated between the two groups of samples showing a normal or impaired ethylene kinetics. The number of DEGs identified for each cultivar were seen to be consistent with the rate of ethylene produced and the effect of 1-MCP. Among the three cultivars, the ripening of 'Golden Delicious' was the most severely impaired by the application of the ethylene competitor, due to the highest amount of this hormone assessed in control samples. In the other two cultivars, 'Granny Smith' and 'Fuji', the effect of 1-MCP was lower compared to 'Golden Delicious', for a smaller amount of hormone produced during the normal ripening. The distinct magnitude in the role of 1-MCP in deviating the normal ripening physiology was also distinguished by a specific transcriptome signature, underlined by a different number of DEGs. 'Golden Delicious' and 'Granny Smith', characterized by an ethylene peak, showed more than two times the number of DEGs than 'Fuji', where the effect of 1-MCP was only slightly detected. Considering these observations, the global ripening-related transcriptome seemed to be more influenced by the presence/absence of the hormone peak rather than the absolute value of ethylene produced during the climacteric phase. Furthermore, the KEGG analysis performed to investigate the biological pathways identified several genes involved in the 'Plant hormone signal transduction' across the three cultivars. Within this group, the highest number of elements were related to ethylene and auxin metabolism, underlying the crosstalk relationship existing between these two hormones. Among the three cultivars, the group of ethylene-related genes (such as ACS, ACO, ERS, ERF) and genes involved in ethylene-related pathways (such as PG and XET) were expressed during the normal climacteric ripening, with a magnitude consistent with the ethylene trend, and totally repressed by the application of 1-MCP. A similar profile was also observed for the genes related to VOCs (LOX2, ADH3 and AAT1), thus providing transcriptomic evidence of the ethylene dependency initially proposed. On the other hand, it is interesting to note the expression pattern of the auxin related genes supporting the theory of the auxin re-activation stimulated by the ethylene competitor. Genes related to the auxin signaling, such as AUX/IAA and ARF4, were in fact more expressed in 1-MCP treated samples compared to control. The transcript magnitude showed also a genetic background effect with a specific regard to the level of ethylene. The expression of these genes was in fact higher in 'Golden Delicious' and progressively lower in 'Granny Smith' and 'Fuji'. To this end, it is worth noting the expression profile of two elements involved in auxin homeostasis mechanism, GH3 and ILL genes. To regulate the auxin homeostasis, in addition to de-novo synthesis, the plant cell can operate an auxin conjugation and de-conjugation process. GH3 is known to be involved in the conjugation of free form of auxin to amino acid and sugars[28, 56], while ILL is involved in the opposite mechanism. ILL is a ILR1-like gene (IAA Leucine Resistant) encoding for an IAA-amino acid hydrolases that hydrolyse amino acid conjugated form of auxin, contributing to release available auxin in the cellular system[57, 58]. According to the auxin homeostasis, GH3 genes (GH3-5 and GH3-6) were highly expressed in control fruit at the time of ethylene production, while the ILL gene was more expressed in 1-MCP treated samples (Fig. 6). The expression profile of these genes was thus consistent with the model we proposed regarding the auxin-ethylene crosstalk in apple fruits with an inhibited ripening due to an interference in the ethylene receptor system. It is now known that auxin is essential to commence fruit ripening, with ethylene taking a more dominant role during the full ripening stage. However, in fruit with a delayed ripening, a de-novo auxin burst is stimulated to restore the normal ripening physiology. These findings can contribute to gain knowledge of the hormonal crosstalk mechanism of apple, an important horticultural crop where the action of auxin and ethylene have been largely investigated, also for their active involvement in extending the postharvest life and the fruit quality improvement.
-
The deviation of the normal fruit ripening progression following the interference at the level of the ethylene pertion system affected, as expected, several quality parameters, but also the hormone interplay. The application of the ethylene competitor 1-MCP stimulated the accumulation of auxin together with the expression of auxin-related genes, involved in both signaling and de-conjugation processes. It is also worth noting that the hormonal crosstalk was distinctively re-programmed for each cultivar, suggesting a cultivar-dependent effect. The transcriptional re-programming of the genes related to the two hormones seems to be in fact related to the genetically programmed rate of ethylene produced during the climacteric ripening. These findings suggest a new role for auxin. While it was originally known as an antagonist of ripening, recent work proposed a revisited role for this hormone, in stimulating the ripening process. In this study, we have shown that an impaired ethylene production at the time of the ripening can induce an auxin accumulation as a tentative of the fruit to re-establish a normal physiological ripening physiology in the attempt to complete the dispersion of seeds, which represent the evolutionary goal of each fruit. Although the control of ethylene through its inhibition has important effects on the maintenance of general fruit quality, it can also induce relevant responses, including the activation of specific classes of hormones, such as auxin.
-
Three apple cultivars, 'Golden Delicious', 'Granny Smith' and 'Fuji', where chosen for their known distinctive ripening behaviour. These cultivars, available at the Foundation Edmund Mach (Trento, Italy), were represented by adult plants in full bearing phase. For each cultivar, 100 homogeneous fruit harvested at the commercial ripening stage, were randomly divided into two batches, one was treated overnight with the ethylene competitor 1-methylcyclopropene (1-MCP) in a sealed container (at the final concentration of 0.7 μl l−1), while the second was maintained as control. These two batches, per each cultivar, were represented by six total stages. The first stage, common for both subgroups, was represented by the harvested (H) fruit. The other five, were instead represented by a time course defined as follow: 24h (one day after harvest, 1 DAH), 1W (7 DAH), 2W (14 DAH), 3W (21 DAH) and 2M (2 months). The time course was designed and investigated for both, control and treated fruit batches. While the samples collected from 24h to 3W were maintained at room temperature (20 °C) for shelf-life ripening, the last sample (2M) was stored in a cold room (2 °C at regular atmosphere). Each shelf-life stage was represented by five apples, while for the cold storage 20 apples were chosen (Supplemental Fig. S9).
Volatile fingerprinting
-
For each stage/condition/cultivar, the fruit volatile organic compounds (VOCs) profile were non-destructively profiled through the employment of the PTR-ToF-MS 8000 (Ionicon Analytik GmbH Innsbruck, Austria). Samples were placed in a sealed glass jar at 30 °C for 30 min and the headspace VOC mixture was assessed through a direct injection. The sampling acquisition time operated by the ToF was set at 0.1 ns, corresponding to 350000 channels for a mass spectrum up to m/z = 400 and a total sum of 28600 acquisitions/spectrum. as previously described by Costa et al.[50], the mass m/z = 28.031 was assigned to ethylene. Mass annotation, Poisson correction and reduction of baseline and noise were employed in the analysis of the spectra according to the procedure previously described by Cappellin et al.[59, 60].
Analysis of fruit texture
-
The fruit texture was analytically dissected into acoustic and mechanical components through a texture analyzer TAXTplus and an acoustic device AED (Stable MicroSystem Ltd; Godalming, UK) as described in Costa et al.[52, 53]. From each apple, five cylindrical portions of fruit flesh (1 × 1.7 cm) were obtained from the vertical long-wise portion of the fruit. The force-acoustic assessment for each disc was carried with a loading cell (5 kg type) and a cylindrical flat head probe (4 mm size). The penetration of the probe (until 90% of deformation) progressed with an auto-force trigger of 5 g. The AED acoustic detector was positioned at 5 cm from the sample with an envelope gain set at 24 dB. Sound pressure was further converted into dB (background set at 36 dB) with an acoustic cut off set at 3.125 kHz. Both mechanic and acoustic profiles were digitally acquired with a resolution of 500 pps (points per second).
Auxin extraction and profiling
-
Indole-3-acetic acid was extracted from three biological replicates/sample according to the methods described by Xu et al.[61]. Briefly, 1 g of fruit frozen powder were extracted with 2 ml of pre-chilled water acidified with 1% (v/v) glacial acetic acid (pH 2.8). The extraction solvent included 0.5 pg μl−1 deuterated indole-3-acetic acid ([2H5] indole-3-acetic acid (Olchemim, Olomouc, Czech Republic)) as internal standard. Samples were mixed for 30 sec, centrifuged at 4 °C for 15 min at 4500 x g and supernatants were collected and mixed with 4 ml of diethyl ether (Honeywell). Three milliliters of the organic fraction were evaporated with a speed vacuum equipment (Heto) for 45 min at room temperature and the residues were resuspended in 200 μl water:methanol solution (50:50; v/v), further filtered with minisart RC4 filters (0.2 μm of pore sizes; Sartorious, Göttingen, Germany).
The targeted metabolomics analyses were performed by using an UPLC Acquity I Class (Waters, Milford, MA, USA), equipped with a BEH C18 column (100 × 2.1 mm; particle size 1.7 μm), a PDA detector and a Xevo G2-XS QqToF mass spectrometer (Waters, Milford, MA, USA). The chromatographic elution was performed as previously described, using a gradient between solvent A (water acidified with 0.1% (v/v) formic acid) and solvent B (100% acetonitrile)[62]. The mass spectrometer mounted an ESI ion source (operating in positive ionization mode) set with the following parameters: capillary voltage 0.8 kV, cone 30 V, offset 80 V, source temperature 120 °C, desolvation temperature 500 °C, cone gas flow rate 50 l h−1 and desolvation gas flow rate 1000 l h−1. A MS/MS method was created to detect IAA and 2H5-IAA signals. Peak areas of the corresponding IAA and 2H5-IAA daughter signals were obtained by using Masslynx software (Waters). Leucine-enkephalin solution (100 pg µl−1) was injected at 10 µl min−1 to check the accuracy of the mass spectrometer.
Analysis of phenolic compounds in apple
-
Phenolic compounds were extracted and analysed from the pulp tissue of the apple samples included in the experimental design following the methodology described in Vrhovsek et al.[63]. Two grams of grinded tissue were extracted with a solution of water/methanol/chloroform with the proportion of 20:40:40. The aqueous/methanol extract phase was used for a second round of extraction with 2.4 ml of water/methanol (1:2). After centrifugation, the upper phase of two extractions were merged into one (to a total volume of 10 ml) and filtered with a 0.2 μm PTFE filter. Ultra-high performance liquid chromatography was operated with a Waters Acquity UPLC system (Milford, MA, USA) and a Water Xevo TQMS (Milford, MA, USA) in ESI ionization mode. The separation of the phenolic compounds was finally conducted with a Waters Acquity HSST3, equipped with a column 1.8 μm and two solvents: A (water with 0.1% formic acid) and B (acetonitrile with 0.1% formic acid). Two microliters of both standard solution and samples were injected, with samples maintained at the temperature of 6 °C during the entire mass spectrometry detection process.
RNA extraction, library preparation and RNA sequencing
-
Total RNA was isolated with the SpectrumTM Plant Total RNA kit (Sigma-Aldrich, Mo, USA). RNA concentration and purity was assessed with a Nanodrop 8000 Spectrophotometer (ThermoFisher Scientific, MA, USA), while its integrity was inspected with a Tapestation 2200 (Agilent Technologies, CA, USA). Only RNA samples with a RIN value > 7 were used for sequencing.
For the large-scale transcriptome analysis, 99 RNA-Seq libraries (11 stages/three biological replicates/three cultivars) were prepared employing the TruSeq RNA sample preparation kit (Illumina Inc). Libraries were clustered on a cBot Cluster using the TrueSeq SR Cluster Kit v3 and sequenced with the Illumina HiSeq2000 using the TrueSeq SBS kit v3.
Gene expression profiling by RT-qPCR
-
For each sample, 1 μg of total RNA was treated with 1 Unit of Ambion rDNAse I (DNA free kit, Life Technologies, Carlsbad, CA, USA) and used as template for the cDNA synthesis with the 'Super-Script VILO cDNA Synthesis Kit' (Life Technologies, Carlsbad, CA, USA). The transcript relative quantification was obtained using ViiA7TM instrument (Life Technologies, Carlsbad, CA, USA) and Fast SYBR® Green Master Mix (Life Technologies, Carlsbad, CA, USA). The conditions applied during the RT-qPCR were the following: initial incubation at 95 °C for 20 s, followed by 40 cycles of 95 °C for 1 s and 60 °C for 20 s. A final amplification cycle at 95 °C for 15 s, 60 °C for 1 min and 95 °C for 15 s was performed to determine the melting curve. The final Ct is represented by the average of three independent normalized expression values for each sample. The gene expression was reported by the mean normalized expression calculated by equation two of the 'Q-gene' software[64, 65]. Md8283[66] and MdACT were both employed as housekeeping genes. For each gene, a couple of discriminant and specific primer were designed, using the online software Primer3 and Primique. Details on genes and list of primer is reported in Supplemental Table S2. The mean normalized expression level for each gene assessed through qRT-PCR obtained with the employment of two houskeeping genes showed a mean correlation of 0.84 and a standard deviation of 0.15.
Data analysis
-
Raw Illumina reads were cleaned and filtered using Trimmomatic version 0.36[67]. Sequences with an average quality below 15 in a four bp sliding window and shorter than 36 bp in length were trimmed and removed from the analysis. Remaining reads were aligned to Malus domestica complete CDS sequences downloaded from the NCBI Nucleotide database using STAR 2.5.1a[68]. Counts of unambiguously mapped reads were obtained using htseq-count[69].
Final read counts were Log base 2 transformed in order to stabilize count errors and gene-wise median was further used for data normalization. For the time course designed for each cultivar, the differentially expressed genes (DEGs) were defined by a two-way ANOVA model, taking into account two models, treatment (control vs. 1-MCP) and sampling time. A mean squared residue score (sqrt(MSR)) was used to represent the average magnitude of expression change across the different sampling stages. For correlation analysis, only genes with a max count ≥ 30 were retained.
The heatmaps depicting the transcriptomic profile were visualized trough Gene Cluster 3.0 and Java Tree software ( http://bonsai.hgc.jp/~mdehoon/software/cluster/software.htm), while the heatmaps summarizing the candidate gene expression was performed with Excel (Microsoft, Seattle, WA, USA) using conditional formatting.
The protein sequences related to set of genes differentially expressed for each of the three apple genomes were annotated using BlastKOALA web service[70] and analysed interrogating the KEGG pathway database to exploit the function of the biological systems involved in the control of the climacteric fruit ripening in apple.
Statistical analysis were carried out with R. For multivariate principal component analysis was used ChemomeytricsWithR package [71], while correlation analysis and plot were obtained through corrplot package.
Data availability statement
-
Sequences are available at the GEO database ( www.ncbi.nlm.nih.gov/geo/; accession number: GSE182822).
- This research was supported by QLRT-2001-01492 “High-quality Disease Resistant Apples for a Sustainable Agriculture” and the Agroalimentare research AGER project (grant no. 2010-2119). The authors thank Veronica De Sanctis and Roberto Bertorelli from the Next Generation Sequencing Core Facility of the University of Trento for their support in RNA sequencing.
- The authors declare that they have no conflict of interest.
- Supplemental Fig. S1 The analysis of PCA was computed for the three cultivars both singularly (a_’Golden Delicious’, b_’Granny Smith’ and c_’Fuji’) and joint together (d) . The four PCA plots have been illustrated by implementing for each the first two principal components. The three cultivars are distinguished by different colors and shapes as follow: ‘Golden Delicious’ in yellow (●), ‘Granny Smith’ in green (■) and ‘Fuji’ in red (▲). CTR and 1-MCP samples are depicted with light and dark colors respectively. The harvest samples (H) are represented with grey color. The samples for panel (d ) are detailed in Supplementary Figure 2.
- Supplemental Fig. S2 Detailed plot of Supplementary Fig. 1d with label for each sample/cultivar.
- Supplemental Fig. S3 Panel (a) reported the variability assessed among the three cultivars for the volatile organic compounds production, while panel (b) illustrated the variability of phenolic compounds. The two PCA-plots have been realized considering the first two principal components. In both panels the three cultivars are distinguished by different colors and shapes as follow: ‘Golden Delicious’ in yellow (●), ‘Granny Smith’ in green (■)) and ‘Fuji’ in red ((▲). CTR and 1-MCP samples are depicted with light and dark colors respectively. The harvest sample (H) are represented with grey color. Samples details are reported in Supplementary Figure 4 and 5.
- Supplemental Fig. S4 Detailed plot of Supplementary Fig. 3a with samples’ label.
- Supplemental Fig. S5 Detailed plot of Supplementary Fig. 3b with samples’ label.
- Supplemental Fig. S6 Normal distribution of the fold change values of the averaged expression level of the DEGs identified between the two groups of samples collected during the shelf-life ripening, control and 1-MCP treated for ‘Golden Delicious’ (a), ‘Granny Smith’ (b) and ‘Fuji’ (c), respectively. The red central area, depicted for the distribution of each cultivar, indicated the distribution of the fold change values included between the range of 0.7 and 1.3. The two white colored extremes of the fold change distribution represent the sub-selection of DEGs chosen for the KEGG analysis and the selection of the candidate genes further assessed via RT-qPCR.
- Supplemental Fig. S7 Overview of the KEGG pathway: ko04075 -‘Plant hormone signal transduction’ for ‘Golden Delicious’ (a), ‘Granny Smith’ (b) and ‘Fuji’ (c), respectively. Red and green colors indicate high and low expression of DEGs included in these specific KEGG orthology. Yellow color, instead, points orthology represented by genes with both types of expression level. In each scheme, solid lines represent direct precursors and products, while dashed arrows indicate indirect type of connections.
- Supplemental Fig. S8 Pearson correlation analysis between the level of the two hormones (ethylene and auxin) and the expression pattern of the set of candidate genes for each of the three cultivars: ‘Golden Delicious’ (a) , ‘Granny Smith’ (b) and ‘Fuji’(c) . Size and color of each dot in the diagram indicated the value of the correlation coefficient for each pair based on the colored scale illustrated by the vertical reference bar.
- Supplemental Fig. S9 Experimental design. After harvest (H), ‘Golden Delicious’, ‘Granny Smith’ and ‘Fuji’ fruit were collected and divided in two batches: the first one treated with 1-MCP and the second one left untreated as control (CTR). Apples were stored at 20 °C for 3 weeks while a subset of fruit was refrigerated for 2 months.
- Supplemental Table S1 Annotation of the KEGG orthology included in the KEGG map04075-Plant hormone signaling transduction. In the table, the number of DEGs assigned to each functional KEGG orthology for each of the three cultivars (‘Golden Delicious’, ‘Granny Smith’ and ‘Fuji’) is presented. For each hormone category considered in this KEGG pathway, the functional ortholog ID and ortholog annotation is also indicated.
- Supplemental Table S2 List of primers (5' -> 3') used for qRT-PCR validation of the RNA-seq expression data. In the table the ID for each gene, the forward and reverse primer sequences, the gene acronym, and gene function were reported.
- Copyright: © 2021 by the author(s). Exclusive Licensee Maximum Academic Press, Fayetteville, GA. This article is an open access article distributed under Creative Commons Attribution License (CC BY 4.0), visit https://creativecommons.org/licenses/by/4.0/.
-
About this article
Cite this article
Busatto N, Tadiello A, Moretto M, Farneti B, Populin F, et al. 2021. Ethylene-auxin crosstalk regulates postharvest fruit ripening process in apple. Fruit Research 1: 13 doi: 10.48130/FruRes-2021-0013

Ethylene-auxin crosstalk regulates postharvest fruit ripening process in apple
- Received: 15 November 2021
- Accepted: 16 November 2021
- Published online: 29 November 2021
Abstract: The ripening of climacteric fruits, such as apple, is represented by a series of genetically programmed events orchestrated by the action of several hormones. In this study, we investigated the existence of a hormonal crosstalk between ethylene and auxin during the post-harvest ripening of three internationally known apple cultivars: 'Golden Delicious', 'Granny Smith' and 'Fuji'. The normal climacteric ripening was impaired by the exogenous application of 1-methylcyclopropene (1-MCP) that affected the production of ethylene and the physiological behaviour of specific ethylene-related quality traits, such as fruit texture and the production of volatile organic compounds. The application of 1-MCP induced, moreover, a de-novo accumulation of auxin. The RNA-Seq wide-transcriptome analysis evidenced as the competition at the level of the ethylene receptors induced a cultivar-dependent transcriptional re-programming. The DEGs annotation carried out through the KEGG database identified as most genes were assigned to the plant hormone signaling transduction category, and specifically related to auxin and ethylene. The interplay between these two hormones was further assessed through a candidate gene analysis that highlighted a specific activation of GH3 and ILL genes, encoding key steps in the process of the auxin homeostasis mechanism. Our results showed that a compromised ethylene metabolism at the onset of the climacteric ripening in apple can stimulate, in a cultivar-dependent fashion, an initial de-novo synthesis and de-conjugation of auxin as a tentative to restore a normal ripening progression.
-
Key words:
- Apple /
- Auxin /
- Cross-talk /
- Ethylene /
- Fruit quality /
- Fruit ripening /
- Hormone profiling /
- Postharvest /
- RNA-Seq /
- Transcriptomic