


-
Two major challenges facing the sweet cherry (Prunus avium L.) industry are rain-induced fruit cracking and sub-optimal fruit firmness[1]. In terms of abiotic challenges, rain-induced fruit cracking (hereafter referred to simply as 'cracking') is foremost, as it can lead to an increased susceptibility to fungi and decay[2], increased labor costs for rogueing cracked fruits in the field and in packing houses[3], and in extreme cases even complete crop loss. Excessively soft fruit has been estimated to account for 60% of grade or price dockages in sweet cherry[4], and consumers are able to distinguish between cherries of varying firmness levels[5] and also prefer firmer cherries[6].
Genetic improvement, as opposed to cultural management practices, offers a stable, sustained solution to challenges such as cracking and excessive fruit softness that face the sweet cherry industry. Whereas management practices must be applied seasonally to achieve a desired result, genetic improvement can stably improve a desired attribute(s) in new plantings of genetically superior cultivars. However, traditional breeding in sweet cherry is met with several obstacles such as long juvenility periods[7], large seedling evaluation plots[8], and a lack of allelic diversity among cultivars[9]. DNA-informed breeding, which is now routine in breeding programs of many rosaceous crops, including sweet cherry, can help alleviate many of the obstacles met by traditional breeding methods[10].
One way in which DNA information can aid in the breeding process is after the creation and implementation of trait-predictive, locus-specific DNA tests[10]. These DNA tests can aid in predicting genetic potential and thus be used for marker-assisted parent selection (MAPS), marker-assisted seedling selection (MASS), and marker-assisted introgression (MAI)[10,11]. In sweet cherry, several DNA tests already exist and have been used routinely over the last several years in breeding programs such as the Pacific Northwest Sweet Cherry Breeding Program (PNWSCBP) at Washington State University (WSU), including tests for fruit size and firmness[12], fruit color[13], self-fertility[14], and powdery mildew susceptibility[12]. In addition, a DNA test for cracking has been developed (Pav-G5Crack-SSR) but is in need of further validation[12,15].
Upstream research such as quantitative trait locus (QTL) discovery and characterization as well as translational steps are prerequisites for the creation of DNA tests. Sweet cherry fruit firmness and cracking QTL analyses have been performed by several research groups[15−20]. Most recently, QTLs for cracking (two stable QTLs on linkage groups 1 and 5) and fruit firmness (two stable QTLs on linkage groups 1 and 3) were detected using Pedigree-Based Analysis supplemented by Genome-Wide Association analysis[21] using germplasm from the WSU breeding program. Vanderzande et al.[11] outlined five steps to translate QTL discoveries into DNA tests, involving 1) choosing the target QTL, 2) designing an assay(s) to target the locus/loci of interest, 3) trying markers on germplasm, 4) tracing inheritance including allele effect estimates, and 5) disseminating the DNA test details[11].
Different marker types can be used to create DNA tests, with a single DNA test being composed of one or more markers[11]. Simple sequence repeat (SSR) markers have been used due to their ability to detect multiple alleles at a given locus and their relatively low cost[11,22]. SSR alleles have been traditionally detected using polyacrylamide gels, or often via capillary electrophoresis using fluorescently tagged primers[23], which requires the use of sequencing equipment, necessitating the use of a third-party service provider in many instances. More recently, SSR alleles have been analyzed using high-resolution melting (HRM) assays[24]. HRM assays are simple, post-PCR assays using double-stranded DNA-specific fluorescent dye and unlabeled flanking PCR primer pairs[25]. These assays can be performed on relatively easily accessible real-time thermal cyclers and are straightforwardly scored[25]. While SNP markers are generally only bi-allelic, their abundance throughout the genome makes them attractive marker candidates[26]. SNPs can also be genotyped at a low cost using various assays such as the aforementioned HRM or Kompetitive Allele-Specific PCR (KASP)[27]. High throughput can also be achieved through use of 96 or 384-well plates.
DNA tests have become integrated in sweet cherry breeding programs, and this foundation begs for additional tests for more traits to become available to the breeder. Evaluation of DNA tests for specific germplasm is necessary to confirm utility, while new DNA tests are also needed to better capture allelic variation at various loci contributing to trait variation[10].
This work aimed to evaluate utility of the existing Pav-G5Crack-SSR DNA test as well as develop and evaluate new SNP-based tests using HRM assays for fruit firmness and cracking incidence in sweet cherry.
-
Cracking incidence was successfully evaluated over two years in 2019 and 2020; firmness data was successfully collected on portions of the experimental breeding population in 2012 and 2019, and for the entire population in 2020 (Supplemental Table S1). Average cracking incidence was significantly lower (paired t-test, p < 0.05; results not shown) in 2019 (46%) than in 2020 (61%) (Supplemental Table S1). In 2020, the only year in which all the seedlings' firmness measurements were taken together, the average firmness was 309 g/mm (Supplemental Table S1).
Validation of Pav-G5Crack-SSR DNA test
-
The multiple sets of primers in the Pav-G5Crack-SSR DNA test detected three alleles at position A and six at position B, combining to make seven unique SSR haplotypes and 10 common SSR diplotypes (Table 1; Supplemental Table S2). The two most common haplotypes (193_221 and 195_225) came from parental cvs. 'Ambrunes', 'Bing', 'Chelan', 'Cowiche', 'Lapins', 'Rainier', and 'Sweetheart' (Table 1).
Table 1. SSR alleles, haplotypes, and common diplotypes for Pav-G5Crack-SSR DNA test.
Unique SSR
allelesna Unique SSR
haplotypesna Commonb parental sources Commonc SSR
diplotypesn Locus A 195 142 191_215 4 Dhzerlo 193_219/193_219 8 193 346 193_219 97 Benton, Bing, Chelan, Kiona, Rainier, Regina, Tieton 193_219/193_221 44 191 4 193_221 201 Ambrunes, Bing, Chelan, Cowiche, Lapins, Rainier, Sweetheart 193_219/193_225 8 Locus B 215 4 193_225 31 Kordia, Regina 193_219/195_225 26 219 97 193_231 10 Venus 193_221/193_221 39 221 201 193_241 7 Ambrunes 193_221/193_225 12 225 173 195_225 142 Cowiche, Lapins, Sweetheart 193_221/195_225 58 231 10 195_225/193_225 9 241 7 195_225/193_231 7 195_225/195_225 20 a Three seedlings were unable to be scored.
b Parent included if its haplotype(s) was represented at least five times in seedling population, except the 191_215 haplotype (only four times).
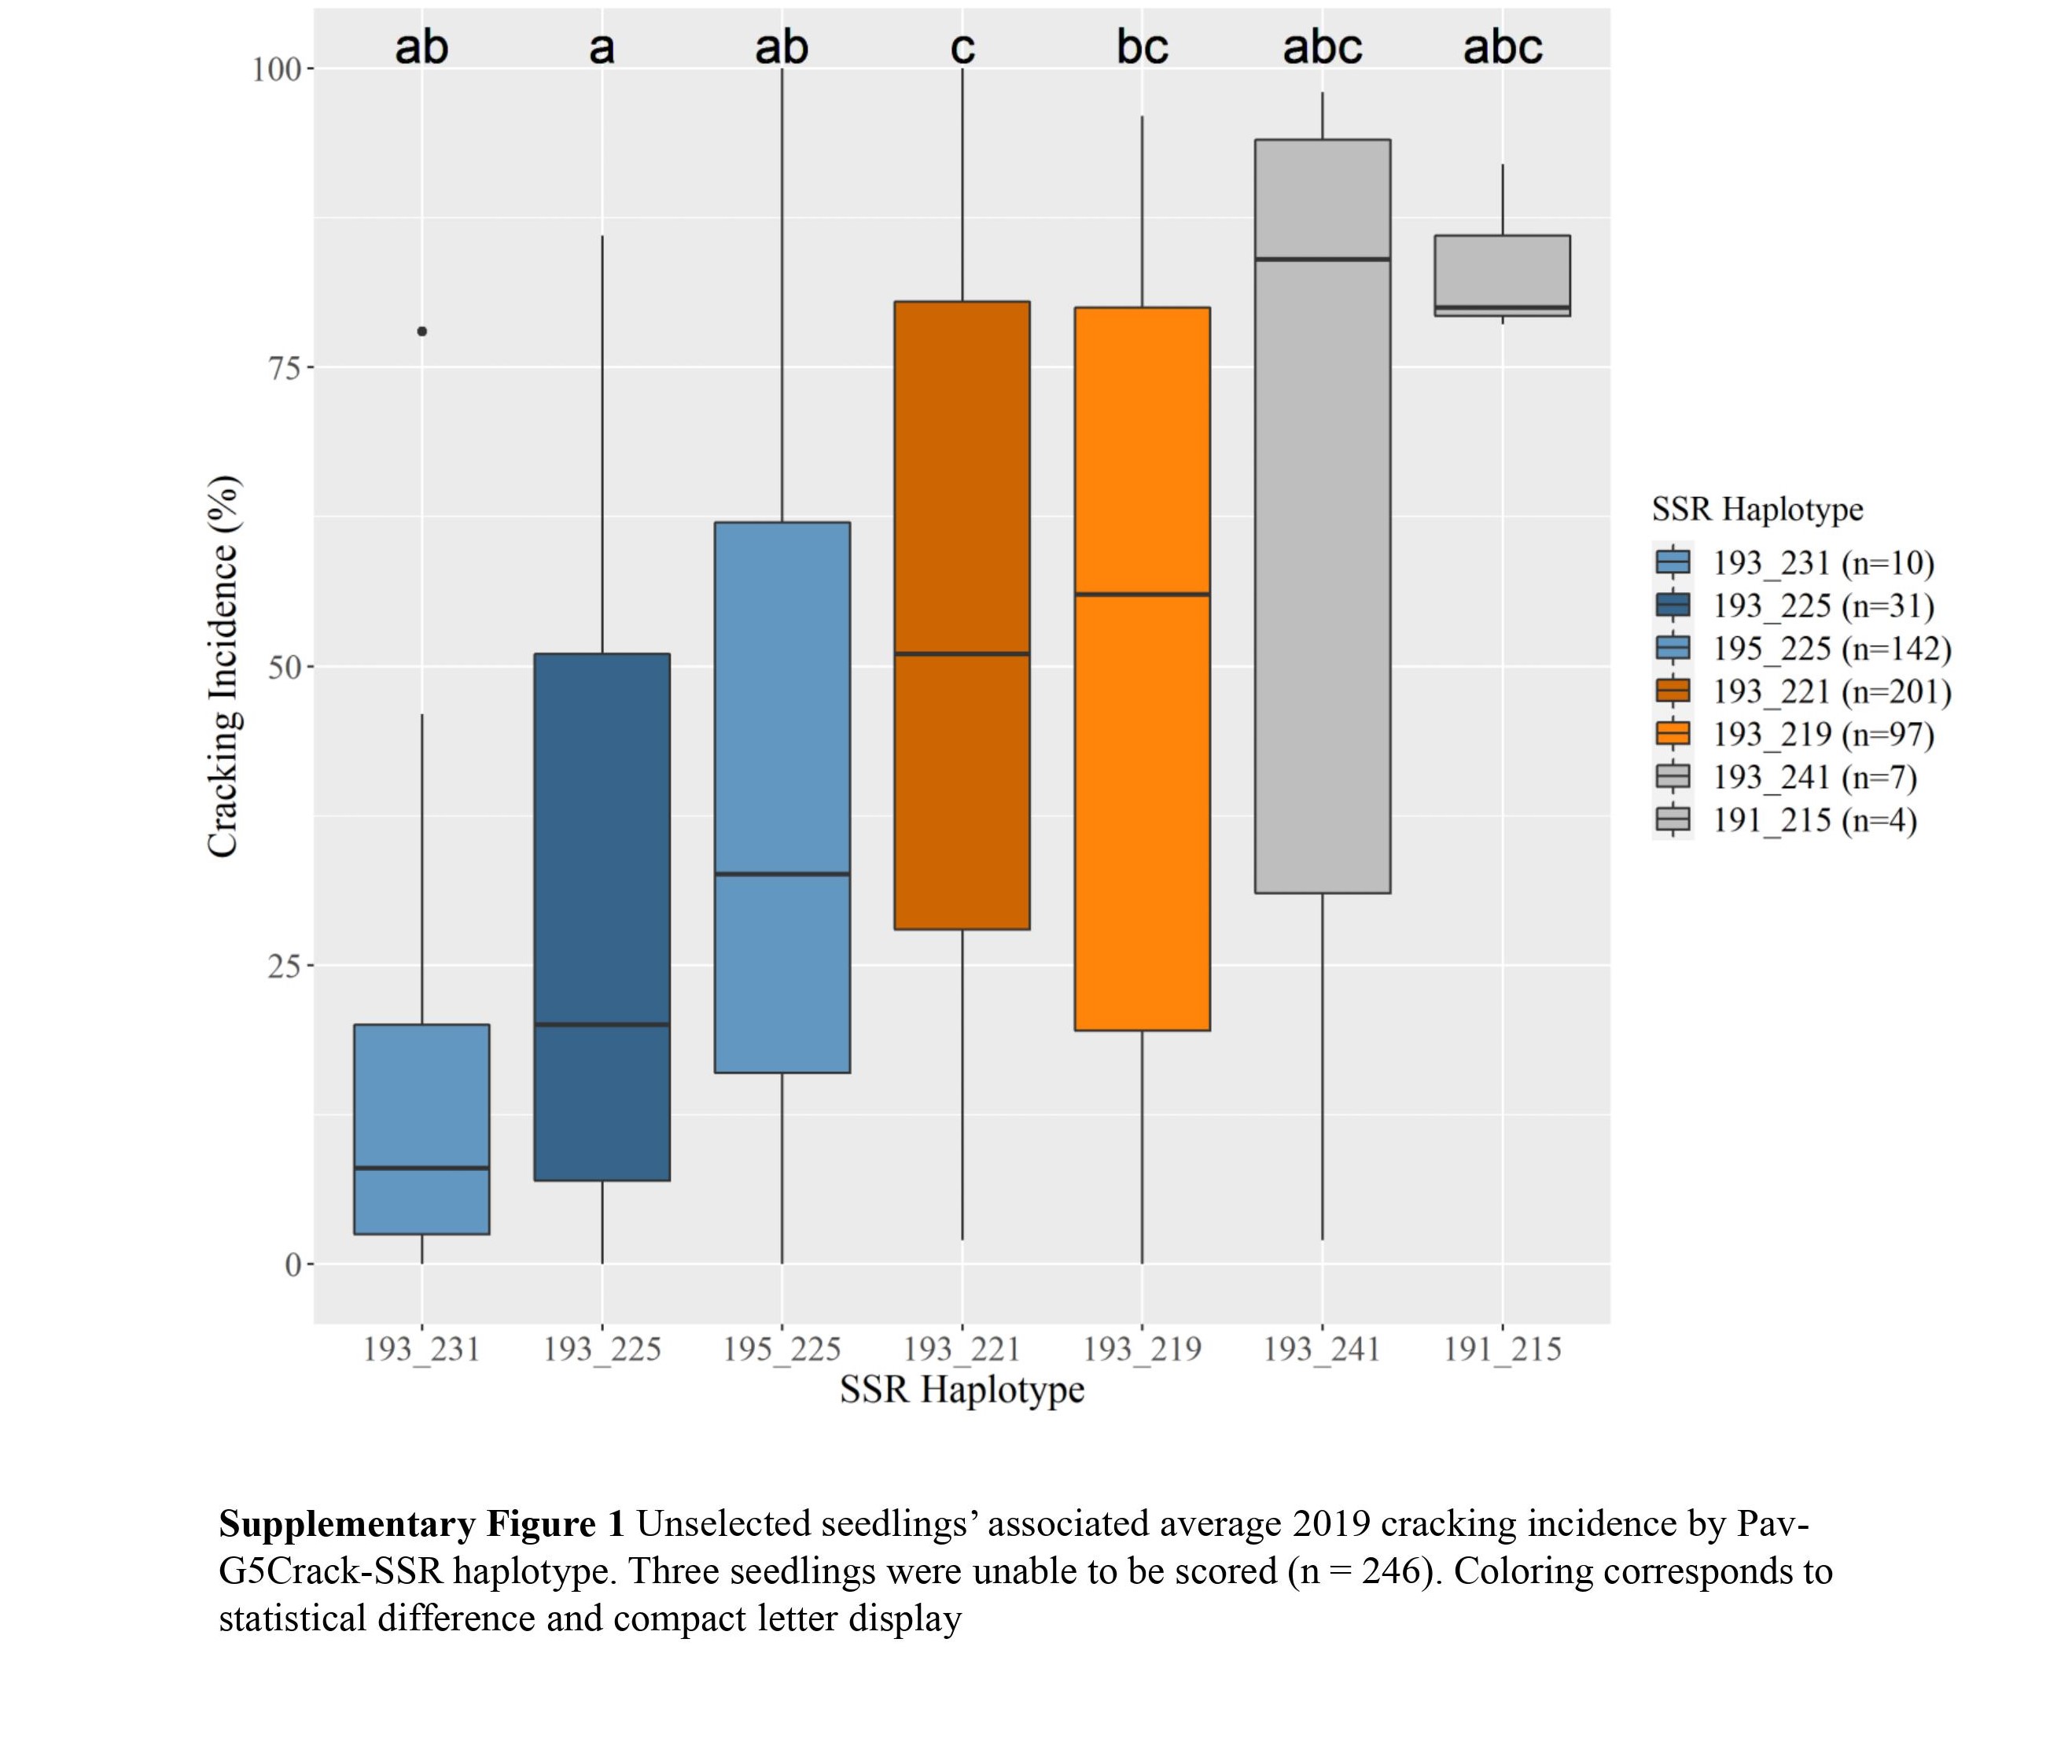
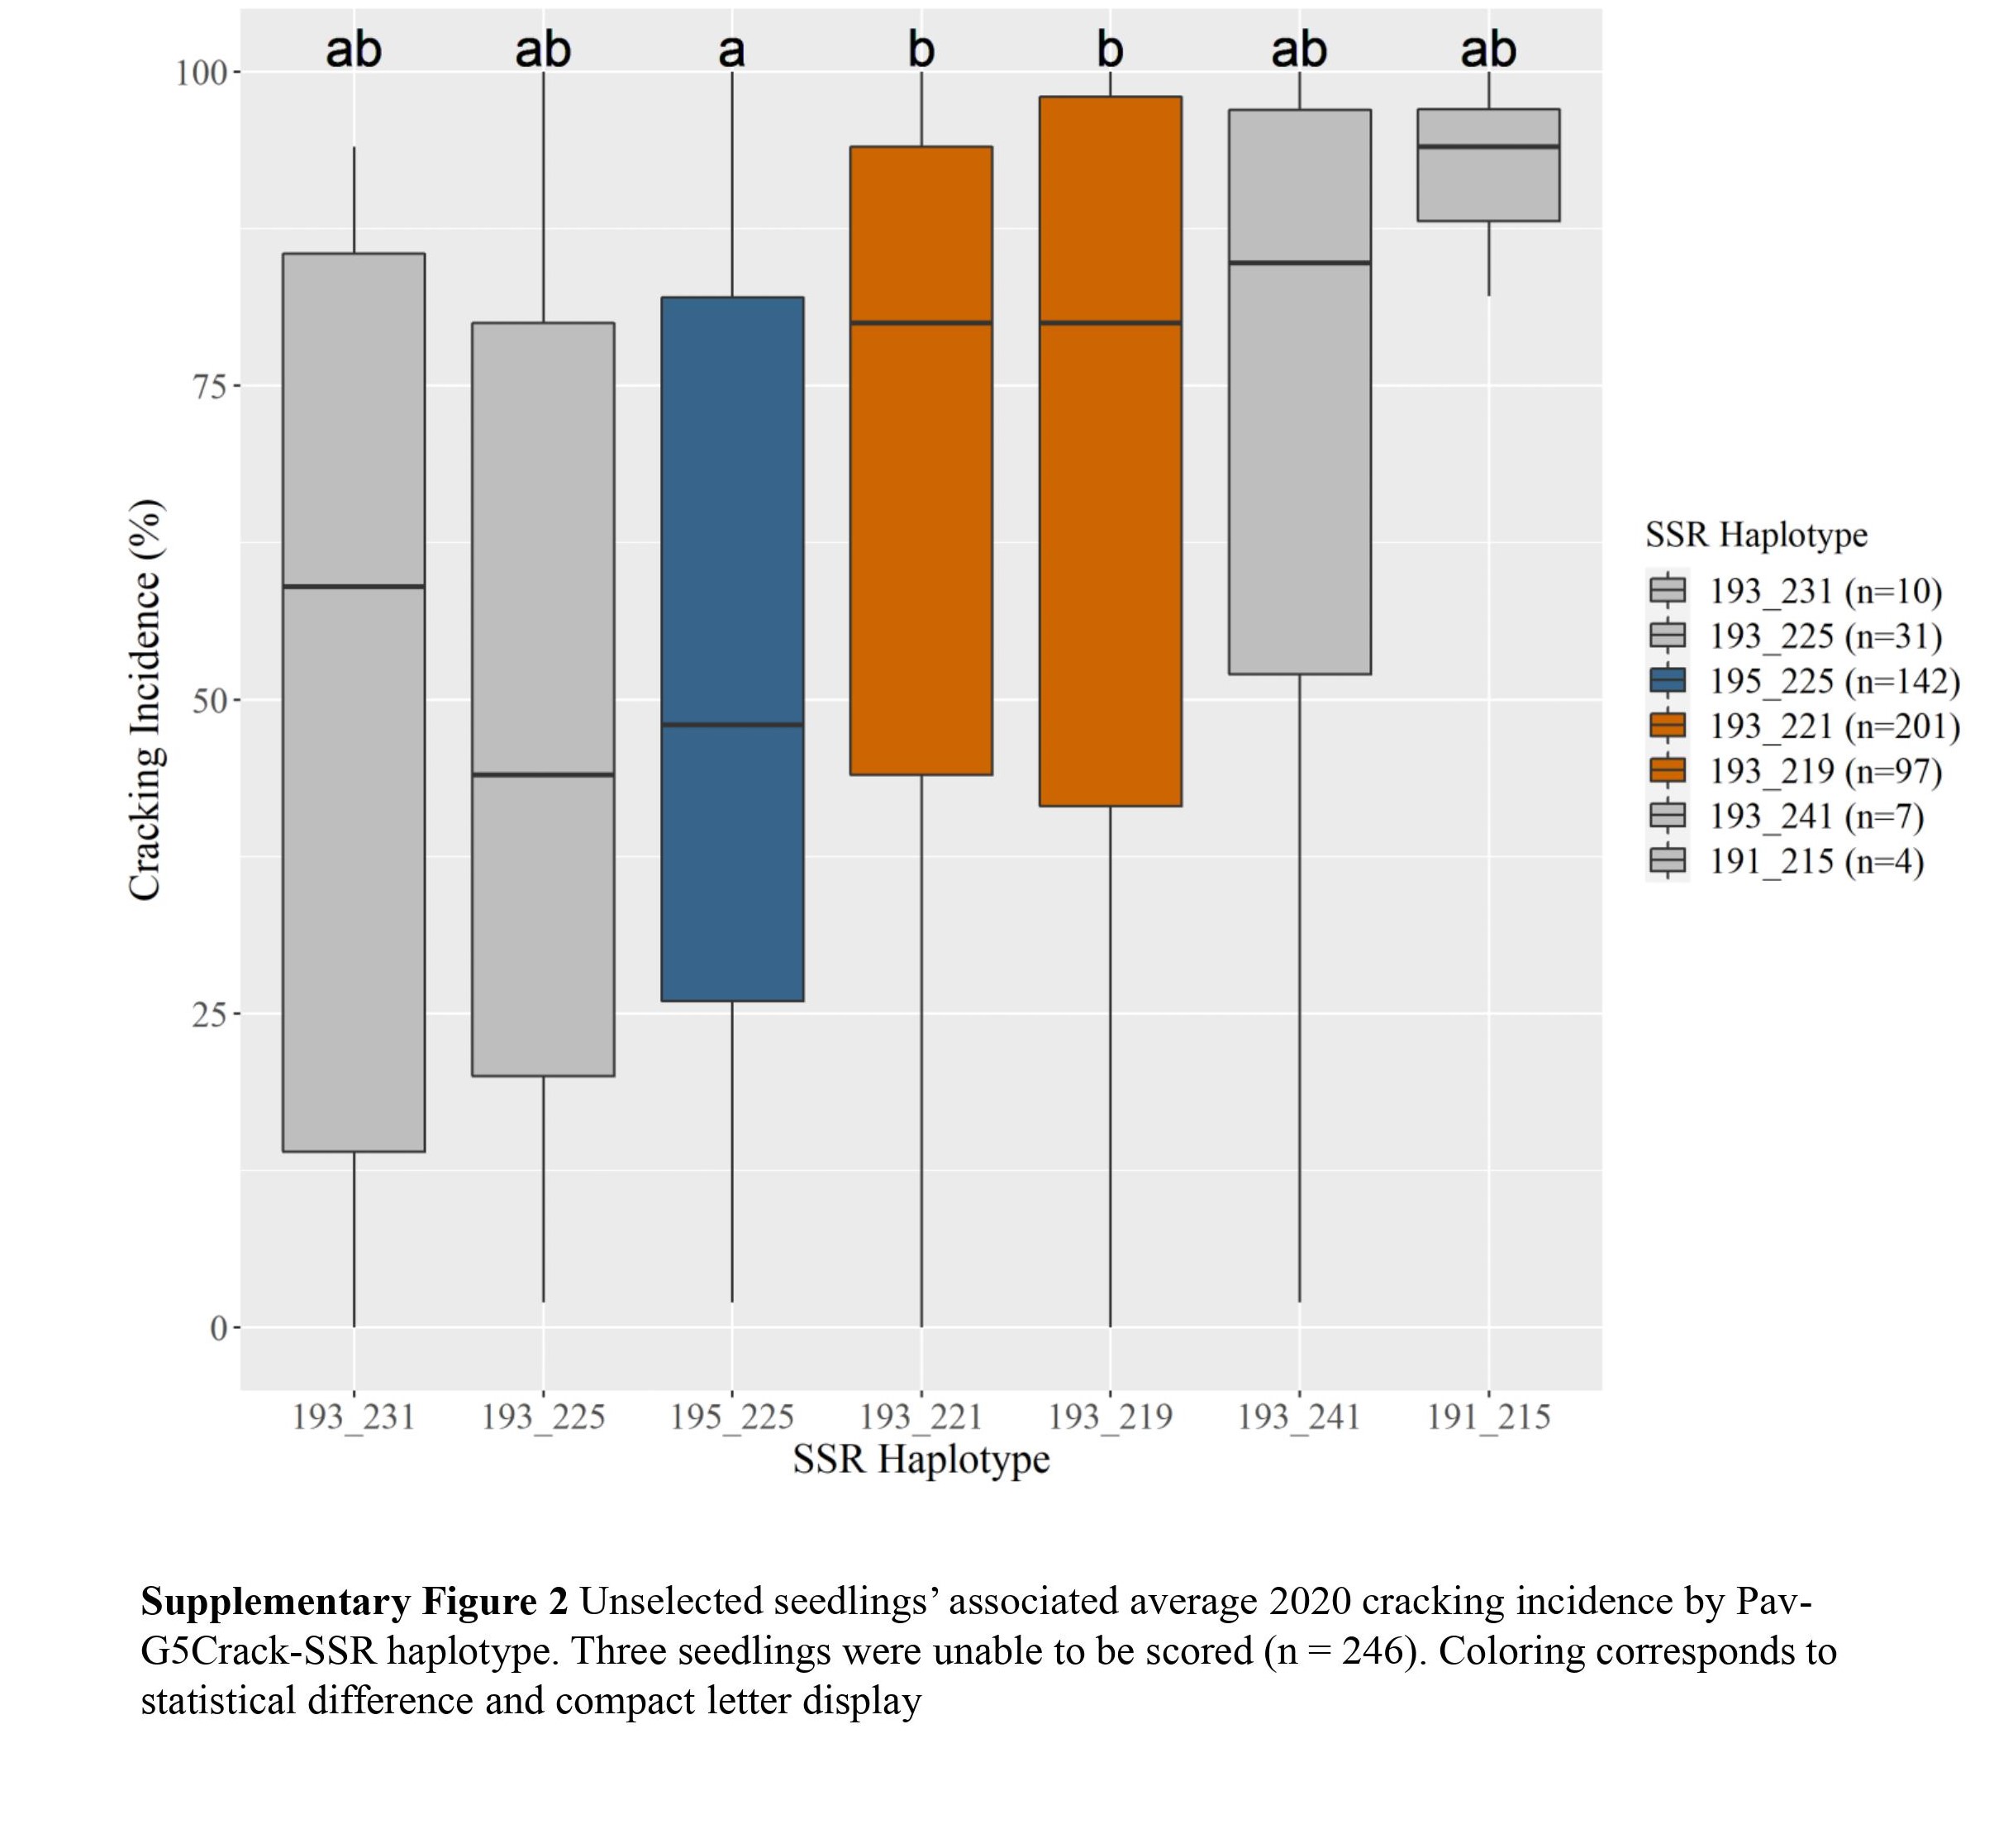
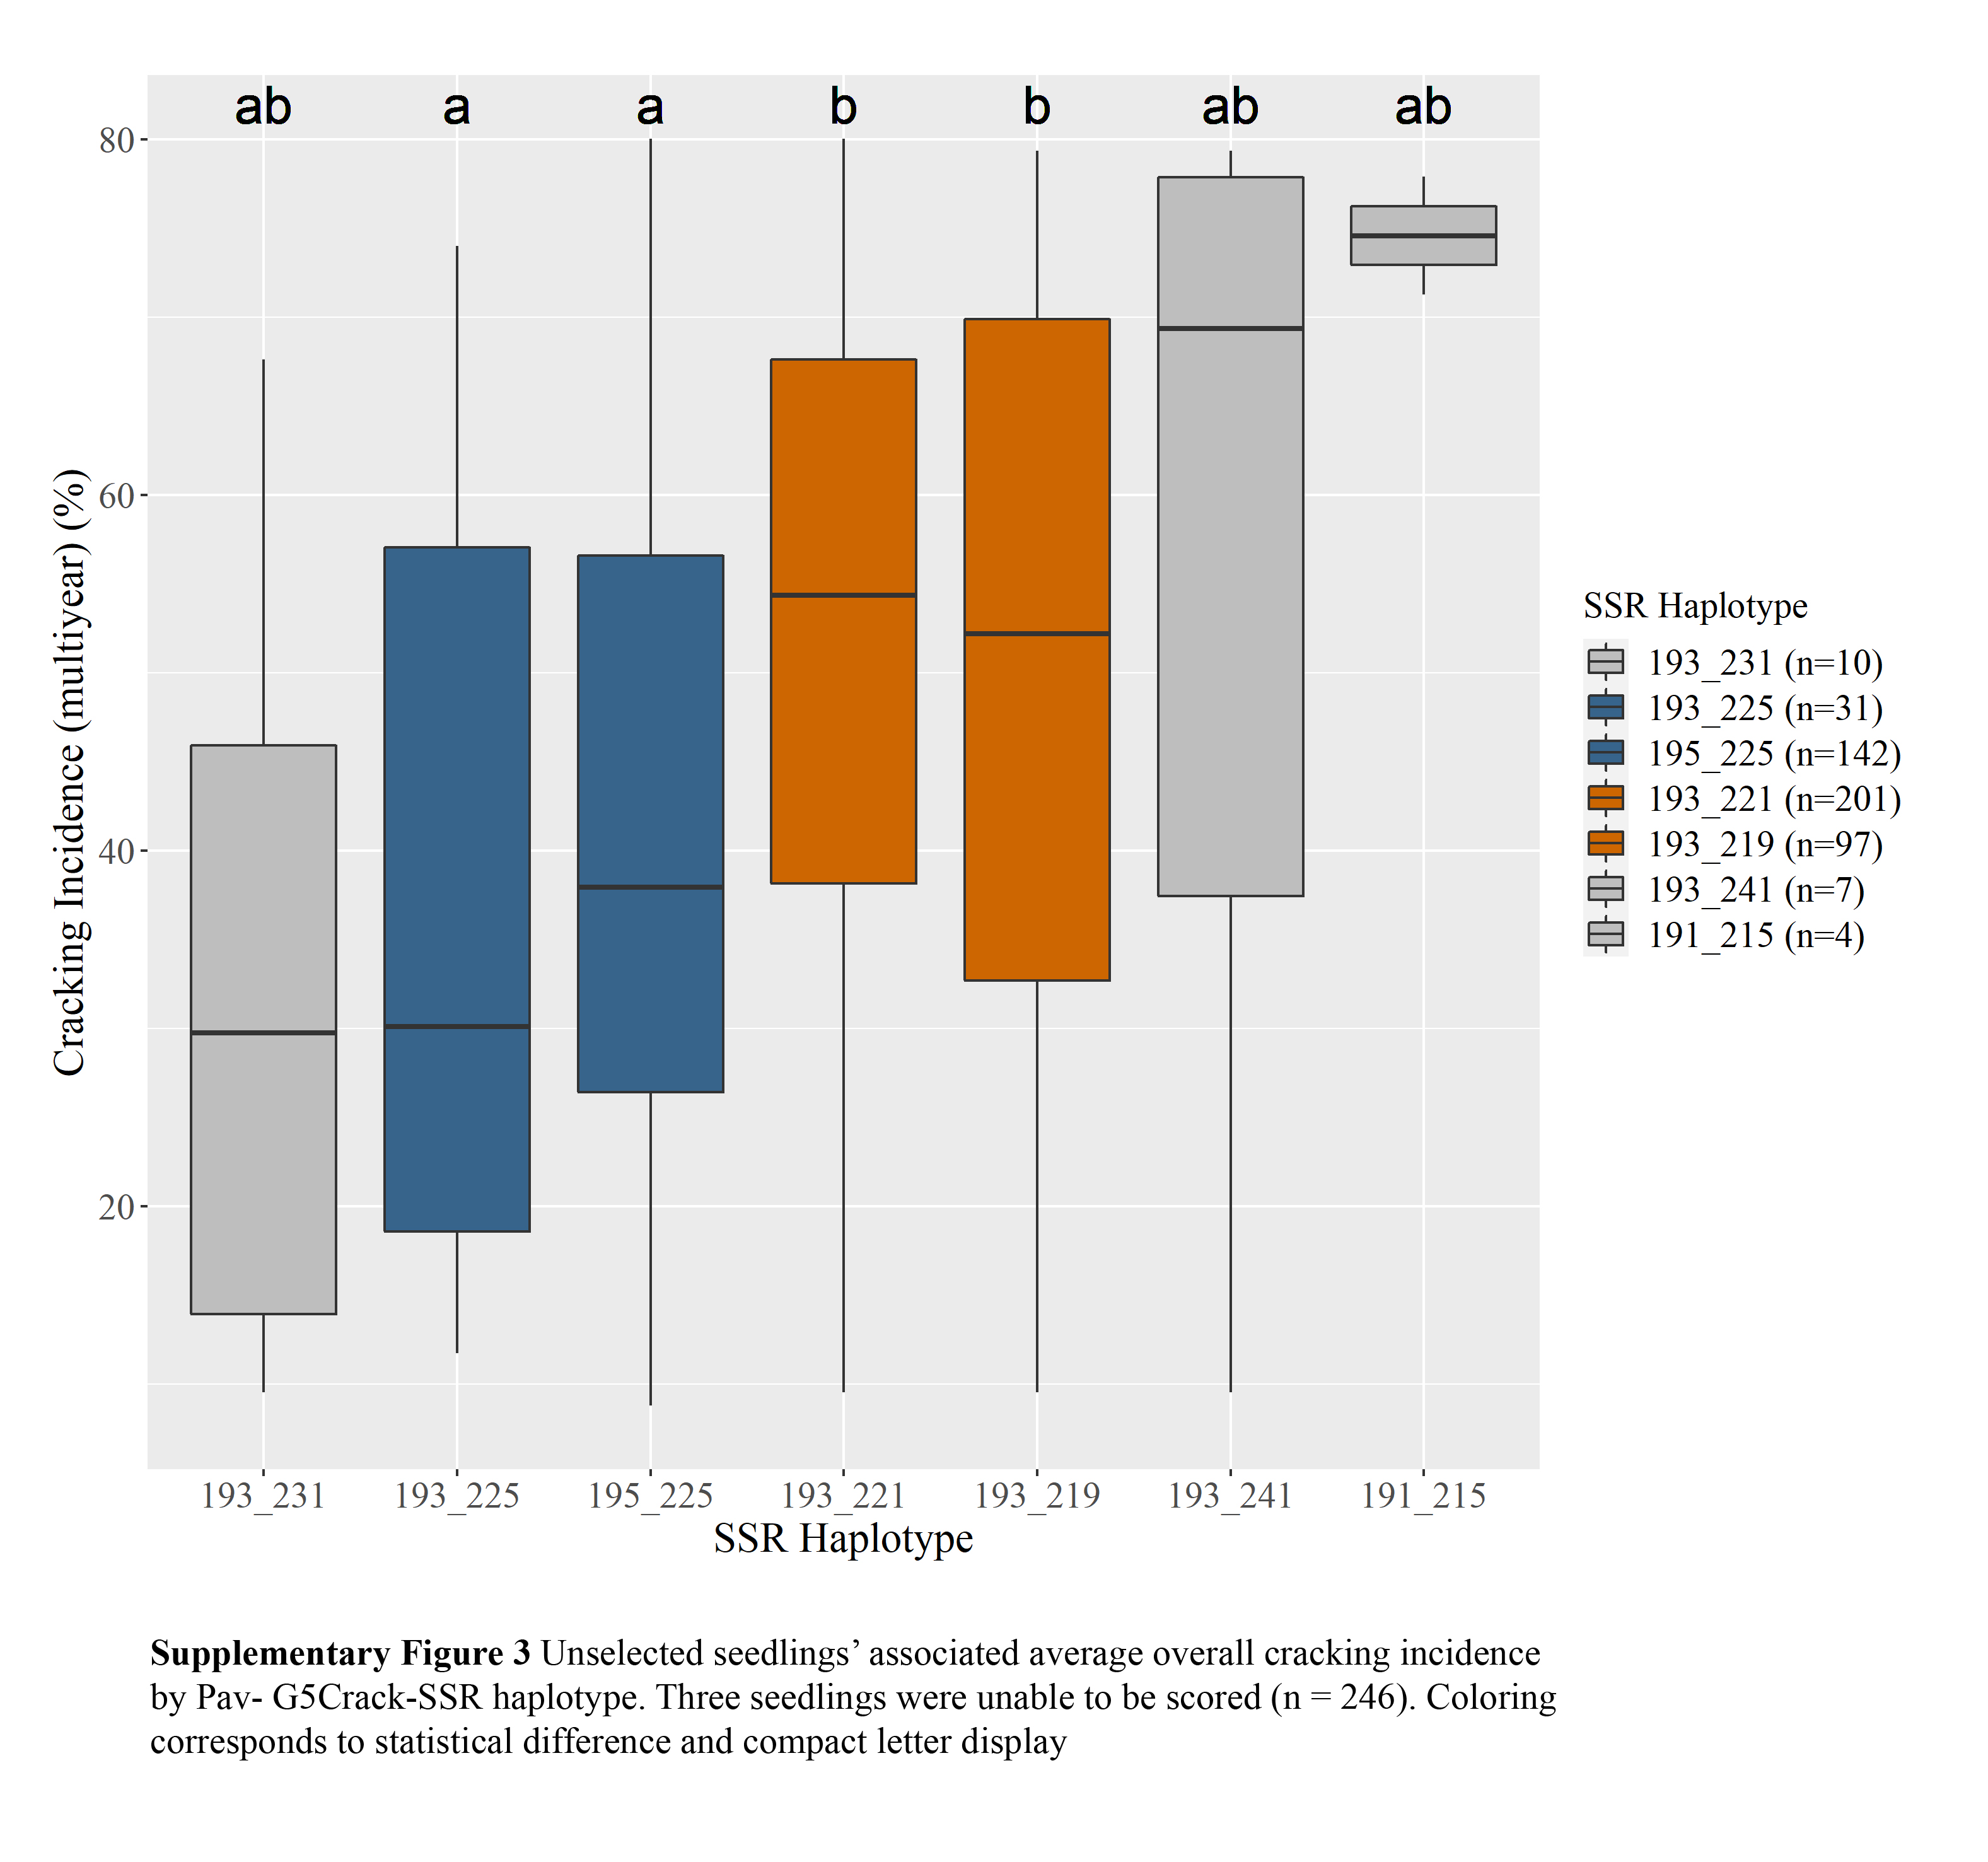
c Diplotypes represented five or more times shown.Two Pav-G5Crack-SSR haplotypes, 193_225 and 195_225, were associated with significantly less cracking than two other haplotypes, 193_221 and 193_219, in either 2019 or 2020 and in the multiyear analysis (Table 2; Supplemental Figs S1, S2 & S3). In the germplasm evaluated, these 'low-cracking haplotypes' were from the parents 'Kordia' and 'Regina' (193_225) and 'Cowiche', 'Lapins', and 'Sweetheart' (195_225) (Table 1; Fig. 1). The 'high-cracking haplotypes' were from parents 'Benton', 'Bing', 'Chelan', 'Kiona', 'Rainier', 'Regina', and 'Tieton' (193_219) and 'Ambrunes', 'Bing', 'Chelan', 'Cowiche', 'Lapins', 'Rainier', and 'Sweetheart' (193_221) (Table 1; Fig. 1). The SSR haplotype with the least representation, 191_215 (n = 4), was associated with the highest average cracking incidence in both 2019 and 2020, 84% and 92% cracked fruit, respectively (Table 2; Supplemental Fig. S2, S3). However, this haplotype's associated cracking incidences were not significantly different from any other haplotype, likely due to the small sample size. The only parental cultivar that carried this SSR haplotype was 'Dzherlo' (Table 1 & 2).
Table 2. Average cracking incidence associated with Pav-G5Crack-SSR haplotypes and diplotypes.
SSR haplotype n 2019 cracking
incidence
(%)2020 cracking
incidence
(%)Multiyear
cracking
incidence (%)SSR diplotype1 n 2019 cracking
incidence
(%)2020 cracking
incidence
(%)Multiyear
cracking
incidence (%)191_215 4 84 abc 92 ab 75 ab 193_219 / 193_219 8 61 ab 78 ab 58 ab 193_219 97 49 bc 68 b 50 b 193_219 / 193_221 44 57 ab 79 b 57 b 193_221 201 53 c 67 b 51 b 193_219 / 193_225 8 36 ab 49 ab 38 ab 193_225 31 28 a 48 ab 36 a 193_219 / 195_225 26 35 ab 51 a 39 a 193_231 10 18 ab 52 ab 33 ab 193_221 / 193_221 39 55 b 70 ab 53 ab 193_241 7 62 abc 69 ab 56 ab 193_221 / 193_225 12 35 ab 65 ab 45 ab 195_225 142 40 ab 51 a 41 a 193_221 / 195_225 58 50 ab 55 a 46 ab 193_225 / 195_225 9 18 a 29 a 25 ab 193_231 / 195_225 7 23 ab 62 ab 39 ab 195_225 / 195_225 20 36 ab 46 a 38 ab Adjusted r2 12% 13% 15% 1 Diplotypes represented five or more times included. Compact letter displays next to each cracking incidence indicate statistical differences ( p < 0.05) among SSR haplotypes' associated cracking incidences within a column (year) 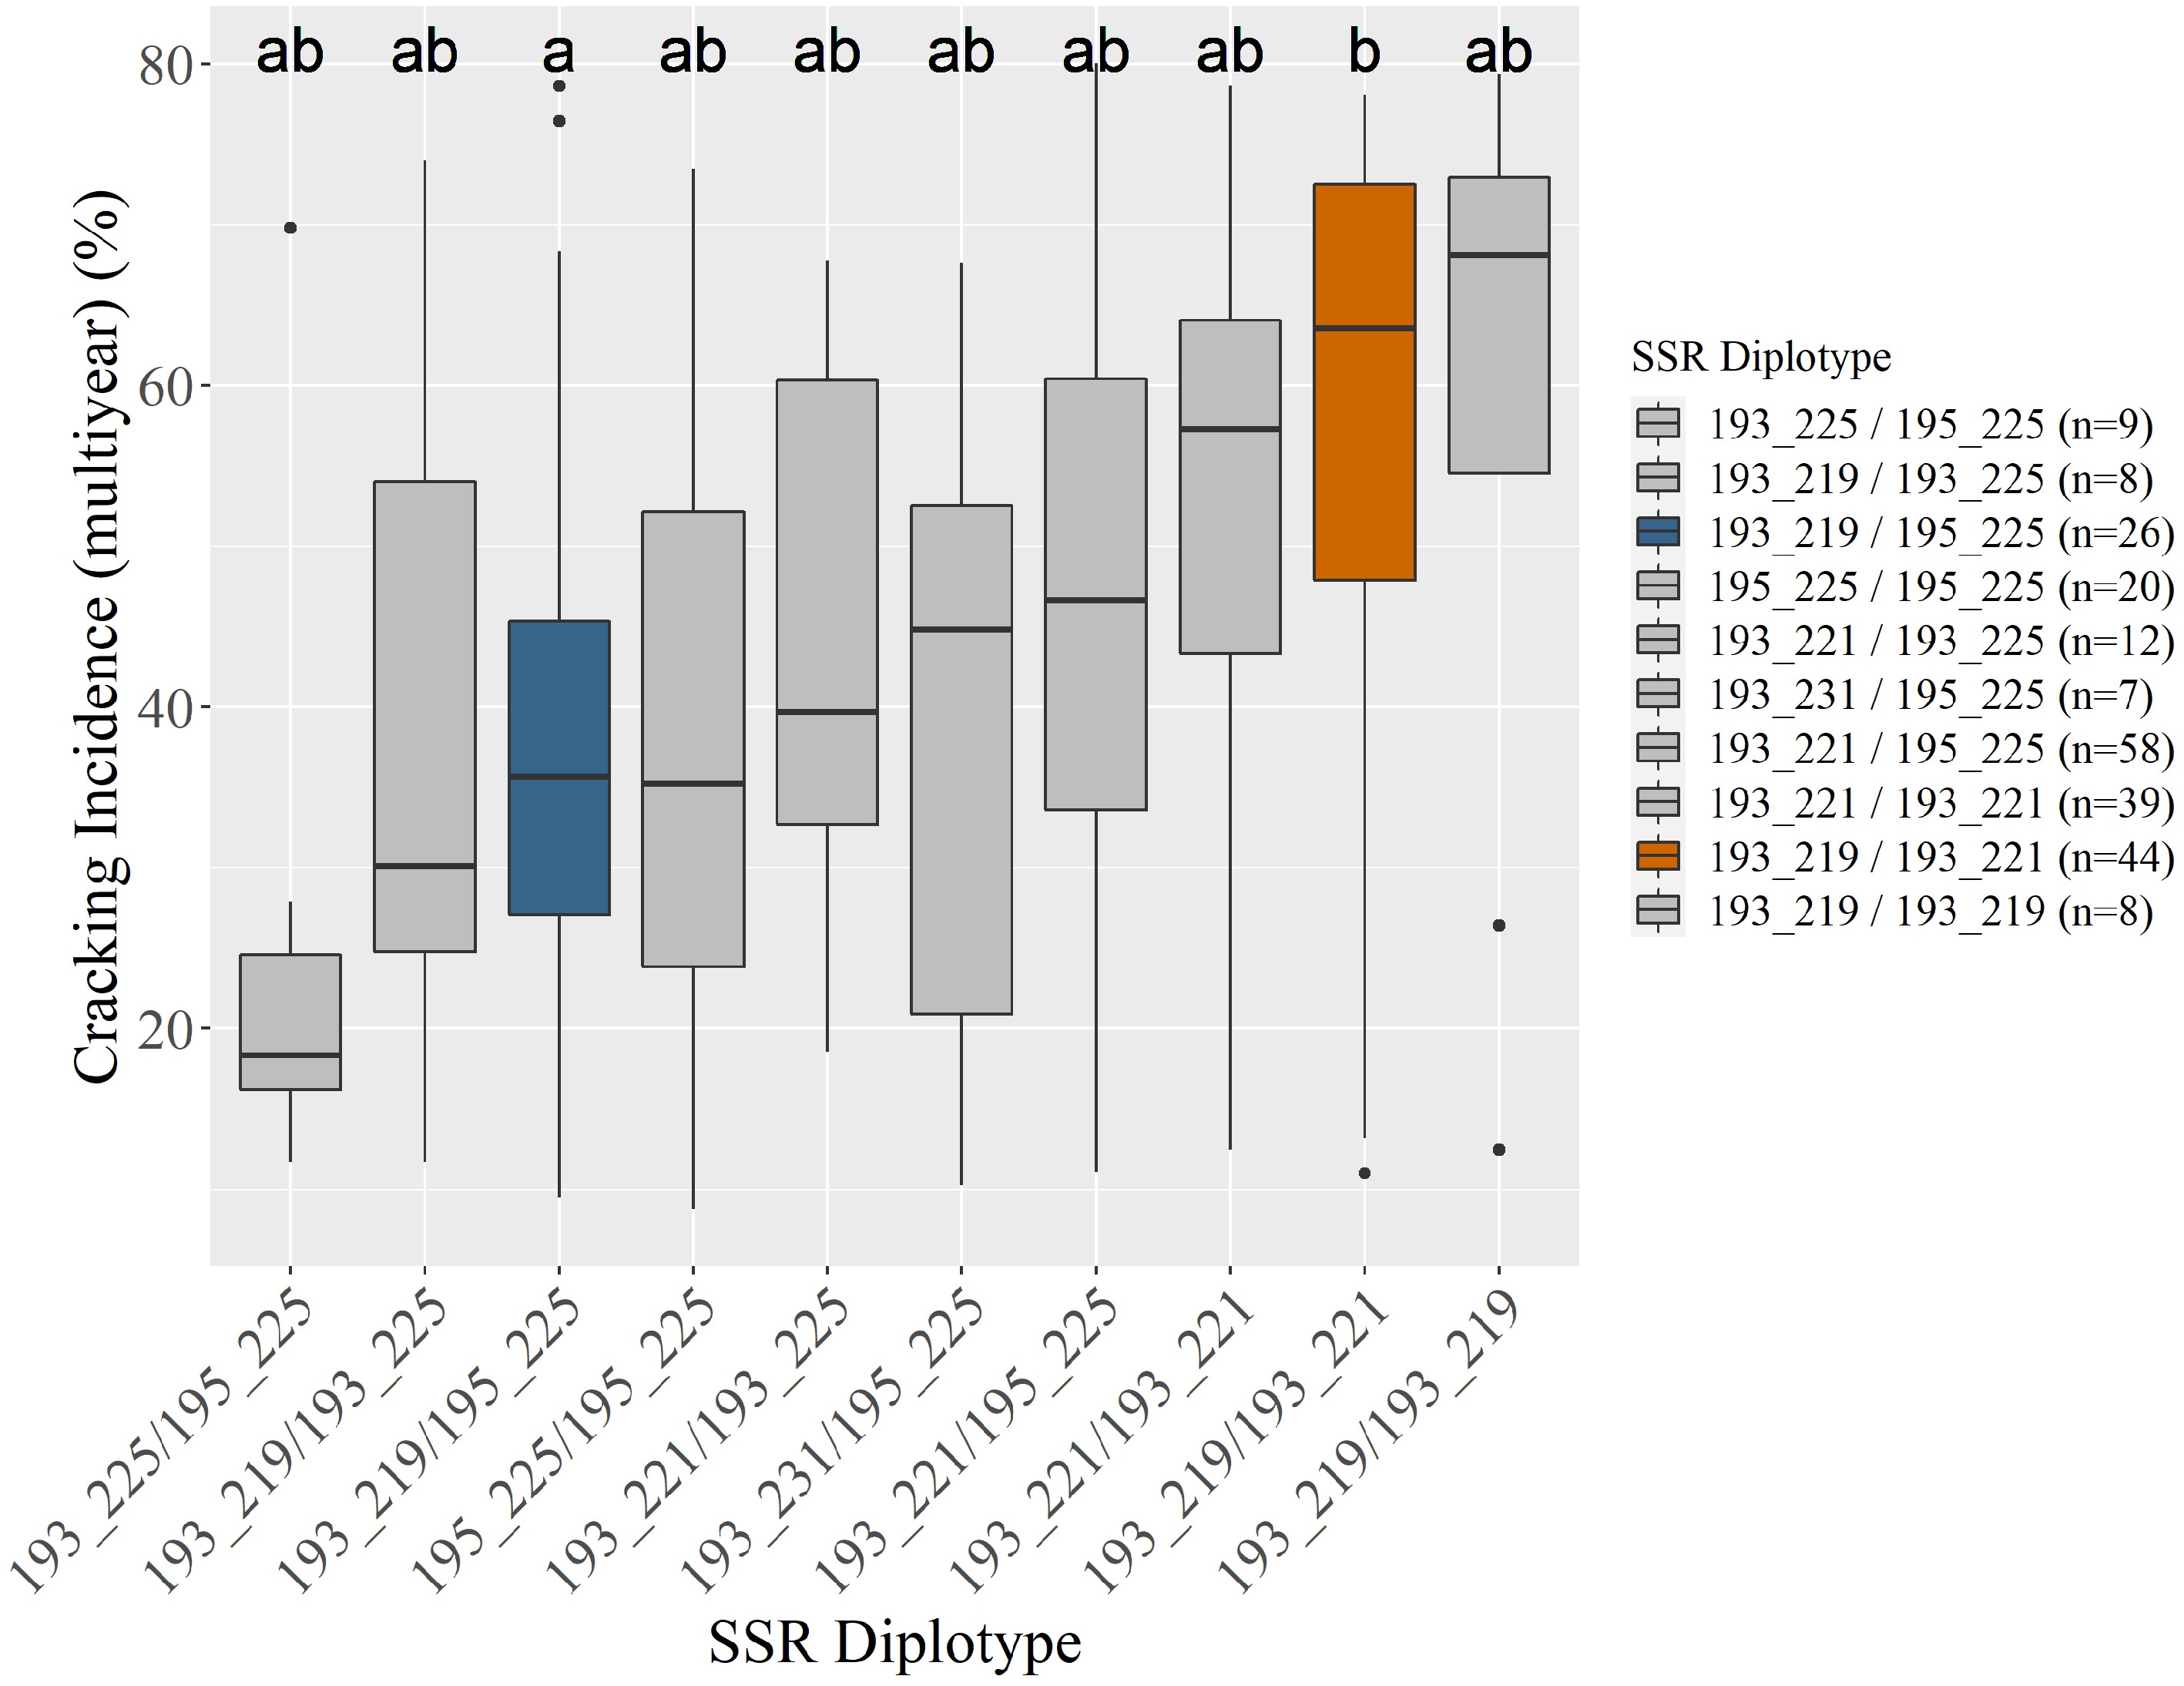
Figure 1.
Unselected seedlings' (n = 246) associated average multiyear cracking incidence by Pav-G5Crack-SSR diplotype (a). Three seedlings were unable to be scored. Coloring in (a) indicates an SSR diplotype's associated cracking incidence being significantly different from at least one other diplotype, corresponding with the compact letter display and graphical display (b). All subsequent figures use the coloring in (b). Gray indicates no assigned effect (insufficient significant differences).
Pav-G5Crack-SSR haplotypes 193_225 and 195_225 (both putative low-cracking haplotypes) were not significantly different from each other (Supplemental Figs S1, S2 & S3). Assuming no need to distinguish these two haplotypes, Pav-G5Crack-SSR was able to be simplified by only targeting position B, with position A only being necessary to distinguish 193_225 from 195_225 (Table 1). This simplified Pav-G5Crack-SSR DNA test explained the same amount of phenotypic variance as both positions together (results not shown).
Clear trends were visible among the SSR diplotypes' associated cracking incidence (Fig. 1; Table 2), however these trends were not always significant. This lack of statistical significance is likely also due to the small diplotype group sizes, with the diplotypes associated with both the highest and lowest multiyear average cracking incidence (193_219 / 193_219 and 193_225 / 195_225, respectively) having only eight and nine representative seedlings (Fig. 1; Table 2). In each year's data analyzed, as well as multiyear cracking incidence data, there were at least two SSR diplotypes associated with significantly contrasting cracking levels (Table 2, Fig. 1). As expected from the SSR haplotype contrasts, all diplotypes that were associated with significantly lower cracking had at least one of the putative low-cracking haplotypes (Table 2). The Pav-G5Crack-SSR DNA test explained 12, 13, and 15% of the 2019, 2020, and multiyear phenotypic variance, respectively (Table 2).
SNP-based cracking DNA tests
-
After preliminary testing it was observed that all three primer pairs for the Pav-G1Crack-SNP and Pav-G5Crack-SNP DNA tests had sufficient amplification (results not shown). The subsequently developed Pav-G1Crack-SNP DNA test was composed of two SNP markers targeting the previously reported cracking QTL, qCrack-LG1.1m, on linkage group (LG) 1. Pav-G1Crack-SNP genotype group names were a concatenation of the two SNP genotypes in the order of SNP ss490546566 and ss490546574 (Table 3). SNPs ss490546566 and ss490546574 were located on LG1 at 44.95 and 45.05 cM, respectively. SNP ss490546574 alone could differentiate the putative low-cracking qCrack-LG1.1m haplotype H2[21] (Supplemental Table S3), while ss490546566 additionally grouped haplotypes H5, H6, H7, and H11 together that shared a common allele at this SNP (Supplemental Table S3). Three of these SNP haplotypes (H5, H6, H7) had below-average cracking incidence using the 2019, 2020, and multiyear cracking estimates, aside from H6 in 2020[21]. Pav-G5Crack-SNP DNA test was composed of one SNP marker targeting qCrack-LG5.1m[21], the same target of Pav-G5Crack-SSR. SNP ss490554283 was located on LG5 at 32.7 cM, and differentiated qCrack-LG5.1m SNP haplotypes H2 and H5, both of which were putative low-cracking,[21] from all others (Supplemental Table S3).
Table 3. Phenotypic values for two fruit cracking incidence DNA tests.
Pav-G1Crack-SNP DNA test Pav-G5Crack-SNP DNA test Genotype1 n 2019 cracking
incidence
(%)2020 cracking
incidence
(%)Multiyear
cracking
incidence (%)Genotype1 n 2019 cracking
incidence
(%)2020 cracking
incidence
(%)Multiyear
cracking
incidence (%)AA_AA 76 54 a 69 a 53 a AA 104 56 a 74 a 55 a AA_AB 5 53 abc 76 abc 52 abc AB 114 43 b 55 b 43 b AB_AA 40 48 abc 65 ac 49 ac BB 31 27 c 40 b 33 c AB_AB 79 50 ac 65 ac 50 a BB_AB 17 28 bc 40 bc 32 bc BB_BB 28 27 b 29 b 27 b Adjusted r2 7% 15% 15% 9% 12% 12% 1 Only genotype groups with five or more representatives are shown. Where more than one SNP is in a DNA test, genotype groups are designated as the combined genotype across SNPs, with an underscore separating genotypes of individual SNPs. Compact letter display indicates a significant difference ( p < 0.05) within a column (year). HRM genotypic groups for the Pav-G1Crack-SNP and Pav-G5Crack-SNP DNA test successfully mirrored SNP array genotypes in 99.1% of genotyped seedlings. There were stable (i.e., consistent across the two years) differences in cracking associated with contrasting genotype groups using both the Pav-G1Crack-SNP and Pav-G5Crack-SNP DNA tests (Table 3). Using Pav-G1Crack-SNP, genotype group BB_BB was associated with less cracking than AA_AA and AB_AB in comparing 2019, 2020, and multiyear cracking levels, and was associated with less cracking than genotype group AB_AA in 2020 and multiyear (Table 3). In addition to being associated with higher cracking than group BB_BB, group AA_AA was also associated with higher cracking than group BB_AB in all years (Table 3). Using Pav-G5Crack-SNP, the three genotype groups were all associated with significantly different cracking levels except in 2020 (Table 3). Comparing the associated cracking levels among genotype groups of the two cracking DNA tests combined also resulted in significant contrasts (Table 4). Genotype groups BB_BB_AB and AB_AB_AB were associated with a significantly lower average cracking incidence than groups AA_AA_AA, AB_AB_AA, and AB_AA_AA in 2020 and multiyear (Table 4; Fig. 2). While not statistically different from any other group, genotype group BB_BB_BB (n = 5) had the lowest average cracking incidence recorded in both years and multiyear (Table 4; Fig. 2). The Pav-G1Crack-SNP DNA test explained 7, 15 and 15% of the 2019, 2020, and multiyear phenotypic variance, while Pav-G5Crack-SNP explained 9 to 12% (Table 3). Combined, the two DNA tests explained 16, 30, and 29% of the 2019, 2020, and multiyear phenotypic variance, respectively (Table 4).
Table 4. Phenotypic values for combined DNA tests.
Pav-G1Crack-SNP & Pav-G5Crack-SNP DNA tests Pav-G1Firm-SNP & Pav-G3Firm-SNP DNA tests Genotype1 n 2019 cracking
incidence
(%)2020 cracking
incidence
(%)Multiyear
cracking
incidence (%)Genotype n 2020 firmness
(g/mm)Multiyear firmness
(g/mm)BB_BB_BB 5 11a 10 abc 15 abc BB_BB 7 399 a 341 a BB_AB_AB 5 27 a 21 abc 25 ac BB_AA 5 369 acd 313 acd BB_BB_AB 12 27 a 31 a 25 a BB_AB 16 355 acd 304 ad BB_BB_AA 11 35 a 35 ac 32 ac AB_BB 12 354 acd 296 acd AA_AA_BB 8 35 a 41 abc 35 abc AB_AB 44 343 ad 293 a BB_AB_AA 9 34 a 59 abc 42 abc AA_BB 13 326 abcd 284 acd AB_AB_BB 9 32 a 58 abc 43 abc AB_AA 46 302 bcd 264 cd AB_AA_AB 24 39 a 59 abc 43 abc AA_AB 42 292 bc 261 bc AB_AB_AB 37 45 a 55 a 44 a AA_AA 64 265 b 236 b AA_AA_AB 31 52 a 66 abc 51 abc AA_AA_AA 37 60 a 79 b 58 bc AB_AB_AA 33 62 a 79 bc 59 bc AB_AA_AA 12 74 a 91 bc 68 b Adjusted r2 16% 30% 29% 22% 28% 1 Only genotype groups with five or more representatives are shown. Genotype groups are designated as combined genotype across multiple SNPs of a DNA test, with an underscore separating genotypes of individual SNPs. Compact letter display indicates statistical difference ( p < 0.05) within a column (year). 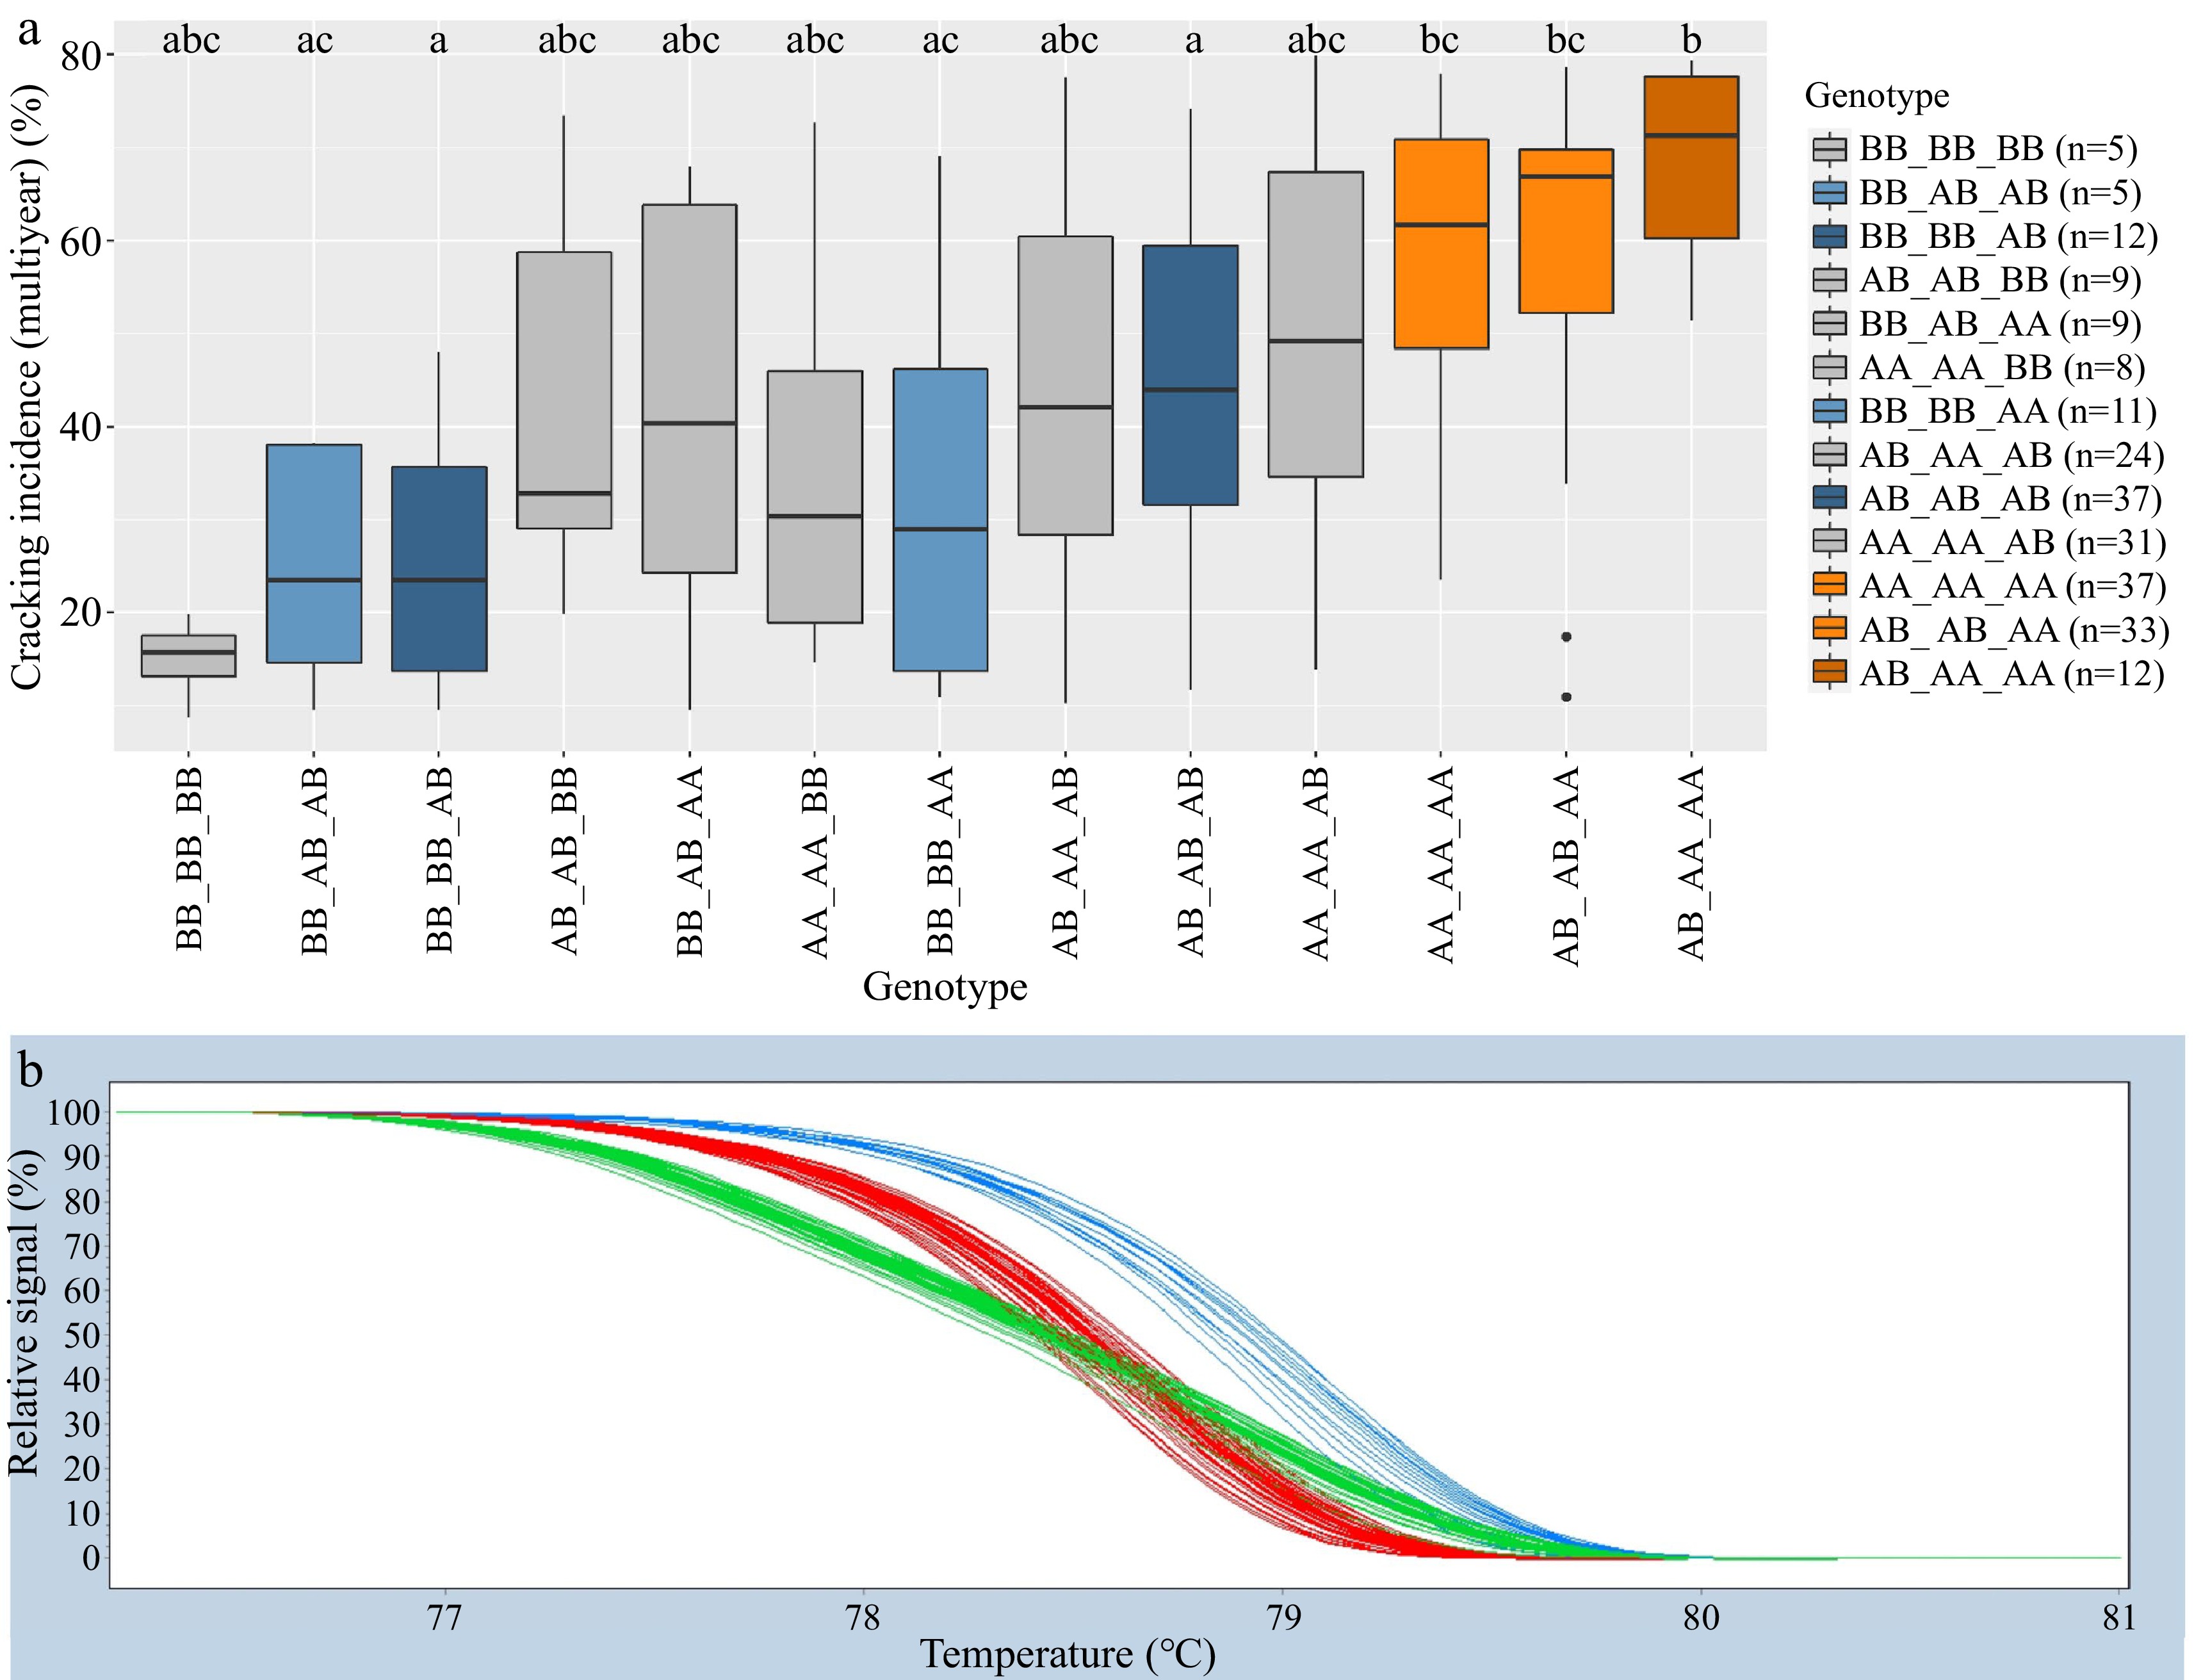
Figure 2.
Combined Pav-G1Crack-SNP Pav-G5Crack-SNP DNA tests − phenotypic associations (a). The combined genotypes are indicated with an underscore separating the genotypes of individual SNPs. Coloring of associated phenotypic effects corresponds to Figure 1b and indicates statistical significance. Representative HRM curve from SNP ss490554283, the SNP included in the Pav-G5Crack-SNP DNA test (b); each line represents one seedling (blue = BB, red = AA, green = AB).
SNP-based firmness DNA tests
-
After preliminary testing it was observed that the two primer pairs for Pav-G1Firm-SNP and Pav-G3Firm-SNP DNA tests also had sufficient amplification (results not shown). The Pav-G1Firm-SNP DNA test was composed of one SNP marker that targeted qFirm-LG1.2m. SNP ss490546574, also used in the Pav-G1Crack-SNP DNA test described above, was located on LG1 at 45.05 cM. This SNP differentiated the previously reported putative high-firmness qFirm-LG1.2m haplotype of H2 (Supplemental Table S3) from all other SNP haplotypes (Supplemental Table S3). The Pav-G3Firm-SNP DNA test was also composed of one SNP marker but targeted qFirm-LG3.2m. SNP ss490551714 was located on LG3 at 49 cM, and successfully differentiated the reported putative high-firmness qFirm-LG3.2m haplotype H2 from all other SNP haplotypes (Supplemental Table S3).
HRM genotypic groups for Pav-G1Firm-SNP and Pav-G3Firm-SNP successfully mirrored SNP array genotypes for 98.8% of genotyped seedlings. Significant differences among genotype groups were identified in 2020 and multiyear for both Pav-G1Firm-SNP and Pav-G3Firm-SNP individually as well as together (Tables 4, 5; Fig. 3). All genotype groups of Pav-G1Firm-SNP were associated with significantly different firmness levels (Table 5). Genotype groups AB and BB of Pav-G3Firm-SNP were associated with higher firmness levels than AA in 2020 and multiyear data (Table 5). Considering the firmness DNA tests together, genotype group BB_BB was associated with significantly higher 2020 and multiyear firmness levels than groups AB_AA, AA_AB, and AA_AA, while the group associated with the lowest firmness levels, AA_AA, was associated with significantly less-firm fruit than all groups except AA_BB, AB_AA, and AA_AB in 2020 and AB_AA and AA_AB for multiyear firmness levels (Table 5; Fig. 3). Pav-G1Firm-SNP explained 16 and 19% of the 2020 and multiyear firmness phenotypic variance, respectively, while Pav-G3Firm-SNP explained 11 and 14% of the 2020 and multiyear firmness phenotypic variance, respectively (Table 5). The combined tests explained 22 and 28% of the 2020 and multiyear firmness phenotypic variance, respectively (Table 5).
Table 5. Phenotypic values for two fruit firmness DNA tests.
Pav-G1Firm-SNP DNA test Pav-G3Firm-SNP DNA test Genotype n 2020 firmness (g/mm) Multiyear firmness (g/mm) Genotype n 2020 firmness (g/mm) Multiyear firmness (g/mm) AA 119 281 a 251 a AA 115 284 a 241 a AB 102 326 b 281 b AB 102 323 b 281 b BB 28 370 c 316 c BB 32 353 b 301 b Adjusted r2 16% 19% 11% 14% Compact letter display indicates significant difference (p < 0.05) within a column (year). 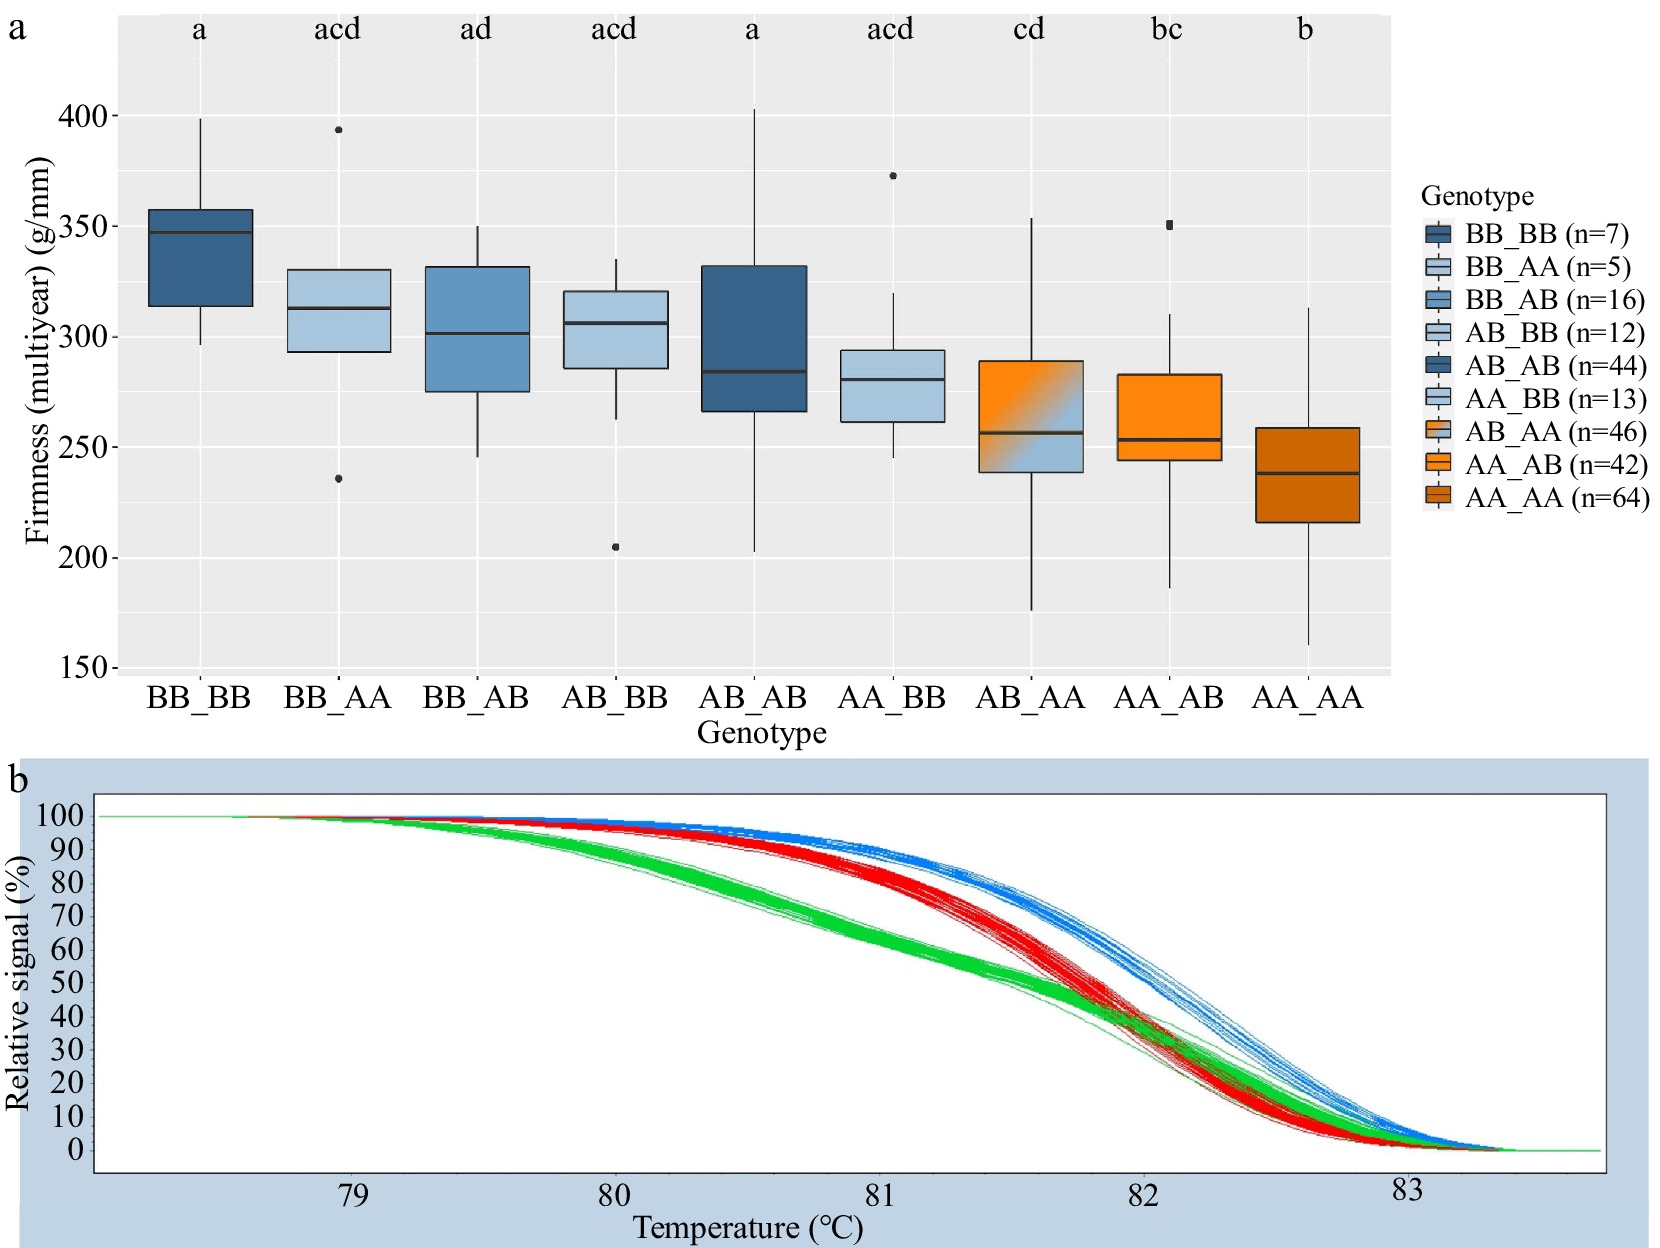
Figure 3.
Combined Pav-G1Firm-SNP and Pav-G3Firm-SNP DNA tests − phenotypic associations (a). The combined genotypes are indicated with an underscore separating genotypes of individual SNPs. Coloring of associated phenotypic effects corresponds to Fig. 1b and indicates statistical significance. Representative HRM curves from SNP ss490546574 of Pav-G1Firm-SNP (b); each line represents one seedling (blue = BB, red = AA, green = AB).
-
The previously created Pav-G5Crack-SSR DNA test was successfully validated, with its ability to detect multiple phenotype-associated alleles being one of the DNA test's advantages. SNP-based DNA tests for fruit cracking and firmness were also successfully developed and demonstrated via HRM. These DNA tests were easily performed and distinguished large phenotypic contrasts within the haplotypic variation at QTLs. The SNP-based DNA tests developed have direct significance to the PNWSCBP at WSU as they were validated in the same active breeding population used for QTL discovery. However, due to the inclusion of seedlings from many important breeding parents[28], these results should also have relevance for other breeding programs. Validation in new populations is still necessary to confirm any DNA test's utility.
Validation of Pav-G5Crack-SSR DNA test
-
While differences in cracking incidence among haplotypic groups were evident in 2019, 2020 and using the multiyear data, trends were more pronounced in 2019 and the multiyear data (Supplemental Figs S1, S2 & S3), perhaps due to the increased cracking incidence across all SSR haplotypes in 2020 (Supplemental Table S1) that reduced contrasts. While haplotype group 193_231 (almost entirely from 'Venus' and descendants) had the least 2019 and multiyear cracking incidence, its relatively sparse representation (n = 10) probably led to the lack of significant difference between its associated cracking incidence and other SSR haplotypes' for multiyear cracking incidence. This lack of representation could also explain why haplotypes 193_241 and 191_215 associated cracking incidence were not significantly different from other haplotypes (Supplemental Figs S1, S2 & S3).
Pav-G5Crack-SSR haplotype groups closely mirrored some of qCrack-LG5.1m haplotypes reported previously[21]. This mirroring suggested that Pav-G5Crack-SSR and Pav-G5Crack-SNP (devised to capture variation at qCrack-LG5.1m) targeted the same region on LG5. Mismatches between Pav-G5Crack-SSR and qCrack-LG5.1m haplotypes (12 total, Supplemental Table S4) could be due to recombination and/or miscalled SSR genotypes, the latter being a documented difficulty of SSRs[29].
With the phenotypic variance explained by Pav-G5Crack-SSR as well the estimated heritability of the trait taken into account, decisions could be made for how to deploy the test within a MASS system[30, 34]. Because the test explained 15% of the multiyear cracking variance and the estimated narrow-sense heritability (h2) was 0.34−0.54[21] (thus the predictiveness (P) of the test was 0.28−0.44), seedling selection weighted more by the results of the DNA test could increase genetic gain compared to sole reliance upon phenotypic seedling selection[30]. Because broad-sense heritability (H2) (a more broadly encompassing and holistic parameter in clonally propagated crops such as sweet cherry[35]) was not estimated, it is possible that P presented herein has an upward bias and should be taken into account by breeders interested in using the DNA test(s). Likewise, because PVE estimates derived from simple linear regression do not factor in background genetic variation, additional upward bias may also be present, especially if using this (and subsequently presented) DNA test(s) in germplasm not used here. In addition to MASS, due to the ability of SSRs to capture a wide array of allelic variation, this DNA test could also be used to help introduce new or less-common alleles via MAPS or MAI.
Cracking DNA tests
-
The two SNPs included in Pav-G1Crack-SNP were chosen for the DNA test due to their ability to generally distinguish putative high and low-cracking haplotypes, particularly the reported foremost putative low-cracking haplotype of H2 at qCrack-LG1.1m[21]. Because SNP ss490546574 was sufficient to distinguish H2 from all other haplotypes at qCrack-LG1.1m, this SNP could be useful to enrich a breeding population with this haplotype specifically. With SNP ss490546566 also included in the DNA test, the four other haplotypes it grouped together (H5, H6, H7, and H11) (of which, only H11 had consistently higher than average cracking incidence), a breeder could also enrich more broadly for haplotypes associated with lower cracking incidences. The sole source of H11 from the germplasm tested was 'Ambrunes', and thus this haplotype would only be in danger of being confounded where 'Ambrunes' was an intended parent in a cross.
A breeder interested in targeting qCrack-LG5.1m must weigh the trade-offs of Pav-G5Crack-SNP and Pav-G5Crack-SSR, some of which are discussed here. The one SNP included in Pav-G5Crack-SNP targeting qCrack-LG5.1m, ss490554283, was chosen because it targeted two putative low-cracking haplotypes (H2 and H5)[21] together. Thus Pav-G5Crack-SNP is an attractive DNA test option if a breeder wants to enrich a population for these two haplotypes and is not concerned about distinguishing them one from another, or is not interested in enriching for other low-cracking haplotypes (e.g., H6). However, if finer resolution is desired, Pav-G5Crack-SNP may not prove as useful. Pav-G5Crack-SSR may be more desirable to discern greater haplotypic variation at qCrack-LG5.1m as it provides this finer resolution. This haplotypic variation would be important for maintaining a diversity of putative low-cracking haplotypes, perhaps in earlier stages of the breeding process. Alternatively, additional SNPs could be added to Pav-G5Crack-SNP to refine the resolution (i.e. distinguish more QTL haplotypes) if desired.
It is possible that undiscovered pedigree connections exist that would indicate some of the QTL haplotypes were truly the same QTL allele. A possible scenario is thus presented. By using the qCrack-LG5.1m haplotypes (that were traced back to their earliest known ancestral sources[21]) that mirrored Pav-G5Crack-SSR haplotypes, it is deducible that 193_225 likely came from 'Schneiders', while 195_225 likely came from an unnamed ancestor of 'Napoleon' or 'Sam'[21]. It is possible that an undiscovered pedigree connection connects these two sources such that they share the same QTL allele. The fact that the one SNP chosen for the Pav-G5Crack-SNP DNA test grouped SSR haplotypes 193_225 and 195_225 together, while separating them from the other haplotypes, is consistent with a shared QTL allele.
The estimates of phenotypic variance explained (PVE) by the cracking DNA tests combined were similar yet slightly higher than the reported combined PVE estimated for qCrack-LG1.1m and qCrack-LG5.1m, 10% in 2019 and 24%–27% in 2020[21]. This discrepancy could be due to PVE estimates for the QTLs being derived from FlexQTL™ and single-SNP linear regression models, both of which assumed a biallelic QTL model, while the two cracking DNA tests together incorporated more alleles. With h2 estimates for cracking incidence that ranged from 0.34 to 0.54[21], and the combined cracking DNA tests having explained 29% (0.29) of the multiyear cracking incidence phenotypic variance, P for the combined cracking tests had a range of 0.54 to 0.85. This high level of P indicates that the two tests together could be used in MASS to replace some level of traditional seedling selection[30]. In addition to MASS, the cracking DNA tests could also be implemented in MAPS, however care should be taken if using individuals that are not related to the germplasm analyzed here.
Firmness DNA tests
-
Because qFirm-LG1.2m haplotype H2's associated average firmness levels were significantly higher than the other main haplotype (H1) over three years as well as significantly firmer than three other haplotypes (H4, H6, H7) in 2020 and multiyear[21], it was of particular interest in detecting. SNP ss490546574 (the sole SNP included in Pav-G1Firm-SNP) successfully distinguished H2 from all other SNP haplotypes, and as it was detected in several important cultivars that could be used as parents such as 'Bing', 'Lapins', 'Regina', 'Sweetheart', and 'Van' (Supplementary Table S5), it has breeding relevancy. Pav-G1Firm-SNP could be useful in screening progeny created from any of these parents for seedlings with increased firmness. In addition, this SNP was included in Pav-G1Crack-SNP, adding to its value for use in a DNA-informed breeding operation as it distinguished a SNP haplotype associated with both low cracking and high firmness. Previous work has shown correlation between fruit firmness and cracking incidence to be variable, with reports of no correlation[15,19] and positive correlation[19], depending on year and population studied. Quero-Garcia et al. concluded that correlation between fruit firmness and cracking is largely dependent on experimental design, methods, and genotype × environment interactions[19]. No significant correlation was found between cracking incidence and firmness using this germplasm over two years[21]. Thus, assuming the validity of ss49054574 in distinguishing both low-cracking and high-firmness haplotypes, it is possible that environmental effects not adequately captured with just two years of data or genotype × environment effects played a role in masking any negative correlation that would arise from the prevalence of the H2 haplotype.
Because qFirm-LG3.2m haplotype H2's associated average firmness level was significantly higher than that of H1, the other most represented haplotype, as well as three other haplotypes (H5, H6, H7) in 2020 and multiyear data[21], SNP ss490551714 was chosen for Pav-G3Firm-SNP, as it distinguished H2. Because SNP ss490551714 only distinguished between H2 and all other haplotypes, it might not be effective where screening progenies of parents that do not carry the H2 haplotype, such as 'Chelan', 'Lambert', 'Rainier', or 'Stella' (Supplemental Table S3). However, it could be useful if parents such as 'Bing', 'Lapins', 'Regina', 'Van', or 'Sweetheart' were used.
The obtained PVE estimates for the firmness DNA tests combined (22% in 2020 and 28% multiyear) were within the reported PVE estimates for the QTLs combined (19%−24% in 2020 and 21%−31% multiyear). With h2 estimates for firmness of 0.40−0.70[21] (thus P of the combined firmness tests using the multiyear firmness levels also at 0.40−0.70), reliance on the two tests combined in place of traditional phenotypic selection would be expected to increase genetic gain[30].
Utility in sweet cherry breeding programs
-
The greatest strengths of these tests are their ability to identify parents with superior alleles, and their ability to predict phenotypic performance in seedlings, years before the actual phenotype can be observed. Crossing superior parents increases the probability of identifying seedlings with superior crack resistance and firmness, along with other desirable characteristics. Using MASS to eliminate seedlings with inferior crack resistance and/or firmness frees up resources (land, fertilizer and pesticides, labor, laboratory supplies) that would otherwise be spent on maintaining seedlings over several years, only to see them discarded once they begin to bear fruit and phenotypes are evaluated. Whereas four PCR reactions are required to assay the QTLs of interest (SNP ss490546574 targets both cracking and firmness QTLs found on LG1, and Pav-G5Crack-SNP and Pav-G5Crack-SSR target the same QTL), the HRM assays used are inexpensive, requiring only simple, unlabeled PCR primers and a universal dsDNA-binding fluorescent dye. Although not a cost savings (due to the expense of labeled probes), the tests could be converted to multiplex assays by using TaqMan probes with different fluorophores for greater efficiency. If multiple DNA tests are being used in a cherry breeding program, a hierarchical testing approach could be adopted if the breeder does not wish to test all samples. Two basic principles could be used to guide this hierarchical approach. First, not all families are likely to be segregating for all alleles of interest, meaning that not all tests would need to be run. Second, progeny numbers from a bi-parental cross (particularly if flowers have been emasculated) are quite small[31], often fewer than 100 individuals. The cost to assay all individuals in small families should not be burdensome. For example, if running tests in 384-well format, all four tests could be run on a single plate with up to 94 individuals (setting aside wells for positive and negative controls). However, in cases where large numbers of progeny are produced (especially with open-pollinated families), the breeder could first decide which traits (with available DNA tests) are of highest priority, and run these tests on all seedlings. Subsequently, only those individuals which possess superior alleles for the highest-priority traits would be screened with the remaining DNA tests. These priorities will depend on the breeding program's objectives, the number of seedlings available to screen, and the resources available for DNA extraction and testing. For example, in the PNWSCBP, self-fertility is an important breeding objective. The most common source of self-fertility is the mutated self-incompatibility allele (S-allele) S4', for which a single-marker DNA test is available[32]. In a cross between a heterozygous S4' parent and a self-infertile parent, half of the progeny would be expected to carry the S4' allele and be self-fertile. A large family (for example, 1,000 progeny) could first be screened for S4', resulting in an average of 500 surviving progeny. These progeny could then be screened with the four DNA tests for cracking and firmness, which, if using HRM assays and 384-well plates, would require 5.4 (6) plates to screen. Considering the tightly linked QTLs on LG1 as a single locus, and assuming that both parents are heterozygous for a superior allele at each QTL, the average frequency of progeny from such a cross that are homozygous for the superior alleles at all three loci is: 0.25 (the frequency of obtaining homozygous superior alleles at one locus)3 = 0.015625. Because of random chance, to have a 99% probability of obtaining at least one such individual, 292 individuals would need to be screened, based on the formula:
$ N=\mathrm{ln}\left(1-P\right)/\mathrm{l}\mathrm{n}(1-f) $ Where N = number of individuals, P = probability of obtaining the desired event (i.e. genotype), and f = frequency of genotype of interest[33]. In practice, due to challenges in both seed production and germination such large families (especially from biparental crosses) are not common in sweet cherry breeding, but these calculations are a reasonable guide.
Adoption of MASS pipelines using DNA tests such as those presented here could save significant monetary resources[22] that could be channeled to address other needs of a breeding program. Additional cost-analyses should be completed by breeders interested in increasing MASS in their program using the DNA tests presented here to better understand the appropriate level of DNA test inclusion in order to maximize savings, efficiency, and genetic gain in their program.
-
Five DNA tests, three for fruit cracking incidence and two for firmness, are now available for use in sweet cherry breeding programs. All five DNA tests utilize efficient and relatively inexpensive, high-throughput technologies and platforms that can feasibly be incorporated into breeding operations of various sizes. For cracking, Pav-G1Crack-SNP and Pav-G5Crack-SNP jointly explained up to 30% of phenotypic variance, with a predictiveness of 0.54 to 0.85. The maximum proportion of firmness phenotypic variance explained by Pav-G1Firm-SNP and Pav-G3Firm-SNP combined was 28%, with a predictiveness of 0.40 to 0.70. These estimated predictiveness levels indicate that the DNA tests are relevant for breeding operations and can aid in the genetic improvement of cracking tolerance and high fruit firmness through marker-assisted selection. Pav-G5Crack-SSR, while not explaining as much phenotypic variance as the other cracking DNA tests used together, was able to distinguish up to seven haplotypes and thus could be used in MAI of alleles not distinguished by the SNP-based cracking DNA tests. Phenotypic variance explained by the DNA tests was determined using simple linear regression, and thus could be biased upwards, which should be taken into consideration by those interested in implementing these tests. DNA-informed breeding with these tests holds potential to not only increase genetic gain compared to traditional breeding methods but also increase breeding efficiency with limited resources. For example, these tests could be used to increase genetic gain by shortening the time required (i.e. before fruiting occurs) to identify new individuals with superior (or inferior) combinations of cracking and firmness alleles and use them as parents in the next cycle of selection. Similarly, the tests could increase breeding efficiency by eliminating seedlings with inferior alleles before they are transplanted to the field, reducing space and labor requirements for planting and managing trees that will not be selected.
-
Unselected seedlings from the PNWSCBP at WSU were chosen for this work. In total, 249 seedlings were used, all of which were also used in a previous fruit firmness and cracking incidence QTL study[21] and germplasm description can be found in Supplemental Table S5 there, however 10 seedlings used in the previous QTL detection study were not used here due to tree removal because of detected viral infection. The 249 seedlings consisted of seedlings from breeding program seedlings ('Program seedlings', n = 140) and from seedlings of the RosBREED project[28] ('RosBREED seedlings', n = 109). The seedling set was treated as a single population due to little population structure between the two parts[21].
Trait evaluation
-
Evaluation of both fruit cracking incidence and firmness were described in detail previously[21], and are only briefly mentioned here. Sweet cherry fruits were harvested at peak maturity, then firmness was measured using the FirmTech2 (Bioworks, Wamego, KS, USA), and cracking incidence was measured using a modified, high-throughput version of Christensen's classic method[36].
Genotypic data
-
SNP genotypic data used herein (either from the RosBREED cherry 6 or 6+9K SNP array[37,38]) were described previously[21].
For SSR genotyping, seedling DNA extracts were diluted to a concentration of 30 ng/μL and underwent a polymerase chain reaction (PCR) using primer pairs targeting two genomic positions ('position A' and 'position B') flanking a previously reported cracking-incidence QTL on LG 5[15]. The PCR primer sequences were as follows: /FAM/TCT TCC TCC TCC TTC TGT GC (forward primer 1), CAG CTC CCT GGT TGA CTG G (reverse primer 1), /FAM/TAA TGC CCT TCA TCC AAA GG (forward primer 2), ATT CAG TGG GAA AGC AAT GG (reverse primer 2). The PCR protocol included the following steps: 1) 95 °C for 5 min (1×), 2) 95 °C for 30 s, 60 °C for 30 s, 72 °C for 1 min 30 s (35×), 3) 72 °C for 7 min (1x), and 4 °C indefinitely. A 10 μL PCR reaction mixture included: 1 μL 10x PCR buffer, 0.8 μL dNTP mixture (10 μM total), 0.3 μL MgCl (50 mM), 0.5 μL forward primer (10 μM), 0.5 μL reverse primer (10 μM), 0.1 μL Taq polymerase (5 U/μL), 4.8 μL ddH2O, 2 μL DNA template (~30 ng/μL). PCR was performed at the WSU Irrigated Agriculture Research and Extension Center (Prosser, WA, USA). PCR product (2 μL) was diluted in deionized formamide (7.5 μL/reaction) with LIZ 600 (0.5 μL/reaction) size standard (Applied Biosystems/ThermoFisher Scientific, Waltham, MA, USA) and then shipped to North Carolina State University's Genomic Sciences Laboratory (Raleigh, NC, USA) for capillary electrophoresis. Raw results were analyzed using GeneMarker™ software (SoftGenetics, State College, PA, USA). Pedigree information was used to aid in determining SSR haplotypes where possible, and, where conclusive haplotypes could not be established, the most common haplotypes containing the alleles present were assumed.
HRM assay development for primary SNPs
-
SNPs chosen for conversion to detection on the HRM platform for DNA test development were those primary SNPs (PSs) previously assigned to each of the stable QTLs[21] as well as any nearby SNPs that captured relevant genotypic variation within the haploblock. Haploblocks, or groups of linked SNPs, were established previously based on absence of known historic recombination[39]. Primers were designed flanking each PS (Supplemental Table S6), and a preliminary PCR protocol was used to screen the primers' ability to amplify the target DNA sequence. Based on this preliminary PCR protocol, a final protocol was developed: 1) 95 °C for 2 min 30 s (1×), 2) 95 °C for 5 s, 56 °C for 10 s, 72 °C for 15 s (45×), and 3) 12 °C indefinitely. A 10 μL PCR reaction mixture was created as follows: 1 μL 10x PCR buffer, 0.8 μL dNTP mixture (10 μM total), 0.3 μL MgCl (50 mM), 0.5 μL forward primer (10 μM), 0.5 μL reverse primer (10 μM), 0.4 μL SYTO™ 13 (Invitrogen™, Waltham, MA, USA) (final concentration of 2 mM), 0.1 μL Taq polymerase (5 U/μL), 4.4 μL ddH2O, 2 μL DNA template (~30 ng/μL). A positive and negative control were included on each 96-well plate run to ensure accurate and robust results. PCR was carried out either in a LightCycler® 480 II (Roche, Basel, CH, USA), or in a separate thermal cycler prior to the HRM genotyping. HRM assays of the SNP markers were performed on the LightCycler® 480 II using the protocol shown in Supplemental Table S7.
Genotyping calls were made using the Gene Scanning module in the software version LC480 1.5.0.39. HRM curves for each seedling were normalized and assigned to a group by the Gene Scanning module (1 = BB, 2 = AA, 3 = AB). Group assignments were manually adjusted according to visual clustering where appropriate. Group assignments for each sample were checked against the SNP array genotype. Those samples' HRM group assignments that did not match for a given SNP were rerun on an additional HRM assay.
Statistical analyses
-
To compare differences among the HRM SNP genotype groups' associated trait levels and among SSR haplotypes' associated trait levels, Tukey's HSD (for firmness, normally distributed) or a Pairwise Wilcoxon Rank Sum Test (for cracking, not normally distributed) was used to identify significant differences at p < 0.05. For comparing trait levels among DNA test groups, only those groups with five or more seedlings were included in pairwise comparisons. Analyses were conducted in R 4.0.3[40].
DNA test evaluation
-
To evaluate the utility of the DNA tests for use in MASS, a modified version of guidelines from Ru et al. was adopted[30]. As noted by Ru et al., broad-sense heritability (H2) is the most informative estimate of heritability when dealing with clonally propagated crops such as sweet cherry, however due to small family size and unreplicated seedling trees, this is often difficult to estimate accurately[34]. Because of this difficulty, narrow-sense heritability (h2) was used in proxy of H2 to calculate a predictiveness estimate (P) for each DNA test using
$ P=\frac{{PVE}_{M}}{{h}^{2}} $ Data availability
-
SNP genotypes and all phenotypic data used for this work have been submitted to the Genome Database for Rosaceae (GDR) under accession number tfGDR1053.
Funding was provided from start-up and royalty funds of the Pacific Northwest Sweet Cherry Breeding Program at WSU (USDA NIFA Hatch project 1014919) and partially supported by the Washington State Tree Fruit Research Commission and the Oregon Sweet Cherry Commission. WWC thanks Stijn Vanderzande for supplying part of the genotypic dataset as well as for his help and guidance in data curation.
-
The authors declare that they have no conflict of interest.
- Supplemental Table S1 Seedling fruit cracking incidence and firmness in 2019, 2020, and multiyear.
- Supplemental Table S2 Pav-G5Crack-SSR haplotypes for 249 seedlings.
- Supplemental Table S3 SNPs included in DNA tests vs. QTL haplotypes from Crump et al. (in review). Full SNP names: (566) = ss490546566, (574) = ss490546574, (283) = ss490554283, (714) = ss490551714. HB = haploblock; HT = haplotype.
- Supplemental Table S4 Haploblock HB-05-08 (from Crump et al., 2022) and Pav-G5Crack-SSR haplotypes.
- Supplemental Table S5 Plant material used.
- Supplemental Table S6 SNP markers used for HRM assay development .
- Supplemental Table S7 HRM protocol.
- Supplemental Fig S1 Unselected seedlings'associated average 2019 cracking incidence by Pav-G5Crack-SSR haplotype. Three seedlings were unable to be scored(n = 246).Coloring corresponds tostatistical difference and compact letter display.
- Supplemental Fig S2 Unselected seedlings'associated average 2020 cracking incidence by Pav-G5Crack-SSR haplotype. Three seedlings were unable to be scored (n = 246).Coloring corresponds tostatistical difference and compact letter display.
- Supplemental Fig S3 Unselected seedlings'associated average overall cracking incidenceby Pav- G5Crack-SSR haplotype. Three seedlings were unable to be scored (n = 246).Coloringcorresponds to statistical difference and compact letter display.
- Copyright: © 2022 by the author(s). Published by Maximum Academic Press, Fayetteville, GA. This article is an open access article distributed under Creative Commons Attribution License (CC BY 4.0), visit https://creativecommons.org/licenses/by/4.0/.
-
About this article
Cite this article
Crump WW, Peace C, Zhang Z, McCord P. 2022. Fruit cracking and firmness DNA test development and evaluation in sweet cherry. Fruit Research 2:14 doi: 10.48130/FruRes-2022-0014 

Fruit cracking and firmness DNA test development and evaluation in sweet cherry
- Received: 31 December 2021
- Accepted: 18 July 2022
- Published online: 27 September 2022
Abstract: One application of DNA-informed breeding, which has potential to increase the effectiveness of traditional breeding methods, is the use of DNA-based diagnostic tests to estimate genetic potential of breeding individuals. In sweet cherry (Prunus avium L.), cracked or soft fruit are major industry challenges. Recent research detected two quantitative trait loci (QTLs) for fruit cracking and firmness differing in trait levels associated with QTL haplotypic variation. Also, a DNA test for cracking (Pav-G5Crack-SSR), using two simple sequence repeat (SSR) markers, was previously developed but not yet validated on breeding germplasm. In addition to SSR markers, single nucleotide polymorphism (SNP) markers can be used for developing locus-specific DNA tests and run as simple assays such as high-resolution melting (HRM). The objective of this research was to develop and evaluate the predictiveness of DNA tests for fruit cracking and firmness in sweet cherry. Unselected seedlings from pedigree-connected families were screened with the Pav-G5Crack-SSR DNA test. DNA tests were also created from four SNP markers with HRM assays, using two years of cracking and firmness data for evaluation. Pav-G5Crack-SSR explained 12–15% of the cracking phenotypic variance, while Pav-G1Crack-SNP and Pav-G5Crack-SNP (which targeted the same QTL as Pav-G5Crack-SSR) together explained 16%–30% of the cracking phenotypic variance. Pav-G1Firm-SNP and Pav-G3Firm-SNP together explained 22%–28% of the firmness phenotypic variance. All three DNA tests can be implemented in breeding programs to enhance effectiveness in breeding for decreased cracking incidence and increased fruit firmness in sweet cherry.
-
Key words:
- DNA test /
- High Resolution Melting /
- Prunus avium L. /
- Tree fruit /
- breeding