


-
Apples are one of the few agricultural products with obvious international competitiveness, and China has the largest cultivation area and yield[1]. However, in recent years, the sugar content and flavor of apple have declined, adversely affecting apple planting benefits and farmers' enthusiasm for production[2]. Thus, improving apple quality by cultivating new varieties or other effective ways has become the goal of breeders and researchers.
Apple quality determines its competitiveness in domestic and international markets, comprising sensory quality, flavor quality, nutritional quality, and hygienic quality[3]. Its sensory quality mainly includes fruit size, fruit shape, fruit firmness, fruit surface smoothness, fruit spot size and density, fruit color and rust amount. Its flavor quality mainly includes fruit soluble (dissolved) sugar (or solids) content (SSC), titratable acidity (TA), SSC/TA ratio, and sugar acid ratio. In addition, its nutritional quality mainly contains vitamin C and mineral content, while its hygienic quality mainly contains pesticide residues and heavy metal residues[4,5].
Consumers' increased demand for apple flavor and nutritional value highlights the need for improving the flavor and nutritional qualities of apple[6]. The flavor of apple is determined by the content and ratio of total sugar and titratable acidity. Therefore, understanding the genetic basis of sugar content quality in apples is crucial for advancing the theoretical basis and practical application of sugar content quality improvement.
-
Sugar is a crucial component of fruit quality in apples, as it serves as the main carbon source and energy-supplying substance in plants. The sugar in apples includes not only the monosaccharide (fructose and glucose, etc.), disaccharide (sucrose and maltose, etc.), and polysaccharide (raffinose, stachyose and starch, etc.), but also the sugar alcohol (sorbitol and mannitol, etc.). Among these, sorbitol is unique in rose family plants and is not found in high concentrations in other plants[7]. With the exception of starch, all of the sugars in apples are soluble sugars. And of these soluble sugars, fructose is the sweetest sugar, whose sweetness is 2-fold of glucose, and 1.8-fold of sucrose[8]. Consequently, the total sugar content and the ratio of fructose to glucose (F/G) significantly influence the sweetness and flavor of apple[6,9]. As for sugar localization, the soluble sugars, such as fructose, glucose, sucrose, and sorbitol are mainly stored in the vacuole, with low amounts of sucrose and sorbitol also present in the apoplastic spaces. In contrast, starch is predominantly stored in the amyloplast[10].
Methods for sugar determination in apples
-
Multiple methods have been developed for the determination of sugar in apples. Among them, the most common and simplest method is the SSC. And in fruits, SSC mainly contains soluble sugar, acid, vitamins, amino acids, and minerals, with soluble sugar as the basis. For more in-depth research, apples' soluble sugars can also be divided into fructose, glucose, sucrose, galactose and sorbitol. These various sugar components can be measured by gas chromatography-mass spectrometry (GC-MS) or high-performance liquid chromatography (HPLC).
Discrepancy of different sugar components in apples
-
The sugar components in apples are of great complexity, thus, their content would vary depending on apple cultivar. For example, Jia et al.[11] found that the total soluble sugar content of 129 apple cultivars ranged from 7.2%−13.1%, with most falling between 8.0%−10.9%. This suggests that the 8.0%−10.9% range is the main distribution range for soluble sugars in apples[11].
As for diverse components of soluble sugars, its contents are highly connected with its genetic characteristics, with the highest fructose content, the lowest sorbitol content, and the mineral content of glucose and sucrose varied as different cultivars in general[12]. The following studies will determine this differential characterization of different sugar components in apples. Wang et al.[13] measured the sugar content in six apple cultivars, and found that the content of sucrose and glucose varied significantly in different cultivars, with coefficient of variation of 67.58% and 29.94%, respectively. Liang et al.[14] studied the content of several sugar components in 12 apple cultivars, and presented that the level of sugar content in apple fruit showed a large variation and significant genetic characteristics. In a larger scale study, Zheng et al.[12] determined sugar content of 132 apple cultivars and found that the content of total soluble sugar in apples was characteristic with the highest content of fructose (34.7%−93.2% of total soluble sugar content), the lowest content of sorbitol (1.2%−11.2% of total soluble sugar content), and the moderate content of sucrose and glucose. To further explore whether the sucrose or glucose content is more widely distributed, Zheng et al.[12] counted the sucrose and glucose content in 132 apple cultivars, and found that 4/5 varieties have higher sucrose content than glucose content in these 132 individuals. Thus, Zheng et al.[12] considered fructose and sucrose were the basis components of soluble sugars in apples, which is consistent with previous studies[15,16]. More specifically, Zheng et al.[12] also demonstrated that the total soluble sugars, total soluble solids content were ranged from 7.9%−14.0% and 8.4%−16.1%, respectively. And the contents of fructose, sucrose, glucose, and sorbitol were ranged from 3.92%−10.30%, 1.75%−6.93%, 0.63%−6.76%, 0.12%−1.56%, respectively.
However, in other cases, sucrose would not be considered as the major sugar component. For example, Ma et al.[17] found that in the hybridize population of 'Jiguan' and 'Wangshanhong', the contents of fructose, glucose, sucrose and sorbitol ranged between 30.09−110.33, 5.77−32.51, 1.19−9.29 and 0−13.14 mg/g FW, respectively, with its average content of 59.54, 12.75, 3.62 and 3.41 mg/g FW, respectively. Thus, Ma et al.[17] considered fructose and glucose as the major sugars in mature apples. Similarly, Wang et al.[18] found comparable results in the 'Honeycrisp' and 'Qinguan' hybridized population.
In conclusion, we considered that there are wide variations of soluble sugars in mature apple fruits between different cultivars, different hybrid populations, and even the different individuals in the same hybrid population.
Genetic characteristics of various sugar components in apples
-
The characteristics of various sugar components are known to be genetically determined. Early in 1968, Visser et al.[19] first proposed that the sugar in apples is a quantitative trait, which was controlled by additive polygene. Furthermore, Visser et al.[19] also found that sugar content accumulated gradually with fruit development, not only the process before the fruit mature. Later, Li et al.[20] analyzed the inheritance regular of sugar content in 'Golden Delicious' × 'Richard Delicious', 'Golden Delicious' × 'Delicious-158', 'Rails' × 'Starkrimson-1', and 'Rails' × 'Delicious-158' hybrid populations, and found that the content of soluble solid, total sugar and reducing sugar in parents and progeny were all tend to correspond to normal distribution, with its average broad sense heritability of 75%, 79% and 70%, respectively. Li et al.[20] also suggested that the content of sugar in apples was controlled by polygenes, with both additive and non-additive effects playing a role.
Sugar content is seen as a typical quantitative characteristic, so that the SSC and the content of fructose, glucose, and sucrose, etc. tend to show normal distributions. For example, Guan et al.[21] detected the content of fructose, glucose, sucrose and sorbitol of 233 hybrid progeny in 2011 and 2012, and found that the content of them was all normally distributed, but the peak patterns of normal distribution between two years were different because of the changed environmental conditions. Besides, dividing the sugar content of varies sugars into groups at equal intervals from small to large and performing χ2 test, Zheng et al.[12] found that the content of fructose, sucrose, soluble sugars, and soluble solid was all normally distributed, and the glucose and sorbitol content also showed normal distribution after remove few varieties of the 132 apples samples. Furthermore, Zheng et al.[12] also found that the variation degree of fructose and sucrose content among different cultivars was small, its variation coefficient were 23.4% and 17.9%, respectively. Conversely, the variation degree of sorbitol and glucose content were all very high, with its variation coefficients of 52.5% and 36.8% respectively.
In some cases, researchers often hybrid different apple cultivars to conduct group analysis. For example, Kunihisa et al.[22] evaluated the characteristics of sugar content of 130 hybrid progenies in 'Orin' × 'Akane' hybrid population in three consecutive years from 2010 to 2012, and found that the content of fructose and sucrose was significantly different and widely separated among individual plants of F1 generation. Kunihisa et al.[22] also found that, the content of fructose, glucose and sucrose was all normally distributed, with the exception of sorbitol. In 'Jiguan' and 'Wangshanhong' hybrid populations, Ma et al.[17] determined the content of varies sugars in the fruits of 191 hybrid progeny, and found that the fructose, glucose and sucrose contents were normally distributed, and the sorbitol content showed a slightly skewed distribution toward low sorbitol contents.
Interrelation between different sugar components
-
In addition to acting as products of energy metabolism to maintain plant growth and development, different sugar components are also involved in the process of sugar metabolism as signaling molecules. In the process of sugar metabolism, different sugar components are often interrelated. Ma et al.[23] analyzed the soluble sugar content in mature fruits of 364 apple cultivars and found that the glucose content was highly positively correlated with fructose content, but negatively correlated with sucrose content. Similarly, measuring the soluble sugar content in apple fruits at fruit harvest, after 10, and 20 weeks of low temperature storage, Guan et al.[21] also found the positive correlation between glucose and fructose content, as well as the negative correlation between glucose and sucrose content at the time of 20 weeks of low temperature storage. Furthermore, the positive relationship between sucrose and sorbitol contents was also identified by Guan et al.[21]. Recently, Wang et al.[18] analyzed the sugar content of various sugar components in 'Honeycrisp' and 'Qinguan' hybrid population, and demonstrated that the sucrose content was positively correlated with sorbitol content and negatively correlated with glucose content, and meanwhile negatively correlated with galactose content. These results demonstrate that different sugar components in the sugar metabolism pathway of apple are interrelated.
-
In plants, various sugar components undergo conversion through sugar synthesis and decomposition processes. In apple leaves, sorbitol and sucrose account for 80% and 20% of the photosynthetic assimilation products, respectively[24].
Sorbitol is synthesized in the cytosol. In the mature leaves of apple, chloroplast produces triose phosphate (TP) after photosynthesis. Then, TP would through the chloroplast membrane into the cytoplasm to synthesize Fructose-1,6-bisphosphate (FBP), and FBP further decomposes into Fructose-6-phosphate (F6P) and inorganic phosphate under the catalysis of Fructose-1,6-bisphosptase (FBPase). F6P could be reversibly converted to Glucose-6-phosphate (G6P), and G6P further catalyzes to produce Sorbitol-6-phosphate (S6P) under the action of Sorbitol-6-phosphate dehydrogenase (S6PDH), and then S6P would through the process of dephosphorization by Sorbitol-6-phosphate phosphatase (SorPP) and finally synthesize sorbitol[25]. And in sink organs, sorbitol could convert to fructose by NAD+-sorbitol dehydrogenase (NAD+-SDH), and convert to glucose by NADP+-sorbitol dehydrogenase (NADP+-SDH) and Sorbitol oxidase (SOX)[26].
After CO2 fixation in the chloroplast, the formed TP could also go through the chloroplast membrane into the cytoplasm, and synthesize F6P and UDP-glucose (UDPG) through a serious of reactions, and finally synthesize sucrose under the action of sucrose-phosphate synthase (SPS) and sucrose-phosphatase (SPP)[27]. The sucrose in sink organs will convert to fructose and UDP-Glucose by sucrose synthase (SUSY), or convert to fructose and glucose by neutral invertase (NINV). In the vacuole, sucrose could convert to fructose and glucose by acid invertase (AINV)[28] (Fig. 1). In addition, fructose and glucose are derived from the conversion of sorbitol and sucrose. SUSY also catalyzes the synthesis of sucrose from fructose and glucose. In these processes, the SUSY catalyzed sucrose synthesis and decomposition are reversible changes, although SUSY is generally considered a decomposition enzyme of sucrose. In contrast, invertase irreversibly catalyzes the hydrolysis of sucrose to produce fructose and glucose.
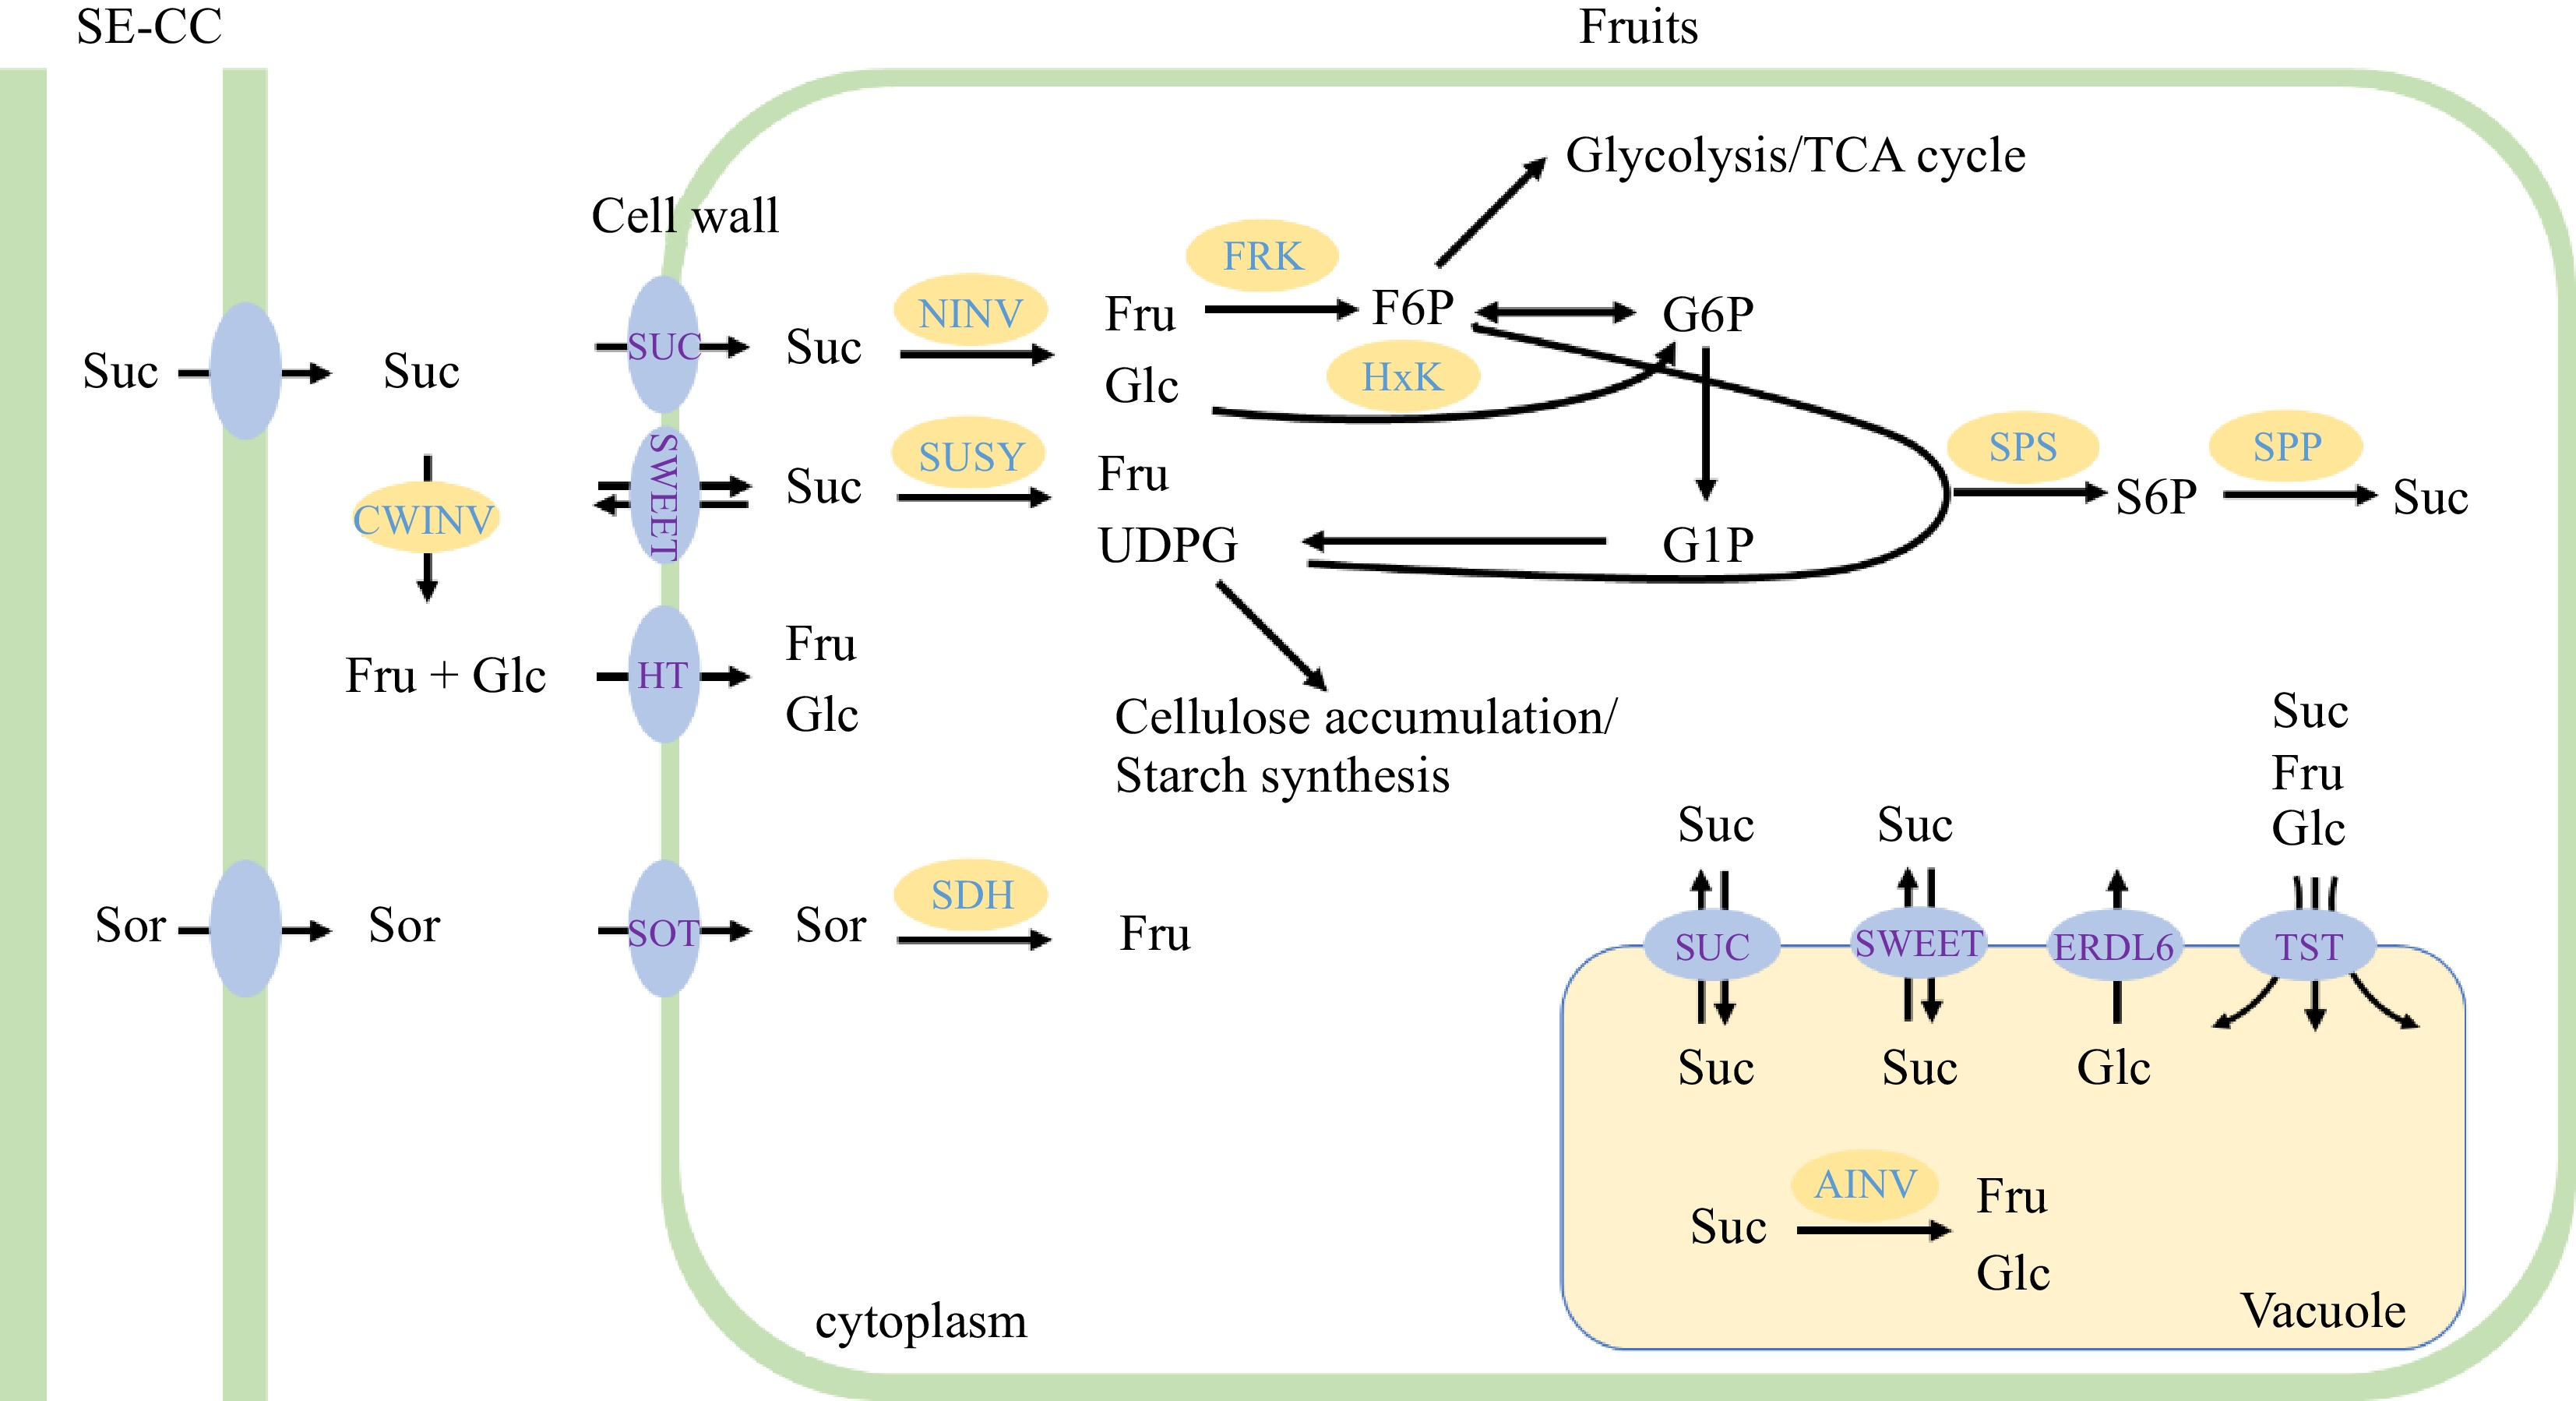
Figure 1.
Sugar metabolism and accumulation in apple fruit. In apples, both sorbitol (Sor) and sucrose (Suc) are transported from photosynthetic cells to the sieve element/ companion cell (SE-CC) complex in fruit, then unloaded into the cell wall space between SE-CC and parenchyma cells by unknown transporters. In cell wall space, Sor is taken up into parenchyma cells by sorbitol transporter (SOT). Suc is directly transported into parenchyma cells by sucrose transporter/carrier (SUT/SUC), or converted to fructose (Fru) and glucose (Glc) in the cell wall space by cell wall invertase (CWINV), and then transported into the parenchyma cells by hexose transporters (HT). After entering into the cytoplasm, Sor is converted to Fru by sorbitol dehydrogenase (SDH), while Suc is converted to Fru and Glc by neutral invertase (NINV) or to Fru and UDP-glucose by sucrose synthase (SUSY). The produced Fru and Glc can be phosphorylated to fructose-6-P (F6P) and gluctose-6-P (G6P) by fructokinase (FRK) or hexose kinase (HxK). The resulting G6P, F6P, G1P and UDPG enter glycolysis/TCA cycle, or are used for starch synthesis or other metabolic processes. Exceeded UDPG could be combined with F6P for re-synthesis of Suc via sucrose phosphate synthase (SPS) and sucrose-phosphatase (SPP). Most of the Fru, Glc and Suc that have not been metabolized are imported by special tonoplast transporters (including tonoplast sugar transporter, TST, SUC4, or SWEET) into vacuole for storage. Inside the vacuole, Suc can be also converted to Glc and Fru by acid invertase (AINV). In addition, the Glc in the vacuole could be transported to the cytoplasm by the Glc exporter early response to dehydration like 6 (ERDL6) protein.
Starch is a significant insoluble sugar in plants. The synthase of starch comes from the CO2 fixed TP, TP further convert into ADP-glucose (ADP-Glc) for the synthesis of starch in the chloroplast. Starch is degraded into glucose or maltose at night[29].
Loading and unloading of sugar
-
Sugar serves as the primary transportation form, providing energy for cellular metabolism, serving as signaling molecules, and playing a regulatory role in osmotic balance in plants[30]. The process of sugar transportation consists of loading of sugar from the source organs to the phloem and unloading sugars from the phloem to the sink organs. And this phloem loading process has three transport strategies, apoplastic loading, symplastic polymer trapping, and diffusion. Like loading, unloading is composed of two forms: symplastic unloading and apoplastic unloading.
In apples, both sorbitol and sucrose are loaded into phloem[27]. And this loading process refers to the transport of sorbitol and sucrose from photosynthetic cells to the sieve element/ companion cell (SE-CC) complex[31]. After entering into the SE-CC, carbohydrates are transported to the sink organs through phloem at a long distance, and then experienced a unloading period to be used or stored in cells[27].
Unloading plays an important role in regulating carbohydrate distribution and sink strength, making it necessary for plants to control it carefully. The main driving force of the symplastic unloading is the concentration gradient, along which carbohydrates will flow from high concentration to low concentration. To produce this important concentration gradient, the sucrose synthase (SUSY), cytoplasmic neutral invertase (NINV), and sorbitol dehydrogenase (SDH) all played important roles. In contrast, apoplastic unloading needs to transport the sugars from SE-CC to the extracellular space first, and then transported them into the cell through the transport proteins. And the transport proteins involved in this process mainly include the sugar will eventually export transporter (SWEET) protein, sucrose transporter/carrier (SUT/SUC) protein, hexose transporter (HT) protein, and sorbitol transporter (SOT) protein[29] (Fig. 1).
-
Molecular markers have been widely used in breeding and genetic studies in apples. In addition, linkage map is an indispensable tool to identify quantitative trait locus (QTLs) for specific crosses. And with the development of molecular markers, such as restriction fragment length polymorphisms (RFLPs), random amplified polymorphic DNAs (RAPDs), amplified fragment length polymorphisms (AFLPs), sequence characterized amplified regions (SCARs), and simple sequence repeats (SSRs), as well as the completed apple genome sequence, various linkage maps have been constructed[32,33].
The first genetic map of apple was constructed with 'Rome Beauty' and 'White Angel' populations in 1994, which contained 156 markers in 21 linkage groups, and 253 markers in 24 linkage groups on the Rome Beauty and White Angel map, respectively[34]. Although this map is of great significance, it had little practical value due to the limitations of marker types (RFLPs and RAPDs) and the number of linkage groups does not correspond to the 17 pairs of apple genome chromosomes. In 1998, Maliepaard et al.[35] constructed the linkage maps of 'Prima' and 'Fiesta', which both corresponded to 17 apple chromosomes and included 194 and 163 markers. And the marker density of 'Prima' and 'Fiesta' maps were 4.3 and 6.0 cM/marker, respectively. This map was the first genetic map which covered all 17 apple chromosomes.
Later, a large amount of reliable genetic linkage maps have been constructed. In 2003, a saturated reference map for apples was published by Liebhard et al.[36]. In this linkage map, a total of 840 AFLP, RAPD, SSR, and SCAR markers were used, and both 'Fiesta' and 'Discovery' had 17 linkage groups, with its total length of 1,143.8 and 1,454.6 cM, respectively[36]. In 'Telamon' × 'Braeburn' hybrid population, 257 individuals were selected for map construction, and finally two apples genetic linkage maps were constructed with the 'Telamon' map consisting of 242 AFLPs and 17 SSRs markers (259 markers in total) on 17 linkage groups of 1035 cM in length, and with the 'Braeburn' map comprised 245 AFLPs and 19 SSRs (264 markers in total) distributed on 17 linkage groups and spanned 1,245 cM[37]. Using AFLP, SSRs, RAPDs, and expressed sequence tag (EST)-derived markers, Igarashi et al.[38] constructed two apple genetic linkage maps of 'Ralls Janet' and 'Delicious', which consisted of 346 and 300 markers, respectively. In order to further conduct QTL analyses among multi-population, Diaye et al.[39] firstly reveled an integrated consensus map of apple, which consisted of 1,046 markers with its total length of 1,032 cM spanned on 17 linkage groups, and its mean distance between adjacent loci was 1.1 cM. van Dyk et al.[40] constructed genetic maps of two F1 crosses, 'Golden Delicious' × 'Anna' and 'Anna' × 'Sharpe's Early'. The integrated F1 linkage map of 'Golden Delicious' × 'Anna' consisted of 260 SSR markers and spanned 1,376.7 cM, and the 'Anna' × 'Sharpe's Early' map consisted of 230 SSRs which covered the length of 1,242.6 cM. Moreover, 141 and 148 SSR loci were mapped onto the 'Jonathan' and 'Golden Delicious' map, with its length of 1228.4 and 1403.9 cM and the marker density of 8.7 and 9.4 cM/SSR[41]. Later, Liu et al.[42] also developed a SSR-based genetic linkage map by using 'Golden Delicious' × 'Fuji' population.
In addition to the study of apple cultivars, the genetic map of apple rootstock has also been reported. Celton et al.[43] constructed genetic maps of 'M.9' ('Malling 9') × 'R.5' ('Robusta 5') hybrid population, its parental maps spanned 1,175.7 cM ('M.9') and 1,086.7 cM ('R.5'), which contained 316 newly developed SSR marker loci in total. Antanaviciute et al.[44] constructed the M432 linkage map of 2,272 SNP markers, 306 SSR markers and the S-locus, and increased the marker density to 0.5 cM/marker. Fernández-Fernández et al.[45] reported the integrated map for 'M.M.116' × 'M.27' rootstock hybrid population, which covered a genetic length of 1,229.5 cM, contained 324 SSR loci and grouped into 17 linkage groups, and finally with its marker density ranged from 2.3 to 6.2 cM/SSR.
As for the development of high throughput sequencing technology and the publication of the whole genome sequence of apple, single nucleotide polymorphism (SNP) markers, which belong to the third generation of molecular markers, have gradually shown their advantages in the construction of genetic maps due to their large number and easy batch detection, which have greatly improved the density, accuracy and saturation of genetic maps[32]. Han et al.[33] constructed an integrated genetic map of 'Co-op 17' × 'Co-op 16', the consensus linkage map consisted 355 SSR markers, spanned 1,143 cM, and had an average marker density of 2.5 cM/marker. In 2012, Khan et al.[46] developed a multi-population consensus genetic map of apple, the map contained 2,875 markers (2,033 SNPs, 843 SSRs, and other specific markers) and spanned 1,991.38 cM.
In the following years, three consensus linkage maps of 'Honeycrisp' were reported. Clark et al.[47] firstly developed a consensus linkage map of 'Honeycrisp' by using three 'Honeycrisp' progeny populations (the progeny of 'Honeycrisp' × 'Monark', 'Honeycrisp' × 'Gala', and 'Honeycrisp' × 'MN1764'), which contained 1,091 SNP makers and had an SNP density of 1.36 cM/marker. In 2017, Howard et al.[48] further created a multi-family integrated SNP linkage map with 'Honeycrisp' as a common parent, the five families including 'Honeycrisp' × 'MN1764', 'Honeycrisp' × 'Monark', 'Honeycrisp' × 'Pitmaston Pineapple', 'Honeycrisp' × 'Jonafree', and 'Honeycrisp' × 'MN1702'. This integrated 'Honeycrisp' linkage map contained 3,632 SNPs and spanned 1,172 cM, with its SNP density of 0.32 cM/SNP[47]. Wang et al.[49] constructed a 'Honeycrisp' (HC) × 'Qinguan' (QG) integrated map, it consisted of 10,172 SNP markers and spanned 2,430.52 cM. Among these SNPs, 5,351 and 5,623 markers were mapped on the HC and QG map, respectively.
In the meantime, genetic maps of some other dominant varieties were also constructed. For example, Sun et al.[50] constructed a dense SNP genetic map of 'Jonathan' × 'Golden Delicious' population, and a total of 3,441 SNP markers were generated by using 297 individuals. Among these 3441 markers, 2,017 markers were mapped to 'Jonathan' map and 1,932 were mapped to 'Golden Delicious' map, its length were 1,343.4 and 1,516.0 cM, and its marker density were 0.67 and 0.78 cM/marker, respectively. And Falginella et al.[51] constructed genetic maps of 'Renetta Grigia di Torriana' (RGT) and 'Golden Delicious' (GD), the RGT map consisted of 3,023 markers (2,870 SNPs and 153 SRRs) with its length of 1,048 cM, and the GD map consisted of 4,663 markers (4,533 SNPs and 130 SSRs) which spanned 1,331 cM of genetic map. Besides, Ma et al.[17] constructed a consensus linkage map of 'Wangshanhong' and 'Jiguan', it contained 601 markers (540 SNPs and 61 SSRs) and spanned 1,368.4 cM, and the marker density were 2.28 cM/marker. The linkage maps of 'Wangshanhong' and 'Jiguan' had a total length of 1,114.8 and 1,225.5 cM, and the marker densities were 4.35 and 5.40 cM/marker, respectively. Yang et al.[52] constructed a consensus genetic map by using the 'Fuji' × 'Red3' population, the linkage group consisted of 7,630 SNPs and with its length of 2,270.21 cM, as well as with a marker density of 0.30 cM/marker.
In addition to the molecular genetic map of various apples cultivars, some interspecific genetic maps have also been constructed. For example, Fernández-Fernández et al.[53] developed a linkage map from the cross 'Fiesta' (Malus pumila) × 'Totem' (Malus interspecific hybrid). Moriya et al.[54] constructed an aligned genetic linkage maps of 'JM7' (Malus prunifolia × Malus pumila 'Malling 9') × 'Sanashi 63' (Malus sieboldii), and the apple rootstock linkage map of 'JM7' had its length of 998.0 cM, chich contained 415 loci. Liu et al.[55] constructed linkage groups of SSR and SRAP markers of the cross of 'Red Fuji' (Malus domestica) × 'Hongrou' (Malus sieversii), and the linkage map had a length of 1,299.67 cM, with its marker density of 4.6 cM/marker. Tan et al.[56] created a genetic maps of Malus asiatica ('Zisai Pearl') × Malus domestica ('Red Fuji'). This consensus linkage map consisted of 640 SSRs and 490 SNPs, which spanned 1,497.5 cM with its marker density of 1.33 cM/marker. Besides, for the 'Red Fuji' map, 790 markers were mapped on the 17 linkage groups and its total length was 1,457.5 cM, with its average marker interval of 1.84 cM. Cai et al.[57] constructed a Malus domestica × Malus baccata genetic map, which contained 5,064 sepcific length amplified fragment (SLAF) markers.
Application of sequencing technology in QTL mapping
-
Limiting to the difficulty of juvenility (4 to 8 year juvenile period), high heterozygosity, and self-incompatibility, the genetic improvement of efficient apple breeding is facing great challenges. However, through development of DNA sequencing, apple breeding has gained a new development opportunity.
The technology of DNA sequencing began in 1997 and has developed for more than 30 years. Recently, DNA sequencing has become the core technology of molecular biology research and was largely amplified in genetic mapping of apple. Next-generation DNA sequencing (NGS), genotyping-by-sequencing (GBS), Restriction-site associated DNA sequencing (RAD-seq), Specific-locus amplified fragment sequencing (SLAF-seq) have become essential tools in constructing genetic maps and making QTL analyses in apples[49,52,57−59]. Besides, it is of great significance for fruit tree breeding and fruit quality improvement when combing the whole genome sequencing information to the QTL mapping of important fruit quality. For example, Antanaviciute et al.[44] constructed a high throughput linkage map of 'M432' apple rootstock progeny by using apple International RosBREED SNP Consortium (IRSC) BeadChips, and this map will be used for cost-effective QTL analysis and improve the assembly accuracy of genome sequence.
QTL analysis of sugar content in apples
-
The sugar content of apple is one of the decisive indexes in determining its flavor. Meanwhile, the sugar content of apple is also a typical quantitative trait, whose measurement indicators mainly include soluble solid content (SSC) and diverse sugar components (fructose, glucose, sucrose, sorbitol). Compared with the single-gene controlled phenotypes or traits, the variation of sugar content is more complex, whose contents are quantitatively regulated by multiple genes. Therefore, it is necessary to carry QTL analysis on sugar content to better understand the genetic regulation networks in determining fruit sweetness in apples.
Early in 2003, Liebhard et al.[60] had conducted QTL mapping of 251 segregating progeny using a 'Fiesta' × 'Discovery' mapping population, and identified QTLs with fruit SSC on the 3, 6, 8, 9, and 14 chromosomes. Later, Kenis et al.[61] taken inheritance analysis of fruit quality traits of two apple cultivars 'Telamon' and 'Braeburn' in two consecutive seasons, and identified SSC on the LG2 and LG10 in 'Telamon' and 'Braeburn' hybrid population. Besides SSC, Kenis et al.[61] also found that LG10 was highly connected with fruit quality traits, including fruit harvest, fruit diameter, fruit weight, fruit firmness, and fruit acidity, which indicated that LG10 may have knock-on pleiotropic effects on fruit quality traits. Costa[62] used six cultivars to form four populations, including 'Fuji' × 'Delearly', 'Fuji' × 'Cripps Pink_Pink Lady', 'Golden Delicious' × 'Scarlet', and 'Golden Delicious' × 'Braeburn', and constructed a consensus map to conduct QTL analysis of fruit quality traits. Finally, he identified 56 QTLs, which included three QTLs of SSC on the chromosome of 6, 8, and 12, respectively. Later, Peace et al.[63] developed a strategy for QTL analysis with representative germplasm of apple, peach, and sweet cherry. Guan et al.[21] further adapted this method and used 274 selected germplasm to conducted QTL analysis of SSC and individual sugars, and the QTLs they identified for SSC were on the chromosome of 2, 3, 12, 13, and 15. Constructed the linkage map of 'Red Fuji' × 'Hongrou', Liu et al.[55] identified a QTL of sugar mapped on the LG02 linkage group, and two QTLs of SSC on the LG01 and LG07 linkage group were also detected. However, the contribution rate of these three QTLs were only 3%, 3.3%, and 6%, respectively.
As for the development of GC-MS and HPLC technology, it is possible to quantify different soluble sugar components and conduct more detailed QTL mapping. In 2014, a segregating mapping population of 'Orin' and 'Akane' was used to identify QTLs associated with fruit quality traits, including fruit SSC, and the content of sucrose, glucose, fructose, and sorbitol, and this was the first time to conduct QTL analysis on single sugar content[22]. This research finally revealed QTLs of brix on LG15 and LG16, QTLs of fructose on LG6 and LG16, QTLs of glucose on LG5, QTLs of sucrose on LG10 and LG15, and QTLs of sorbitol on LG12 and LG16[22]. Moreover, using 274 selected germplasm, Guan et al.[21] also identified QTLs for fructose content on LGs 1, 3, and 15; QTLs for glucose content on LGs 1, 2, 3 ,15, and 16; QTLs for sucrose content on LGs 1, 3, 4, 9, and 12; and QTLs for sorbitol content on LGs 1, 3, 5, 9, 11, 13, and 15. Among these QTLs, the QTLs on LG01 for both fructose and sucrose accounted for 34%−67% and 13%−41% of total phenotypic variation, which indicated that these two QTLs on LG01 may have significant roles in determining fruit sweetness quality in apples. In the population of 'Jonathan' × 'Golden Delicious', Sun et al.[50] identified QTLs of fructose on the LG01 linkage group of the 'Jonathan' map, and QTLs of sucrose on the LG01 linkage group of the 'Golden Delicious' map, with an 28.8% and 17.5% explanation of variance. In 'Jiguan' × 'Wangshanhong' hybrid population, QTL locus of fructose and sucrose were both identified on the LG03 of the 'Wangshanhong' map[17]. Constructing QTL mapping analyses of 'Honeycrisp' (HC) × 'Qinguan' (QG) hybrid population in two consecutive years, Wang et al.[18] found QTLs for fructose content on the LGs 01, 02, 03, 04, 07, 08, 10, 11, 12, 13, 14, 16, and 17 linkage groups, and the LG01 QTL region of fructose content was stable in two years, with its peak LOD scores of 4.71 in 2015 and 4.14 in 2016, and with its contribution of 17.5% and 18.2%, respectively. Moreover, through genome-wide association studies (GWAS) for SSC of 497 Malus accessions, Liao et al.[64] identified six QTL loci on chromosomes 01, 03, 07, 09, 10, and 11. Of these QTLs, one QTL for glucose content was mapped on the LG03, one QTL for sorbitol content was mapped on the LG10, and two QTLs for sucrose content were identified on the LG01 and LG09. Moreover, three QTLs of fructose content were detected on the chromosome of LG01, 07, and 11.
According to all the results of QTL mapping (Table 1), sugar content QTLs were detected on all of the 17 apple chromosomes. Above all, among all of the QTLs reported on 17 apple chromosomes, LG03 and LG01 had more QTLs of all sugar components than that on the other chromosomes, which indicated that fruit quality of sugar content in apples may mainly be controlled by these published QTL clusters on LG03 and LG01. Among all of the revealed QTLs, fructose content relevant QTLs were mapped on all other remaining chromosomes except LG05 and LG09, which indicated that the regulation of fructose content in apples may be more complex than other sugars.
Table 1. QTL analysis of sugar content in apples.
Chromosome Localization (cM) Reference Hybrid population Brix/SSC Fructose Glucose Sucrose Sorbitol LOD score/ Bayes factor Peoportion of phenotypic variation explained by QTLs Notes LG01 59.8−85.7 cM/ 59.8−76.3 cM Guan et al. (2015)[21] 274 representative germplasm √ BF 32.2/31.1 34%/45% 60.9−76.3 cM/ 61.1−85.7 cM Guan et al. (2015)[21] 274 representative germplasm √ BF 11.4/11.1 22%/19% 54.6−76.3 cM/ 60.9−76.3 cM Guan et al. (2015)[21] 274 representative germplasm √ BF 9.7/33.0 17%/36% 62.9−85.7 cM Guan et al. (2015)[21] 274 representative germplasm √ BF 10.4 21% 32.81−42.74 cM Sun et al. (2015)[50] 'Jonathan' × 'Golden Delicious' √ LOD 4.3 ('Jonathan') 28.5% ('Jonathan') 48.60−50.57 cM Sun et al. (2015)[50] 'Jonathan' × 'Golden Delicious' √ LOD 3.5 ('Golden Delicious') 17.5% ('Golden Delicious') / Liao et al. (2021)[64] 497 Malus accessions √ / / / Liao et al. (2021)[64] 497 Malus accessions √ / / 95.51−97.97 cM/ 113.14−116.40 cM/
97.67−95.00 cM/112.45−123.09 cM/
47.25−49.39 cM/ 86.85−93.56 cMWang et al. (2022)[18] 'Honeycrisp' × 'Qinguan' √ LOD 3.29/4.71/3.00/4.14 ('Honeycrisp'); LOD 3.46/3.60 ('Qinguan') 12.5%/17.5%/13.5%/18.2% ('Honeycrisp'); 15.4%/16.0% ('Qinguan') LG02 / Kenis et al. (2008)[61] 'Telamon' ×'Braeburn' √ LOD 3.3/ 3.8 ('Telamon');
LOD 3.4/4.0 ('Braeburn')6.5%/8.0% ('Telamon');
7.4%/8.1% ('Braeburn')75.8−84.4 cM Guan et al. (2015)[21] 274 representative germplasm √ BF 3.2 6% 1.2−12.8 cM Guan et al. (2015)[21] 274 representative germplasm √ BF 7.2 13% QTLs after 20 weeks of refrigerated storage 51.08−56.67 cM/ 10.20−21.00 cM Wang et al. (2022)[18] 'Honeycrisp' × 'Qinguan' √ LOD 3.42 ('Honeycrisp');
LOD 3.80 ('Qinguan')15.3% ('Honeycrisp');
14.4% ('Qinguan')LG03 / Liebhard et al. (2003)[36] 'Fiesta' × 'Discovery' √ LOD 2.0 ('Fiesta') 5% ('Fiesta') 28.8−38.0 cM/54.0−77.2 cM Guan et al. (2015)[21] 274 representative germplasm √ BF 3.3/10.6 3%/22% 14.2−28.9 cM/5.0−13.5 cM Guan et al. (2015)[21] 274 representative germplasm √ BF 5.4/9.2 10%/15% 54.0−71.3 cM/73.3−87.0 cM/
49.2−69.3 cMGuan et al. (2015)[21] 274 representative germplasm √ BF 4.8/10.2/9.6 7%/26%/23% QTLs after 10 weeks /20 weeks/10 weeks of refrigerated storage 5.0−25.2 cM Guan et al. (2015)[21] 274 representative germplasm √ BF 6.7 10% QTLs after 20 weeks of refrigerated storage 49.2−69.3 cM/73.3−87.0 cM Guan et al. (2015)[21] 274 representative germplasm √ BF 11.3/3.9 22%/5% QTLs after 10 weeks/20 weeks of refrigerated storage 34.94−69.34 cM Ma et al. (2016)[17] 'Jiguan' × 'Wangshanhong' √ LOD 5.75 ('Wangshanhong') 20.6% ('Wangshanhong') 38.06−60.34 cM Ma et al. (2016)[17] 'Jiguan' × 'Wangshanhong' √ LOD 4.47 ('Wangshanhong') 17.1% ('Wangshanhong') 45.47−58.34 cM Ma et al. (2016)[17] 'Jiguan' × 'Wangshanhong' √ LOD 3.41 ('Wangshanhong') 11.7% ('Wangshanhong') 34.94−90.29 cM Ma et al. (2016)[17] 'Jiguan' × 'Wangshanhong' √ LOD 7.73 ('Wangshanhong') 28.0% ('Wangshanhong') / Liao et al. (2021)[64] 497 Malus accessions √ / / 19.93−23.31 cM/ 20.95−23.31 cM/
73.86−76.66 cM/ 14.39−19.69 cM/
24.77−32.25 cMWang et al. (2022)[18] 'Honeycrisp' × 'Qinguan' √ LOD 3.31/3.28/3.18 ('Honeycrisp'); LOD 3.47/4.52 ('Qinguan') 12.6%/14.7%/14.3% ('Honeycrisp'); 13.2%/16.8% ('Qinguan') LG04 7.9−16.1 cM Guan et al. (2015)[21] 274 representative germplasm √ BF 7.4 8% 28.77−0.37 cM Ma et al. (2016)[17] 'Jiguan' × 'Wangshanhong' √ LOD 4.49 ('Wangshanhong') 16.7% ('Wangshanhong') 30.08−30.72 cM/ 37.09−37.79 cM/
44.60−45.53 cMWang et al. (2022)[18] 'Honeycrisp' × 'Qinguan' √ LOD 3.42/3.38/3.26 ('Qinguan') 13.0%/12.9%/12.4% ('Qinguan') LG05 / Kunihisa et al. (2014)[22] 'Orin' × 'Akane' √ LOD 3.34 ('Akane') 12.4% ('Akane') 3.2−10.8 cM Guan et al. (2015)[21] 274 representative germplasm √ BF 2.3 2% LG06 / Liebhard et al. (2003)[36] 'Fiesta' × 'Discovery' √ LOD 4.9 ('Fiesta');
LOD 4.2 ('Discovery')17% ('Fiesta');
15% ('Discovery')/ Kunihisa et al. (2014)[22] 'Orin' × 'Akane' √ LOD 3.27 ('Akane') 10.9% ('Akane') / Costa F (2015)[62] 'Fuji' × 'Delearly', 'Fuji' × 'Cripps Pink_Pink Lady', 'Golden Delicious' × 'Scarlet', and 'Golden Delicious' × 'Braeburn' √ / / LG07 / Liao et al. (2021)[64] 497 Malus accessions √ / / 64.33−78.37 cM/ 84.51−116.22 cM/
128.14−134.43 cMWang et al. (2022)[18] 'Honeycrisp' × 'Qinguan' √ LOD 3.74/3.98/3.62 ('Honeycrisp') 14.1%/15.0%/13.7% ('Honeycrisp') LG08 / Liebhard et al. (2003)[60] 'Fiesta' × 'Discovery' √ LOD 1.9 ('Discovery') 4% ('Discovery') / Costa F (2015)[62] 'Fuji' × 'Delearly', 'Fuji' × 'Cripps Pink_Pink Lady', 'Golden Delicious' × 'Scarlet', and 'Golden Delicious' × 'Braeburn' √ / / 10.57−14.54 cM/ 32.37−49.38 cM/
57.76−62.73 cM/ 71.73−74.36 cMWang et al. (2022)[18] 'Honeycrisp' × 'Qinguan' √ LOD 3.96/16.6/15.7/15.7 ('Qinguan') 14.9%/16.6%/15.7%/15.7% ('Qinguan') LG09 / Liebhard et al. (2003)[36] 'Fiesta' × 'Discovery' √ LOD 3.3 ('Discovery') 7% ('Discovery') 0.7−19.6 cM Guan et al. (2015)[21] 274 representative germplasm √ BF 6.4 24% 40.2−49.1 cM Guan et al. (2015)[21] 274 representative germplasm √ BF 2.1 1% / Liao et al. (2021)[64] 497 Malus accessions √ / / LG10 / Kenis et al. (2008)[61] 'Telamon' ×'Braeburn' √ LOD 5.8/12.4 ('Telamon');
LOD 3.7/12.6 ('Braeburn')12.4%/30.1% ('Telamon');
9.0%/29.3% ('Braeburn')/ Kenis et al. (2008)[61] 'Telamon' ×'Braeburn' √ LOD 8.5 ('Telamon');
LOD 8.9 ('Braeburn')19.5% ('Telamon');
20.6% ('Braeburn')/ Liao et al. (2021)[64] 497 Malus accessions √ / / 23.9−28.45 cM/ 36.36−38.23 cM/
25.66−27.27 cMWang et al. (2022)[18] 'Honeycrisp' × 'Qinguan' √ LOD 4.24/3.43 ('Honeycrisp');
LOD 3.15 ('Qinguan')15.9%/13.0% ('Honeycrisp');
12.1% ('Qinguan')LG11 39.2−57.5 cM Guan et al. (2015)[21] 274 representative germplasm √ BF 4.7 7% / Liao et al. (2021)[64] 497 Malus accessions √ / / 49.95−50.72 cM Wang et al. (2022)[18] 'Honeycrisp' × 'Qinguan' √ LOD 3.02 ('Qinguan') 11.6% ('Qinguan') LG12 / Kunihisa et al. (2014)[22] 'Orin' × 'Akane' √ LOD 2.79 ('Orin') 10.5% ('Orin') 41.5−48.3 cM Guan et al. (2015)[21] 274 representative germplasm √ BF 5.3 12% QTLs after 10 weeks of refrigerated storage / Costa F (2015)[62] 'Fuji' × 'Delearly', 'Fuji' × 'Cripps Pink_Pink Lady', 'Golden Delicious' × 'Scarlet', and 'Golden Delicious' × 'Braeburn' √ / / 34.53−39.20 cM/ 69.64−72.66 cM/
99.01−104.04 cMWang et al. (2022)[18] 'Honeycrisp' × 'Qinguan' √ LOD 4.37 ('Honeycrisp');
LOD 3.29/3.32 ('Qinguan')16.3% ('Honeycrisp');
14.7%/14.9% ('Qinguan')LG13 54.2−71.5 cM Guan et al. (2015)[21] 274 representative germplasm √ BF 3.1 7% 99.8−162.8 cM Guan et al. (2015)[21] 274 representative germplasm √ BF 5.6 27% QTLs after 20 weeks of refrigerated storage 36.64−38.77 cM/ 47.21−47.62 cM/ 86.29−94.41cM Wang et al. (2022)[18] 'Honeycrisp' × 'Qinguan' √ LOD 3.99 ('Honeycrisp');
LOD 3.43/3.47 ('Qinguan')15.0% ('Honeycrisp');
13.1%/15.5% ('Qinguan')LG14 / Liebhard et al. (2003)[36] 'Fiesta' × 'Discovery' √ LOD 4.2 ('Fiesta');
LOD 3.3 ('Discovery')11% ('Fiesta');
7% ('Discovery')22.59−25.67 cM/ 55.87−56.63 cM Wang et al. (2022)[18] 'Honeycrisp' × 'Qinguan' √ LOD 3.20 ('Honeycrisp');
LOD 3.39 ('Qinguan')12.2% ('Honeycrisp');
12.9% ('Qinguan')LG15 / Kunihisa et al. (2014)[22] 'Orin' × 'Akane' √ LOD 4.88 ('Orin') 13.2% ('Orin') / Kunihisa et al. (2014)[22] 'Orin' × 'Akane' √ LOD 3.06 ('Akane') 10.1% ('Akane') 75.8−77.1 cM Guan et al. (2015)[21] 274 representative germplasm √ BF 4.9 10% 94.7−104.3 cM Guan et al. (2015)[21] 274 representative germplasm √ BF 4.4 5% 31.7−38.4 cM/ 34.1−40.3 cM Guan et al. (2015)[21] 274 representative germplasm √ BF 4.7/5.6 17%/13% QTLs after 20 weeks/10 weeks of refrigerated storage 94.7−99.5 cM Guan et al. (2015)[21] 274 representative germplasm √ BF 5.4 12% QTLs after 10 weeks of refrigerated storage LG16 / Kunihisa et al. (2014)[22] 'Orin' × 'Akane' √ LOD 8.26 ('Orin') 22.5% ('Orin') / Kunihisa et al. (2014)[22] 'Orin' × 'Akane' √ LOD 3.03 ('Akane') 10.2% ('Akane') / Kunihisa et al. (2014)[22] 'Orin' × 'Akane' √ LOD 3.00 ('Akane') 10.0% ('Akane') / Kunihisa et al. (2014)[22] 'Orin' × 'Akane' √ LOD 3.74 ('Akane') 13.8% ('Akane') 2.4−8.8 cM Guan et al. (2015)[21] 274 representative germplasm √ BF 4.2 6% 65.35−70.60 cM/ 98.75−91.75 cM/
17.71−29.61 cM/35.81−37.07 cMWang et al. (2022)[18] 'Honeycrisp' × 'Qinguan' √ LOD 3.25/3.18 ('Honeycrisp');
LOD 3.45/3.31 ('Qinguan')12.4%/12.2% ('Honeycrisp');
13.1%/12.6% ('Qinguan')LG17 74.02−75.17 cM/ 85.49−86.03 cM/
73.21−74.18 cMWang et al. (2022)[18] 'Honeycrisp' × 'Qinguan' √ LOD 3.65/3.44/3.59 ('Qinguan') 13.8%/13.1%/16.0 ('Qinguan') Major QTLs identified regulatory genes of sugar content in apples
-
The above studies revealed that genetic linkage map construction and QTL mapping of varies hybrid populations have developed for a long time in apples, but few identified genes in the mapping chromosome regions who are relative to influence sugar content in apples have been revealed until now.
Carrying out GWAS analysis for fruit quality traits of 497 Malus accessions, Liao et al.[64] first revealed five fruit sweetness associated genes. The first one was mapped on LG03 and associated with fruit glucose content, named MdWD40 (MD03G1273100). Transient overexpression of MdWD40 caused greatly increased glucose content. The second candidate gene was identified as a fructose content negatively regulated gene, who was located on LG01 and named as MdFK (MD01G1177300). And the candidate gene related to fruit sucrose content regulation was also mapped on LG01, it was identified as a MdRPM1-like (MD01G1186600) gene. Another sucrose content QTL locus was mapped on LG09 and identified as MdPQLC (MD09G1018900). Overexpression of MdRPM1-like and MdPQLC both increased sucrose accumulation, which indicated that these two genes were positively associated with sucrose accumulation. A MdSOT2 gene (MD0G079800) was identified as a positively regulatory factor for sugar alcohol sorbitol accumulation, who was located on LG10.
Based on the QTL mapping of fructose content in the 'Honeycrisp' × 'Qinguan' F1 segregating population, Wang et al.[18] found a SNP variant (A/G) in the promoter region of MdSDH2 (MDP0000874667) gene. MdSDH2 participated in the process of the inversion from sorbitol to fructose, so that it could positively control fructose content. In this study, Wang et al.[18] further revealed that the A to G variation from 'Honeycrisp' to 'Qinguan' affected MdABI3 binding ability, caused changed expression levels of MdSDH2, and finally resulted in a different fructose content in 'Honeycrisp' and 'Qinguan' fruits.
-
In recent years, the quality of apple fruits has decreased in its sugar content and flavor. Previous studies have revealed that the flavor of apple fruits is mainly determined by the contents of total sugar and titratable acidity, as well as their ratio. Thus, sugar content quality in apples is of great significance.
The genetic control of sugar content quality in apples is crucial, and therefore understanding the genetic basis behind it is essential. In this review, we have summarized the variety and distribution of sugar in apples, introduced the determination methods of both the SSC and the specific sugar components, indicated their characteristics and their metabolism and transportation rules. Additionally, we have detailed the research progresses in high-density genetic linkage map construction and its application, as well as the QTL analyses of various sugars.
Recently, marker-assisted selection (MAS) has been widely used in apple breeding. Obviously, QTL identified SNPs would help accelerate the applications of MAS in apple breeding. In this review, we highlighted the advance of QTL analyses of sugar content in apples, which we hope will help breeders better choose more effective molecular markers in their breeding process. Above all, sugars are known to be genetically determined, but it can be easily found that the revealed QTLs identified regulatory genes are still in a limited amount. Thus, genes controlling sugar content in the reported or new QTL regions remain to be further explored in future studies.
This work was supported by the National Natural Science Foundation of China (No. 32102330), the Shaanxi science and technology innovation team project (2022TD-18), and the earmarked fund for the China Agriculture Research System (CARS-28).
-
The authors declare that they have no conflict of interest. Mingjun Li is the Editorial Board member of Fruit Research who was blinded from reviewing or making decisions on the manuscript. The article was subject to the journal's standard procedures, with peer-review handled independently of this Editorial Board member and his research groups.
- Copyright: © 2023 by the author(s). Published by Maximum Academic Press, Fayetteville, GA. This article is an open access article distributed under Creative Commons Attribution License (CC BY 4.0), visit https://creativecommons.org/licenses/by/4.0/.
-
About this article
Cite this article
Yuan J, Wang Z, Wang X, Zhang C, Ma F, et al. 2023. Research advances in genetic quality of sugar content in apples. Fruit Research 3:13 doi: 10.48130/FruRes-2023-0013 

Research advances in genetic quality of sugar content in apples
- Received: 04 April 2023
- Accepted: 04 May 2023
- Published online: 09 June 2023
Abstract: Sugar content is a critical quality trait that determines the flavor of apple, glucose, fructose, and sucrose are the main sugar components. In this review, we outline the genetic basis of various sugar components in apples, including their metabolism and transportation rules. We also analyze the genetic linkage map construction and QTL mapping loci. This review will provide insights for future research of sugar content regulatory mechanisms and help accelerate the molecular marker-assisted breeding process of apple with moderate sweetness.
-
Key words:
- Genetic quality /
- Sugar content /
- QTL analysis /
- Apple