


-
Apple is an important perennial fruit crop with a broad distribution worldwide: it ranks second in economic value among fruit crops with an estimated global production of
${\$} $ www.fao.org/faostat/en ). Developing new apple cultivars that are disease resistant and have improved fruit quality has been a major focus of apple breeding programs. Due to a prolonged juvenile stage, a highly heterozygous genome and self-incompatibility, apple breeding is a challenging and laborious process. Genomics-assisted breeding offers a way to more efficiently develop improved apple cultivars. One such approach is the implementation of marker-assisted selection (MAS) in breeding programs. MAS involves selecting and retaining progeny of a cross that possess alleles likely to express a desired phenotype so that only promising germplasm is moved forward in the breeding pipeline.Breeding new apple cultivars with augmented health benefits could be attained by increasing the amount of beneficial bioactive compounds present within the fruit. Phenolic compounds are a large family of secondary metabolites commonly found in plants that possess antioxidant and antimicrobial properties[1]. Consumption of phenolic compounds from apples can impart health benefits due to their antidiabetic properties[2]. GWAS and linkage mapping studies in apple have revealed numerous QTLs that are associated with phenolic content variation[3−5]. Among the identified QTLs is a single QTL hotspot on chromosome 16 that is associated with multiple polyphenols such as catechin, epicatechin and proanthocyanidins[3−5]. Within the identified QTL hotpot on chromosome 16 lies the leucoanthocyanidin reductase (LAR1) gene. Therefore, LAR1, which converts leucocyanidin to catechin, has been proposed as a candidate gene involved in phenolic content variation in apple. Further assessment of the genetic control of phenolic compounds is necessary to develop markers suitable for MAS that can be used to increase phenolic content in apple.
Important targets for apple breeding also includes the improvement of fruit quality traits, specifically texture related traits. Given that apples are often consumed after spending a period of time in storage, it is essential that they maintain their texture until they are sold[6]. Therefore, one of the most important traits to be targeted using genomics-assisted assisted breeding in apple is fruit firmness[7]. Softening is one of the hallmarks of apple ripening that indicates when a cultivar is ready to harvest. Apple ripening is characterised by a climacteric rise that involves an increase in respiration and synthesis of the gaseous plant hormone ethylene[8]. This climacteric rise leads to numerous biochemical changes including softening, expression of aroma, change in colour and carbohydrate metabolism[9]. After the climacteric rise, ethylene production begins due to the introduction of 1-aminocyclopropane-1-carboxylic acid synthase 1 (ACS1). This initiates the onset of ripening and oxidation of ACC by ACC-oxidase 1 (ACO1), which leads to the production of ethylene[10,11]. Both ACS1 and ACO1, possess reduced functionality alleles that lead to low ethylene production and improved storage[12−14]. The presence of a retrotransposon insertion within the ACS1-2 allele results in low ethylene production in apple cultivars, while a 62 base pair deletion in ACO1 is associated with low ethylene production[12−14]. The desirable alleles of ACO1 and ACS1 associated with increased firmness were developed into markers for MAS[12−15]. In addition to ACO1 and ACS1, polygalacturonase (PG1) was identified as a key gene controlling apple firmness[16−18]. PG1 encodes an enzyme that degrades pectin within cell walls and the middle lamella of apple fruit leading to loss of firmness[18]. Although multiple markers have been developed for ripening and firmness related traits, their utility across diverse germplasm remains questionable since many of these markers were identified using biparental mapping populations[19]. Additional genetic mapping of key traits in apple can further advance the ability to efficiently select germplasm with promising fruit quality phenotypes.
Recent genome-wide association studies (GWAS) have identified additional candidate genes associated with ripening and firmness related traits across diverse apple germplasm. Examining 689 accessions, Migicovsky et al. first identified an association between a SNP in a NAC transcription factor, NAC18.1, and fruit firmness and harvest date. This SNP has been named the D5Y mutation since it involves a non-synonymous mutation from aspartate (D) to tyrosine (Y) at the fifth amino acid position of the NAC18.1 protein sequence[19]. Since then, GWAS in other apple collections have uncovered associations between variants in and around NAC18.1 and fruit firmness and harvest date[20−22]. NAC transcription factors (TF) are involved in a wide array of biological processes and form one of the largest TF families within plants[23]. Specifically, NAC TFs have been associated with the regulation of ripening processes across numerous fruit species[24]. For example, multiple NAC TFs, including NOR, regulate tomato fruit ripening[25]. In strawberry, FaRIF/FaNAC03 has been demonstrated to be involved in softening, and pigment and sugar accumulation[26]. In sweet cherry, PavNAC56 has been identified as a regulator of ripening and softening[27]. NAC TFs have also been associated with maturity date in peach[28,29] and apricot[30]. NAC18.1 is ethylene independent and the D5Y marker within NAC18.1 has higher predictive power for firmness related traits compared to ACO1, ACS1 and PG1 markers[19]. Markers that can identify breeding lines with desirable firmness and ripening phenotypes can aid breeding programs that are focused on developing new apple cultivars with superior quality.
Here, we performed a large-scale GWAS in apple for 21 fruit quality and phenology traits, with a particular focus on ripening and firmness related traits using Canada's Apple Biodiversity Collection (ABC). The ABC is an orchard of over 1,000 apple accessions that was established in order to enable high resolution GWAS of fruit quality traits. The phenotypic diversity across the ABC was previously quantified by Watts et al. through the phenotyping of over 1,000 apple accessions for 39 fruit quality traits[31]. The ABC was genotyped using genotype-by-sequencing, resulting in 278,231 genetic markers[32]. By pairing the genotypic and phenotypic data collected from the ABC, we identified genetic markers associated with commercially relevant fruit quality traits to advance genomics-assisted breeding in apple.
-
The ABC contains over 1,000 unique apple accessions, the majority of the population is M. domestica, while 78 accessions are M. sieversii. Prior to undertaking genetic mapping, principal components analysis (PCA) of the genome-wide SNP data was performed to assess the population structure present within the collection. PCA of the genome-wide SNP data revealed that PC1 explained 5.5% and PC2 explained 3.1% of the overall genetic variance (Fig. 1a). We observed separation of M. domestica and M. sieversii along PC1: the two species had significantly different PC1 values (W = 69789, p < 1 × 10⁻¹⁵) (Fig. 1b, Supplemental Table S1). We investigated the degree to which population structure correlated with phenotypes and determined that PC2 was strongly correlated with harvest date (R2 = 0.16, p < 1 × 10⁻¹⁵) (Fig. 1c, Supplemental Table S2).
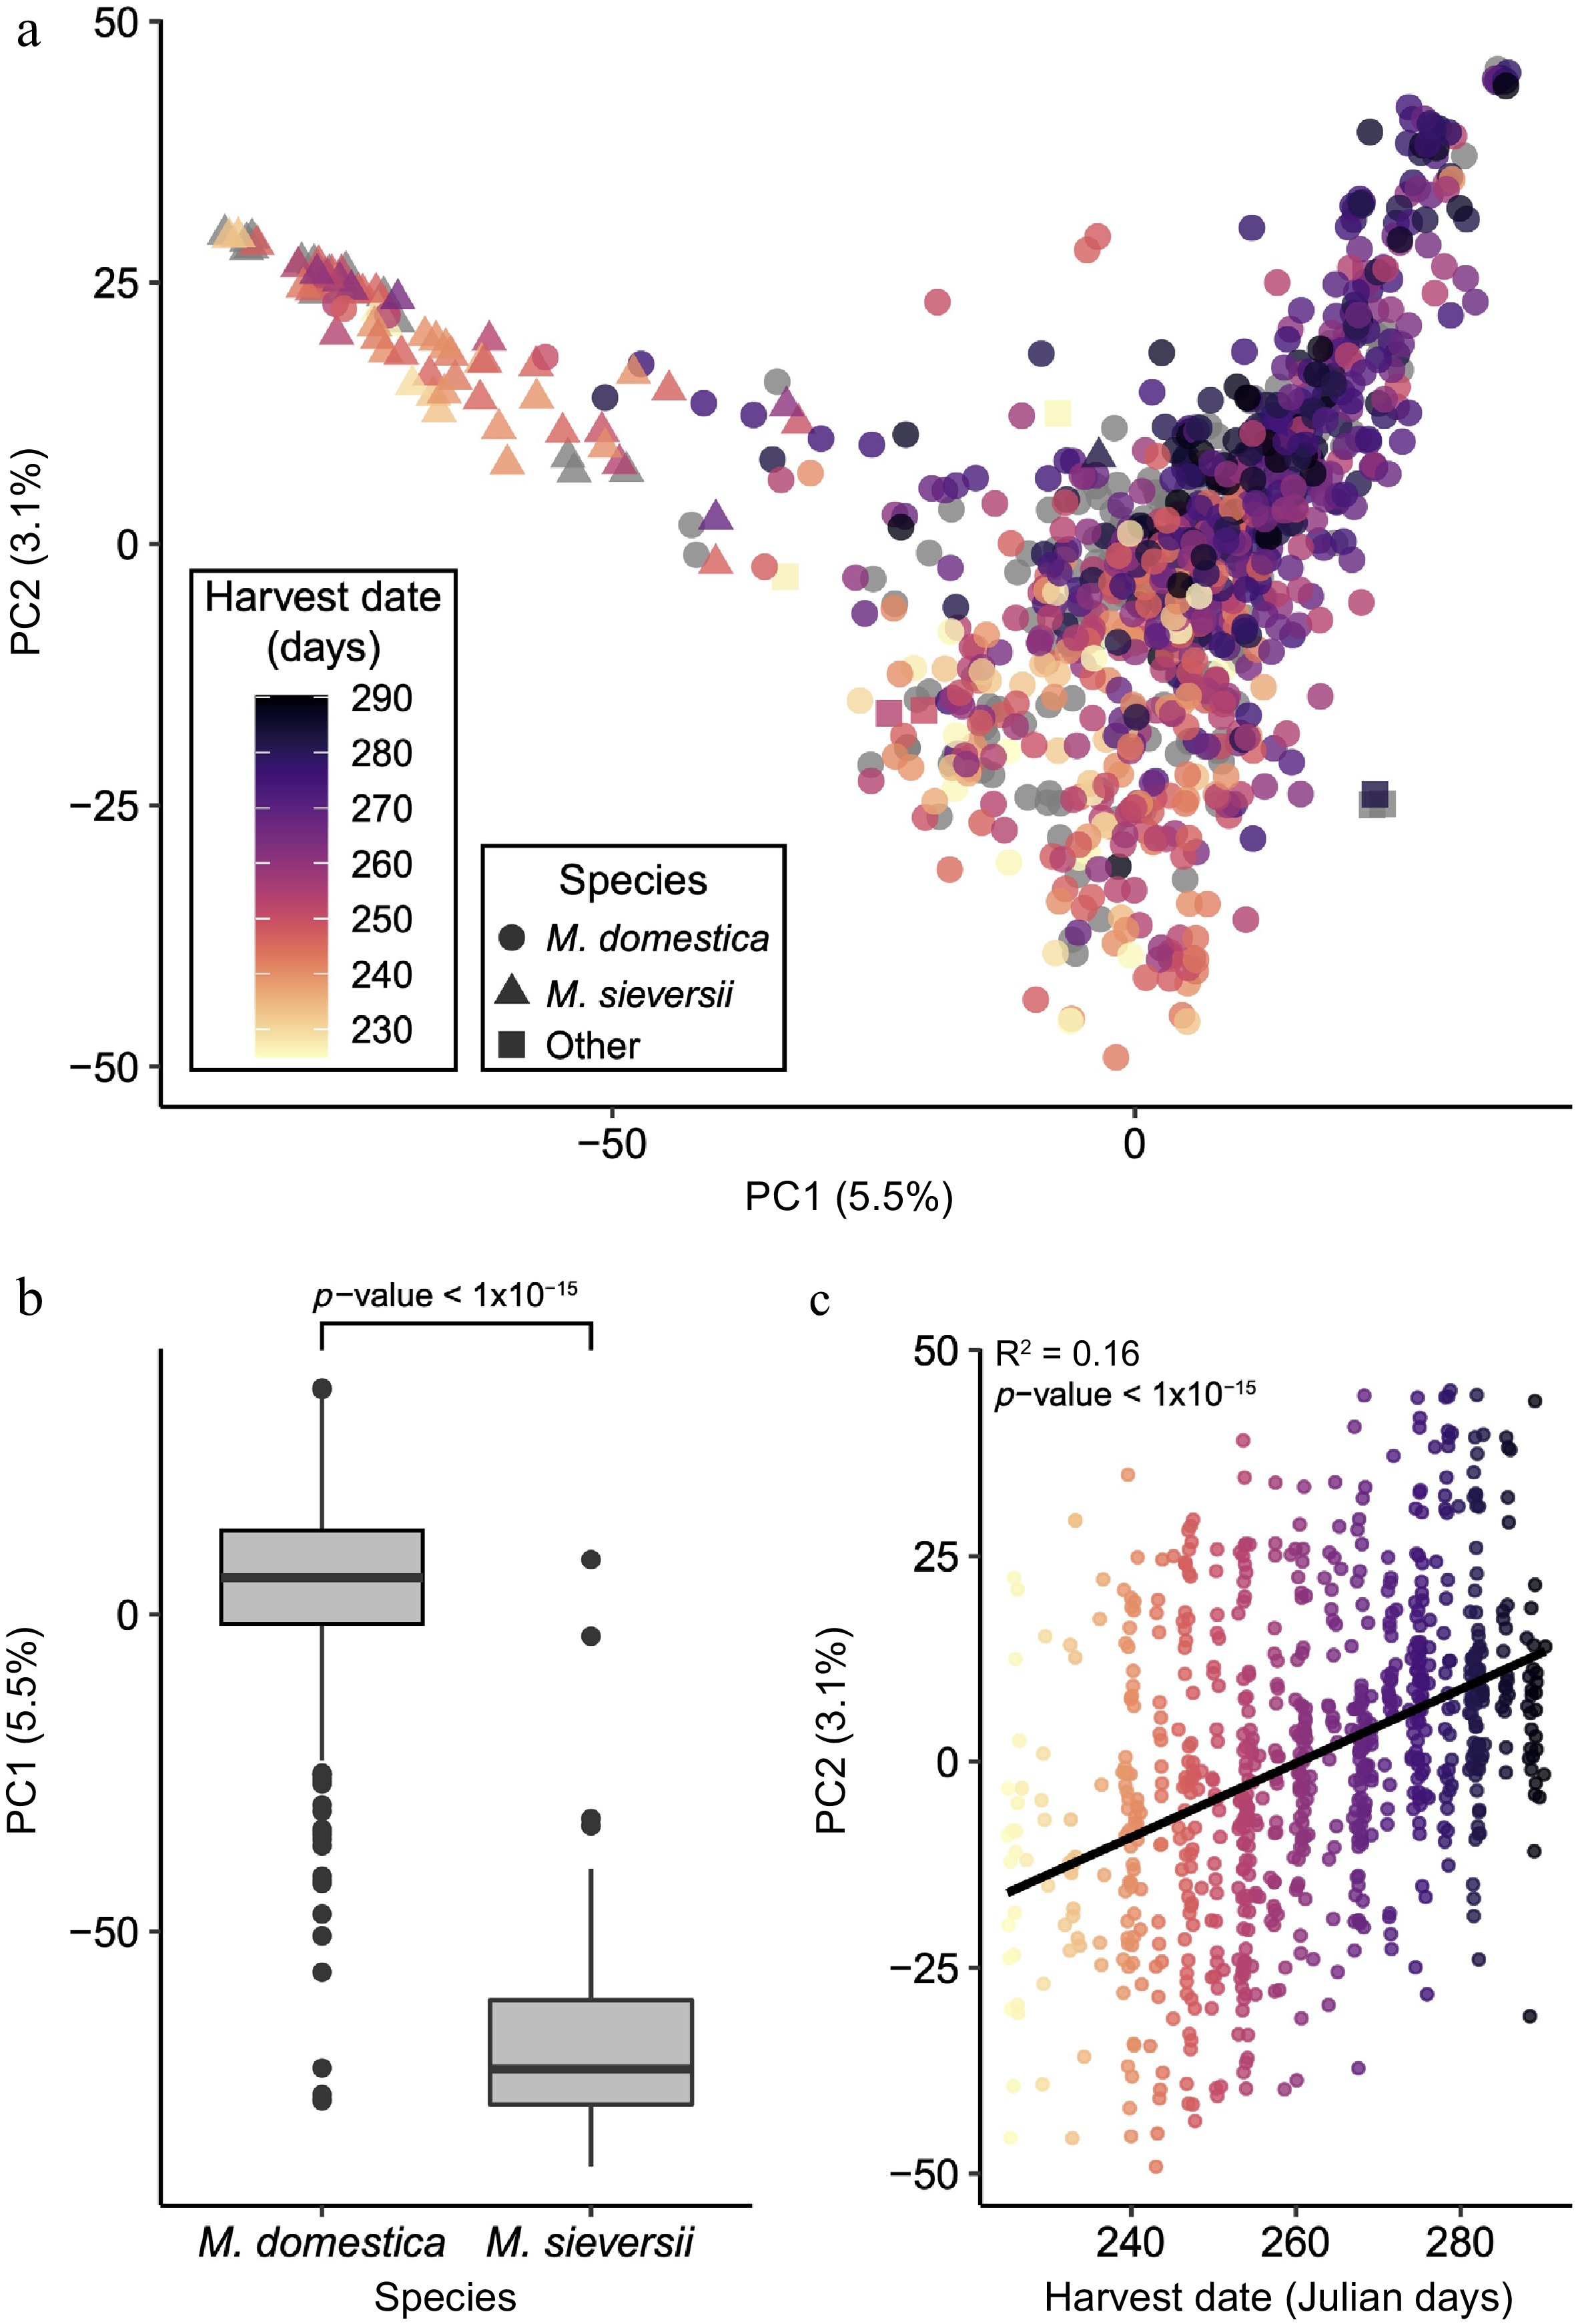
Figure 1.
Population genomic analysis of 1,054 diverse apple accessions. (a) Principal components analysis of genome-wide SNP data, with accessions coloured by harvest date and with shape representing species. (b) Boxplot of the PC1 values between M. sieversii and M. domestica. (c) Pearson correlation of PC 2 values with harvest date.
Genome-wide association studies
-
GWAS were conducted for 21 fruit quality and phenology traits using a standard mixed-linear model (Supplemental Fig. S1). The first trait we examined was phenolic content (μmol/g), measured using the the Folin–Ciocalteu assay (FCA) across 438 accessions.
The top SNP from the GWAS for phenolic content was Chr15:3806070 (p = 2.22 × 10⁻²⁶) and it explained 27.3% of the phenotypic variation (Fig. 2a, Supplemental Table S3). A second peak was observed on chromosome 16, with the top SNP at Chr16:5256210 (p = 2.41 × 10⁻¹²) which explained 11.9% of the phenotypic variation (Fig. 2a, Supplemental Table S3).
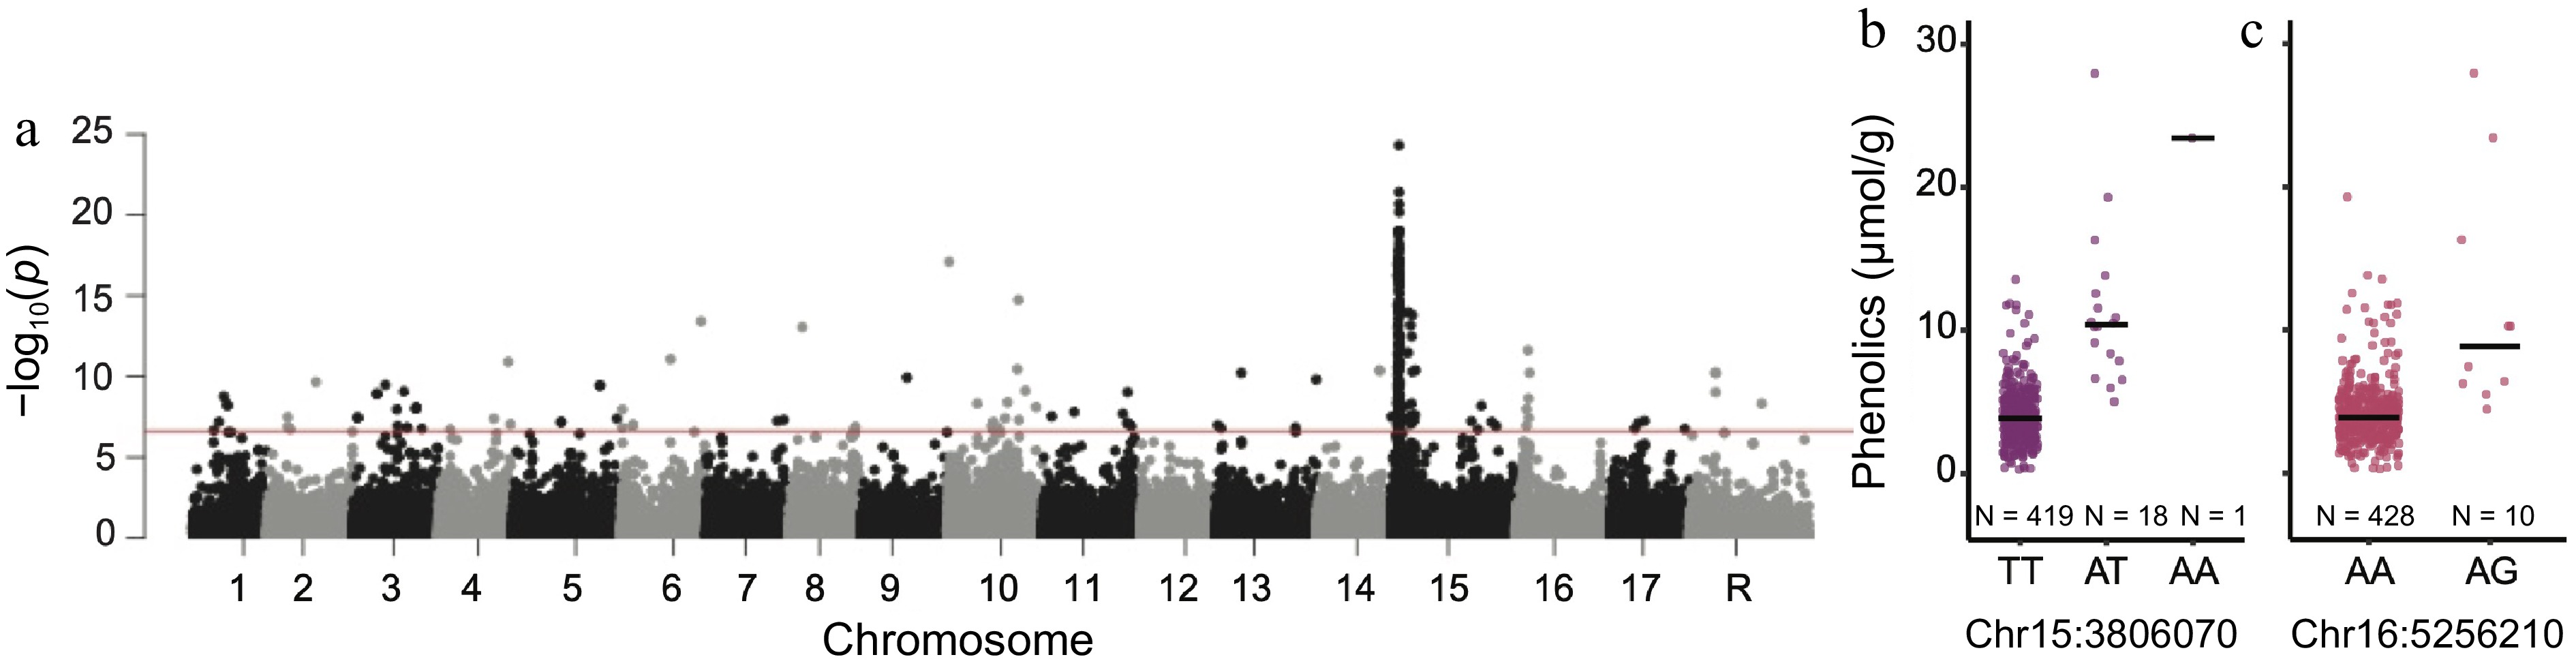
Figure 2.
Genome-wide association study for phenolic content. (a) Manhattan plot of GWAS results for phenolic content. The horizontal red line represents the significance threshold. Boxplot of the distribution of phenolic content measurements across the genotypes of the top SNPs on chromosomes (b) 15 and (c) 16, with a black line indicating the median phenolic content measurement for each genotype.
GWAS was then conducted for numerous other fruit quality and phenology traits, including harvest date (Julian date) across 811 accessions, juiciness (%) across 556 accessions, firmness at harvest (kg/cm2) across 808 accessions, firmness after storage (kg/cm2) across 508 accessions, change in SSC during storage (%) across 556 accessions and SSC after storage (°Brix) across 556 accessions. Variation at the NAC D5Y SNP was found to be significantly associated with all six of the mentioned fruit quality and phenology traits.
The SNP with the strongest association with harvest date was the D5Y SNP within the NAC18.1 gene (p = 3.24 × 10−46; Fig. 3a). There was an additional peak on chromosome 16, with the top SNP being Chr16:8852649 (p = 4.56 × 10⁻⁹). The D5Y SNP was also the top hit for juiciness, firmness at harvest, SSC during storage and SSC after storage (Fig. 3b, c, e, f). For firmness after storage, the top GWAS hit was found on chromosome 16 (Chr:16:9235229; p = 6.85 × 10⁻⁹), while the second most significant association was with D5Y (p = 1.05 × 10⁻⁸; Fig. 3d). We observed no significant associations for SSC at harvest (Supplemental Fig. S1). D5Y genotypes explained a significant amount of variation in harvest date (18.1%), juiciness (7.8%), firmness at harvest (11.9%), firmness after storage (6.1%), change in SSC during storage (13.3%) and SSC after storage (10.3%) (Supplemental Table S3).
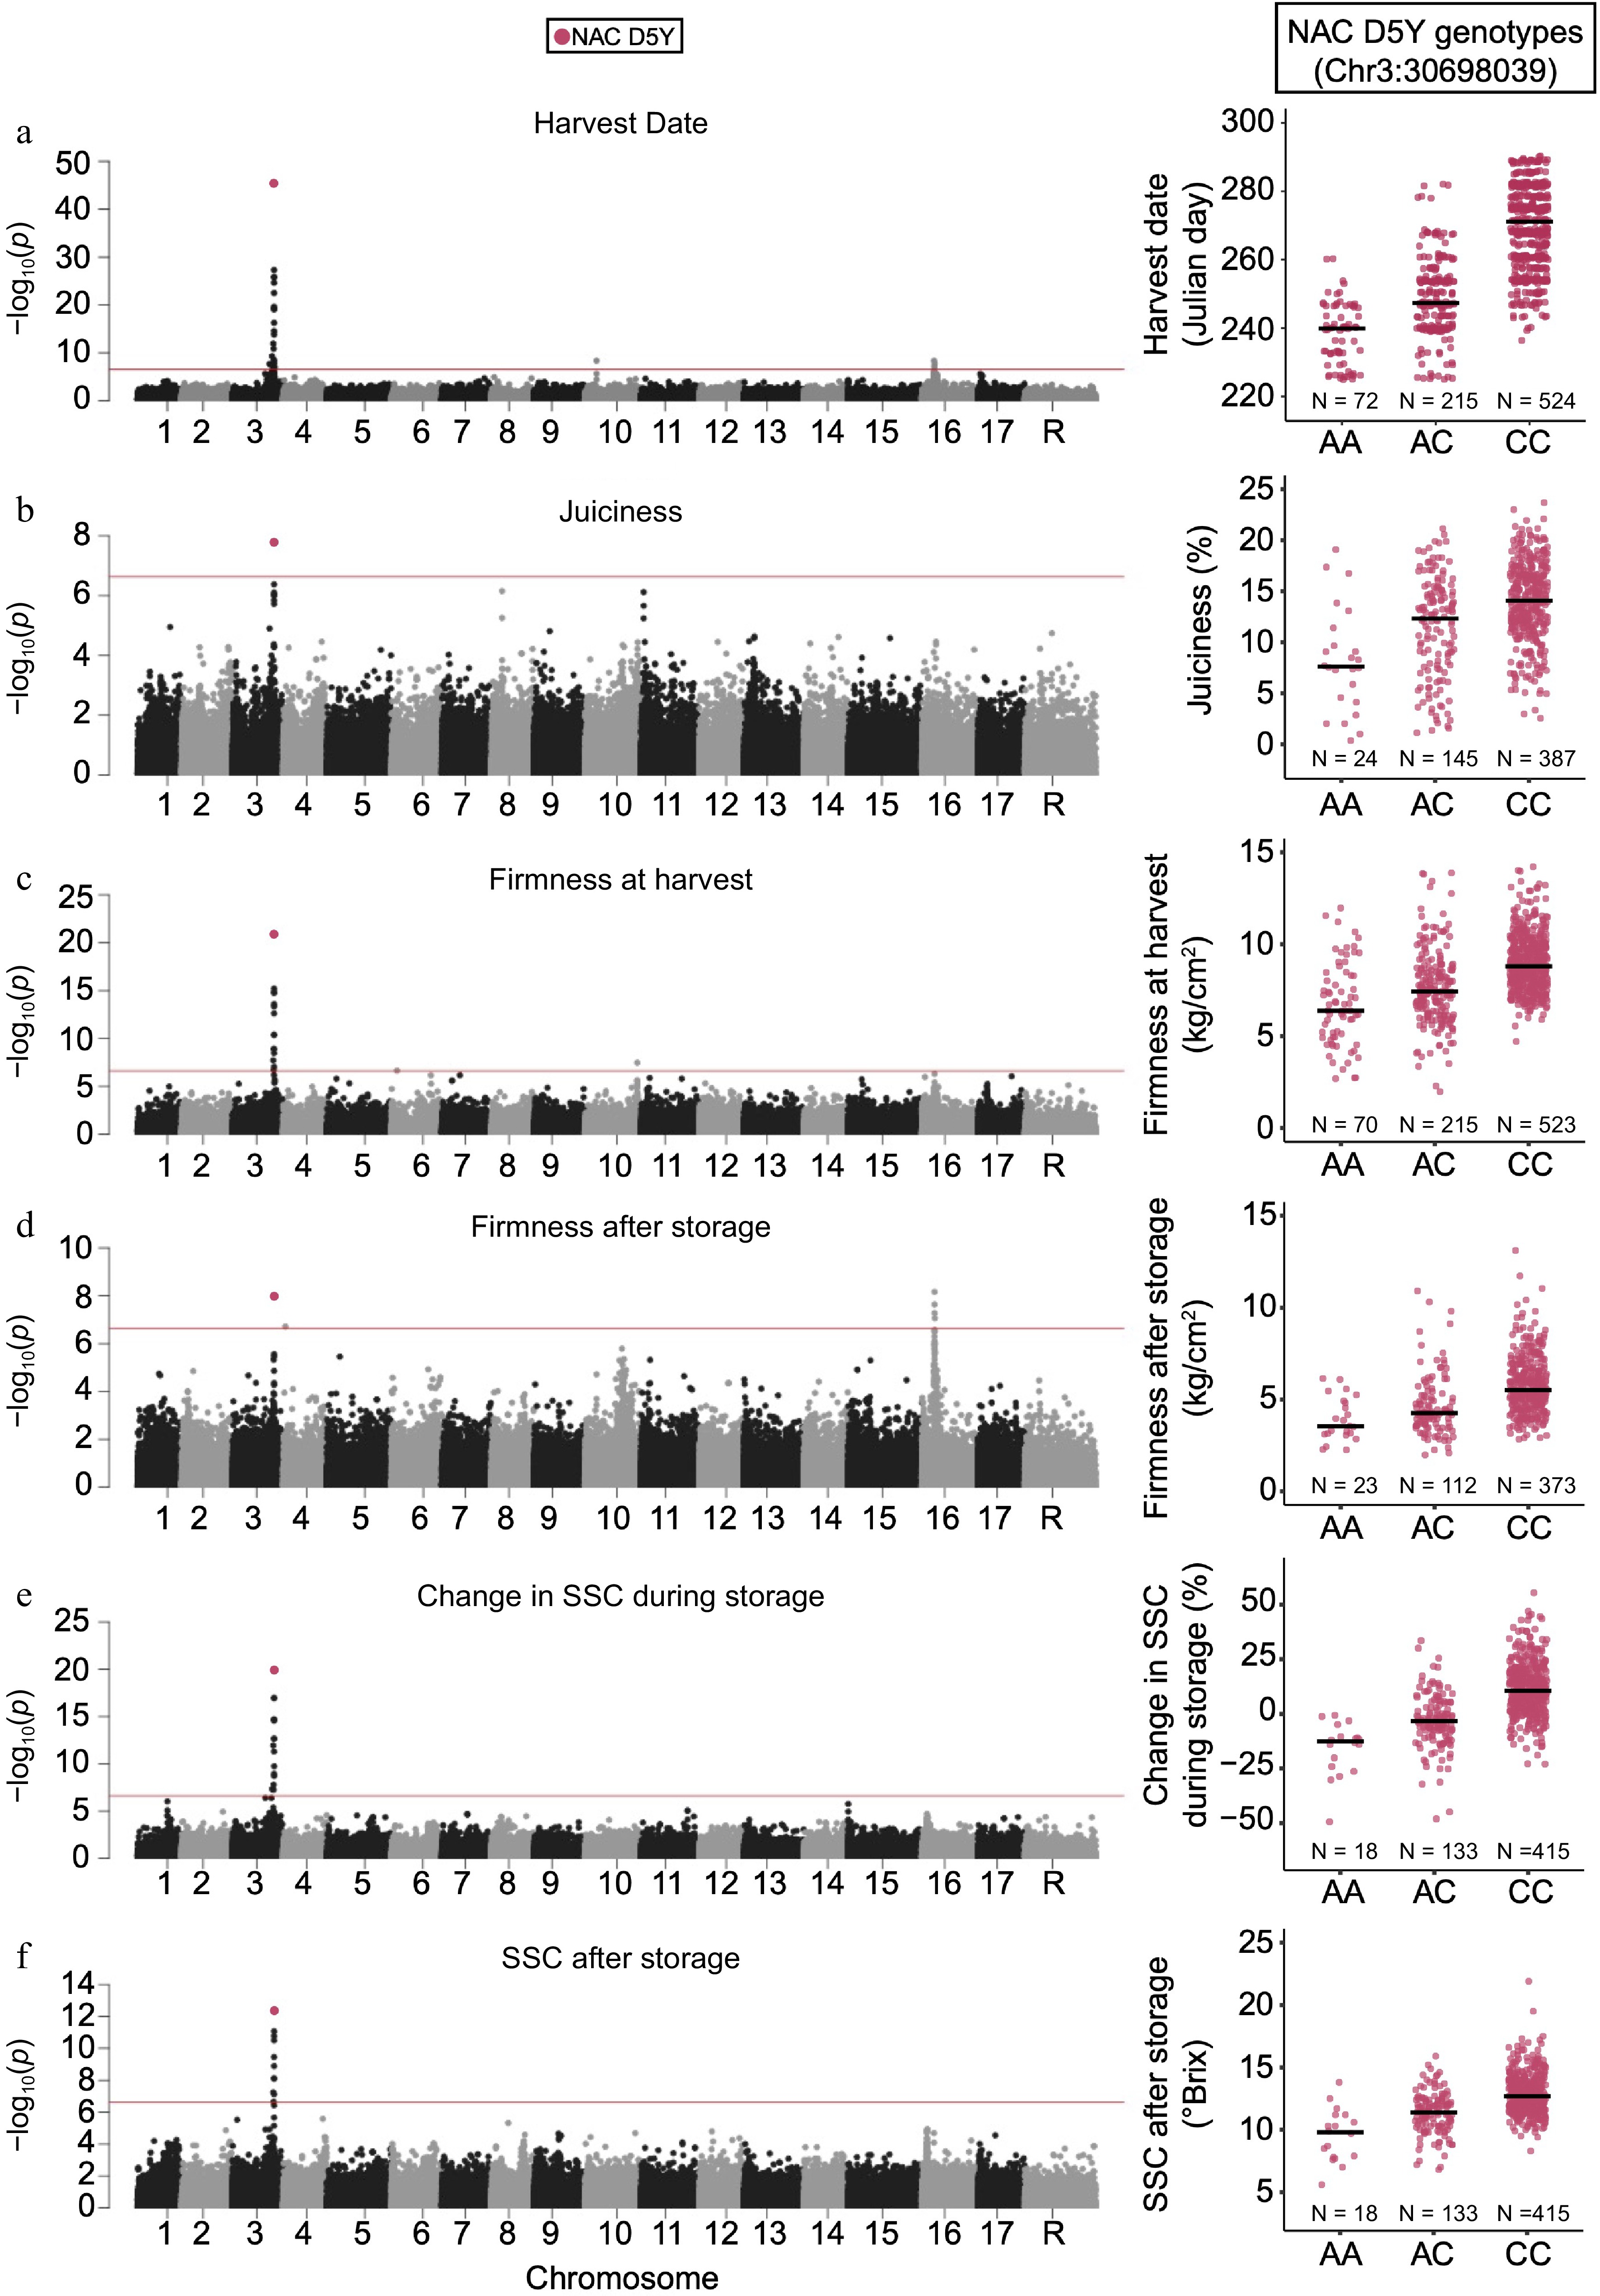
Figure 3.
Genome-wide association studies of ripening related traits. Manhattan plots of GWAS results for (a) harvest date, (b) juiciness, (c) firmness at harvest, (d) firmness after storage, (e) change in SSC during storage and (f) SSC after storage. The horizontal red lines in each Manhattan plot represent the significance threshold. The distributions of trait measurements across the NAC18.1 D5Y genotypes are also shown adjacent to each Manhattan plot with median values for each genotype indicated by a horizontal line.
Harvest date, which was the trait most strongly associated with D5Y, was also correlated with the other five traits associated with D5Y (Supplemental Fig. S2). We therefore re-ran the GWAS with harvest date as a covariate for all of the other phenotypes with significant hits at D5Y (Fig. 4). After accounting for variation in harvest date, D5Y remained the top SNP associated with firmness at harvest and change in SSC during storage, but was no longer significantly associated with juiciness, SSC after storage and firmness after storage (Fig. 4).
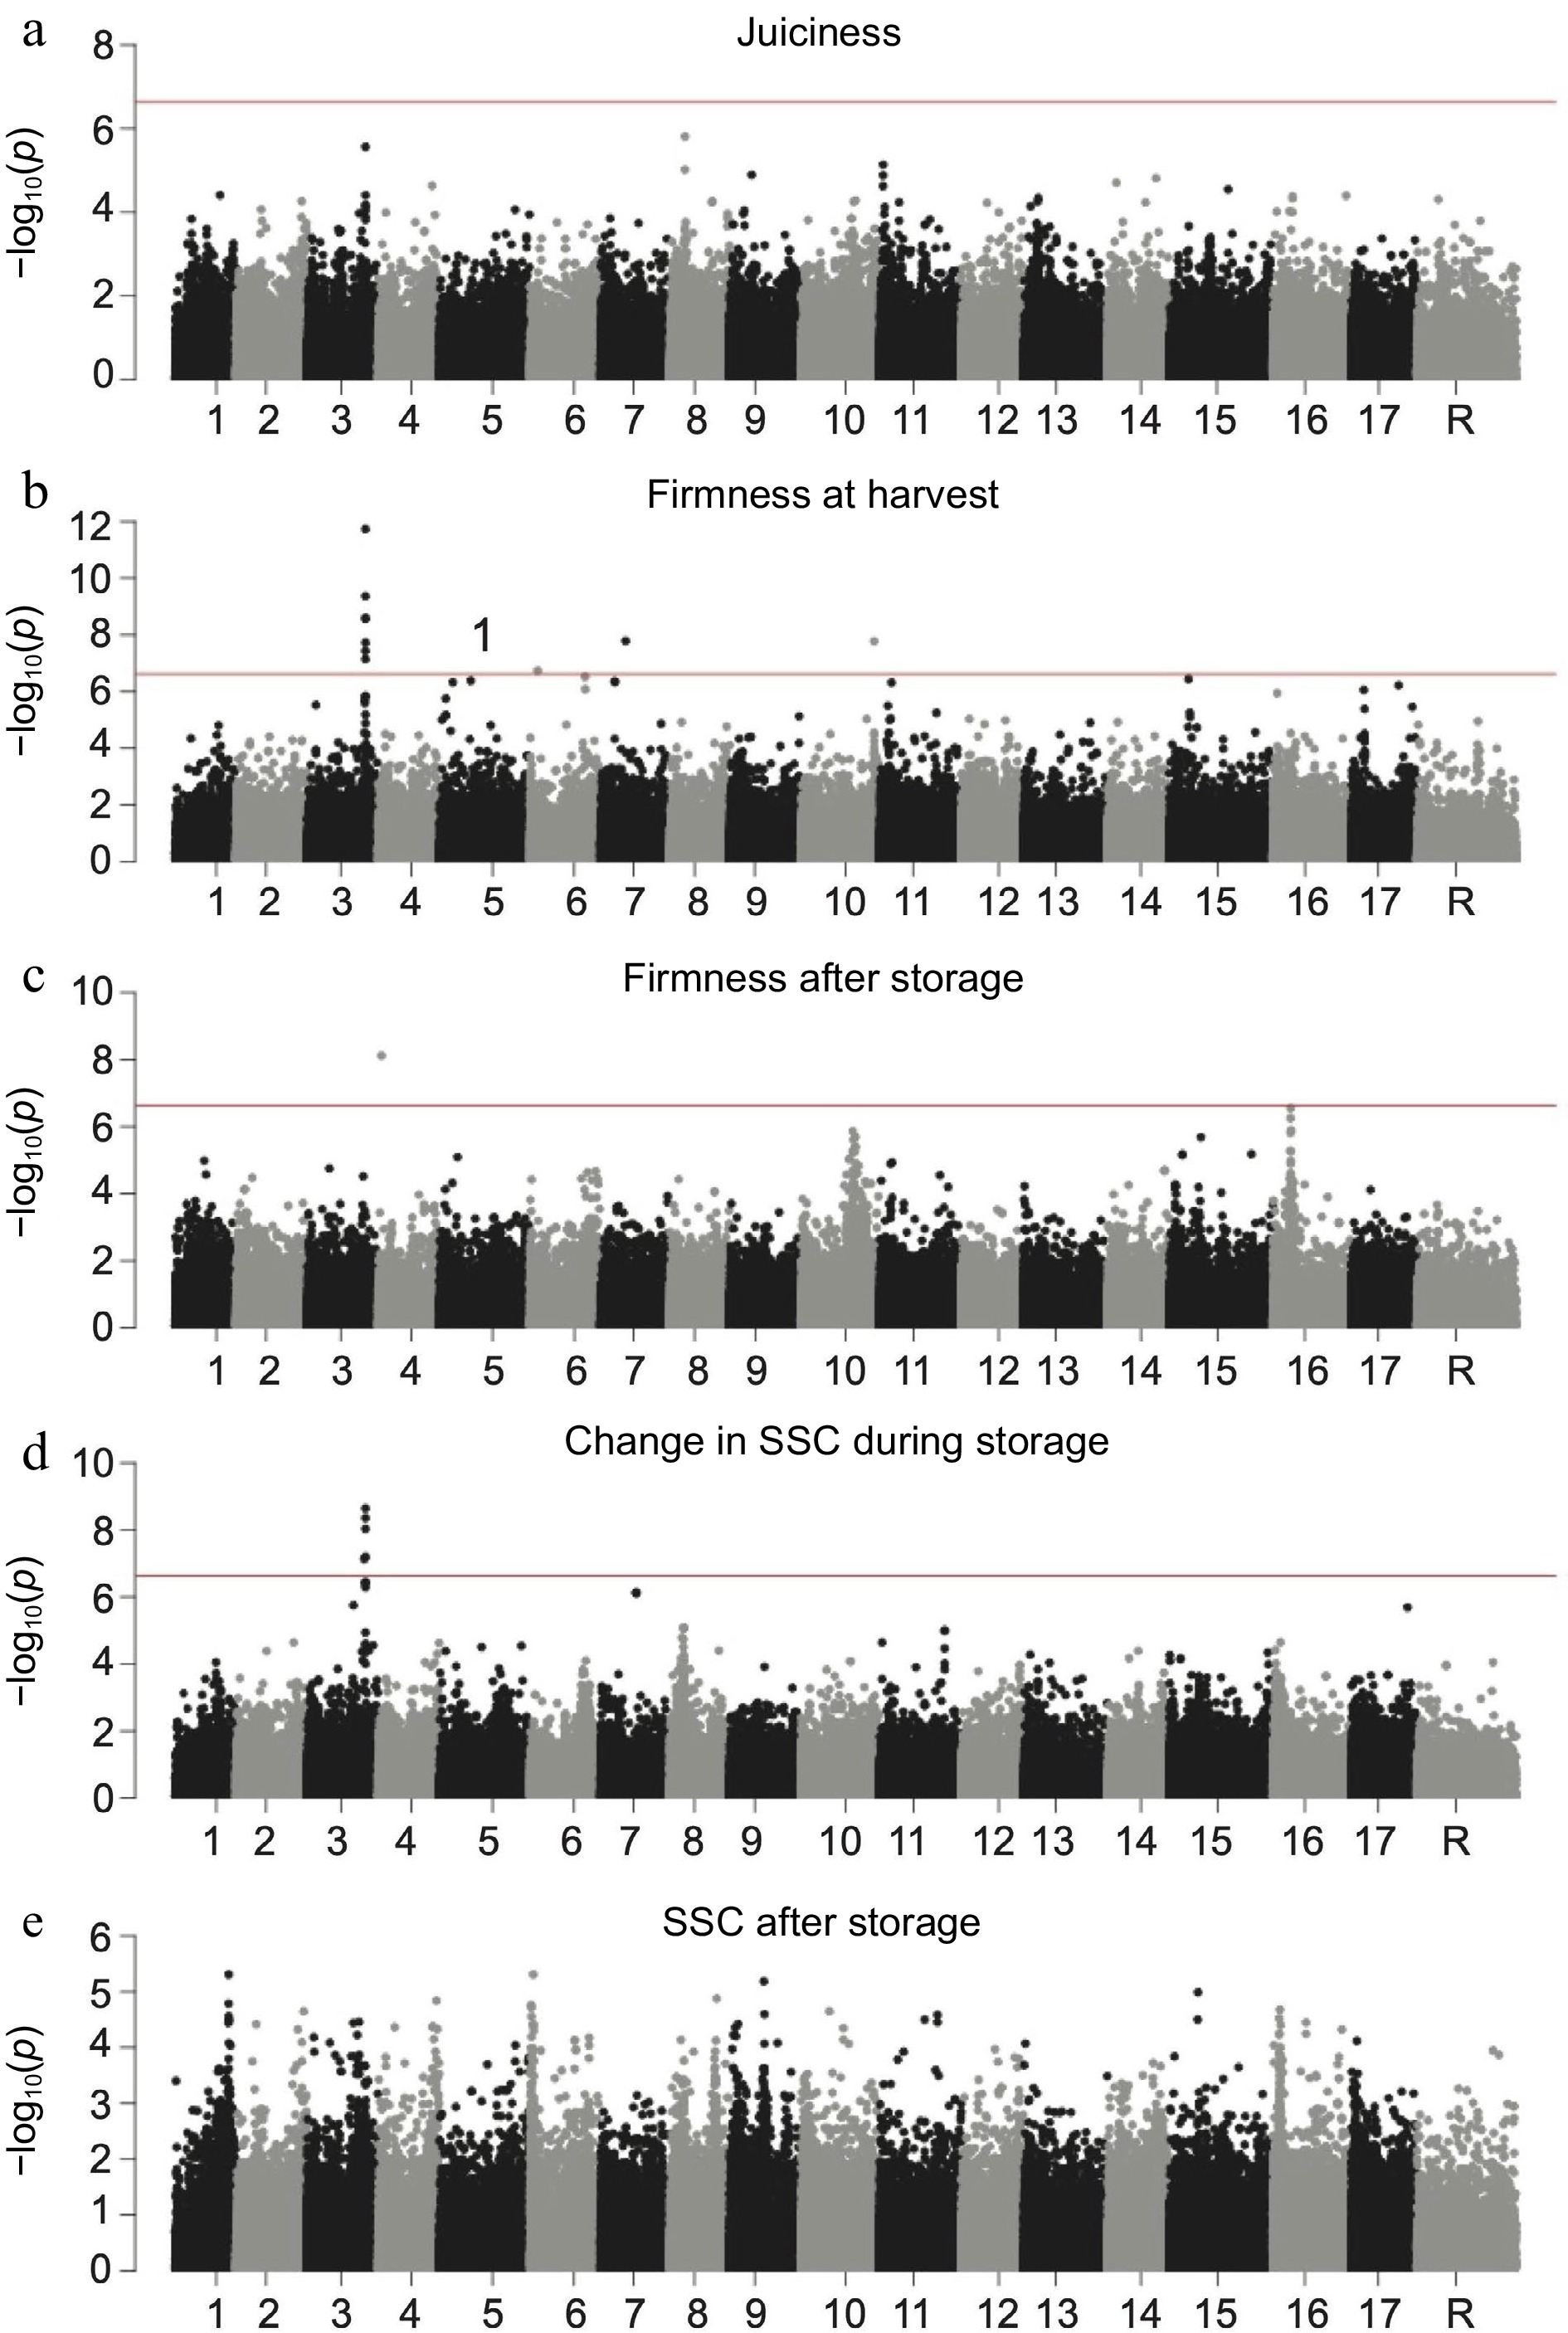
Figure 4.
Genome-wide association studies of ripening related traits with harvest include as a covariate. Manhattan plots of GWAS results for (a) juiciness, (b) firmness at harvest, (c) firmness after storage, (d) change in SSC during storage and (e) SSC after storage. The horizontal red lines in each Manhattan plot represent the significance threshold.
Given that apples are often consumed after undergoing a period of storage, sometimes up to a year, uncovering how fruit quality varies during storage periods is critical for breeding improved cultivars. During storage, apples tend to soften, leading to diminished fruit quality. Therefore, we then undertook GWAS for softening during storage to identify genetic regions associated with apple fruit softening. Softening in each accession was measured by calculating the percent difference between its firmness at harvest and it firmness after 3 month cold storage. GWAS for softening was conducted using phenotype data from 508 accessions.
The top SNP from the GWAS for softening during storage was Chr10:27438934 (p = 4.02 × 10⁻⁸) and it explained 7.3% of the phenotypic variation (Fig. 5a, Supplemental Table S3). The commonly used marker for apple softening, PG1 (Chr10:27285866), was not significantly associated with softening (p = 1.62 × 10⁻⁴) and was 153,068 bp downstream of the top GWAS hit observed here (Fig. 5b).
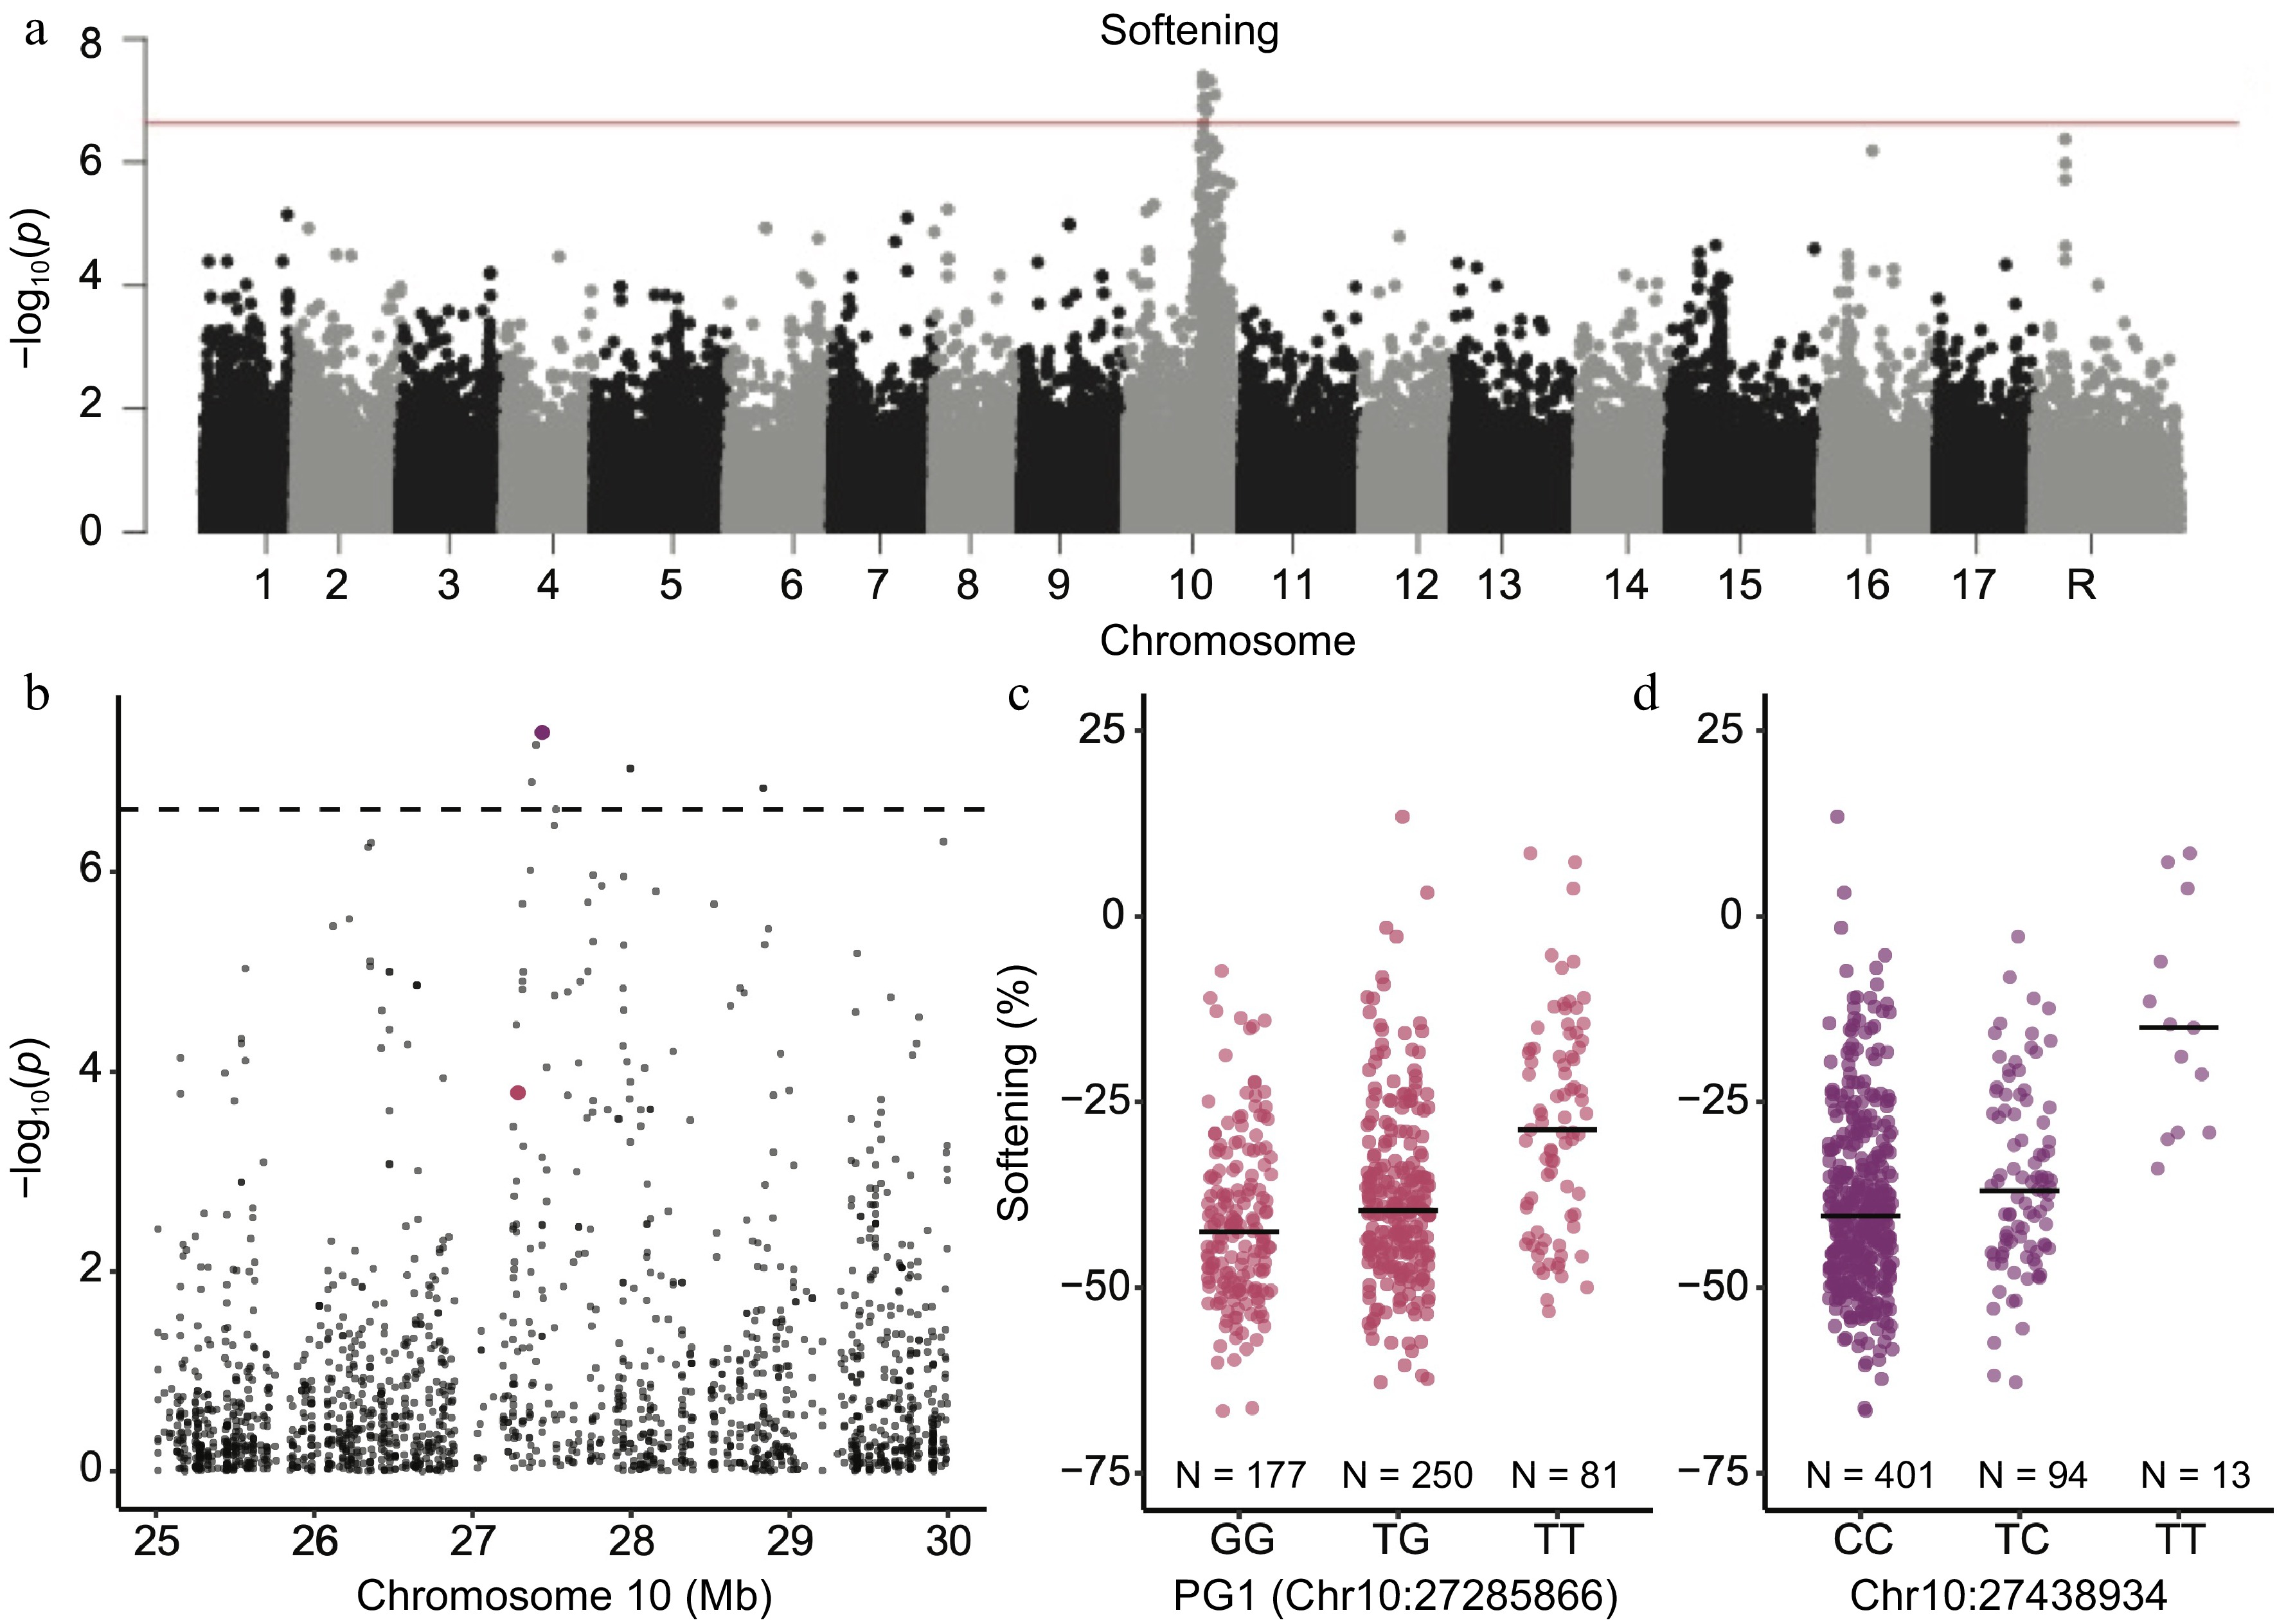
Figure 5.
Genome-wide association study for softening during storage. (a) Manhattan plot for a GWAS for softening during storage. The horizontal red line represents the significance threshold. (b) Manhattan plot showing only the genomic region around the GWAS peak from panel (a) on chromosome 10. The purple SNP is the most significant SNP associated with softening. The PG1 SNP is shown in pink. The horizontal dotted line represents the significance threshold. (c) Distributions of softening measurements across PG1 genotypes. (d) Distributions of softening measurements across genotypes of the most significant SNP from the GWAS. Horizontal black lines indicate the median value within each genotype.
We did not find any noteworthy associations with the other traits measured except for malic acid. The well-characterised SNP within the MA1 gene[33] was the most significant SNP from the GWAS for acidity at harvest (p = 1.97 × 10−40) and acidity after storage (p = 3.97 × 10¹⁹) (Supplemental Fig. S1).
The median SSC and firmness measurements, at harvest and after storage, were calculated across the three D5Y genotypes. D5Y genotype had no effect on softening during storage: all three genotypic classes experienced similar degrees of softening during storage. However, the at harvest and after storage firmness measurements did vary across the genotypic classes at D5Y. Accessions homozygous for the C allele at D5Y had the highest median firmness measurements both at harvest (8.8 kg/cm2) and after storage (5.5 kg/cm2) (Fig. 6a, Supplemental Table S4). The D5Y heterozygotes were slightly firmer at harvest (7.4 kg/cm2) and after storage (4.2 kg/cm2) compared to the AA homozygotes, which were the accessions with the lowest firmness measurements at harvest (6.4 kg/cm2) and after storage (3.5 kg/cm2) (Fig. 6a, Supplemental Table S4).
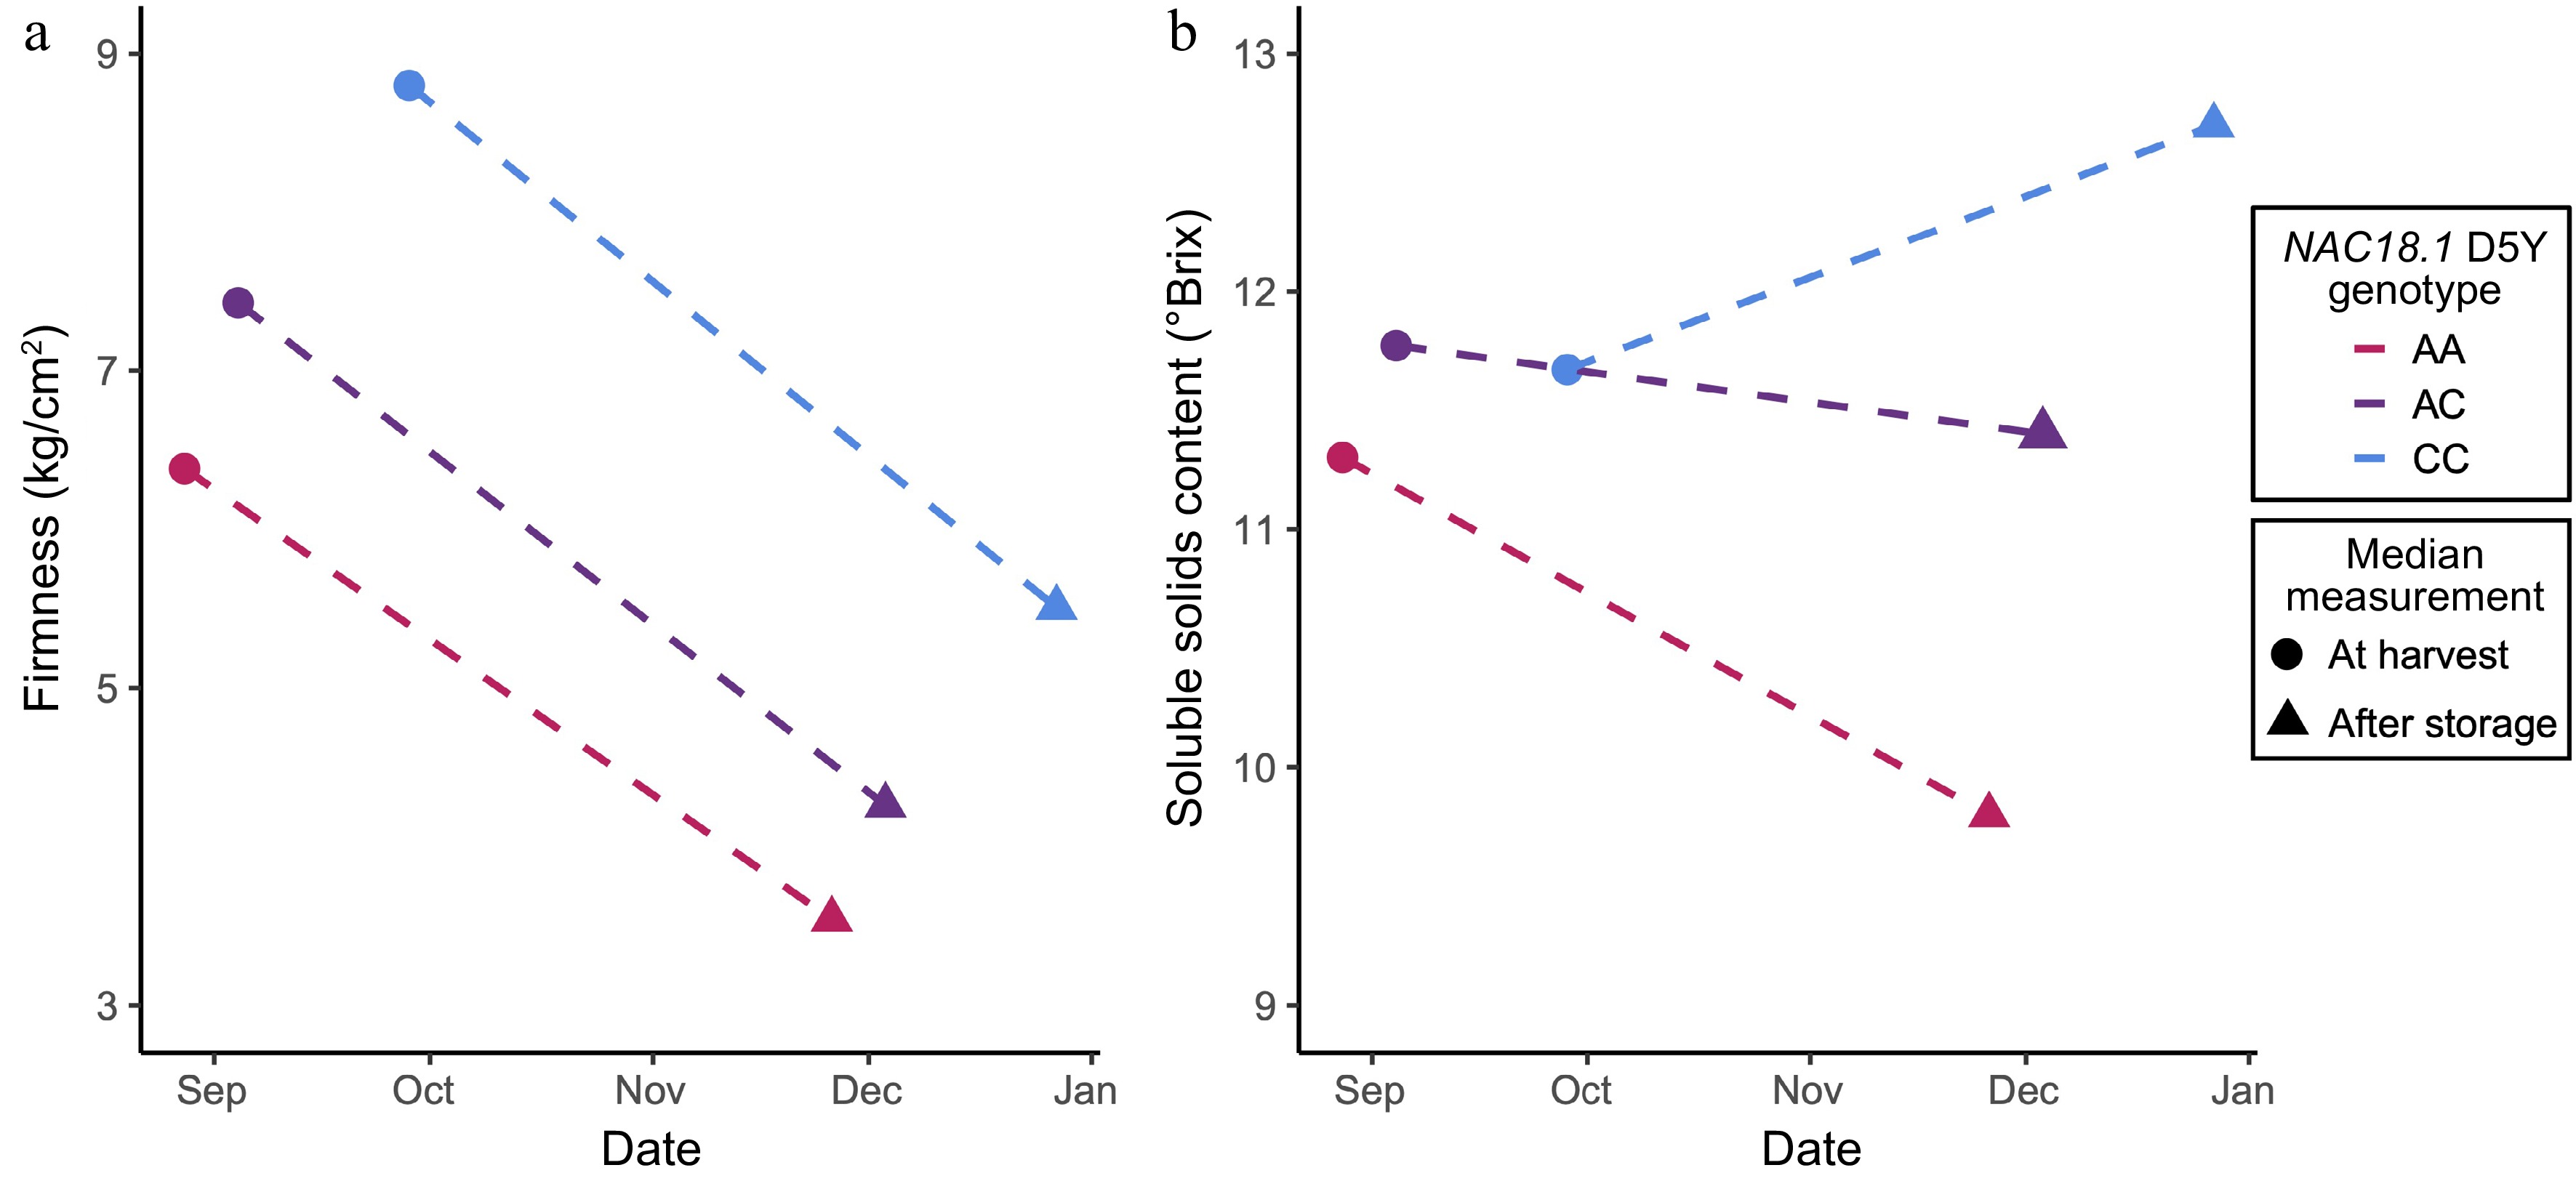
Figure 6.
A summary of the allelic effects of NAC18.1 D5Y genotypes on ripening phenotypes, both at harvest and after 3 months of cold storage. (a) Median measures of firmness at harvest and firmness after storage for apple accessions with different D5Y genotypes. (b) The median soluble solids content at harvest and after storage for apple accessions with different D5Y genotypes.
Accessions that were homozygous for the A allele or heterozygous for D5Y declined in SSC during storage (Fig. 6b). SSC decline was less severe, however, for D5Y heterozygotes compared to AA homozygotes, with median losses of 12.6% and 3.3% SSC, respectively (Supplemental Table S4). In contrast, accessions homozygous for the C allele at D5Y gained SSC during storage, with a median increase of 10.5% SSC (Supplemental Table S4).
-
The genetic structure of the ABC is strongly influenced by the inclusion of the apple's primary wild progenitor species, M. sieversii (Fig. 1). A recent study of the same collection studied here found that several phenotypes differ between the two species, and that domestication and breeding likely resulted in apples today that are larger, less acidic and less phenolic than their wild progenitors[34]. The use of wild progenitors in crop breeding is important because it can expand the phenotypic diversity available for cultivar improvement[35]. Wild relatives of domesticated crops may possess unique fruit quality and disease resistance traits, so the GWAS population studied here intentionally includes dozens of M. sieversii accessions to capture genetic and phenotypic diversity that may be unavailable within M. domestica. Figure 1 also shows that there is a correlation between population structure and harvest date, which has been previously reported in a similar apple population[36]. The correlation between population structure and harvest date likely reflects the fact that harvest date is a proxy for geographic ancestry, which is frequently a major determinant of population genetic structure[37]. Overall, our population genomic analysis suggests that the genetic structure of this apple population is primarily shaped by the inclusion of two different species and diverse cultivated germplasm that ripens over a considerable 65-day window.
Phenolic content is associated with loci on chromosome 15 and 16
-
From our GWAS, we identified two significant peaks associated with phenolic content on chromosomes 15 and 16 (Fig. 2). We did not identify any noteworthy candidate genes within 50 kb of the top hit on chromosome 15. However, within the 50 kb surrounding the top SNP on chromosome 16 is a bHLH protein gene and TCP family transcription factor gene which have been implicated in plant flavonoid biosynthesis (Supplemental Table S6)[38]. In apple, a bHLH transcription factor, MdbHLH3, has been shown to bind to promoters of anthocyanin genes under cold temperatures leading to anthocyanin accumulation[39]. Recently, MdTCP46 was found to promote anthocyanins biosynthesis under high light intensity in conjunction with MdMYB1[40]. Previous GWAS and linkage mapping studies have identified a QTL hotspot on chromosome 16 for polyphenols within which the leucoanthocyanidin reductase (LAR1) gene is located[3−5]. Despite the presence of markers in close proximity to the LAR1 gene within our GWAS SNP set, the top SNP on chromosome 16 from our GWAS was 1.8 Mb from LAR1.
We suspect that the inability to identify signals near previously reported QTLs for phenolics may be due to different methods for measuring phenolics that makes it challenging to compare results across studies. Here, total phenolic content was measured using the Folin–Ciocalteu assay (FCA) which uses a reduction reaction to estimate the total amount of phenolics and phenolic acids within a sample[41]. In contrast to chromatography methods, the FCA lacks specificity to distinguish among classes of phenolics and instead groups phenolic compounds into one total measurement[42]. The FCA can also reduce other compounds, such as sugars and ascorbic acid, thereby contributing to an inaccurate measurement of total phenolic content[1]. Despite the differences in methods used to measure phenolics, we identify signals on chromosome 15 and 16 associated with total phenolic content. Further work should include measurements of individual phenolic compounds using chromatography methods to discern the specific compounds driving the associations between phenolic content and the loci identified here.
NAC18.1 is major locus associated with multiple ripening traits
-
Apple ripening involves the coordination of various biochemical changes such as softening, aroma development, color change and carbohydrate metabolism that render the fruit ready for harvest[9]. Previous apple GWAS, across multiple germplasm collections, have identified strong signals near and within NAC18.1 for harvest date and firmness[20−22,36]. We observed a strong signal at the D5Y SNP within NAC18.1 for harvest date, juiciness, firmness at harvest, firmness after storage, SSC change during storage and SSC after storage. These observations suggest that the allelic effects at the NAC18.1 locus are highly pleiotropic.
Harvest date, the trait most strongly associated with variation at NAC18.1, was correlated with the other phenotypes that show a GWAS signal at NAC18.1, such as juiciness, SSC after storage, SSC change during storage, firmness at harvest and firmness after storage (Supplemental Fig. S2). We reasoned that the signal observed at NAC18.1 across other traits may be driven entirely by the effect of NAC18.1 on harvest date. After controlling for harvest date, however, the D5Y SNP in NAC18.1 was still the most significantly associated SNP with firmness at harvest and percent change in SSC during storage (Fig. 4). This suggests that variation at NAC18.1 independently affects multiple ripening related traits.
Allelic effects of NAC18.1 on ripening
-
A hallmark of apple ripening is the conversion of starch to sugar that signals fruit is ready to be picked[43]. Within a developing apple fruit, carbohydrates are converted to starch and stored within amyloplasts[44]. During the later stages of fruit maturation and at the onset of ripening, starch is degraded leading to an accumulation of sugar[43]. Studies examining total SSC have found associations on chromosomes 8 and 3[45−47]. While, other studies have uncovered significant associations for the individuals sugars, such as sucrose and fructose, with a locus on chromosome 1[21,48]. However, we did not identify any significant SNP associations with SSC, similar to[49]. Our inability to detect significant associations for sugar content could be due to low marker density surrounding key loci and differences in measurement of sugar content (individual sugars vs SSC). Future investigation of the genetic control of sugar content in apple will benefit from both improved genomic data and more precise measurement of individual sugars.
The degradation of starch continues once the fruit is picked and provides a source of carbohydrate for respiration and synthesis of aroma compounds and leads to an increase in sugar. Although we did not identify any significant SNPs associated with SSC at harvest, we did identify significant associations between D5Y and change in SSC during storage and SSC after storage. We observed a mostly co-dominant pattern for the effects of D5Y genotypes on SSC change during and after storage. During storage, accessions homozygous AA at D5Y lost the largest amount of soluble solids, heterozygotes lost slightly less, while accessions homozygous CC at D5Y gained soluble solids. We hypothesise that, although apples were harvested at similar SSC levels, accessions with an A allele at D5Y continue on an accelerated ripening path post-harvest. Once starch is converted to sugar, accessions on the accelerated ripening path metabolise available sugars in order to further fuel metabolic processes, leading to an observable decline in SSC during 3 months of cold storage. In contrast, we hypothesise that accessions that are homozygous CC at D5Y convert starch to sugars at a slower rate: during 3 months of storage, SSC gradually increases in these accessions as conversion of starch to sugar is still underway. Additionally, the demand for sugar substrates could be lower in the homozygous CC accessions compared to the homozygous AA accessions due to a lower demand of substrates for respiration, as has been suggested to occur in slow ripening peach accessions[50]. An evaluation of our proposed model can be performed in the future by measuring starch content and SSC through a pre-harvest and post-harvest time series.
In addition to changes in SSC, changes in texture are a key aspect of fruit ripening. We identified significant associations between genetic variation at NAC18.1 and firmness at harvest and firmness after storage (Fig. 3c, d). The early harvested AA genotypes at D5 were less firm than the late harvested CC genotypes. The association with firmness after storage is likely driven primarily by the correlation with firmness at harvest: a firm apple at harvest will be more firm after 3 months of storage than a soft apple at harvest. No significant association was identified between D5Y and softening, indicating that ethylene-mediated post-harvest softening likely occurs independently of genetic variation at the NAC18.1 locus (Fig. 5). This is consistent with previous observations that NAC18.1 transcript levels were affected neither by exposure to ethylene, nor to an ethylene inhibitor, 1-MCP[19]. Thus, our observations suggest that alleles at NAC18.1 mediate apple firmness via an ethylene independent on-tree ripening program rather than a post-harvest, ethylene-dependent softening mechanism.
In addition to the critical role of NAC18.1 variants in determining firmness, we found that genetic variation on chromosome 10 mediated the degree to which apples softened during storage (Fig. 5). Previous studies have also identified significant associations between firmness and markers on chromosome 10, most of which suggest that the signal arises from variants at the polygalacturonase (PG1) gene, whose expression is ethylene-dependent[51,52]. A functional marker for PG1 has been developed and employed in breeding to predict softening, and this PG1 marker was genotyped and included in our GWAS[15,16,32]. We did not find a significant association between softening and the PG1 marker. Nor did we find significant associations with markers in the ACO1 and ACS1 genes used to predict firmness, consistent with recent work questioning the utility of these markers across diverse germplasm[19]. Our top SNP for softening, Chr10:27438934, was located 153 kb downstream of PG1 while results from a recent pooled-sequencing GWAS identified a signal upstream of PG1 for softening[53]. Overall, these results suggest that functional genetic variants affecting softening on chromosome 10 may lie in long-range regulatory elements affecting the PG1 expression as hypothesised by[52].
Although ACO1, ACS1, and PG1 have been extensively validated as key genes involved in controlling aspects of apple ripening, our observations suggest that NAC18.1 may be a high-level regulator orchestrating the overall tempo of ripening. Lü et al. proposed a model for peach ripening where a NAC TF impacts a cascade of ripening traits by binding to the promoters of important ripening genes, such as ACO1 and ACS1[8]. In a slow ripening peach cultivar, it has been suggested that the ripening cascade is disrupted by loss-of-function deletions in two NAC TFs[50,54]. Given these observations in peach, we hypothesise that genetic variation at NAC18.1 in apple affects transcriptional regulation of its downstream targets and thereby modulates both firmness related traits and SSC. We suggest that NAC18.1 functions as a ripening 'throttle', and alleles of NAC18.1 differentially control the timing of ripening and rate at which an apple moves through the biochemical changes associated with ripening. Accessions that are homozygous AA at the NAC18.1 D5Y SNP are 'rapid ripeners' as they move through the stages of ripening at a faster pace than their homozygous CC counterparts, the 'slow ripeners'. Heterozygous accessions fall between these two extremes, suggesting a predominantly co-dominant model of inheritance at this locus (Fig. 6a). The rapid ripeners tend to be harvested earlier in the season, are softer at harvest and post-storage, lose SSC during storage and have lower levels of SSC post-storage compared to the slow ripeners. Here we demonstrated that genetic variation at NAC18.1 is correlated with variation in multiple ripening related traits, however the mechanism by which this variation affects these traits remains unknown. Although the D5Y may be considered a putatively causal NAC18.1 variant, recent results suggest that it is more likely mutations in the promoter region of NAC18.1 that mediate ripening[53]. This suggests that our GWAS signal at NAC18.1 arises because of cis-regulatory variation affecting NAC expression, which subsequently impacts the expression of downstream target genes that mediate the ripening process. Future work will include an exhaustive search for genetic elements impacting the expression of NAC18.1 using whole-genome sequencing of this diverse collection of apples. In addition, the downstream genomic target(s) of NAC18.1 must be identified in order to fully elucidate NAC18.1's role in the apple ripening process.
Although NAC18.1 clearly stood out in the present work as a large effect locus for ripening traits, it is likely that other loci also contribute to variation in ripening traits. As demonstrated in other GWAS studies[55], it is possible we could be missing associations with loci of small effect due to the way in which mixed model association analyses correct for population structure and relatedness. This is particularly applicable here since harvest date is strongly associated with population structure (Fig. 1a, c). In addition to the signal at DY5, we uncovered a significant, albeit weaker, signal on chromosome 16 for harvest date and firmness after storage (Fig. 3a, d). The top SNP for harvest date was at Chr16:8852649 (p = 4.56 × 10⁻⁹) and the top SNP for firmness after storage was 383 kb away at Chr16:9235229 (p = 4.56 × 10⁻⁹). Previous GWAS studies have identified significant associations for harvest date and fruit firmness on chromosome 16 that co-locate to the same region of chromosome 16 that we identified here[20,47,56]. To date, the involvement of the chromosome 16 locus on harvest date and firmness traits remains undefined and should be further examined along with other small effect loci that could be impacting in ripening traits.
Identifying both large and small effect loci impacting key traits is especially important for breeding purposes. Although NAC18.1 appears to be a large effect locus impacting apple ripening, there are two important considerations for targeting this locus with MAS for breeding improved cultivars. The first concern is the allele frequencies at D5Y SNP across existing elite apple germplasm. A study of the apples used here showed that 66% of accessions, including the majority of elite commercial cultivars, are homozygous for the late-ripening C allele at D5Y, and this desirable allele may have been selected for by generations of apple breeders[19]. Therefore, the genomics-assisted improvement of firmness across elite germplasm will likely require the identification of additional loci that are not already fixed within elite germplasm. The second consideration is the pleiotropic nature of the NAC18.1 locus. For example, harvest date is strongly correlated with firmness at harvest. Therefore, the development of an earlier ripening cultivar by selecting for the early A allele at D5Y will likely lead to unfavourable changes such as softer fruit at harvest. The fixation of the favourable alleles at NAC18.1 across elite germplasm and the pleiotropic effects of the NAC18.1 locus further emboldens the search for additional loci involved in controlling ripening traits.
Here, we confirmed previous associations between genetic loci and ripening related traits, and identified new variants associated with polyphenol content and softening. Uncovering the causal genetic variant(s) controlling variation across key fruit quality and phenology traits in apple requires improved genetic mapping resolution. Future work should incorporate whole-genome sequence data of large samples in order to increase the resolution necessary to move beyond the development of genetic markers for MAS and towards the identification of causal alleles. Given the importance of health compounds, fruit texture and ripening traits both for production management and fruit quality, there is value in continuing to pursue a comprehensive characterization of the genetic variation underlying commercially relevant traits in apple.
-
The phenotype data were collected from 1,1119 accessions in the ABC and are described in[31]. These traits included phenology traits such as flowering time, harvest date, time to ripen and precocity. The fruit quality traits measured at harvest included titratable acidity (g/L malic acid), soluble solids content (SSC) (°Brix), firmness (kg/cm2), weight (g), total phenolic content (μmol/g) and juiciness (%). In addition, acidity, SSC, firmness and weight were also measured after 3 months of cold storage and the percent change in these phenotypes during storage were calculated. Apple accessions from the ABC were also classified based on their reported species (M. domestica or M. sieversii), release year, primary end use (cider or dessert) and country of origin.
Genetic data
-
The apple accessions in the ABC were genotyped using genotyping-by-sequencing (GBS)[57] and the methods and resulting genetic data were recently published[32]. In short, DNA from young leaf tissue was extracted from accessions in the ABC and then GBS libraries were prepared using two restriction enzymes and libraries were then sequenced using Illumina Hi-Seq 2000. The final SNP set after imputation and pooling across SNP callers was 278,231 SNPs from 1,175 unique accessions[32]. An additional eight markers were genotyped using high resolution melting (HRM) and were added to the SNP set using the --merge function in PLINK[58]. The HRM markers included Ma1 for acidity[33] and three markers for scab resistance, Rvi2, Rvi6, Rv15[59]. In addition, four texture markers were genotyped with HRM, these included PG1, ACO1, ACS1 and NAC18.1 as described previously[19]. The HRM genotype call for NAC18.1 was retained, while the GBS SNP for NAC18.1 was removed using PLINK. The final SNP set from Migicovsky et al.[32] included 278,231 SNPs from 1,175 accessions and the data can be found Dryad:
https://datadryad.org/stash/dataset/doi:10.5061/dryad.zkh1893cd .The final SNP set was filtered to only include the 1,054 accessions which had data for at least one phenotype[31]. SNPs with heterozygosity > 90% and a minor allele frequency < 0.01 were removed, resulting in a final SNP set of 260,399 SNPs across 1,054 apple accessions. All filtering steps were performed using PLINK[58].
Principal component analysis
-
For principal component analysis (PCA), only SNPs anchored to an assembled chromosome were considered and LD pruning was then performed using PLINK (-indep-pairwise 10 3 0.5)[58], resulting in 164,992 SNPs that were used to perform PCA in TASSEL (version 5.0). The correlation of PC1 values with harvest date was calculated in R using 'cor.test' and p-values were multiple test corrected with a Bonferroni correction. Wilcoxon test statistics of the comparison of PC2 values across M. domestica and M. sieversii were calculated in R using the 'wilcox.test' function.
Genome-wide association studies
-
Watts et al. measured phenotype data from 2014−2017, however, the GWAS performed here were only conducted on trait data from 2017 due to the larger sample sizes, unless the trait data was only collected in 2016[31]. This resulted in analysis of 21 of the 39 traits from Watts et al. (Supplemental Table S10). Since sample sizes varied across traits, the genotype data was filtered for each trait to include only accessions with measurements for that particular trait, then filtered for MAF of 0.01, resulting in 21 genotype files. For each trait's filtered genotype file, kinship matrices and PCA were run using TASSEL (version 5.0). GWAS was then run using the 'mlmm' R package[60]. We present GWAS results from the single-locus model where no SNPs are included as cofactors (equivalent to a mixed-linear model GWAS). Kinship matrices and the first 5 PCs were used to account for relatedness. Quantile–quantile plots were created using the 'qqman' package in R[61]. Manhattan plots for the 21 phenotypes were plotted using the 'mlmm' package and are available in Supplemental Fig. S1. However, the Manhattan plots presented in the main manuscript (Figs 2−4) were plotted using the 'qqman' package in R[61]. All unassembled contigs were concatenated into a single chromosome labeled 'R' throughout the manuscript. The effective number of independent tests (Meff) was calculated to be 211,156 based on the 260,399 SNP set using the 'simpleM' package in R[62,63]. The Meff value was then used to calculate the threshold for significance for all GWAS using -log(α/Meff), where α = 0.05.
Jitter plots of the distribution of trait measurements across the genotype classes of top GWAS SNP hits were visualized using the 'ggplot' package in R. Gene annotations from the GDDH genome were retrieved for regions within 50 kilobases of either side of the top GWAS hits (Supplemental Tables S5−S9). The distribution of trait measurements across the genotypes of the SNPs of interest from the GWAS were visualized using the 'ggplot'. Pearson correlation tests between phenotypes were run and visualized using the 'ggpairs' function from the GGally R package[64]. The variation explained by the top SNPs from the GWAS was calculated by subtracting the R2 from a linear model with only the top 5 PCs included as explanatory variables from the R2 from a linear model including the top 5 PCs and the top GWAS SNP as explanatory variables. The difference in R2 between the two models was reported as the variance of a trait explained by a particular SNP.
-
The authors confirm contribution to the paper as follows: study conception and design: Myles S, Migicovsky Z, Watts S; data collection: Watts S, Migicovsky Z; analysis and interpretation of results: Watts S; draft manuscript preparation: Watts S, Migicovsky Z, Myles S. All authors reviewed the results and approved the final version of the manuscript.
-
All code used for analyses are available through GitHub at github.com/MylesLab/gwas-abc. Raw sequence data is available on the NCBI short read archive (BioProject:
www.ncbi.nlm.nih.gov/bioproject/PRJNA636391 ). Sophie Watts was supported by funding from a Vanier Scholarship from the National Sciences and Engineering Research Council of Canada. Zoë Migicovsky was supported by funding from the Canada Research Chairs program. The authors gratefully acknowledge the Nova Scotia Fruit Growers' Association and the Farm Services team at AAFC-Kentville for establishing and maintaining the apple trees studied here.
-
The authors declare that they have no conflict of interest. Zoë Migicovsky is the Editorial Board member of Fruit Research who was blinded from reviewing or making decisions on the manuscript. The article was subject to the journal's standard procedures, with peer-review handled independently of this Editorial Board member and the research groups.
- Supplemental Table S1 Results from Pearson correlations between PC1 values and trait measurements.
- Supplemental Table S2 Results from Pearson correlations between PC2 values and trait measurements.
- Supplemental Table S3 Variation explained by the top SNPs from GWAS.
- Supplemental Table S4 Median values for trait measurements across the NAC18.1 genotypes.
- Supplemental Table S5 Gene annotations within 50 kilobases surrounding Chr15:3806070.
- Supplemental Table S6 Gene annotations within 50 kilobases surrounding Chr16:5256210.
- Supplemental Table S7 Gene annotations within 50 kilobases surrounding NAC18.1 (Chr3:30698039).
- Supplemental Table S8 Gene annotations within 50 kilobases surrounding Chr10:27438934.
- Supplemental Table S9 Gene annotations within 50 kilobases surrounding Chr:16:9235229.
- Supplemental Table S10 Trait data for 21 fruit quality and phenology traits measured in Watts et al.
- Supplemental Fig. S1 Manhattan plots and QQ-plots for the 21 fruit quality and phenology traits. The horizontal grey lines in each Manhattan plot represent the significance threshold.
- Supplemental Fig. S2 Correlation plots for phenology and frui quality traits. Boxes shaded in blue indicate significant Pearson correlations (p < 0.001). Histograms of trait distributions shown along the diagonal.
- Copyright: © 2023 by the author(s). Published by Maximum Academic Press, Fayetteville, GA. This article is an open access article distributed under Creative Commons Attribution License (CC BY 4.0), visit https://creativecommons.org/licenses/by/4.0/.
-
About this article
Cite this article
Watts S, Migicovsky Z, Myles S. 2023. Large-scale apple GWAS reveals NAC18.1 as a master regulator of ripening traits. Fruit Research 3:32 doi: 10.48130/FruRes-2023-0032 

Large-scale apple GWAS reveals NAC18.1 as a master regulator of ripening traits
- Received: 06 May 2023
- Accepted: 30 August 2023
- Published online: 09 November 2023
Abstract: Apple quality traits such as fruit texture, sugar content, and firmness retention during storage are key targets for breeders. Understanding the genetic control of fruit quality traits can enable the development of genetic markers, useful for marker-assisted breeding of new apple cultivars. We made use of over 260,000 single nucleotide polymorphisms (SNPs) genotyped across 1,054 apple accessions from Canada's Apple Biodiversity Collection to perform genome-wide association for 21 fruit quality and phenology traits. We identified two loci on chromosome 15 and 16 associated with phenolic content and a locus on chromosome 10 associated with softening. In addition, we determined that allelic variation at the NAC18.1 transcription factor was associated with numerous traits including harvest date, firmness at harvest, and firmness after storage. Our analyses suggest that NAC18.1 independently acts as a high level regulator of multiple ripening related traits and we propose a model for the allelic effects at NAC18.1 on apple ripening and softening.
-
Key words:
- Genomics /
- Horticulture /
- Genetic mapping