


-
Bermudagrass (Cynodon (L.) Rich) is native to Africa but occurs throughout the world in tropical to warm temperate climates between the latitudes of 45 degrees north and 45 degrees south[1]. Of the approximately 10 species within this genus, the growth characteristics of common bermudagrass (Cynodon dactylon) have promoted its use across a wide range of landscapes. Common bermudagrass (referred to as bermudagrass) possesses strong and aggressive stolons and rhizomes, is resistant to weed encroachment, exhibits good drought and traffic tolerance, and recuperates quickly. These traits make bermudagrass a popular warm-season turfgrass that is used extensively on golf courses, home lawns, and athletic fields in warm climates[2,3]. For all of its benefits, one major inferiority of bermudagrass is its relative intolerance to shade when compared with other warm-season turfgrasses such as St. Augustinegrass (Stenotaphrum secundatum), zoysiagrass (Zoysia sp.), and centipede grass (Eremochloa ophiuroides)[4]. Persistent shade cast by tall buildings, trees, and roofed sports venues are common sources of shade stress in urban environments that negatively impact turfgrass growth, texture, persistence, and aesthetics. Bermudagrass is particularly sensitive to the poor quality and short duration of light in this environment. Improvement of shade tolerance in bermudagrass is an ongoing process that is of critical importance to the turf industry.
Many studies have demonstrated that significant variation in shade tolerance exists among turfgrass species[3,5−13]. For example, the bermudagrass cultivar of 'No-Mow' exhibits higher tolerance to low light intensity than the bermudagrass cultivar of 'T-135'[5]. Likewise, the seashore paspalum cultivar of 'Sea Isle 1' reflected better turf quality, color, and density than hybrid bermudagrasses under 70 and 90% low light treatment[8]. Some studies revealed that shade can reduce the shoot growth of turfgrass indicating that vertical shoot growth rate could provide a useful measure of shade adaptation[14]. Shade reduces light intensity, resulting in anatomical, physiological, and morphological changes in turfgrasses[14,15]. Turf quality, color, density, canopy photosynthetic rate, and spectral reflectance all decline in bermudagrass exposed to 70% and 90% shade[16]. This variability in physiological, morphological, and anatomical responses to shade provides an opportunity to select cultivars with superior turf performance under light deficiency[8].
Shade tolerance mechanisms have been studied in many different turfgrass species[14,15,17−19]. Turfgrasses adapt to shade by altering their anatomy, morphology, and physiology. These adaptations include fewer chloroplasts, thinning of the cuticle layer, more upright growth and elongation of leaves, fewer tillers, reduced shoot density, shorter roots, lower photosynthetic rate, and reduced biomass[16]. In one study, a cultivar with shorter stems and prostrate growth was more tolerant to shade than a cultivar with longer stems and more upright growth[5]. Tan & Qian found that increased shoot growth and leaf elongation under shaded conditions was due to increased levels of gibberellic acid[18]. Production of the reactive oxygen species (ROS) O2·– and H2O2 is higher in turfgrass cells exposed to shade[15]. In addition to ROS, chlorophyll fluorescence parameters reflected photosynthetic activity of plants which induced by shade stress[14]. Thus, these parameters were another useful indicator that can be quantified to select for in shade-tolerant turfgrass cultivars[14].
Although many studies have investigated shade tolerance in bermudagrass, little is known about the shade tolerance of native bermudagrass cultivars in China where bermudagrass is commonly used in the tropical and subtropical regions south of the Yellow River[20]. Information on shade tolerance attributes of native bermudagrass in China would be valuable for extending its application both indoor and outdoor worldwide. In this study, two cultivars of bermudagrass with contrasting growth phenotypes, Yangjiang (Cynodon dactylon Yangjiang) and Guanzhong (Cynodon dactylon Guanzhong), were subjected to shade stress to compare their tolerance. Yangjiang exhibits more prostrate shoots that grow closer to the soil surface whereas Guanzhong has more upright shoots that grow away from the soil surface (Fig. 1). Moreover, Yangjiang originated in Yangjiang city Guanzhong province, belonging to subtropical region, where the climate is rainy and hot. While Guanzhong produced from Guanzhong area, Shaanxi province, belonging to temperate region, where the weather is arid. This study aimed to compare the response of Yangjiang and Guanzhong to shade by assessing turf quality, color, growth characteristics, physiology, and leaf anatomy. We hypothesized that the prostrate growth of Yangjiang provides better shade tolerance than the upright growth of Guanzhong.

Figure 1.
Comparison of shoot growth and leaf anatomy between bermudagrass cultivars Yangjiang and Guanzhong. (a) Yangjiang exhibits more prostrate shoot growth whereas (b) Guanzhong exhibits more upright shoot growth. The leaves of Yangjiang have (c) no trichomes, whereas Guanzhong leaves have (d) many trichomes.
-
Changes in TQ and TCI of Guanzhong and Yangjiang turfgrasses were monitored under multiple shade intensities over time (Table 1). No significant differences in TQ and TCI at any shade intensity were observed in Yangjiang after five days (d) of shade exposure compared to CK, but significant decreases were observed in Guanzhong. Obviously, with the increased shading treatment levels and days, the TQ and TCI in Guanzhong decreased significantly compared with that in Yangjiang. After 20 d of shade exposure, TQ and TCI of Yangjiang were only significantly different from the control under 90.6% shade but were still above a score of 6 that was still higher than the minimal acceptable quality. However, the TQ and TCI scores for Guanzhong declined below an acceptable value of 5 in 61.2% and 90.6% shade. After 35 and 50 d of shade exposure, TQ and TCI scores exhibited a continued decline in both cultivars under 61.2% and 90.6% shade. In comparison with Guanzhong, the TQ and TCI scores for Yangjiang after 50 d of 90.6% shade exposure never fell below 5. Thus, Yangjiang clearly maintains better TQ and TCI under prolonged and intense shade compared with Guanzhong.
Table 1. Effects of shade on turf quality (TQ) and turf color intensity (TCI) of Guanzhong and Yangjiang.
Cultivars Shading level (%) 5 d 20 d 35 d 50 d TCI TQ TCI TQ TCI TQ TCI TQ Guanzhong CK 7.2bc 8.2b 7.0c 8.5a 7.1b 8.5a 7.1bc 8.2b 30.4 7.3ab 8.3b 7.1bc 8.0b 7.2ab 7.9b 7.0c 7.7c 61.2 7.1c 8.2b 4.5e 4.7d 4.1d 4.3d 3.7f 3.9f 90.6 6.5d 7.6c 4.3f 4.4e 3.8e 4.1e 3.1g 3.5g Yangjiang CK 7.3ab 8.5a 7.3a 8.5a 7.3a 8.5a 7.2ab 8.3a 30.4 7.4a 8.5a 7.0c 8.5a 7.3a 8.5a 7.3a 8.0b 61.2 7.4a 8.5a 7.2ab 8.5a 7.3a 8.5a 6.2d 6.7d 90.6 7.2bc 8.5a 6.8d 7.7c 6.3c 7.0c 5.3e 5.7e Different lower case letters in the same column indicate significant difference at 0.05 probability level. CK, un-shaded control; d, number of days plants were exposed to shade. Changes in turfgrass biomass
-
After 50 d shade stress, both cultivars exhibited reduced biomass accumulation as shade intensity increased (Table 2). However, the total biomass (TB), above-ground biomass (AGB), and below-ground biomass (BGB) of Yangjiang were all significantly higher than those of Guanzhong, especially under 61.2% and 90.6% shade levels. A slight but insignificant decrease in the accumulation of all three types of biomass occurred when both cultivars were subjected to 30.4% shade. Significant reductions in biomass were noticeable once shade intensity reached a moderate level of 61.2%. Under 61.2% and 90.6% shade treaments, the TB in Guanzhong were significantly decreased 17.65% and 21.43% than that in Yangjiang, respectively. Additionally, the ratio of above-ground to below-ground biomass (RAB) for both cultivars increased as shade intensity increased. However, the RAB for Yangjiang was greater than Guanzhong at all levels of shade intensity. Two cultivars showed the same trend of allocating more biomass to shoots than roots under shade stress indicting by 65.8% of AGB and 56.7% of BGB in Yangjiang and 63.3% of AGB and 53.8% of BGB in Guanzhong contrasting with controls under 90.6% shade level. In comparison, the AGB and BGB in Yangjiang exhibited significantly 31.58% and 21.43% higher than that in Guanzhong, respectively.
Table 2. Effects of shade on total biomass (TB), above-ground biomass (AGB), below-ground biomass (BGB), and the ratio of above- to below-ground biomass (RAB) for Guanzhong and Yangjiang.
Cultivars Shading level (%) TB (g/per plant) AGB (g/per plant) BGB (g/per plant) RAB (g/per plant) Guanzhong CK 0.56 ± 0.04b 0.30 ± 0.04b 0.26 ± 0.02b 1.15 ± 0.03e 30.4 0.51 ± 0.05b 0.29 ± 0.0lb 0.22 ± 0.01c 1.31 ± 0.03cd 61.2 0.42 ± 0.04c 0.24 ± 0.01c 0.18 ± 0.01d 1.34 ± 0.04cd 90.6 0.33 ± 0.02d 0.19 ± 0.01d 0.14 ± 0.01e 1.36 ± 0.05bc Yangjiang CK 0.68 ± 0.04a 0.38 ± 0.01a 0.30 ± 0.01a 1.27 ± 0.03d 30.4 0.65 ± 0.04a 0.37 ± 0.01a 0.28 ± 0.01ab 1.33 ± 0.04cd 61.2 0.51 ± 0.02b 0.30 ± 0.01b 0.21 ± 0.01c 1.43 ± 0.07ab 90.6 0.42 ± 0.03c 0.25 ± 0.01c 0.17 ± 0.01d 1.47 ± 0.06a Data are mean ± SE (Standard Error). Different lower case letters in the same column indicate significant difference at 0.05 probability level. CK, un-shaded control. Changes in growth rate
-
The average daily growth rate of Guanzhong and Yangjiang declined with increasing shade intensity and prolonged exposure to shaded conditions (Table 3). Compared to CK, the growth rate of Guanzhong decreased by 34.93% whereas the growth rate of Yangjiang decreased by 12.36% when exposed to 15 d of 30.4% shade. After 30 d of 61.2% shade, the growth rate of Guanzhong and Yangjiang decreased by 79.39% and 75.29% in comparison with CK, respectively. After 45 d of 90.6% shade, the growth rate of Guanzhong and Yangjiang decreased by 89.70% and 77.65% than that in CK, respectively. Notably, the average daily growth rate of Yangjiang was lower than in Guanzhong under all shaded conditions. After 30 d of 30.4% shade, the growth rate of Yangjiang lower 36.79% than that in Guanzhong. Meanwhile, the daily growth rate decreased 15.00% in Yangjiang compared to Guanzhong under 45 d of 61.2% shade level. It was also worth noting that the daily growth rate has no significant difference in Yangjiang compared to Guanzhong under 30 and 45 d of 90.6% shade treatment. In summary, the growth rate of Yangjiang was impacted less by shade stress than Guanzhong.
Table 3. Effect of shade on the average daily growth rate of Guanzhong and Yangjiang.
Cultivars Shading
level (%)1−15 d
(mm)16−30 d
(mm)31−45 d
(mm)Guanzhong CK 1.66 ± 0.04a 1.63 ± 0.03a 1.65 ± 0.04a 30.4 1.08 ± 0.02b 1.06 ± 0.02c 0.67 ± 0.03c 61.2 0.93 ± 0.03c 0.40 ± 0.01e 0.34 ± 0.01e 90.6 0.78 ± 0.04d 0.24 ± 0.01f 0.17 ± 0.01f Yangjiang CK 0.89 ± 0.06c 0.87 ± 0.03b 0.85 ± 0.04b 30.4 0.78 ± 0.04d 0.67 ± 0.02d 0.45 ± 0.02d 61.2 0.61 ± 0.03e 0.34 ± 0.01f 0.21 ± 0.01f 90.6 0.56 ± 0.07e 0.23 ± 0.01f 0.19 ± 0.01f Data are mean ± SE (Standard Error). Different lower case letters in the same column indicate significant difference at 0.05 probability level. CK, un-shaded control. Changes in chlorophyll content
-
Chl can be an indicator of turfgrass leaf color intensity for examining turf quality and turf visual esthetic. Shading gradients had a distinct effect on chlorophyll (Chl) abundance for both Guanzhong and Yangjiang (Table 4). As shade intensity increased, the abundance of Chla, Chlb, and total Chl declined for both cultivars. However, Chla, Chlb, and total Chl levels were higher in Yangjiang compared with Guanzhong under all shade treatments. When exposed to 30.4% shade, Chla, Chlb, and total Chl contents decreased in Guanzhong by 6.64%, 6.93%, and 6.83% compared with CK, respectively. The abundance of Chla, Chlb, and total Chl in Yangjiang decreased by 2.57%, 5.47%, and 4.51% than that in CK with 30.4% shade treatment, respectively. When exposed to 61.2% shade, Chla and Chlb contents in Yangjiang were 13.79% and 19.71% higher than in Guanzhong, respectively. This trend was the same when the cultivars were exposed to 90.6% shade. In particular, the total Chl was remarkably higher 18.41% in Yangjiang compared with Guanzhong under 90.6% shade level. Finally, the ratio of Chla/b was lower in Yangjiang compared with Guanzhong due to more Chlb accumulation as the shade intensity increased. Moreover, Chla/b had significant difference between the two cultivars only under 90.6% shading treatment, in which Guanzhong was 17.78% higher than Yangjiang.
Table 4. Effects of shade on leaf chlorophyll a (Chla), chlorophyll b (Chlb), total chlorophyll (Total Chl) contents, and the ratio of Chla to Chlb (Chla/b) in Guanzhong and Yangjiang.
Cultivars Shading level (%) Chla [mg·g−1(FW)] Chlb [mg·g−1(FW)] Total Chl [mg·g−1(FW)] Chla/b Guanzhong CK 2.26 ± 0.08bc 4.33 ± 0.25cd 6.59 ± 0.28d 0.52 ± 0.02ab 30.4 2.11 ± 0.13bcd 4.03 ± 0.17d 6.14 ± 0.25de 0.52 ± 0.01ab 61.2 2.03 ± 0.06cd 4.06 ± 0.12d 6.09 ± 0.17e 0.50 ± 0.07ab 90.6 1.92 ± 0.02d 3.63 ± 0.04e 5.54 ± 0.12f 0.53 ± 0.05a Yangjiang CK 2.72 ± 0.21a 5.48 ± 0.22a 8.20 ± 0.28a 0.50 ± 0.03ab 30.4 2.65 ± 0.08a 5.18 ± 0.08a 7.83 ± 0.11b 0.51 ± 0.02ab 61.2 2.31 ± 0.21b 4.86 ± 0.16b 7.17 ± 0.16c 0.48 ± 0.05b 90.6 2.04 ± 0.14cd 4.52 ± 0.23c 6.56 ± 0.21d 0.45 ± 0.03b Data are mean ± SE (Standard Error). Different lower case letters in the same column indicate significant difference at 0.05 probability level. CK, un-shaded control. Changes in chlorophyll a fluorescence
-
To reflect the status of plant photosynthesis, chlorophyll a (Chla) fluorescence was measured in two cultivars. The value of quenching coefficient (qP), electron transfer rate (ETR), and maximal fluorescence (Fv/Fm) in both cultivars under shade treatments decreased relative to the un-shaded condition. Yangjiang exhibited a smaller decline in these metrics compared with Guanzhong under multiple shade conditions (Fig. 2). This difference was particularly stark at 61.2% shade when Yangjiang had a significantly higher qP than Guanzhong with no significant differences in qP at 30.4% or 90.6% shade (Fig. 2a). Yangjiang also had significantly higher ETR and Fv/Fm values than Guangzhong at all shade intensities except for the un-shaded control (Fig. 2b & c). In general, Yangjiang exhibited greater photochemical capacity to adapt to severe shading conditions than Guanzhong.
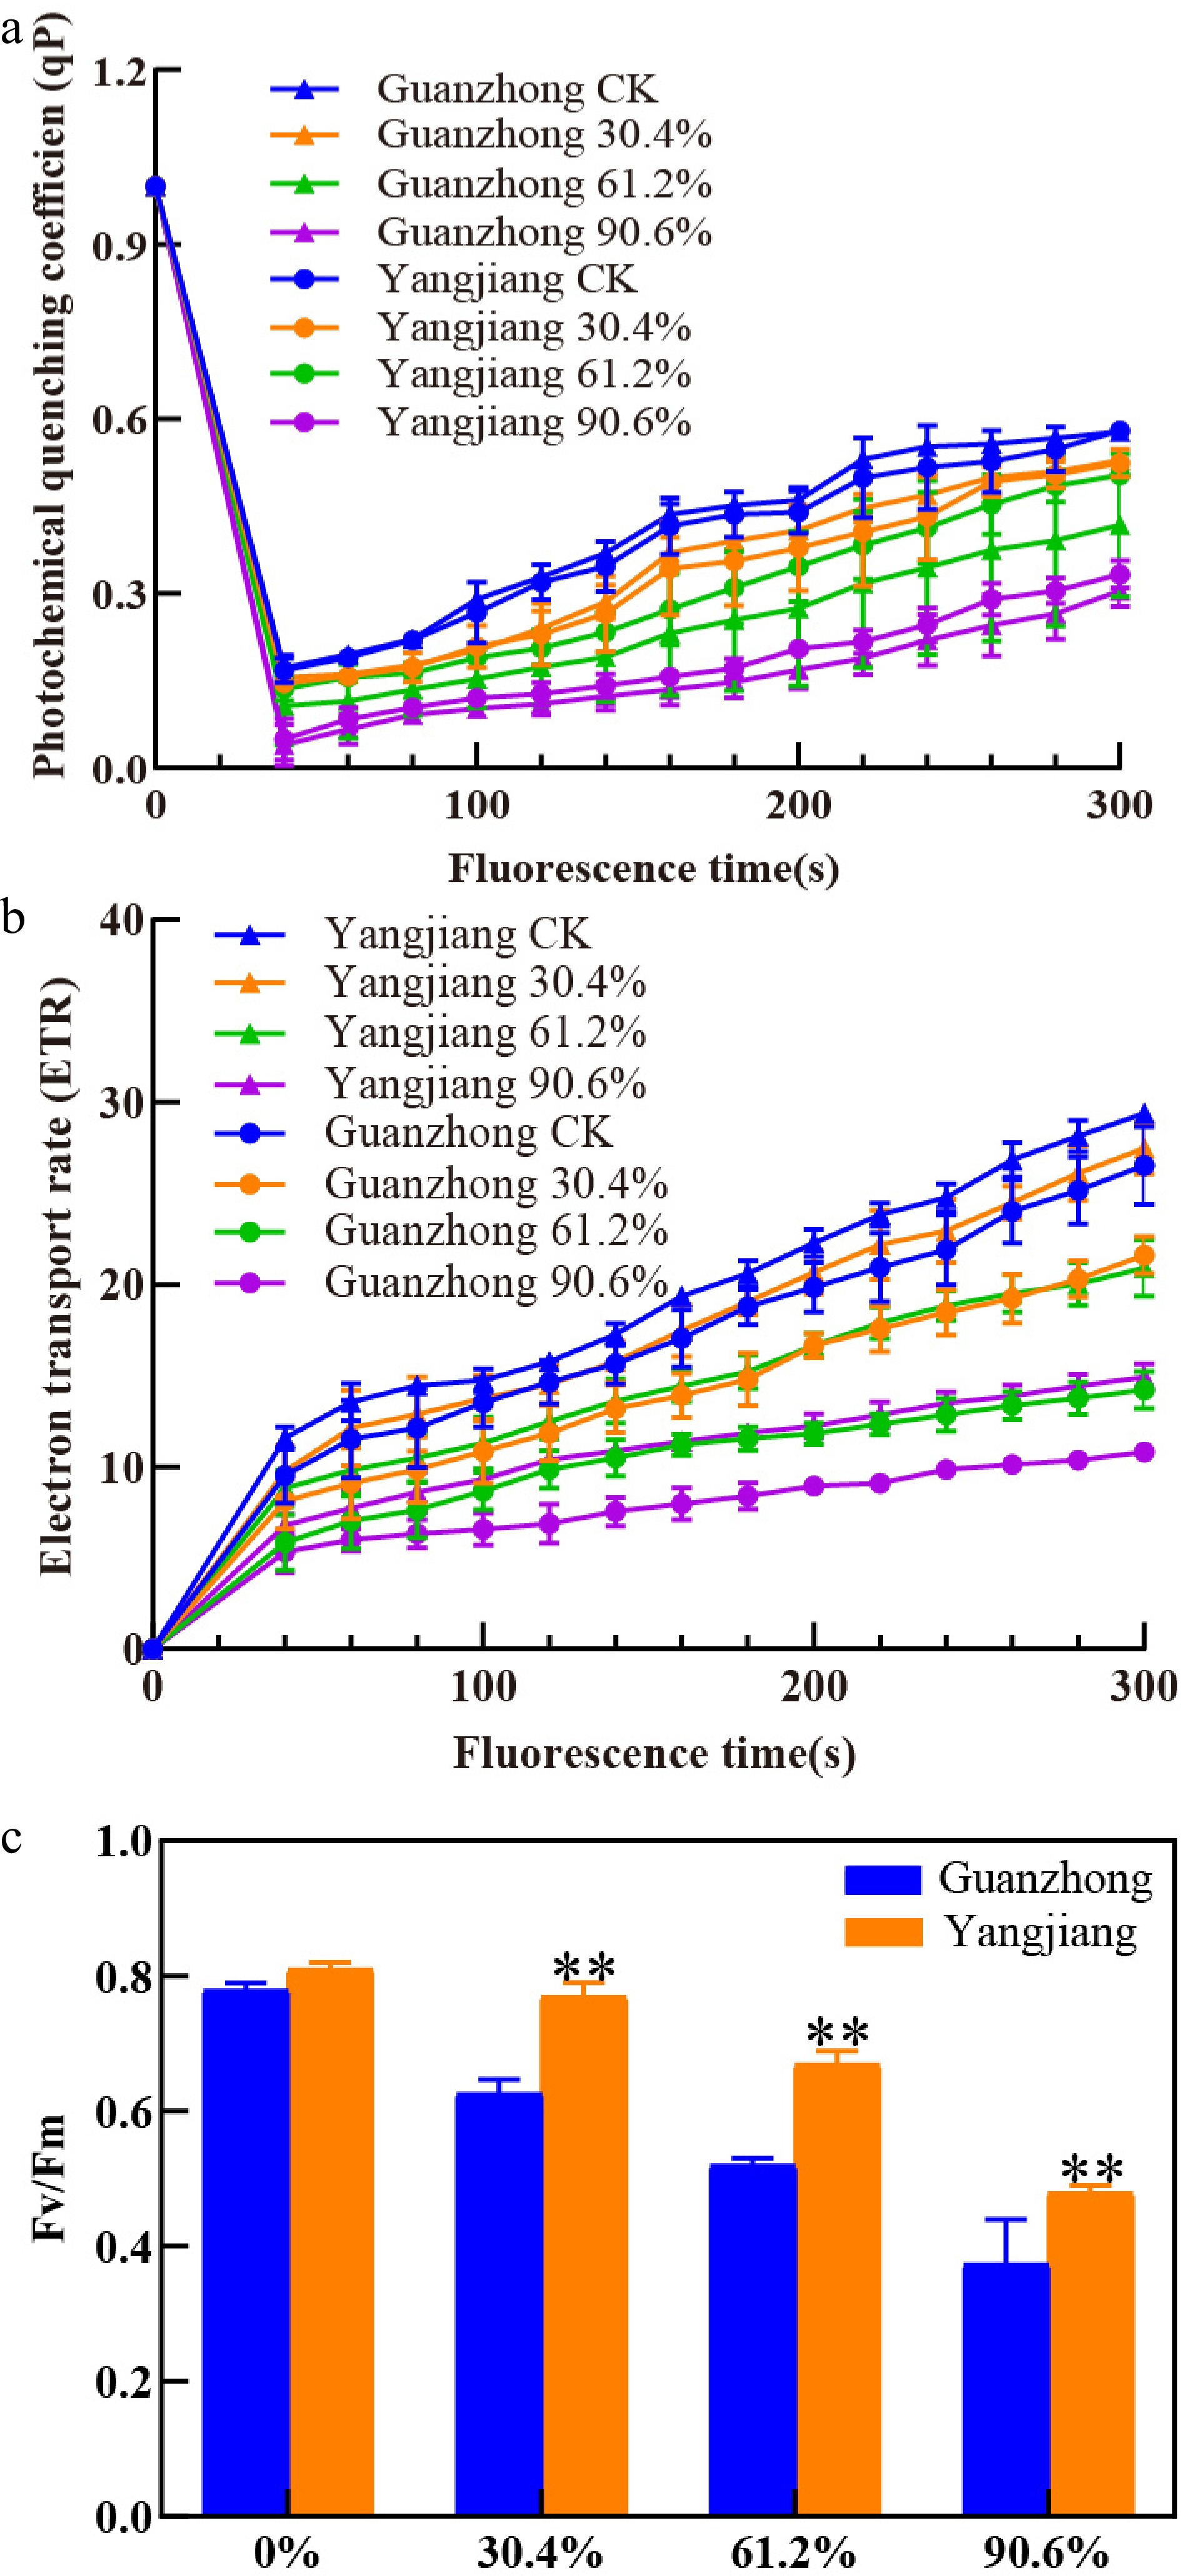
Figure 2.
Effects of shade on chlorophyll a fluorescence in Guanzhong and Yangjiang. (a) Photochemical quenching coefficient (qP), (b) electron transport rate (ETR), (c) ratio of variable fluorescence to maximal fluorescence (Fv/Fm) of both cultivars were measured under 30.4%, 61.2%, and 90.6% shade. ** indicates significant differences at 0.01 level between the two cultivars. CK, un-shaded control. Vertical bars represent standard errors of the mean (n = 4).
Changes in reactive oxygen species (ROS) production and antioxidant enzyme activities
-
When exposed to 30.4% shade, the activity of the antioxidant enzymes catalase (CAT), superoxide dismutase (SOD), and peroxidase (POD) increased relative to the controls for both Yangjiang and Guanzhong, and especially the peaks of activities in Yangjiang persisted at 61.2% shade level. However, only the SOD activity was notably increased by 13.20% in Yangjiang than in Guanzhong under 30.4% shade, while the POD and CAT activities in both cultivars had no significant difference. As the shading intensities increased, CAT, SOD and POD showed a decreased trend for both cultivars, however, these enzymes activities in Guanzhong decreased fast and significantly lower than Yangjiang (Fig. 3a−c). In particular, the POD and CAT activities in Yangjiang were significantly higher by 58.33% and 32.54% than those in Guanzhong under 90.6% shade. Hydrogen peroxide (H2O2) accumulation increased with increasing shade intensity for both cultivars (Fig. 3d). Obviously, in comparison with Guanzhong, the content of H2O2 was significant decreased 20.23% and 22.69% in Yangjiang in 61.2% and 90.6% shade, respectively. In general, antioxidant enzyme activities were higher and H2O2 accumulation was lower in Yangjiang compared with Guanzhong at each shade intensity (Fig. 3d).

Figure 3.
Effects of shade on H2O2 production and antioxidant enzyme activity in Guanzhong and Yangjiang. (a) SOD, (b) POD, (c) CAT activities and (d) H2O2 production of both cultivars were measured under 30.4%, 61.2%, and 90.6% shade. * and ** indicate significant differences at 0.05 and 0.01 levels between the two cultivars, respectively. CK, un-shaded control. Vertical bars represent standard errors of the mean (n = 4).
Effects of shade on leaf anatomy
-
Overall leaf thickness and thickness of the upper and lower epidermal cells of both Guanzhong and Yangjiang were significantly reduced under all shade levels (Table 5). With 61.2% shade, the leaf thickness of Guanzhong was reduced by 16.01% relative to the CK whereas that of Yangjiang was only decreased by 9.85% (Table 5). A similar trend was observed for upper epidermal cell thickness, which was decreased by 37.77% and 61.99%, respectively, in Guanzhong compared with CK under 61.2% and 90.6% shade (Table 5). Upper epidermal cell thickness in Yangjiang leaves compared to CK was reduced by 20.37% and 36.35% under 61.2% and 90.6% shade, respectively (Table 5). Compared with the CK, the thickness of lower epidermal cells for both turfgrasses decreased sharply by up to 60.90% for Guanzhong and 52.36% for Yangjiang under 90.9% shade (Table 5). The diameter of the vascular bundle in Guanzhong and Yangjiang leaves also decreased significantly (Fig. 4). Under control condition, Guanzhong and Yangjiang had a typical complete nearly circular Kranz anatomical structure containing the outer layer of mesophyll cells and the inner layer of vascular bundle sheath cells (Fig. 4). With increasing shading levels, the cell volume of the Kranz exhibited a decrease trend in both cultivars. Comparatively, Guanzhong had greater decrease in volume of Kranz cells (Fig. 4).
Table 5. Effects of shade on leaf anatomical structures in Guanzhong and Yangjiang.
Cultivars Shading level (%) Leaf thickness (μm) Thickness of UEC (μm) Thickness of LEC (μm) Vascular diameter (μm) Guanzhong CK 146.34 ± 6.34a 8.34 ± 1.17a 7.98 ± 1.23a 119.34 ± 6.32a 30.4 134.78 ± 7.25b 7.18 ± 1.26ab 6.25 ± 1.16abc 98.56 ± 5.26bc 61.2 122.91 ± 8.26bc 5.19 ± 1.86bc 4.98 ± 1.36bcd 76.69 ± 7.32ef 90.6 93.33 ± 6.31d 3.17 ± 1.79c 3.12 ± 1.79d 65.53 ± 6.29f Yangjiang CK 131.83 ± 5.32b 7.51 ± 1.66ab 6.97 ± 1.78ab 108.76 ± 7.67ab 30.4 122.84 ± 6.69bc 6.23 ± 1.47ab 5.81 ± 1.32abcd 94.32 ± 6.34cd 61.2 118.84 ± 4.86c 5.98 ± 1.25ab 4.96 ± 1.86bcd 84.09 ± 5.21de 90.6 102.71 ± 7.32d 4.78 ± 1.38bc 3.32 ± 1.79cd 72.32 ± 4.29f Data are mean ± SE (Standard Error). Different lower case letters in the same column indicate significant difference at 0.05 probability level. CK, un-shaded control. UEC, upper epidermal cells. LEC, lower epidermal cells. 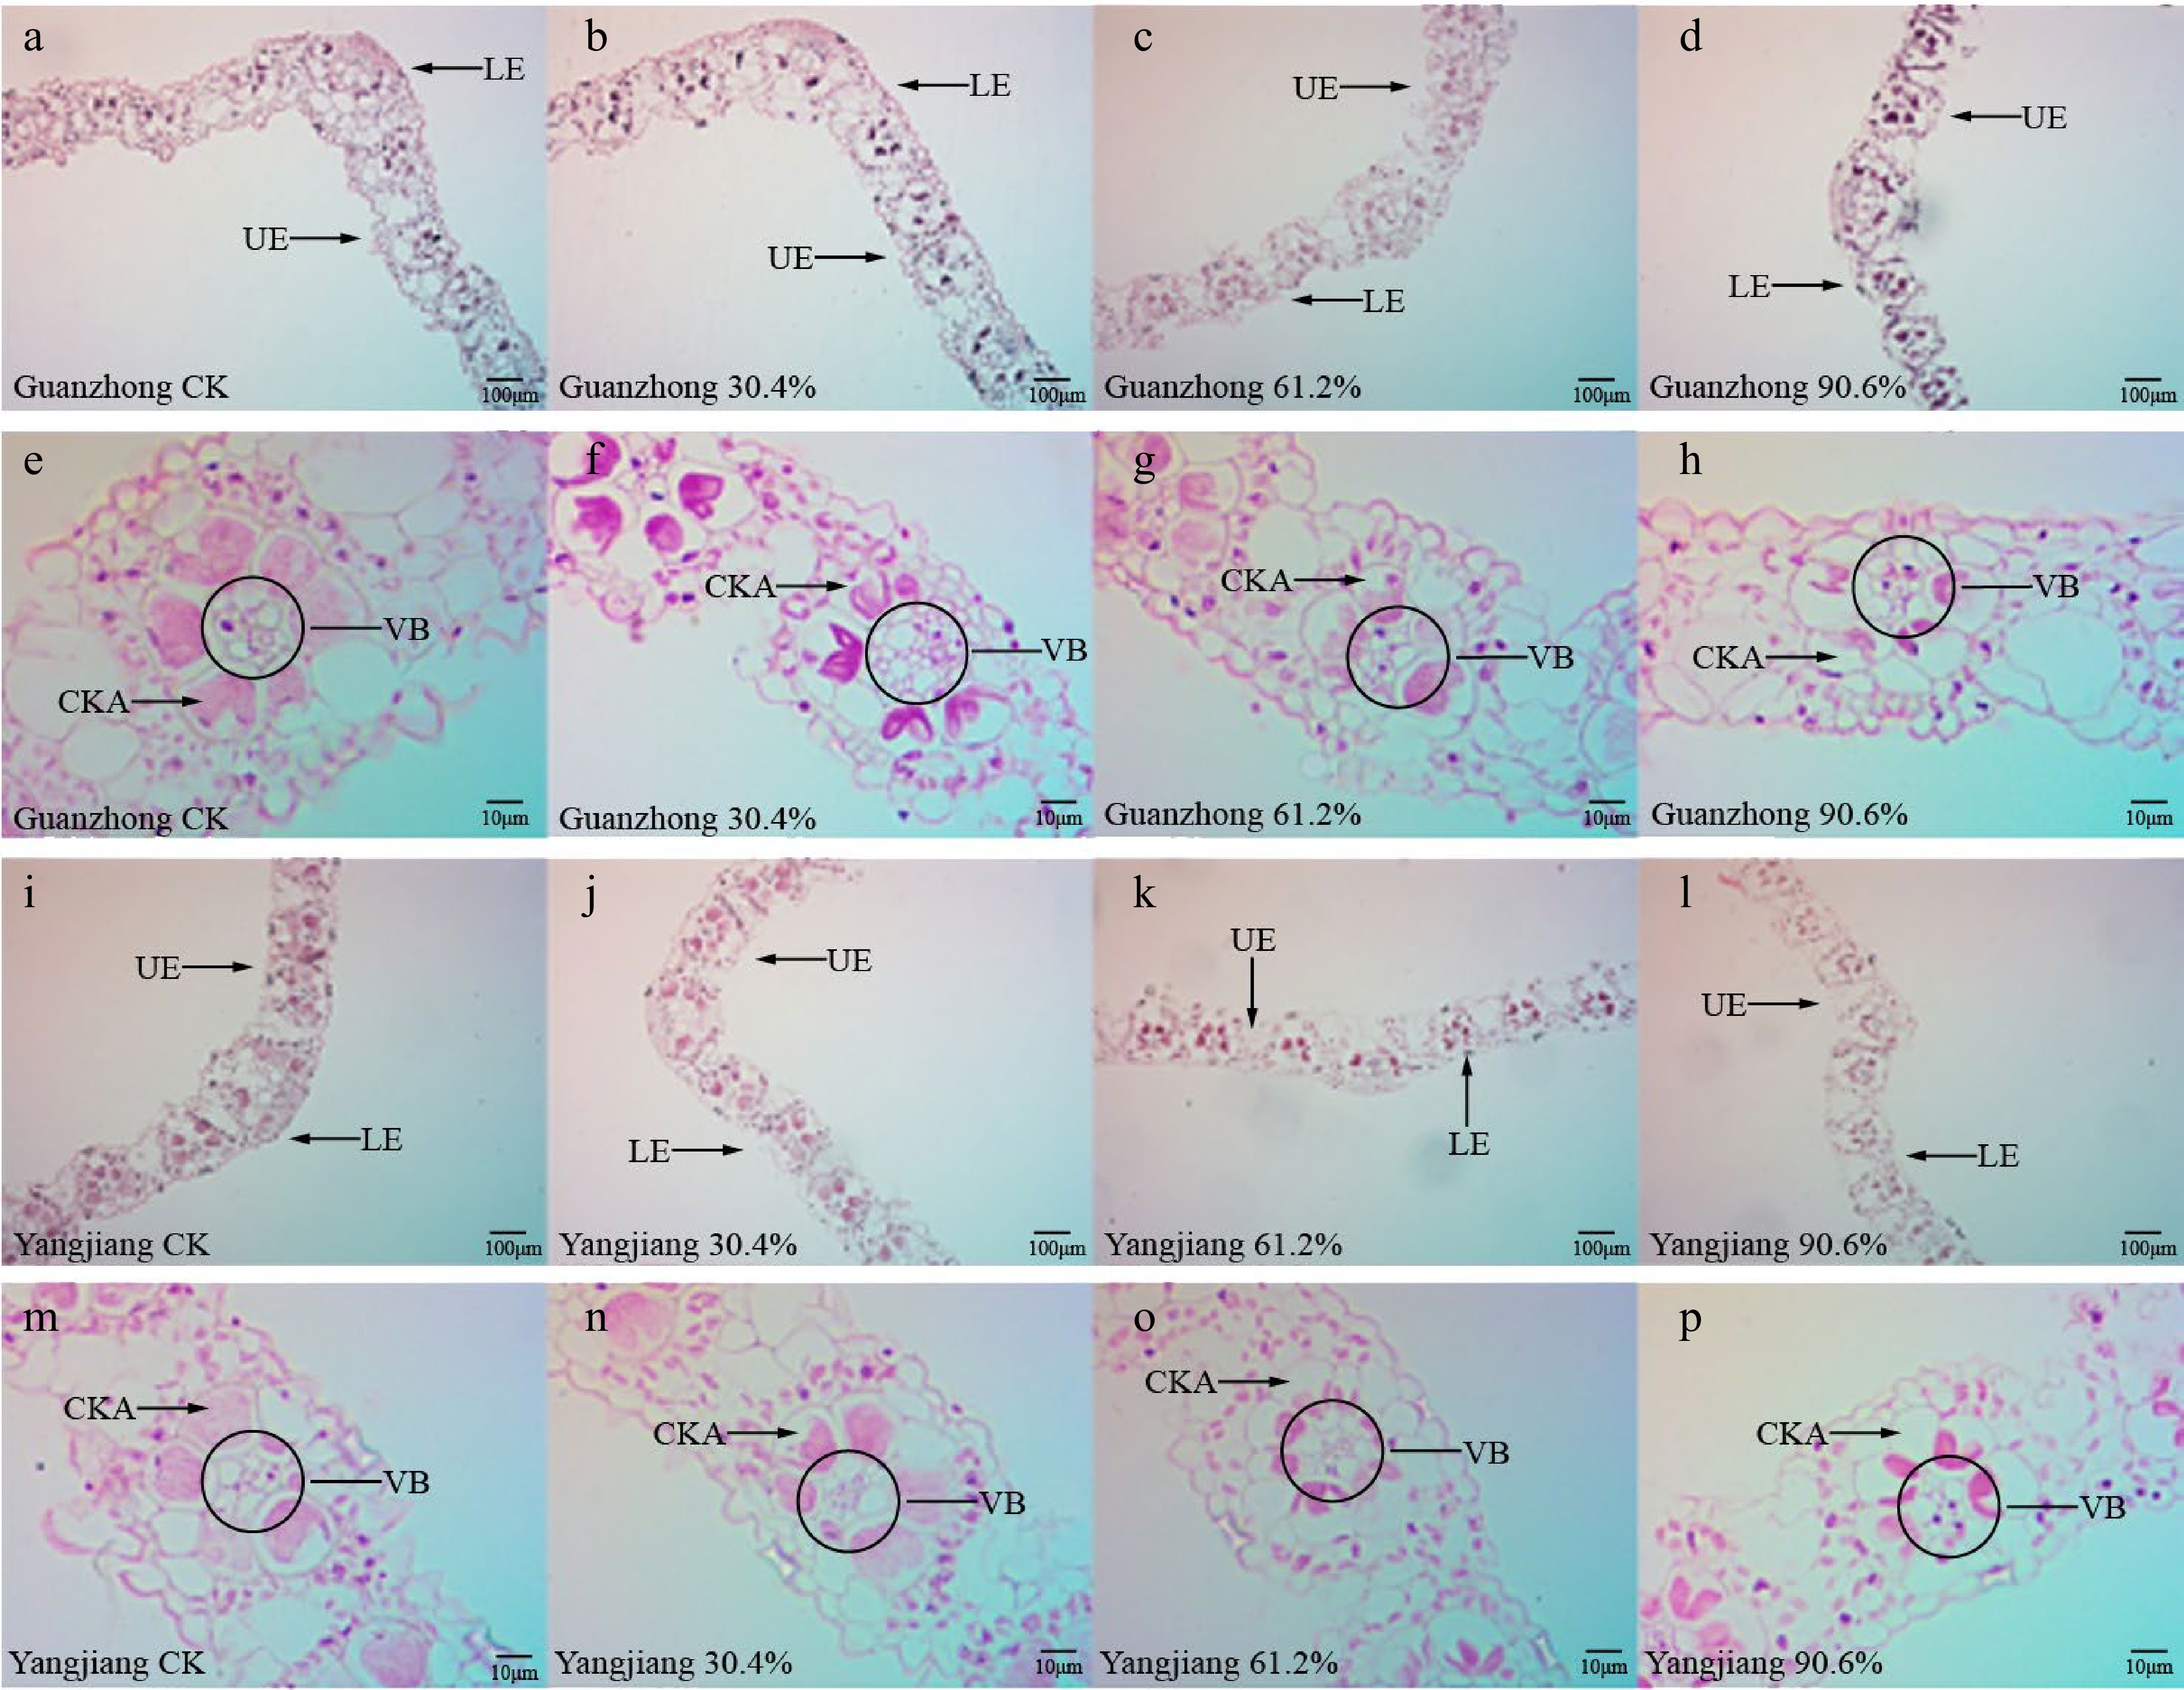
Figure 4.
Cross-sections of Guanzhong and Yangjiang leaves under different shading treatments. (a)−(d) Images of Guanzhong leaf ribs at 100× magnification highlighting the upper epidermal (UE) and lower epidermal (LE) cell layers of plants treated with (a) no shade, (b) 30.4% shade, (c) 61.2% shade, and (d) 90.6% shade. (e)−(h) Images of Guanzhong leaf ribs at 400× magnification highlighting the vascular bundle (VB) and cells of Kranz anatomy (CKA) of plants treated with (e) no shade, (f) 30.4% shade, (g) 61.2% shade, and (h) 90.6% shade. (i)−(l) Images of Yangjiang leaf ribs at 100× magnification highlighting the UE and LE cell layers of plants treated with (i) no shade, (j) 30.4% shade, (k) 61.2% shade, and (l) 90.6% shade. (m)−(p) Images of Yangjiang leaf ribs at 400× magnification highlighting the VB and CKA of plants treated with (m) no shade, (n) 30.4% shade, (o) 61.2% shade, and (p) 90.6% shade.
-
Sunlight is a highly heterogeneous energy source that is essential for plant growth, survival, and competition in communities[21,22]. In a turfgrass population, low-light environments often render turfgrass more vulnerable to abiotic and biotic stresses[16]. Variability in morphological, physiological, and anatomical responses to shade among turfgrass species and cultivars are phenotypes used by breeding programs to identify shade tolerant varieties[8]. Results from this study demonstrate that the Yangjiang and Guanzhong cultivars differ significantly in their responses to shade stress. Prolonged shade significantly altered the growth rate, biomass allocation, turf quality, and turf color of the two cultivars. In every metric used in this study to assess shade stress responses, Yangjiang exhibited superior tolerance to shade under both high levels and extended periods of shade. Differences in biomass accumulation and growth rate between the two bermudagrass cultivars suggest that they differ in their growth response to shade. Therefore, research based on two genotypes of bermudagrass could analyze the characteristics of each cultivar and make it better used.
The geographical origin of these two cultivars may partially account for their differing responses to shade. Yangjiang originated in subtropical areas of southern China dominated by forests and plentiful rainfall. Meanwhile, Guanzhong originated in temperate continental regions of the Shaanxi Province in northwest China where the natural landscape is sparsely vegetated and arid[23]. One can imagine that the abundant vegetation and rainfall of southern China required Yangjiang to be well-adapted to extended periods of low light. By contrast, the sparsely vegetated and arid environment of northwest China resulted in Guanzhong being better adapted to the higher intensity light and the abundant trichomes on Guanzhong leaves likely provided protection from the damage of sunlight (Fig. 1c & d). As a previous study demonstrated, by increasing surface reflectance trichomes contribute to reduced solar radiation interception and enhanced resistance to low water availabilities and photoinhibition stress[24]. The prostrate shoots of Yangjiang, compared with the upright shoots of Guanzhong, is likely beneficial on the forest floor where competition for light is fierce (Fig. 1a).
Previous studies demonstrated that reduced growth in shade is an indicator of shade-tolerant species[25]. Under normal light conditions, the growth rate of Yangjiang was lower than that of Guanzhong, indicating genetic differences in shade tolerance that may be due to their evolutionary history (Table 2). Shade reduced the growth rate of both cultivars in this study, however, under 30.4% shade, the growth rate of Guanzhong was higher than that of Yangjiang, and the decline of growth rate in Guanzhong was more rapid than that of Yangjiang. This suggests that Guanzhong was more sensitive and intolerant to shade, while Yangjiang maintained better growth to cope with shade stress. This result agrees with a prior study on turfgrass species and other plant species subjected to shade stress[5,26,27].
Changes in morphological and anatomical structure intuitively reflected the response of bermudagrass to shading treatment. With increasing shade levels, the shoot-to-root ratio of both cultivars increased, and more biomass was allocated to shoots than roots (Table 2). However, the increase in the RAB in Yangjiang was greater than that in Guanzhong, implying that Yangjiang possesses higher light use efficiency under shade conditions and higher shade tolerance[28,29]. Moreover, shading treatment resulted in significant reduction of upper and lower epidermis cell thickness and vascular bundle diameter in both cultivars (Fig. 4). Nevertheless, the decrease in Guanzhong was greater than that in Yangjiang, which indicated stronger tolerance to shading stress of Yangjiang[30]. Meanwhile, as the typical characteristic of C4 turfgrass, Kranz anatomy structure improved the photosynthesis capability of leaves under shading stress[14]. Along with the increased shading levels, the cell volume of Kranz anatomy and vascular bundles in Guanzhong were greater decrease than those in Yangjiang (Fig. 4). This implied that Yangjiang has a stronger maintaining photosynthetic capacity than Guanzhong in response to shade stress.
Severe shade can lead to intracellular ROS production in the form of H2O2 and O2., which causes cellular damage by oxidizing cell membranes[31,32]. Here, we found that H2O2 accumulated in both cultivars as shade level increased (Fig. 3), however, H2O2 accumulation was much greater in Guanzhong (Fig. 3). By contrast, activities of the antioxidant enzymes SOD, POD, and CAT were greater in Yangjiang (Fig. 3). These results suggest that Yangjiang suffers from less ROS-induced damage than Guanzhong.
Total leaf Chl, Chla, and Chlb contents decreased for both cultivars as shade levels increased (Table 4). Once again, Yangjiang appeared to tolerate shade better than Guanzhong as evidenced by higher total Chl, Chla, and Chlb contents at all shade intensities (Table 4). This chlorophyll advantage allows Yangjiang to maintain a greater photosynthetic efficiency under low-light conditions compared with Guanzhong (Fig. 2). The PSII maximum chemical efficiency (Fv/Fm), electron transfer rate (ETR), and the photochemical quenching coefficient (qP) were similar between the two cultivars under normal light conditions and decreased as shade intensity increased (Fig. 2). In general, Guanzhong experienced a greater decline in these metrics relative to Yangjiang as shade level increased (Fig. 2). Yangjiang had a lower Chla to Chlb ratio in under shade stress, as well as thinner leaves and a smaller diameter of vascular bundles, these traits have been reported to be associated with greater shade tolerance in other plant species[29,33,34]. Breeding efforts that target these traits will improve the shade tolerance of bermudagrass germplasm and aid turf management in shade environments.
-
Bermudagrass is a popular warm-season turfgrass that is widely used worldwide in the turfgrass industry. One weakness of bermudagrass is its sensitivity to prolonged and intense shade. Breeding for enhanced shade tolerance is a key focus of the turfgrass industry. These efforts are aimed at promoting the use of bermudagrass cultivars in regions outside of south China where it is most popular and environmentally adapted. In this study, we investigated the shade tolerance of two bermudagrass cultivars, Yangjiang (C. dactylon Yangjiang, prostrate form) and Guanzhong (C. dactylon Guanzhong, upright form), by assessing their turf performance, growth, anatomical, and physiological features. Our results demonstrated that the two cultivars exhibited significant differences in turf quality, turfgrass color intensity, biomass allocation, growth rate, antioxidant ability, leaf thickness, and photochemical properties under shade. While both cultivars responded adversely to shade, Yangjiang exhibited better shade tolerance than Guanzhong in all traits measured. The shade tolerance traits of Yangjiang can be used for the genetic improvement of shade tolerance in bermudagrass. Future studies on bermudagrass should focus on the genetic regulation of photoreceptive systems, such as the role of phytochromes and endogenous hormones for improving shade tolerance in bermudagrass.
-
The two Chinese bermudagrass cultivars used in this study, Yangjiang (Cynodon dactylon Yangjiang) and Guanzhong (Cynodon dactylon Guanzhong), were developed by Jiangsu Institute of Botany, Chinese Academy of Sciences (China). Sods of the two cultivars were collected at the Turf Research Centre of Northeast Agricultural University (Harbin, China) and cultivated in plastic containers 50 cm long, 30 cm wide, and 15 cm high. The cultivation substrate was local black loam soil (16.8 g·kg−1 of organic matter and pH 7.0). The experiment was conducted in a greenhouse for establishing the canopy and roots. The greenhouse environment was 65% ± 5% relative humidity, 13 h illumination (1,429 ± 89 µmol·m−2·s−1), and 30°C/25 °C (day/night). During cultivation, turfgrasses were clipped to about 4.5 cm every week and watered every other day with 1,000 mL water for each container (12 cm water in depth). One month after planting, a gradient of shading treatments was imposed for both cultivars.
Shade treatments
-
The experiment was conducted using a two-factor randomized block design with four levels of shading treatments using black shading cloth from 15 July 2019 to 3 September 2019. There were four replicates for each shading level for each cultivar. Shade levels were as follows: 30.4% (49.35 ± 1.94 mol·m−2·d−1, pots were covered with a single layer of a shade cloth), 61.2% (27.51 ± 1.79 mol·m−2·d−1, pots were covered with two layers of a shade cloth), 90.6% (6.66 ± 0.42 mol·m−2·d−1, pots were covered with three layers of a shade cloth), and the un-shaded control group (66.73 ± 4.17 mol·m−2·d−1). The shade cloths were only removed for short periods (< 15 min) from covered pots to trim and collect data during the treatments and on assessment dates. Light intensity was monitored by a light meter (Spectrum 3413F, US), with the levels expressed as [(PARCK − PARshade) / PARCK] × 100%, where PAR (mol·m−2·d−1) was the photosynthetic active radiation represented by daily light integral[11].
Measurements
Turf quality (TQ) and turf color intensity (TCI)
-
According to a combination of the NTEP (The National Turfgrass Evaluation Program) standard and general visual scoring method, TQ and TCI of the two cultivars were measured after shading treatment for 5, 20, 35, and 50 d. A rating scale of 1 through 9 were recorded with 9, 5, and 1 representing excellent, the lowest acceptable value, and very poor, respectively[35,36]. Three replications for each cultivar were used in each treatment.
Growth rate and biomass
-
Daily growth rate was recorded during the shading period by selecting 10 random locations in the turfgrass container and recording the height of the grass using a ruler. The average growth rate was obtained by measuring the daily increment in shading periods of 1 to 15, 16 to 30, and 31 to 45 d, separately. Plants were harvested and the dry weight of above-ground biomass (AGB) and below-ground biomass (BGB) was measured as described by Saud et al.[37]. The total biomass (TB) was the sum of AGB and BGB. The ratio of above- to below-ground biomass (RAB) was calculated by dividing AGB by BGB.
Chlorophyll (Chl) content and chlorophyll a fluorescence
-
After shading treatment for 50 d, the leaves of two cultivars were collection for Chl content measurement. The abundance of Chl and Chla was determined as previously described by Xie et al.[14]. Briefly, 0.1 g fresh leaf of each sample was weighed into a 5 ml tube and added 2 ml of 95% ethanol. After 72 h of dark treatment, the extract solution was measured absorbance at 665 nm, 649 nm, and 470 nm using a spectrophotometer (UV-2450). Total Chl is equal to Chla plus Chlb. The ratio of Chla to Chlb was represented by Chla/b. Chl fluorescence parameters were measured using a Chla fluorescence imaging system (IMAGING-PAM, Walz, Germany). The samples handled with shading stress for 50 d were first dark treated for 20 min. The selected sample's area of interest (AOI) value (Ft) was adjusted to be between 0.1 and 0.2, and the light intensity for actinic light parameters was set to 86 µmol·m−2·s−1. Saturation pulse light frequency was set to 20 s/times and the intensity was set to 4,000 µmol m−2·s−1. The photochemical quenching coefficient (qP), electron transfer rate (ETR), and PSII maximum chemical efficiency (Fv/Fm) were all determined. Four replications for each cultivar were used in each treatment.
Quantification of antioxidant enzyme activities and H2O2
-
The leaves of two cultivars were collected after shading 50 d to measure antioxidant enzyme activities and H2O2 content. A total of 0.5 g of fresh leaves were ground in 2 mL of 50 mM phosphate extraction buffer (pH 7.8) at 5−10 °C. The supernatant was collected by centrifuging the mixture at 12,000g for 15 min at 4 °C. Superoxide dismutase (SOD), peroxidase (POD), and catalase (CAT) activities as well as the abundance of H2O2 were quantified following the methods described by Dong et al.[15]. Four replications for each cultivar were used in each treatment.
Leaf anatomical structures
-
Fully developed leaves after shading for 50 d were cut into 0.5 cm segments and the middle part of the leaf was embedded in a formalin aceto-alcohol (FAA) mixture for tissue fixation. Detailed experimental steps for making paraffin sections are described by Xie et al.[14]. Leaf anatomy was observed using a light microscope (BX61, OLYMPUS, and Tokyo Japan).
Data analysis
-
The experiment was performed using a two-factor randomized block design with four biological and three technical replicates. Statistical analysis was carried out with SPSS v10.0 software (SPSS, Inc., Chicago IL, USA). Statistically significant differences were calculated based on two-way ANOVA, with p < 0.05 as the critical significance level. The tables were made using Microsoft Excel 2016 and graphs were plotted using Prism v9.0 (GraphPad Company, San Diego, CA, USA).
This research was supported by the National Natural Science Foundation of China (No. 31971772; 32001407). We are also grateful to Prof. Jianxiu Liu from the Institute of Botany, Jiangsu Province and the Chinese Academy of Sciences for providing the cultivars 'Yangjiang' and 'Guanzhong' for our research.
-
The authors declare that they have no conflict of interest.
- Copyright: © 2022 by the author(s). Published by Maximum Academic Press, Fayetteville, GA. This article is an open access article distributed under Creative Commons Attribution License (CC BY 4.0), visit https://creativecommons.org/licenses/by/4.0/.
-
About this article
Cite this article
Guo Z, Jiang J, Dong L, Sun X, Chen J, et al. 2022. Shade responses of prostrate and upright turf-type bermudagrasses. Grass Research 2:9 doi: 10.48130/GR-2022-0009 

Shade responses of prostrate and upright turf-type bermudagrasses
- Received: 25 September 2022
- Accepted: 18 November 2022
- Published online: 13 December 2022
Abstract: Bermudagrass (Cynodon dactylon) shade tolerance is a trait of immense importance to the turfgrass industry. However, little is known about shade tolerance of turf-type bermudagrass native to China. Additional knowledge of the mechanism of shade tolerance in bermudagrass is required to identify specific plant features that promote shade tolerance and assist breeding efforts worldwide. This study examines shade tolerance of two different bermudagrass cultivars, Yangjiang (prostrate form) and Guanzhong (upright form), which were developed in China. Each cultivar was subjected to 0, 30.4, 61.2, and 90.6% shade levels during growth and assessed for turf quality, turfgrass color intensity, biomass allocation, growth rate, antioxidant enzyme activity, leaf anatomy, and photochemical properties. Results generally demonstrated that turf quality and turf color intensity were lower in Guanzhong compared with Yangjiang on the 90.6% shade testing days. Yangjiang exhibited a less severe reduction of growth rate, leaf thickness, root to shoot ratio, and chlorophyll a to chlorophyll b ratio (Chla/b) under 90.6% shade compared with Guanzhong. Both cultivars exhibited a decrease in photochemical efficiency as determined by reduced qP, ETR, and Fv/Fm values. Photochemical efficiency was impacted less in Yangjian, and superoxide dismutase (SOD), peroxidase (POD), and catalase (CAT) enzymes activities were greater than in Guanzhong when exposed to severe shade. When exposed to 90.6% shade level, Yangjiang had better turf quality than Guanzhong as determined by morphological, anatomical, and physiological features. Breeding efforts focused on these shade tolerance features will lead to improved bermudagrass germplasm and aid turf management in shade environments.
-
Key words:
- Prostrate /
- Upright /
- Bermudagrass /
- Shade