


-
Reed canary grass (Phalaris arundinacea L.) is a perennial cool-season grass with diploidy, tetraploid and hexaploid forms native to Europe, Asia, and North America[1]. As a widely distributed species, reed canary grass is adaptable to diverse environmental conditions and can grow in different habitats between 75 and 3,200 m in altitude[2]. In addition, reed canary grass has a variety of applications, Firstly, due to its short reproductive period, high tillering capacity, high yield and high regeneration capacity, reed canary grass is often used as forage, hay, or silage[3]. Secondly, reed canary grass can also be used as a bioenergy source due to the early harvesting period and the high yield of the grass, which ensures a constant supply of raw material for bioreactors and power plants[4]. Finally, reed canary grass also has the advantages of water and soil conservation, remediation of heavy metal pollution in the environment and soil improvement due to its enormous roots and thick rhizome[5−7]. However, despite its many advantages, current research on the genus Phalaris is focused on biological characteristics and forage quality, and research on cultivation and variety selection has lagged in comparison to other forage grasses[8].
DNA markers, such as Amplified fragment length polymorphisms (AFLPs)[9], Random amplified polymorphic DNA (RAPD)[10], Single primer amplification reaction (SRAP)[11], Simple sequence repeat (SSR)[12], and Single nucleotide polymorphism (SNPs)[13], are practical tools for quantitative trait locus (QTL) mapping[14], marker-assisted selection (MAS)[15], evolutionary research, and genetic diversity analysis[16]. Especially, SSR (Simple sequence repeat) is popular for its polymorphism, abundance, codominance, sufficient variation, and cost-effectiveness[12]. SSR can be divided into genomic SSR (G-SSR) and expressed sequence tag SSR (EST-SSR)[17]. Among these, EST-SSR exhibited great application potential owing to its easy availability, good interspecies transferability, and its linkage with some traits or resistance-associated functional genes. In recent years, many EST-SSR markers have been developed in several plant species, which have high transferability in their related species, such as Thujopsis spp[18], Pseudotaxus chienii[19], and Amentotaxus spp[20]. These species' genetic diversity, genetic divergence patterns, and population genetic structure were studied using the developed markers[21]. However, few studies have reported the development of EST-SSR of reed canary grass.
Next-generation sequencing (NGS) has become more prevalent in de novo transcriptome analysis because of technological advancements in sequencing[22]. NGS, an efficient method, is renowned for its high throughput and lower cost characteristics. Therefore, it is often used to explore expressed sequence data of non-model species[23]. Transcriptome sequencing also offered a simple and effective way for developing molecular markers, especially for heterozygous polyploidy species with a large genome. Thus, NGS technology has contributed to ecology, evolution, and conservation genetics by obtaining large quantities of accessible genomic and transcriptomic data for Gramineae species[24].
In recent years, an increasing number of EST datasets have become available for both type and non-type plants, however, few EST-SSRs are currently available for reed canary grass. In this study, the reed canary grass transcriptome was obtained and functionally annotated to better understand its functional classification. Secondly, we have analyzed the frequency, distribution and function of SSRs of reed canary grass in the transcriptome. Finally, the genetic diversity and structure of 17 reed canary grass and two bulbous canary grass were studied using EST-SSR markers.
-
The fresh leaves, roots, and stems of P. arundinacea CV. Chuanxi (tetraploid) were collected from a nursery of the Sichuan Academy of Grassland Sciences in Dayi County (32°48" N, 102°33" E), Sichuan, China. These tissues were mixed for RNA extraction, after RNA quality inspection, transcriptome sequencing was performed with three replicates. The other 18 accessions were obtained from National Plant Germplasm System (NPGS) and maintained in the growth chamber at the Sichuan Academy of Grassland Sciences. The mixed leaves of all 19 accessions were dried with silica gel until use. Total RNA was extracted using an RNA extraction kit (Tiangen Biotech, Beijing, China), and total DNA was extracted using the cetyltrimethylammonium bromide (CTAB) method from 19 accessions. The concentration and quality of the extracted DNA were analyzed using the NanoDrop1 ND-1000 Spectrophotometer (NanoDrop Technologies, USA) and agarose gel electrophoresis, respectively[25].
cDNA preparation and Illumina sequencing
-
To construct the cDNA library, we used the SMARTTM cDNA library construction kit (Clontech, Mountain View, CA, USA). The cDNA library was constructed based on a previously described method[26], and then sequenced using Illumina HiSeq™4000 platform (2 bp × 150 bp read length) (San Diego, CA, USA) at Wuhan Genomics Institute (Frasergen, Wuhan, China).
Transcriptome assembly and annotation
-
The raw reads were filtered using the SOAPnuke v2.1.0 software. The following filtering parameters were set: discard paired reads containing splice sequences with ambiguous bases N > 5% and remove low-quality paired reads with more than 50% of the entire read length in bases with Qphred ≤ 20 (Q20). Trinity software was used to assemble transcript sequences. Finally, all transcripts are compared in a public protein database (KOG, GO, KEGG, NR, Swiss-Prot) via BLASTX. BLAST2GO (
https://www.blast2go.com/ ) with NR annotation were used to obtain the assembled transcripts for GO annotation (Gene Ontology, GO), and metabolic pathway analysis of the assembled transcripts were performed according to the KEGG (http://www.genome.jp/kegg/ ) database[27−28].SSRs identification and primer design
-
MicroSAtellite software (MISA) was used to identify SSRs within transcript sequences longer than 500 bp[29]. These SSR loci can be identified using the repeat number of mono-, di-, tri-, tetra-, penta-, and hexa-nucleotide motifs greater than or equal to 10, 6, 5, 5, 5, and 5, respectively. The primers were designed using Primer 3.0[30], and the principles are as follows: (1) Primer length between 18 and 25 bp; (2) An annealing temperature of 57 °C to 63 °C is recommended, with 60 °C being the optimal temperature.; (3) GC content of 30%−70%, optimal GC content of 50%; (4) amplification product length of 100−300 bp.
EST-SSR amplification
-
Three hundred EST-SSR primer pairs were randomly selected to identify polymorphism based on four geographically distant accessions. PCR amplification was performed in a volume of 20 µL; PCR reactions included 4 µL (20 ng/µL) DNA samples, forward and reverse primers, 0.5 µL each (10 mM), 0.5µL Taq enzyme (2.5 U/µL), 10 µL 2× Master Mix (Tiangen, Beijing), and 4.5 µL ddH2O. The cycling conditions were conducted as follows: initiation at 95 °C for 2 min, followed by 30 cycles of 30 s intervals at 95 °C, annealing at 45 °C for 30 s, 1 min at 72 °C, and 2 min at 72 °C. Each primer was amplified twice to determine if it produced clear and reproducible bands. To assist in detecting polymorphic bands, we electrophoresed 8% non-denaturing polyacrylamide gels with 1% TBE buffer solution with silver nitrate staining. Finally, 19 accessions were genotyped via EST-SSRs with high transferability, polymorphism, and repeatability.
Genotyping and data analysis
-
SSR is a co-dominant marker, but amplifying alleles in reed canary grass can be challenging due to its diploid, tetraploid, and hexaploid characteristics. Therefore, the amplified SSR bands are recorded as either present (1) or absent (0). Based on the objective results, only well-resolved, unambiguous bands (> 50 bp) were detected. The number of polymorphic bands (NPB) was recorded with a threshold of 5%. The polymorphic information content (PIC) was calculated using PIC = 1 − p2 − q2, it ranged from 0−0.5 and a larger PIC value indicated better polymorphism of the dominant marker, where p and q are the frequencies of present and absent, respectively[31]. The marker index (MI) was calculated using MI = PIC × NPB [32] . Resolving power (RP) was used to distinguish between genotypes in germplasm panels, which was calculated using Rp = Σ Ib. Ib was calculated using Ib = 1 − (2 × |0.5 − Pi|), where Pi is the frequency of amplification bands[32].
GenAlex 6.51 was used to calculate the allele number (Na), the effective number of alleles (Ne), the Shannon information index (I), the expected heterozygosity (He), and pairwise population PhiPT values (Fst) among the geographical groups. PCoA was also performed with the GenAlex 6.51 program[33]. At the germplasm level, the genetic similarity coefficient (Dice) was evaluated, and the Unweighted Pair Group Method with Arithmetic Mean (UPGMA) was conducted using the FREETREE software[34]. Based on bootstrap values (1,000 substitutions), Fig Tree V 1.4.3 was used to test the robustness of dendrograms[35]. The population structure was acquired using STRUCTURE software, and the optimal K value was determined using the CLUMMPP software[36−37].
-
After rigorous quality control and data filtering, 24,836,493 high-quality mean clean reads were obtained, and 272,328 transcripts were generated using the Trinity program (China National GenBank Data Base: CNX0602781). The clean reads contain over 97.93% of sequencing bases with quality scores at the Q20 level (an error probability of 0.1%) and over 90.08% at Q30. The mean GC content of generated sequence was 54.17% (Table 1). Based on these results, the sequencing data is of sufficient quality for further analysis. As shown in Fig. 1a and Supplemental Table S1, most transcripts were < 2,000 bp in length (215,33, 79.08%). There was a general decrease in transcript number with increasing transcript length, and most transcripts were approximately 500 bp in length (81,141, 29.08%), indicating that the combination exhibited high sequencing quality (Supplemental Tables S1 & S2).
Table 1. De novo transcriptome sequencing of reed canary grass.
Replicates Read Clean Size of clean Q20 (%) Q30 (%) GC (%) Length Reads pairs Base (bp) Sample1 150 24,378,713 7,313,613,900 97 89.45 53.8 Sample2 150 22,716,853 6,815,055,900 97.55 91.1 53.7 Sample3 150 27,431,912 8,229,573,600 97.05 89.7 55.1 Mean 150 24,842,493 7,452,747,800 97.2 90.08 54.2 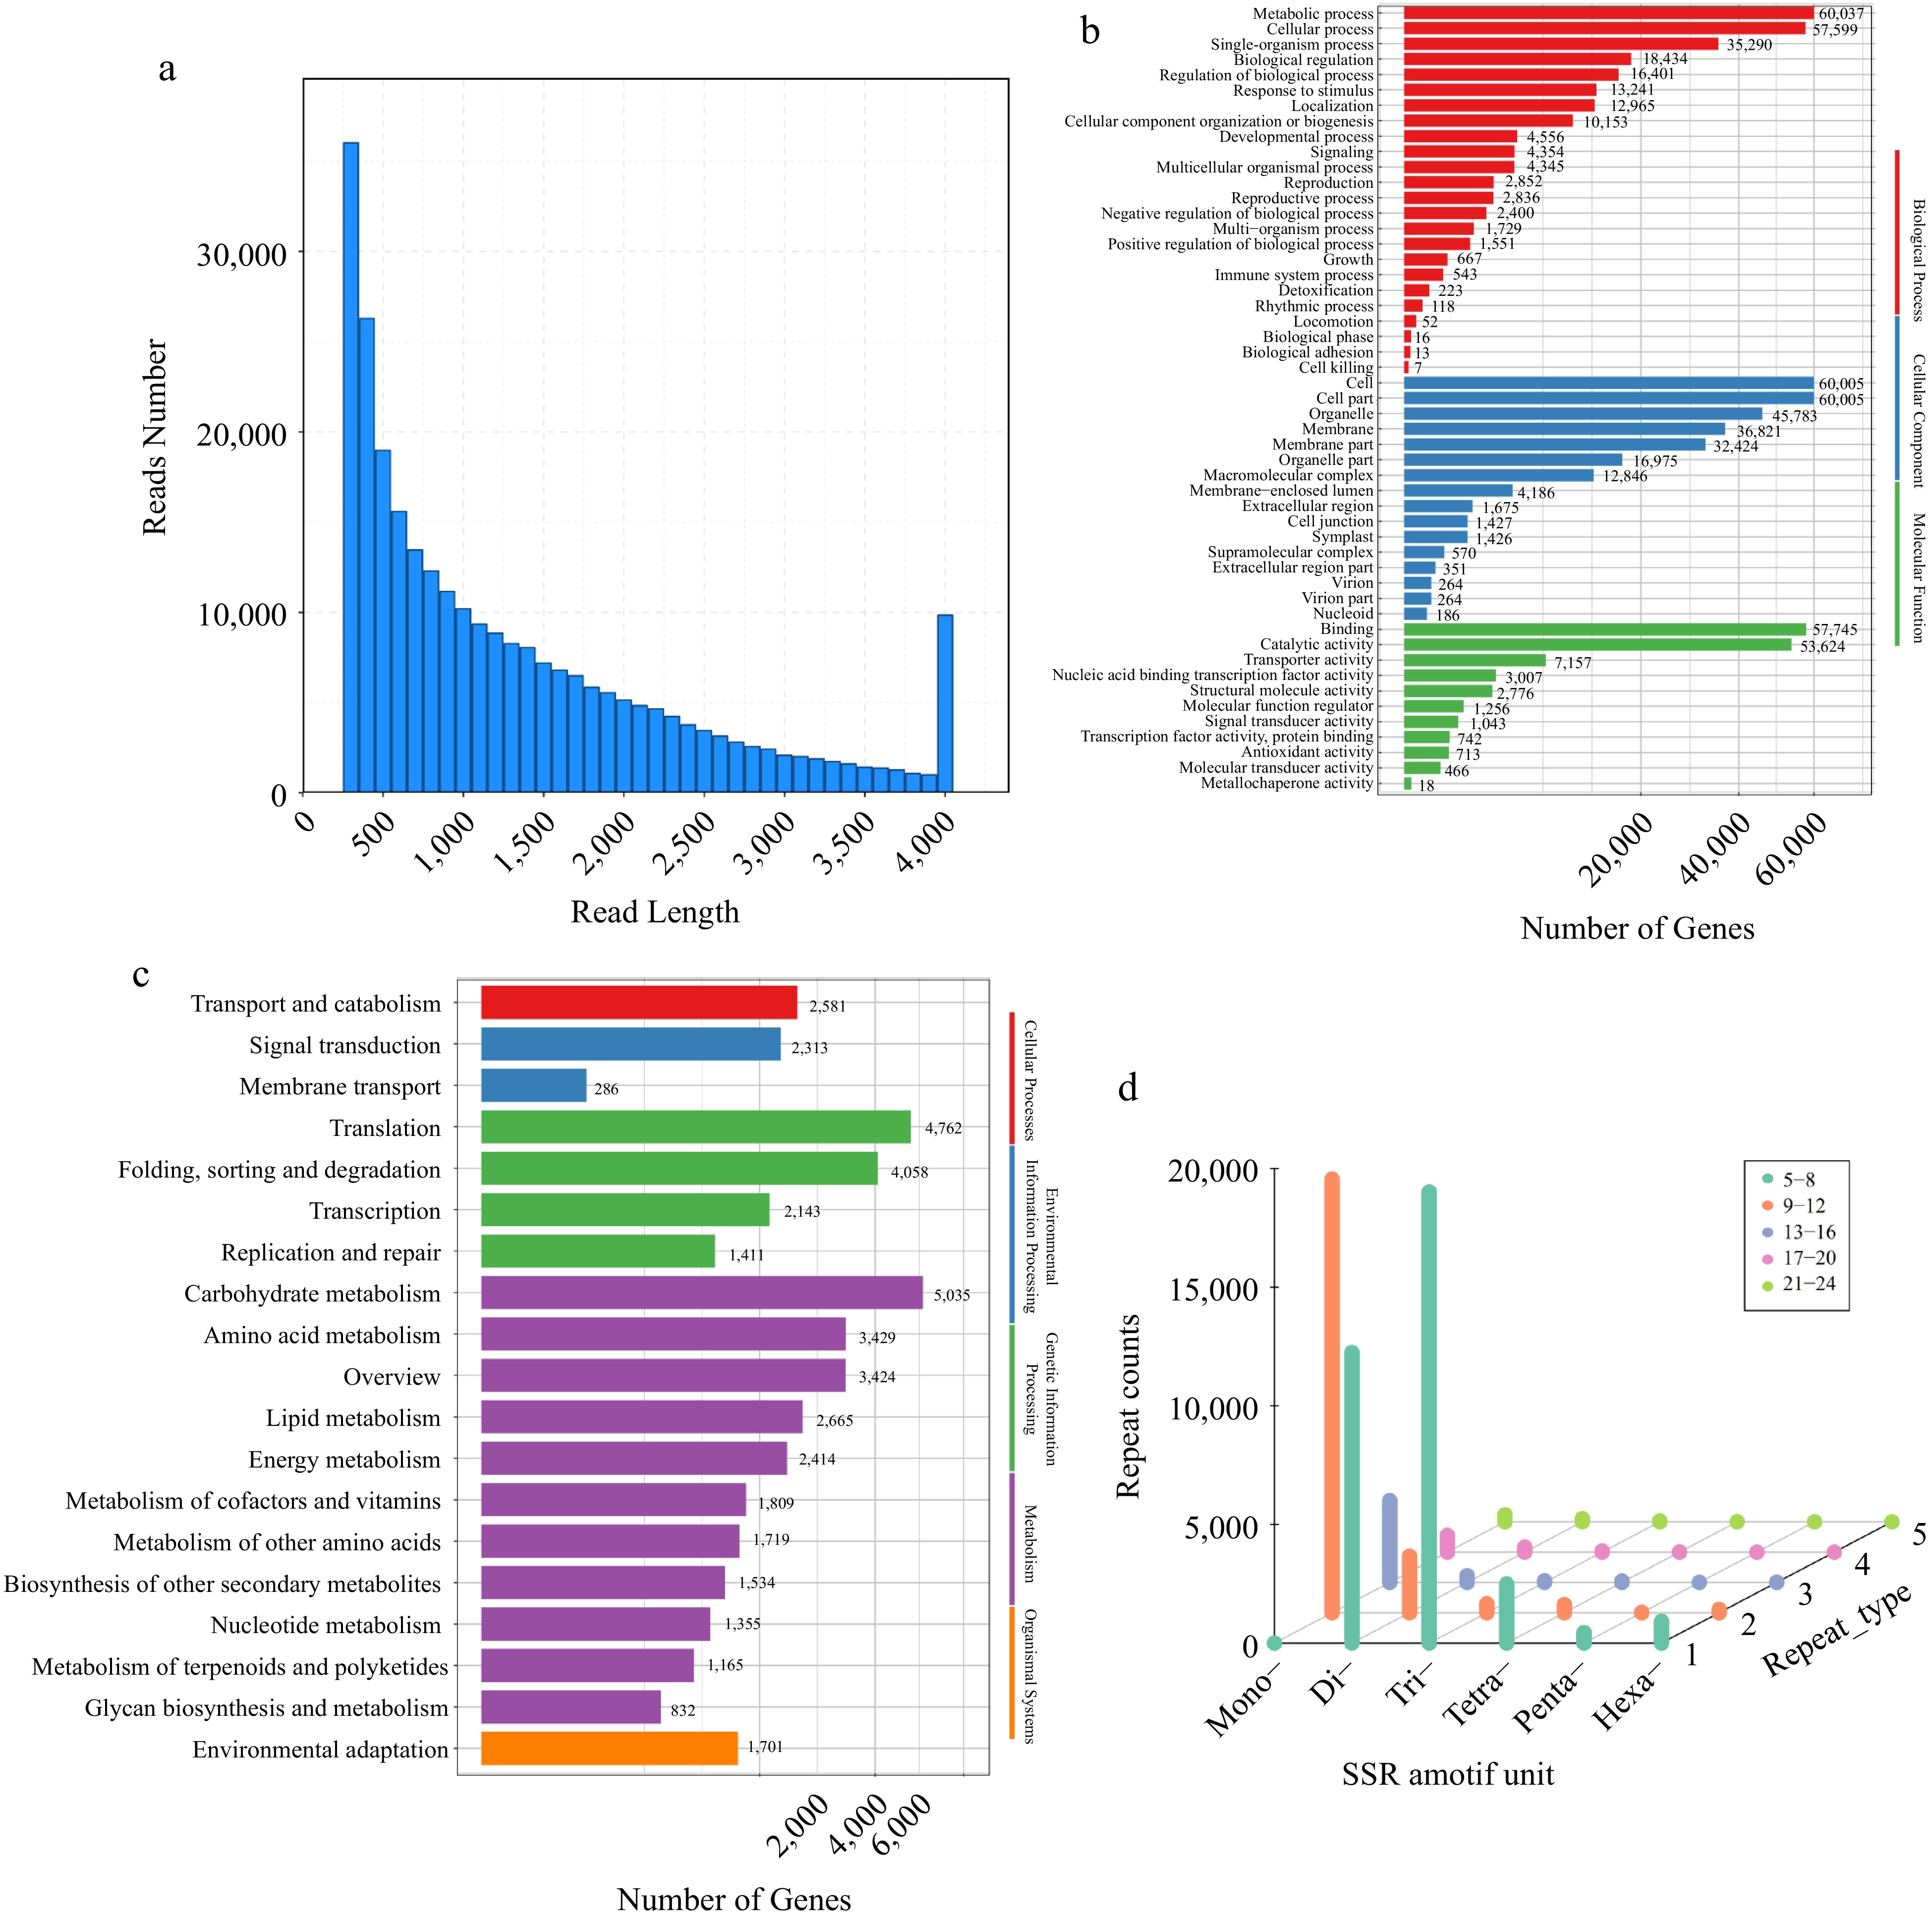
Figure 1.
Characteristics of reed canary grass transcripts. (a) Distribution of transcripts lengths in Phalaris. (b) Functional annotation of transcripts based on Gene Ontology (GO) categorization. (c) Top 19 KEGG pathways containing the most transcripts. (d) Distribution of six SSR repeat types in different genic regions.
Annotation and classification of Phalaris transcripts
-
Four databases, NR, Swiss-Prot Annotation, GO and KEGG, were used to perform the annotation using the BLASTX algorithm with an e-value of 1.0 × 10⁻⁵. A total of 272,328 transcripts were annotated in at least one of the aforementioned databases. In the NR database, 158,464 transcripts revealed a significant number of hits (e-value < 1× 10⁻⁵) of which 8,917 were related to Artibeus jamaicensis (Supplemental Table S3) The GO database, Swiss-Prot annotation and KEGG databases successfully annotated 110,631, 106,768 and 59,324 transcripts with known proteins. However, 113,242 (41.58%) transcripts did not match any sequence in the aforementioned four databases (Table 2).
Table 2. Annotation statistics of reed canary grass transcripts.
Database Number of transcripts Percentage Total 272,328 100% KOG 46,697 17.15% KEGG 59,324 21.78% NR 158,464 58.19% GO 110,631 40.62% Swiss-Prot 106,768 39.21% Unknown 113,24 41.58% The GO annotation results revealed that the major subcategories of the classified transcripts were 'metabolic processes' (60,037), 'cellular processes' (57,599), and 'single biological processes' (35,290) in 'biological processes'; 'cells' (60,005), 'cellular fractions' (60,005) and 'organelles' (16,975) in 'cellular components'; 'catalytic activity' (57,745) in 'molecular functions'; and 'binding' (186), and 'transporter activity' (7,157) (Fig. 1b). In the KEGG pathway, the most abundant pathways were 'transport and catabolism' (2,581), 'carbon metabolism' (5,035), 'biosynthesis of amino acids' (3,429), 'signal transduction' (2,313), 'transport and catabolism' (2,581), 'folding, sorting and degradation' (4,058), and 'environment adaptation' (1,701) (Fig. 1c).
Prediction of repeat motif types
-
A total of 50,155 potential SSRs were identified from 272,328 transcripts, with 1,936 sequences containing more than one SSR locus. Of the 50,155 SSRs, 1,936 were compound microsatellites (Table 3). The type and distribution of 50,155 potential SSRs were investigated. The most abundant repeat motif was mono-nucleotide SSRs (22,859, Fig. 1d), with the vast majority (45.58%) comprising A or T repeats, followed by Tri-type (34.42%) and Di-type (17.35%). AG/CT and CCG/CGG exhibited the highest proportion of the Di-motif and Tri-type occurrences (Fig. 2, Supplemental Table S4).
Table 3. Statistics of SSRs identified in reed canary grass transcripts.
SSR mining Number Total number of sequences examined 272,328 Total size of examined sequences (bp) 351,691,355 Total number of identified SSRs 50,155 Number of SSR containing sequences 41,925 Number of sequences containing more than 1 SSR 6,779 Number of SSRs present in compound formation 1,936 Distribution of SSRs in different repeat types Mono-nucleotide 22,859(45.58%) Di-nucleotide 8,702(17.35%) Tri-nucleotide 17,261(34.42%) Tetra-nucleotide 824(1.64%) Penta-nucleotide 318(0.63%) Hexa-nucleotide 191(0.38%) 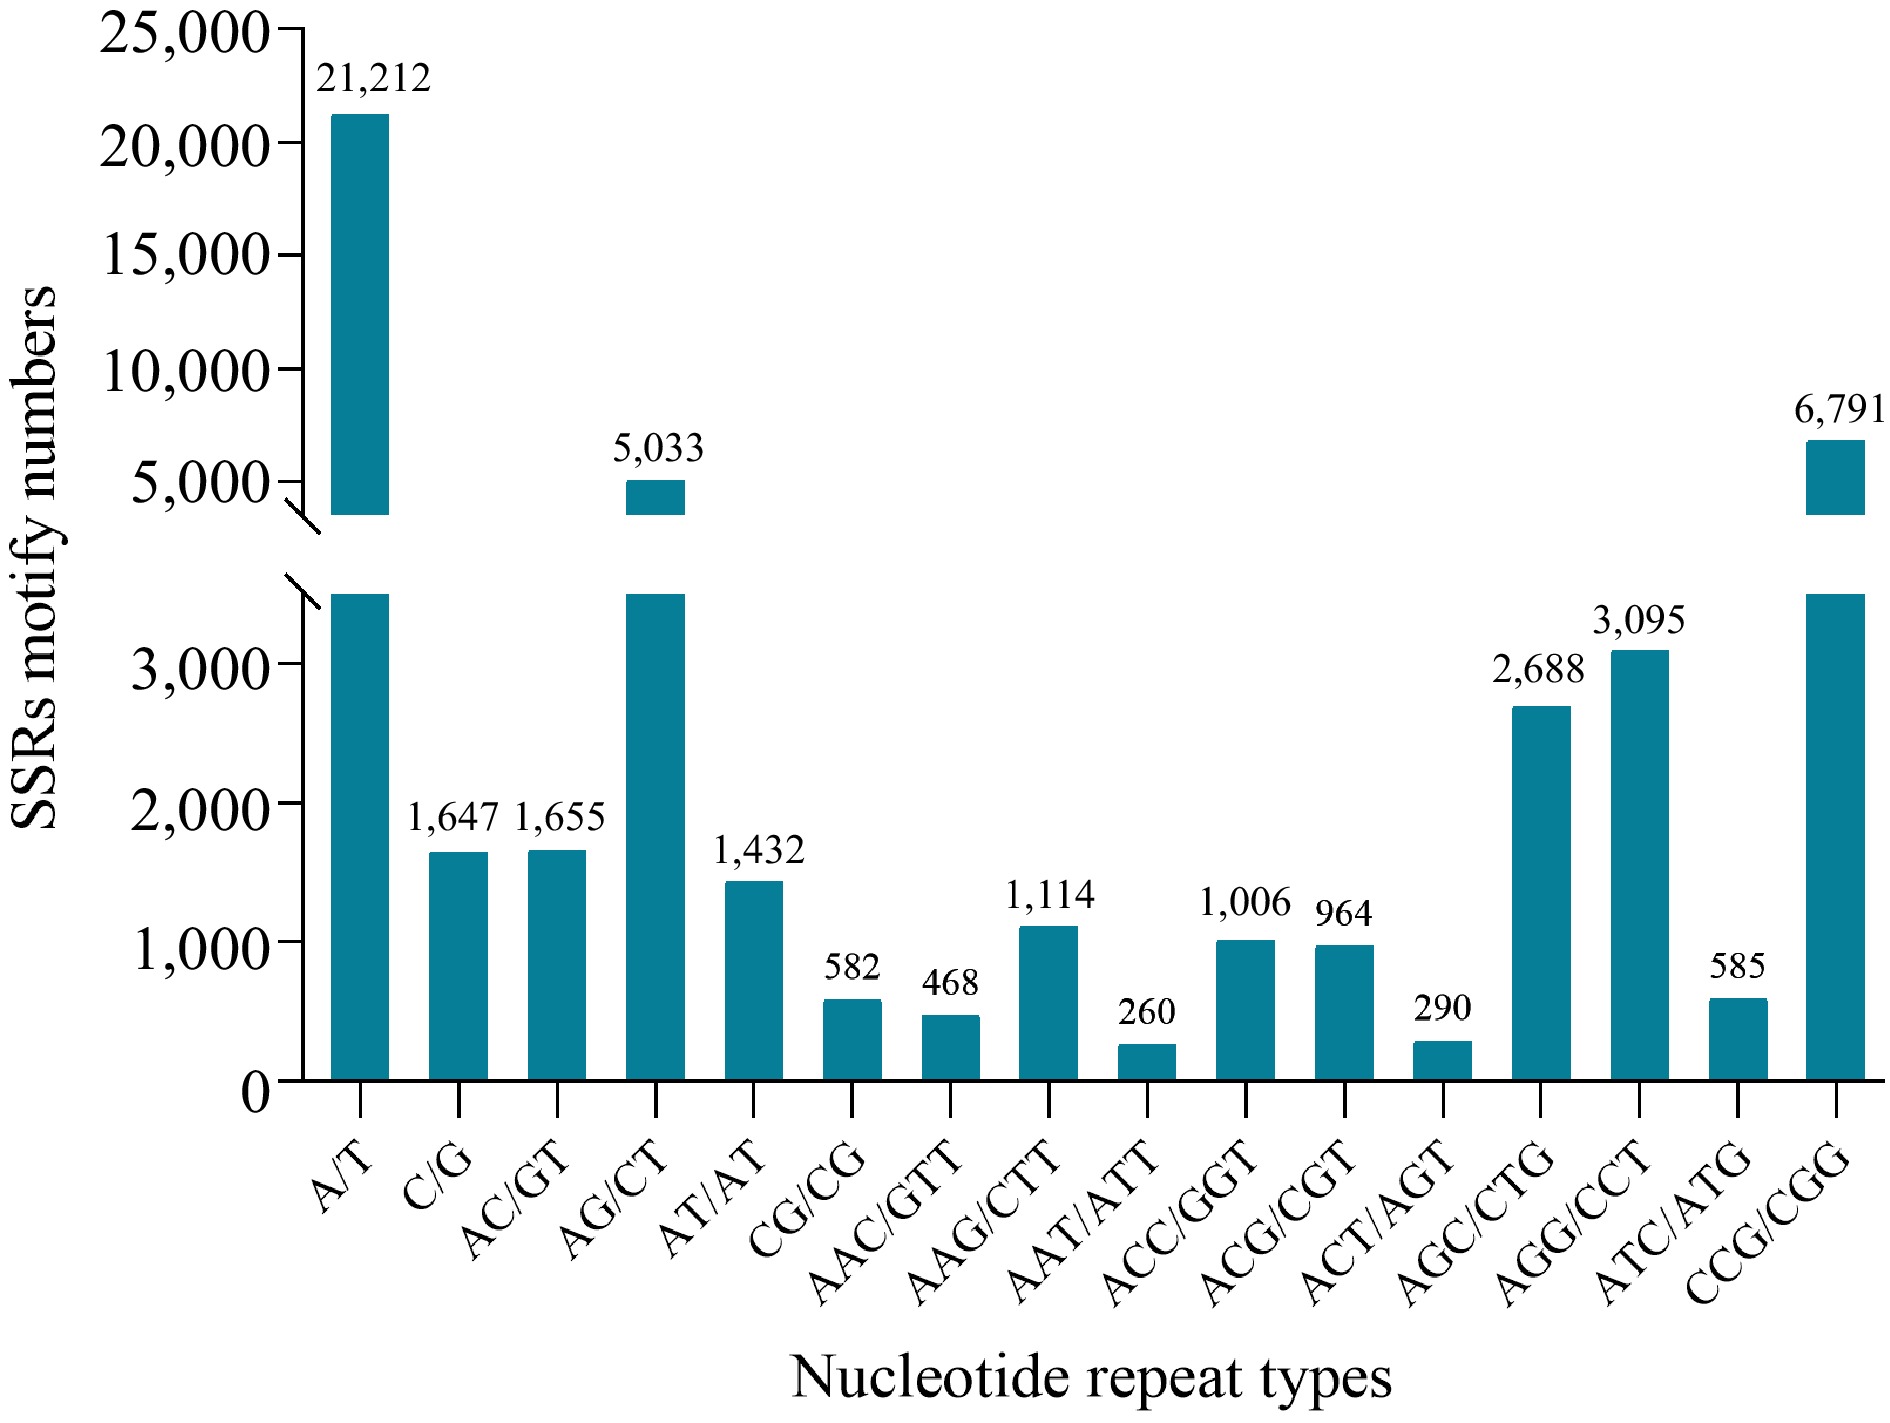
Figure 2.
Simple sequence repeats length distribution across different motif classification in reed canary grass.
Development and polymorphism identification of EST-SSR markers
-
Based on the predicted SSR markers, 300 EST-SSR primers were randomly selected and used for PCR amplification and polymorphism assessment (Supplemental Table S5). The amplification results revealed that 45 polymorphic markers (16.3%) were used to amplify the 19 reed canary grass accessions (Supplemental Tables S6 & S7). The transcripts for 45 markers were annotated, and major GO terms included 'integral component of membrane' and 'membrane' in 'Molecular Function'; 'ATP binding' in 'Biological Process' (Supplemental Fig. S1a). The KEGG annotation results revealed that the major KEGG subclass included 'Metabolism of cofactors and vitamin' and 'Biosynthesis of other secondary metabolites' in 'Metabolism' (Supplemental Fig. S1b). Supplemental Fig. S2 depicts the gel images of SSR1-SSR5. Forty-five SSR markers amplified 218 bands (TNB), and reliable polymorphic bands (NPB) amplified 216 bands (99.08%), which were amplified by each marker ranging from two (SSR17, SSR19, and SSR25) to 16 (SSR2) (Table 4). The percentage of polymorphic bands (PPB) of each marker ranged from 80% (SSR15) to 100% (SSR2, SSR3 and so on) in Table 4. Furthermore, the PIC (ranged from 0.37 to 0.43), MI (ranged from 0.75 to 4.12), Rp (ranged from 0.42 to 9.05), H (ranged from 0.38 to 0.500), and I (ranged from 0.49 to 0.72) of these 45 EST-SSR markers were high, suggesting that these markers have great application potential for the genetic study of Phalaris species (Table 4).
Table 4. Marker parameters calculated for each SSR primer combination used with reed canary grass accessions.
TNB NPB PPB% PIC MI Rp H I SSR1 10 9 90 0.39 3.47 5.79 0.47 0.59 SSR2 16 16 100 0.38 6.01 9.05 0.49 0.62 SSR3 9 9 100 0.38 3.45 4.42 0.48 0.60 SSR4 6 6 100 0.39 2.31 2.21 0.47 0.49 SSR5 8 8 100 0.37 2.99 4.32 0.50 0.62 SSR6 7 7 100 0.37 2.62 4.00 0.50 0.61 SSR7 6 6 100 0.39 2.36 3.37 0.46 0.59 SSR8 7 7 100 0.39 2.70 3.26 0.47 0.59 SSR9 10 10 100 0.38 3.83 3.89 0.48 0.59 SSR10 7 7 100 0.38 2.63 3.68 0.49 0.63 SSR11 11 11 100 0.37 4.12 6.11 0.50 0.61 SSR12 7 7 100 0.38 2.64 4.21 0.49 0.67 SSR13 7 7 100 0.41 2.86 3.37 0.42 0.66 SSR14 9 9 100 0.38 3.45 4.32 0.48 0.6 SSR15 5 4 80 0.39 1.56 2.63 0.47 0.57 SSR16 6 6 100 0.37 2.24 1.05 0.50 0.56 SSR17 2 2 100 0.37 0.75 0.42 0.50 0.48 SSR18 5 5 100 0.41 2.07 1.16 0.41 0.63 SSR19 2 2 100 0.40 0.79 1.05 0.45 0.61 SSR20 3 3 100 0.39 1.17 1.26 0.47 0.59 SSR21 3 3 100 0.40 1.21 1.16 0.43 0.52 SSR22 3 3 100 0.37 1.12 1.37 0.50 0.62 SSR23 5 5 100 0.39 1.97 2.74 0.45 0.6 SSR24 3 3 100 0.39 1.18 2.11 0.46 0.72 SSR25 2 2 100 0.38 0.77 1.05 0.48 0.64 SSR26 2 2 100 0.38 0.76 0.95 0.49 0.61 SSR27 3 3 100 0.39 1.18 0.74 0.46 0.53 SSR28 2 2 100 0.38 0.76 1.58 0.49 0.66 SSR29 2 2 100 0.40 0.79 1.05 0.45 0.61 SSR30 4 4 100 0.39 1.57 2.11 0.46 0.56 SSR31 3 3 100 0.37 1.12 2.53 0.50 0.66 SSR32 2 2 100 0.41 0.83 1.16 0.41 0.72 SSR33 3 3 100 0.38 1.13 2.84 0.49 0.7 SSR34 2 2 100 0.40 0.79 1.05 0.45 0.56 SSR35 5 5 100 0.39 1.95 3.58 0.47 0.64 SSR36 3 3 100 0.38 1.14 1.58 0.49 0.62 SSR37 2 2 100 0.37 0.75 1.89 0.50 0.7 SSR38 2 2 100 0.38 0.75 1.05 0.49 0.64 SSR39 6 6 100 0.38 2.30 4.63 0.48 0.72 SSR40 5 5 100 0.43 2.13 1.79 0.38 0.52 SSR41 4 4 100 0.39 1.57 2.42 0.46 0.6 SSR42 2 2 100 0.38 0.76 1.58 0.49 0.71 SSR43 2 2 100 0.40 0.79 0.84 0.45 0.5 SSR44 2 2 100 0.38 0.76 1.68 0.49 0.67 SSR45 3 3 100 0.39 1.16 1.58 0.47 0.6 Total 218 216 99.08 0.37 80.74 114.63 0.50 0.61 Mean 4.84 4.80 99.33 0.39 1.85 4.98 0.47 0.61 MI, marker Index; Rp, resolving power; I, Shannon information index; H, heterozygosity. Clustering, population structure, and PCoA analysis
-
Genetic similarities among the tested accessions were calculated, and an unrooted UPGMA dendrogram was created. Nineteen germplasm were divided into three clusters based on their average genetic similarity values (0.9207) (Cluster I, Cluster II, and Cluster III; Fig. 3; Fig. 4). Overall, the clustering results were correlated with geographic origin, with Cluster I including six accessions from North America (NoA), four accessions from Europe (EU), and two accessions from Asia (AS); Cluster II consisting of five accessions from NoA; Cluster III consisting of bulbous canary grass (P. aquatica). (Fig. 3; Fig. 4). Structural software was used to assess the genetic membership of the studied accessions based on Bayesian models (Fig. 3; Supplemental Fig. S3). According to Evanno's method, the optimal K value was three (Supplemental Fig. S3).

Figure 3.
Unweighted Pair Group Method with Arithmetic (UPGMA) tree of the 19 accessions (the reliability of the clustering results is indicated by a bootstrap support value of more than 50% for each main branch of the clustering tree map) and genetic relationship among reed canary grass accessions using a Bayesian analysis.
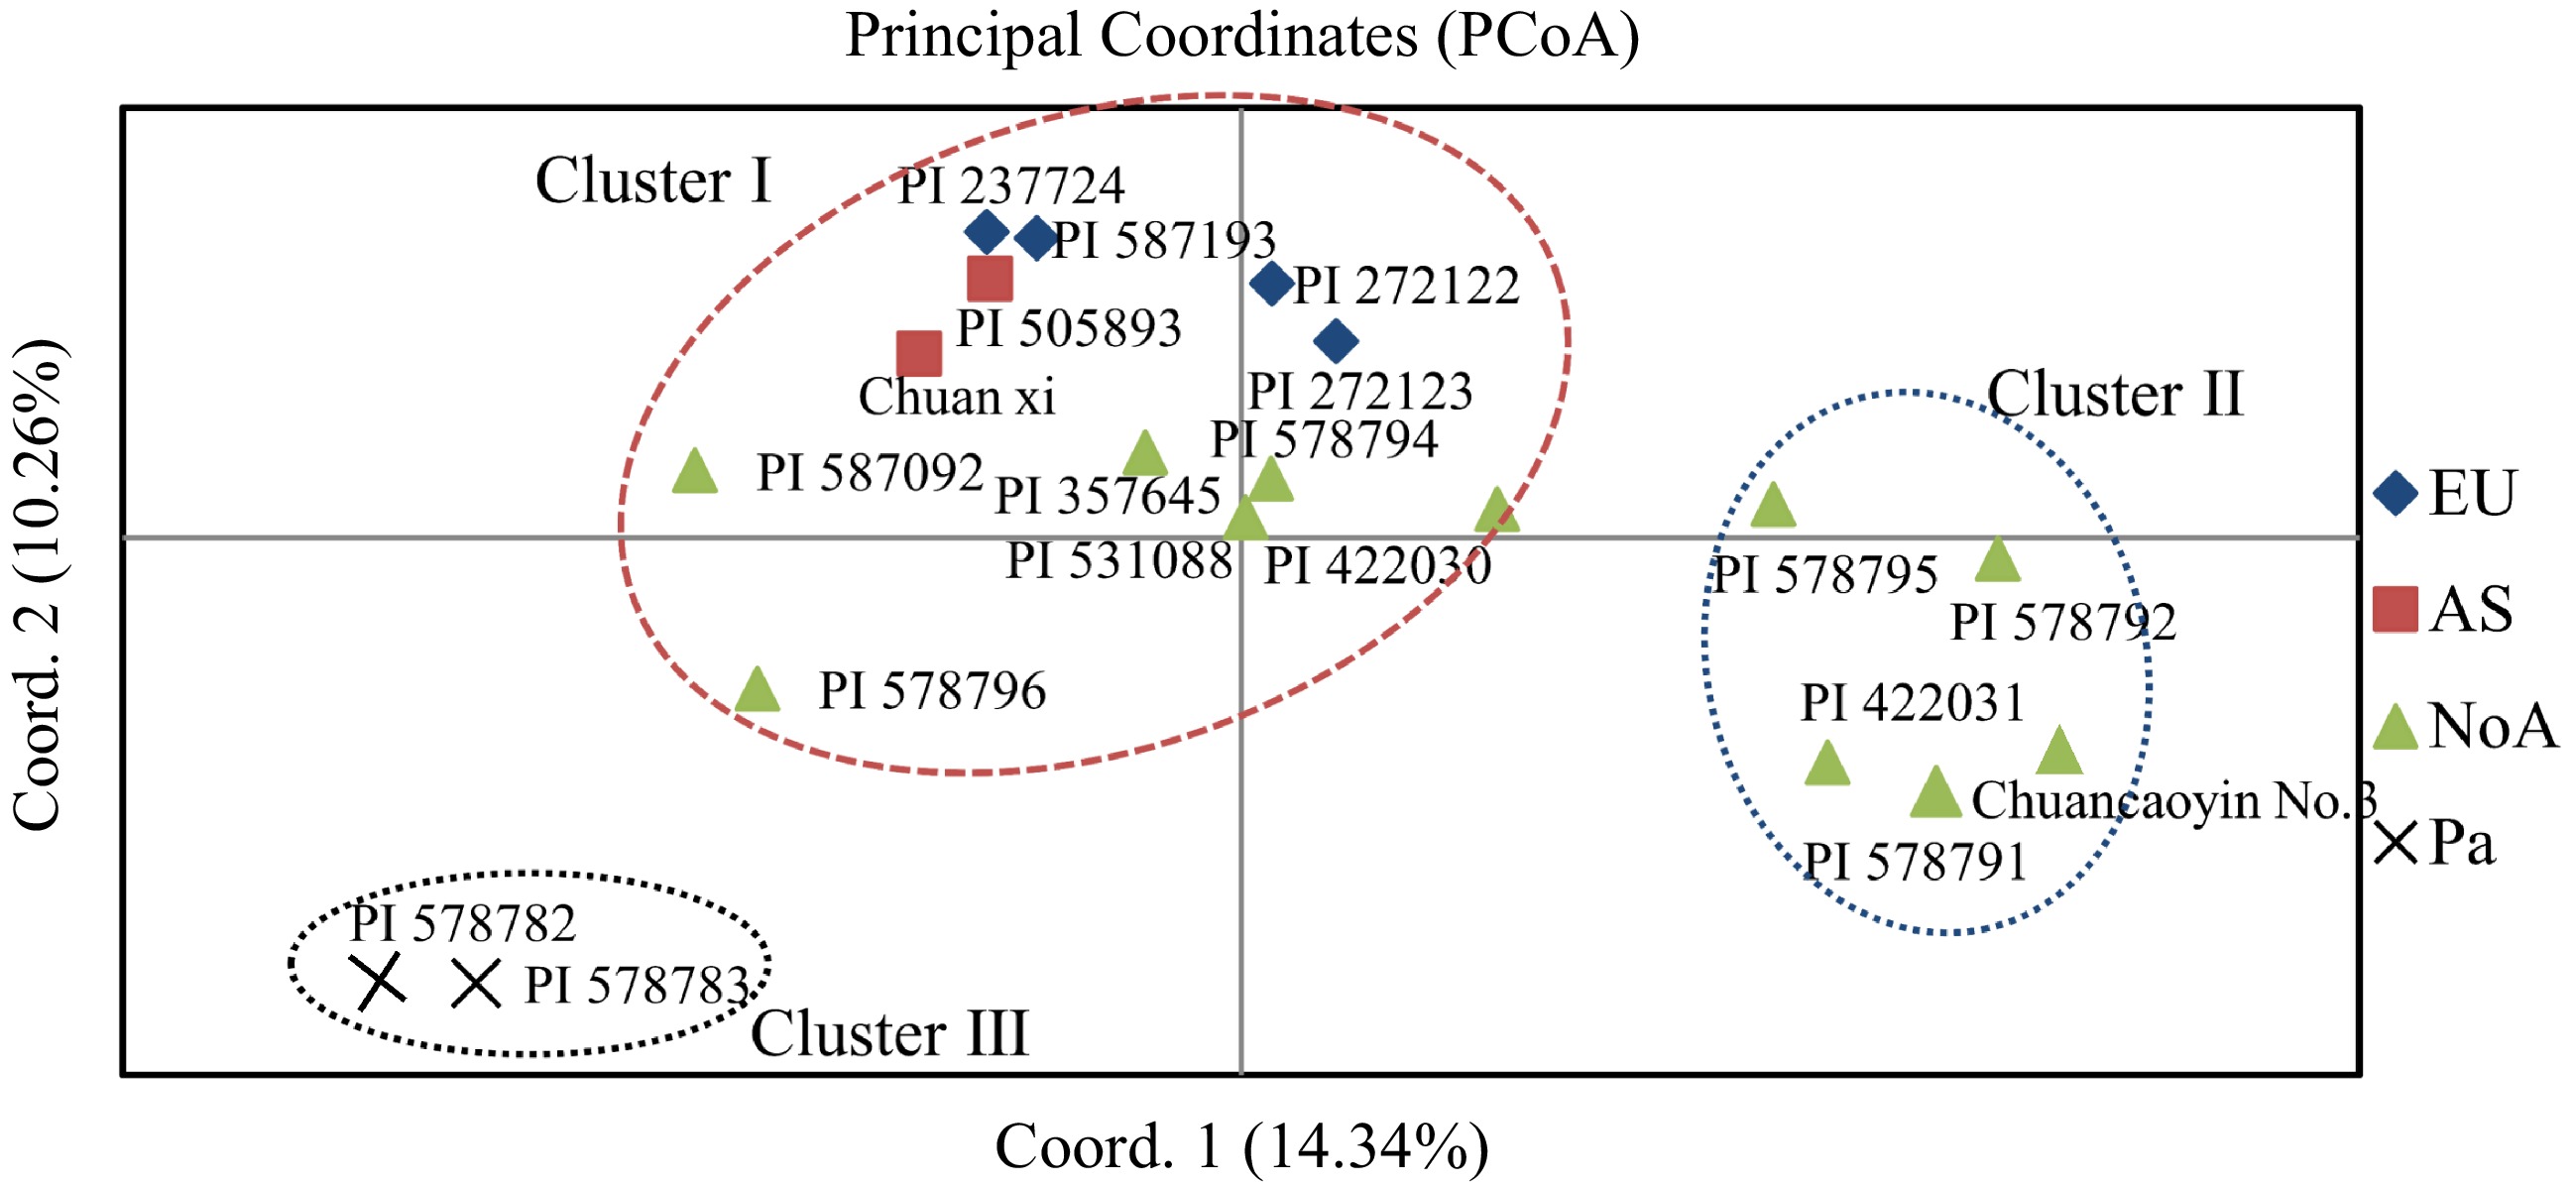
Figure 4.
Principal coordinate analysis (PCoA) showing the relationships of the reed canary grass accessions.
Genetic diversity indexes of geographic groups and their diversity indexes
-
Based on the geographical origin of all germplasms, all 19 accessions were divided into four geographical groups: NoA, EU, AS, and Pa, with NoA consisting of 11 reed canary grass accessions from North America, EU consisting of four from Europe, AS consisting of two from Asia, and Pa consisting of two bulbous canary grass accessions. NoA exhibited the highest level of genetic diversity (Na = 1.955, Ne = 1.577, I = 0.512, He = 0.341, P = 96.53%; Table 5), followed by the EU, AS, and Pa groups (Table 5 & Supplemental Table S6). AMOVA is usually used to test the effect of geographic origin on the genetic variation of different germplasm. Among the total genetic variation, 2% was attributed to variation among geographic populations, while 98% was due to variation among germplasm within populations (p < 0.05; Table 6; Supplemental Fig. S4). The mean fixation index (Fst) of the three groups revealed a moderate genetic differentiation (Fst = 0.023; Table 6).
Table 5. Different genetic diversity estimates for four geographical groups of reed canary grass accessions.
Geographical group N Na Ne I He P NoA 11.000 1.955 1.577 0.512 0.341 96.53% EU 4.000 1.495 1.432 0.358 0.244 62.38% AS 2.000 0.866 1.168 0.144 0.098 23.76% Pa 2.000 0.891 1.175 0.150 0.103 24.75% N, Individual number of populations; Na, No. of different Alleles; Ne, No. of effective alleles; I, Shannon information index; He, Expected heterozygosity; P, Genetic variation. Table 6. Analysis of molecular variance (AMOVA) among and within geographical groups of reed canary grass accessions.
Source of variation df SS MS Est. Var. PMV (%) Fst P Among pops 2 4.410 2.205 0.046 2% 0.023 0.143 Within pops 14 28.040 2.003 2.003 98% Total 16 32.450 2.049 100% df, degree of freedom; SS, square deviation; MS, mean square deviation; Est.Var, exist variance; Fst, coefficient of genetic differentiation; PMV, Percentages of molecular variance. Data availability statement
-
The Illumina NGS reads generated in this study were submitted to China National GenBank Data Base (Accession No. CNX0602781).
-
Reed canary grass was promoted extensively as a high-yielding forage species on the northwest Sichuan plateau (China). It has superior flooding tolerance compared with other grass species, making it one of the most important grass species suitable for wetland restoration. Several germplasms of reed canary grass have been discovered on the western Sichuan plateau, resulting in cultivated or wild domesticated varieties[38]. However, because of a lack of genomic information, there are few reports on the development of molecular markers, which is unfavorable to the assisted breeding process[39]. In the present study, polymorphic EST-SSR markers were developed via the transcriptome sequencing of reed canary grass; these markers are crucial for the future genetic improvement of this ecologically and economically important plant. The identified transcripts and annotated pathways facilitate further research into the genetics of Phalaris species.
EST-SSR profiles in the transcriptome
-
EST-SSR is essential in investigating species' genetic diversity and molecular breeding[24]. EST-SSRs are closely connected to functional genes compared with G-SSRs, and EST-SSRs which usually have fewer alleles and higher transferability. In genetic diversity studies of E. excelsus, EST-SSRs have a higher generalizability (30.61%) than G-SSRs (17.86%)[40]. Based on the transcriptome sequencing of reed canary grass, we predicted an abundance of SSR loci (50,155 SSRs), and the frequency of SSR (18.42%) is much higher than that obtained from E. sibiricuss (8.19%, 1/6.95 kb)[22] and Leymus chinensi (4.38%, 1/10.78 kb)[41]. The A/T and CCG/CGG enrichment tendencies of single and trinucleotide motifs are consistent with those of eukaryotes[42]. The most abundant dinucleotide repeat motif was AG/CT (72.90%), which is also consistent with the results of Lolium multiflorum[41].
Detection and validation of EST-SSR markers
-
The aforementioned EST-SSR markers were used to study the genetic diversity of 19 reed canary grass accessions. Therefore, the present study is the first to develop SSR markers and identify and differentiate 19 accessions in various geographical regions. In this study, 45 polymorphic EST-SSR markers were identified with a higher percentage of polymorphic bands (an NPB mean of 62.15%) than most grass species, such as Elymus excelsus[10] and Bromus japonicus[43]. PIC, which is an essential index for distinguishing dominant markers, theoretically ranges from 0 to 0.5[31]. In this study, the mean PIC of the 45 SSR markers was 0.364. MI and Rp were correlated with primer identification ability. Furthermore, the mean values of MI and Rp were 0.951 and 0.956, respectively. These findings indicate that the developed markers have the potential to elaborate on the genetic diversity of Phalaris species. Among the 45 EST-SSR markers, SSR12 (PIC = 0.405, MI = 1.216, Rp = 1.143), SSR39 (PIC = 0.469, MI = 1.407, Rp = 1.211), and SSR42 (PIC = 0.465, MI = 0.931, Rp = 1.158), which exhibited high PIC, MI, and Rp values—served as optimal SSR primers for germplasm identification of reed canary grass.
Genetic diversity and population structure of Phalaris accessions
-
Cluster analysis and genetic structure are essential to studying germplasm genetic relationships[44]. Nineteen accessions were identified using UPGMA and PCOA as Cluster I, Cluster II, and Cluster III. The genetic structure patterns of the three clusters were also different from each other, which roughly correspond to their geographical sources. However, Cluster I comprised six accessions from NOA, four from EU, and two from AS. The findings suggest that geographical isolation does not necessarily lead to substantial genetic differentiation. By contrast, convergent evolution because of similar habitat conditions may account for the greater genetic similarity between geographically distant accessions[45]. It is also possible that these few abnormally clustered germplasms were historically introduced elsewhere. In the present study, two bulbous canary grass were identified as Cluster III, demonstrating that 45 newly developed SSR markers in other Phalaris species are reliable and have broad application value. Meanwhile, population structure was analyzed using structural software. The optimal K value for the analysis was three and revealed three genetic backgrounds because genetic drift, mutations, gene flow, and natural selection have weakened the structural program[46]. The genetic diversity analysis revealed that NOA (He = 0.341) had higher genetic diversity than EU (He = 0.244), AA (He = 0.274), and Pa (He = 0.103). The AMOVA analysis revealed a moderate genetic variation (Fst = 0.023, p < 0.05) between the three geographic groups, which can be attributed to two factors: firstly, the self-pollinating characteristics of the reed canary grass[47], and secondly, EST-SSRs are derived from transcripts that, despite their excellent transferability, are relatively conserved among different materials, so this conservation is due to the essential life functions for which the transcripts of the EST-SSR sources screened are responsible, including the survival and reproduction of the species[43].
-
In this study, transcriptome sequencing of reed canary grass was performed, and the transcripts were de novo assembled. A total of 272,328 non-redundant transcripts containing SSRs were annotated in several databases, which were associated with several biological processes. A total of 50,155 EST-SSR were identified from the assembled transcripts, and 300 EST-SSR markers were randomly selected for validation. Therefore, 45 SSR markers demonstrated high polymorphism, stable amplification, easy identification of amplified bands, and stability between accessions, thereby filling a gap in the development of SSR primers based on the transcriptome of reed canary grass.
This research was funded by Supported by the Sichuan Science and Technology Program, grant number 2022YFN0035; Sichuan Beef Innovation Team Project, grant number sccxtd-2019-13; Sichuan Forage Innovation Team Project, grant number sccxtd-2020-16; Sichuan Forestry and Grassland Science and Technology Innovation Team Special Funding of China, grant number LCTD2023CZ01; Sichuan Province '14th Five-Year Plan' Forage Breeding Research Project of China, grant number 2021YFYZ0013-2, and National Forage Industry Technology System Aba Comprehensive Experimental Station of China, grant number CARS-34.
-
The authors declare that they have no conflict of interest.
-
# These authors contributed equally: Xuejie Jia, Yi Xiong
- Supplemental Fig. S1 Transcripts annotation of 45 markers in GO and KEGG database.
- Supplemental Fig. S2 Polymorphism primer gel of SSR1-SSR5.
- Supplemental Fig. S3 STRUCTURE analysis, DeltaK and rate of change of the likelihood distribution.
- Supplemental Fig. S4 Percentages of Molecular Variance of reed canary grass accessions.
- Supplemental Table S1 Transcript assembly length frequency distribution of Phalaris arundinacea.
- Supplemental Table S2 Transcript assembly length frequency distribution.
- Supplemental Table S3 NR database annotations to the top 10 species by number of transcripts.
- Supplemental Table S4 Simple sequence repeats length distribution across different motify classification in reed canary grass.
- Supplemental Table S5 Randomly selected 300 primer sequences.
- Supplemental Table S6 Selection of primer sequences with polymorphism.
- Supplemental Table S7 Geographical origin and grouping of 19 material.
- Copyright: © 2023 by the author(s). Published by Maximum Academic Press, Fayetteville, GA. This article is an open access article distributed under Creative Commons Attribution License (CC BY 4.0), visit https://creativecommons.org/licenses/by/4.0/.
-
About this article
Cite this article
Jia X, Xiong Y, Xiong Y, Ji X, Li D, et al. 2023. Transcriptomic sequencing analysis, development, and validation of EST-SSR markers in reed canary grass. Grass Research 3:17 doi: 10.48130/GR-2023-0017 

Transcriptomic sequencing analysis, development, and validation of EST-SSR markers in reed canary grass
- Received: 27 April 2023
- Accepted: 04 August 2023
- Published online: 05 September 2023
Abstract: Reed canary grass (Phalaris arundinacea L.) is a promising high-yield cool-season forage with significant ecological application potential in wastewater treatment and wetland restoration. Transcriptome sequences can rapidly assay and characterize a few gene-based microsatellites from various plants. Here, the transcriptome of reed canary grass was sequenced, and 50,155 putative EST-SSRs were identified from 272,328 transcripts, with tri-nucleotide being the most abundant type, followed by mono-nucleotide. A total of 300 EST-SSR markers were randomly selected, among which 45 polymorphic EST-SSR markers were used for the genetic diversity study of 17 reed canary grass accessions (P. arundinacea L.) and two accessions of related bulbous canary grass (P. aquatica L.). A total of 218 bands were amplified using 45 SSR markers; the reliable polymorphic bands were 118 (54.13%), the average of the polymorphic information content was 0.36, and the RP value was 0.96. In summary, the transcriptome sequences of reed canary grass contribute to gene prediction and promote molecular biology and genomics studies, whereas polymorphic SSR markers promote molecular-assisted breeding and related studies of Phalaris species.
-
Key words:
- Phalaris arundinacea L. /
- Transcriptome sequencing /
- EST-SSR markers /
- Genetic diversity