


-
Plant growth and development are affected by different factors such as temperature, drought and disease during growth. In order to adapt to different living environments and avoid adverse effects, during the evolutionary process plants have established self-defense mechanisms[1]. Heat shock proteins (HSPs) are a kind of stress protein synthesized by plants in adverse environments or at specific developmental stages. They protect cells in adversity through molecular chaperone mechanisms, thereby increasing plant tolerance. HSPs are classified into five categories: small molecule heat shock proteins (HSP20), HSP60, HSP70, HSP90 and HSP100[2]. HSP20 is the major family of HSPs induced by elevated temperature associated stress in plants. It is also the smallest member of the HSP family in terms of molecular weight, with a molecular mass of 12−43 kDa[3]. It contains a highly conserved alpha-crystalline domain (ACD) consisting of 80−100 amino acid residues, a highly variable C-terminal and a highly conserved N-terminal. HSP20s are ATP-independent molecular chaperones, which can form oligomeric protein complexes of 200−800 kDa[4]. Unlike other HSP families, the HSP20 gene family exhibits extensive sequence variability and evolutionary divergence[5]. The HSP20 gene family members have been investigated in many plants, such as Arabidopsis thaliana[6], Oryza sativa[7], Glycine max[8], Triticum aestivum[9] and Vitis vinifera[10]. Meanwhile, the function of heat stress tolerance has been characterized in a few plants[3], the relevant studies have confirmed that HSPs produced by plants at high temperatures can protect their proteins from damage or repair proteins that have been damaged, thus playing a protective role for plants. In the study of G. max, four genes: GmHsp22.4, GmHsp17.6B, GmHsp17.9B and GmHsp16.2B with at least one putative W-box site known to function as cis-elements in HSP20 genes, were induced by high temperature[8]. Overexpression of NnHSP17.5 from Nelumbo nucifera in A. thaliana enhanced seed germination vigor and seedling heat tolerance[11], and overexpression of GhHSP24.7 from Gossypium hirsutum both in A. thaliana and Lycopersicon esculentum could also accelerate seed germination[12], indicating their conserved functions in different plants. In Castanea sativa, CsHSP17.5 was constitutively expressed in stems, and up-regulated by temperatures during the growth season[13]. However, little information of the HSP20 gene family is known in tree peony.
Tree peony (Paeonia suffruticosa), is a perennial woody plant in Paeonia, Paeoniaceae, is famous for its colorful and splendid flowers and considered as 'King of Flowers' in China[14, 15], meanwhile, it also has multi-functional use as a traditional medicine component and food source. From the outside to the inner part of the flowers, it consists of sepals, petals, stamens and carpels with various floral organ numbers, which is a unique trait to understand the species formation and systematic position of Paeoniaceae, and knowledge of floral organs is one of the keys to reproductive success during domestication and breeding[16]. In most plants, carpel number is a crucial determinant of fruit morphology, size and yields, and has significant economic implications, i.e. in L. esculentum and Cucumis sativus. In tree peony, the number of carpels was from 0 to 15 with variation of different cultivars, which has a negative relationship with petal number, while is positively related to stamen number[16]. These traits are controlled by a complicated genetic basis, and affected by its living environment. The whole gene sequencing of P. ostii was completed[17], making it possible to excavate and identify key genes including the HSP20 gene family at the whole genome level for future breeding and genetic study. The comprehensive identification and analysis of HSP20 gene family structure and function is of great significance to reveal the molecular mechanism involved in growth, flower development and stress tolerance of tree peony.
With the rapid development of sequencing technologies, association analysis has become widely applied in plants. The association between genetic markers and quantitative traits allows for the identification of effective quantitative trait locus (QTLs) and facilitates the discovery of superior alleles, as well as strengthens the understanding of the molecular biological basis of quantitative traits, thus providing gene resources for crop genetic improvement[18]. Great progress has been made on association analysis in characterizing traits in horticultural plants, such as amino acid content in tea plants[19], genotype identification in lettuce[20], white rust resistance in chrysanthemum[21], phytochemical production and red skin color in apple[22]. The genome-wide association study (GWAS) was preliminarily used in tree peony for characterizing flowering phenology traits, floral agronomics[23] and oil traits in the aspects of unsaturated fatty acid biosynthesis[17]. In our former study, the diversity of floral organ number and genetic variation were analyzed based on GWAS and expression quantitative trait locus (eQTL) from 119 tree peony cultivars, which indicated the abundant genetic variation and complicated molecular mechanism[16]. In some complicated genomes of plants, except GWAS, candidate gene association (CGA) analysis based on coding sequences (CDS) variation is also an effective approach to discovering phenotypic polymorphism. In barley, single nucleotide polymorphisms (SNPs) of the coding region of HSP17.8 were investigated across 210 accessions, among which 10 SNPs were detected, and four SNPs were found associated with the number of grains per spike, thousand kernel weight, plant height, flag leaf area and leaf color[24], which provided new insights for understanding the gene's function on potential contributions to drought tolerance and development. However, there is no attempt to analyze the association of phenotypic traits based on single coding gene sequence variation in tree peony. Therefore, performing association analysis of gene polymorphism and important floral traits in tree peony can provide a novel opportunity for elucidating the variation mechanism and facilitating molecular marker-assisted breeding.
In this study, we first identified all members of the HSP20s in the entire genome of P. ostii, and then analyzed the physical location in the five chromosomes, phylogenetic relationships, and gene structure. Secondly, the transcription level and expression characteristics of HSP20s were further analyzed from the transcriptome of flower buds from P. ostii plants with various number of carpels at three developmental stages. Coding sequences variation of two members of HSP20s was used for association analysis with the floral organ number in 271 tree peony cultivars. This study will illuminate the function in flower development of the HSP20s in tree peony, and the identified loci in candidate genes would be useful for molecular marker assisted selection in future breeding and genetic improvement.
-
Flower buds of P. ostii plants with 5-carpels and polycarpels (6−8 carpels, P) were collected in Qianxi County, Tangshan City, Hebei Province, China (39°58' N, 118°24' E) from Jul. to Oct. in 2019 at three developmental stages[16]: stage a, sepals and a few petal primordia appeared; stage b, stamen primordia initiated; stage c, carpel primordia initiated. The external scales of buds were quickly removed and rapidly frozen in liquid nitrogen, then stored at −80°C.
Tree peony cultivars (271) were planted in the Peony Resource Garden of Luoyang Academy of Agriculture and Forestry Sciences in Luoyang City, Henan Province, China (112°28' E, 34°28' N) , data of floral organ number (carpel number, CN; petal number, PeN; stamen number, SN) were collected in Apr. 2019 and 2020[16]. Fresh leaves were used for gene cloning.
Identification of HSP20s in P. ostii genome and gene structure analysis
-
The genome protein database of P. ostii was downloaded from
https://ftp.cngb.org/pub/CNSA/data5/CNP0003098/CNS0560369/CNA0050666/ . The amino acid sequences of HSP20s in A. thaliana as reference were obtained from TAIR (www.arabidopsis.org ). Then, the sequences of PoHSP20s and AtHSP20s were used for bidirectional blast alignment to get possible members using TBtools software[25], and ACD analysis was conducted through the NCBI website. MapChart software[26] was used for mapping chromosomal positions and relative distances. Gene structure of PoHSP20s were analyzed using TBtools software.Physicochemical properties analysis and conserved motif prediction of PoHSP20s
-
The basic physicochemical properties of PoHSP20s were predicted by the ProtParam tool (
http://www.expasy.org/tools/protparam.html ). The subcellular localization of PoHSP20s was predicted through the WoLF PSORT website (https://wolfpsort.hgc.jp/ ). The amino acid sequences of PoHSP20 were submitted to the MEME online website (https://meme-suite.org/meme/tools/meme ) for motif analysis, with maximum 10 motifs.Phylogenetic analysis of HSP20s
-
Sequences of HSP20s from G. max, A. thaliana and O. sativa were downloaded from the Ensembl Plants Database (
http://plants.ensembl.org/index.html ) or TAIR. Combined with the amino acid sequences of PoHSP20s, an unrooted maximum likelihood (ML) phylogenetic tree was constructed using IQ-TREE v1.6.12[27]. PoHSP20s were classified into different groups according to the topology of phylogenetic tree.Gene expression patterns analysis of PoHSP20s
-
Based on the transcriptome data from flower buds at three developmental stages of P. ostii with different carpels (i.e. 5 and P, respectively), the TPM values (transcripts per kilobase of exon model per million mapped reads) were used to calculate gene expression, and the heat map of the PoHSP20s expression patterns was further plotted by TBtools software.
DNA extraction, PCR amplification and sequence polymorphism analysis
-
Total genomic DNA from leaves of tree peony cultivars was extracted as per the method of Shu et al.[28], and used for cloning of PoHSP89 and PoHSP133 with primer pairs of 5'-CTAAATCCATTCACGCAACAAACTC-3'/5'-TCCCAACACAAACCATTAAGCAACC-3' and 5'-TCGCAATCAAATCATCAAGGTGT-3'/5'-ATAAGCCACGCAGAAGTTGGA-3', respectively.
The sequences of PoHSP89 and PoHSP133 were aligned using Clustal X and manually corrected by MEGA11[29]. Furthermore, DnaSP 5.1 was used to analyze the sequence polymorphism with a sliding window of 100 bp and a step size of 25 bp, and the nucleotide diversity of was evaluated by π and θ values.
Linkage disequilibrium, population structure and association analysis
-
Linkage disequilibrium analysis was performed for the differential SNPs with a frequency higher than 0.05 of PoHSP89 and PoHSP133 using Haploview 4.2 software (
www.broadinstitute.org/haploview/haploview ), respectively[30]. Then, the population structure analysis was performed using Structure v2.3.4 (http://web.stanford.edu/group/pritchardlab/structure.html ) with Burn-in period of 200,000, followed by 1,200,000 Markov Chain Monte (MCMC) replications, and the K value was set from 3 to 7 with 10 repetitions and the most likely K value was obtained through Structure Harvester according to both the log of likelihood and the maximum ΔK[31]. GLM (General Linear Model) was used to perform association analysis between genotype and phenotype data using Tassel 5 (www.maizegenetics.net/tassel ) with population structure as a co-variate[32]. -
A total of 171 possible PoHSP20s were identified through bidirectional blast alignment using TBtools in the P. ostii genome, but 22 do not contain the conserved domain after submitting to NCBI-CDD database for ACD verification. 149 PoHSP20s were finally obtained and named according to their chromosomal location (Fig. 1, Supplemental Table S1). A total of 142 PoHSP20s were randomly distributed on five chromosomes, while, the other seven were unclassified. It indicated that these PoHSP20s contain 62−831 amino acids with predicted molecular weights of 7.00−94.11 kDa. The putative isoelectric point ranges from 4.62 to 9.37. The grand average of hydropathicity (GRAVY) of all genes is negative, indicating that these PoHSP20s are hydrophilic. Sub-cell localization prediction results showed that 112 PoHSP20s were mainly localized in the cytoplasm, and the others were in the golgi apparatus, nucleus, chloroplast, mitochondrion, vacuole, extra-cell and peroxisome (Supplemental Table S1).
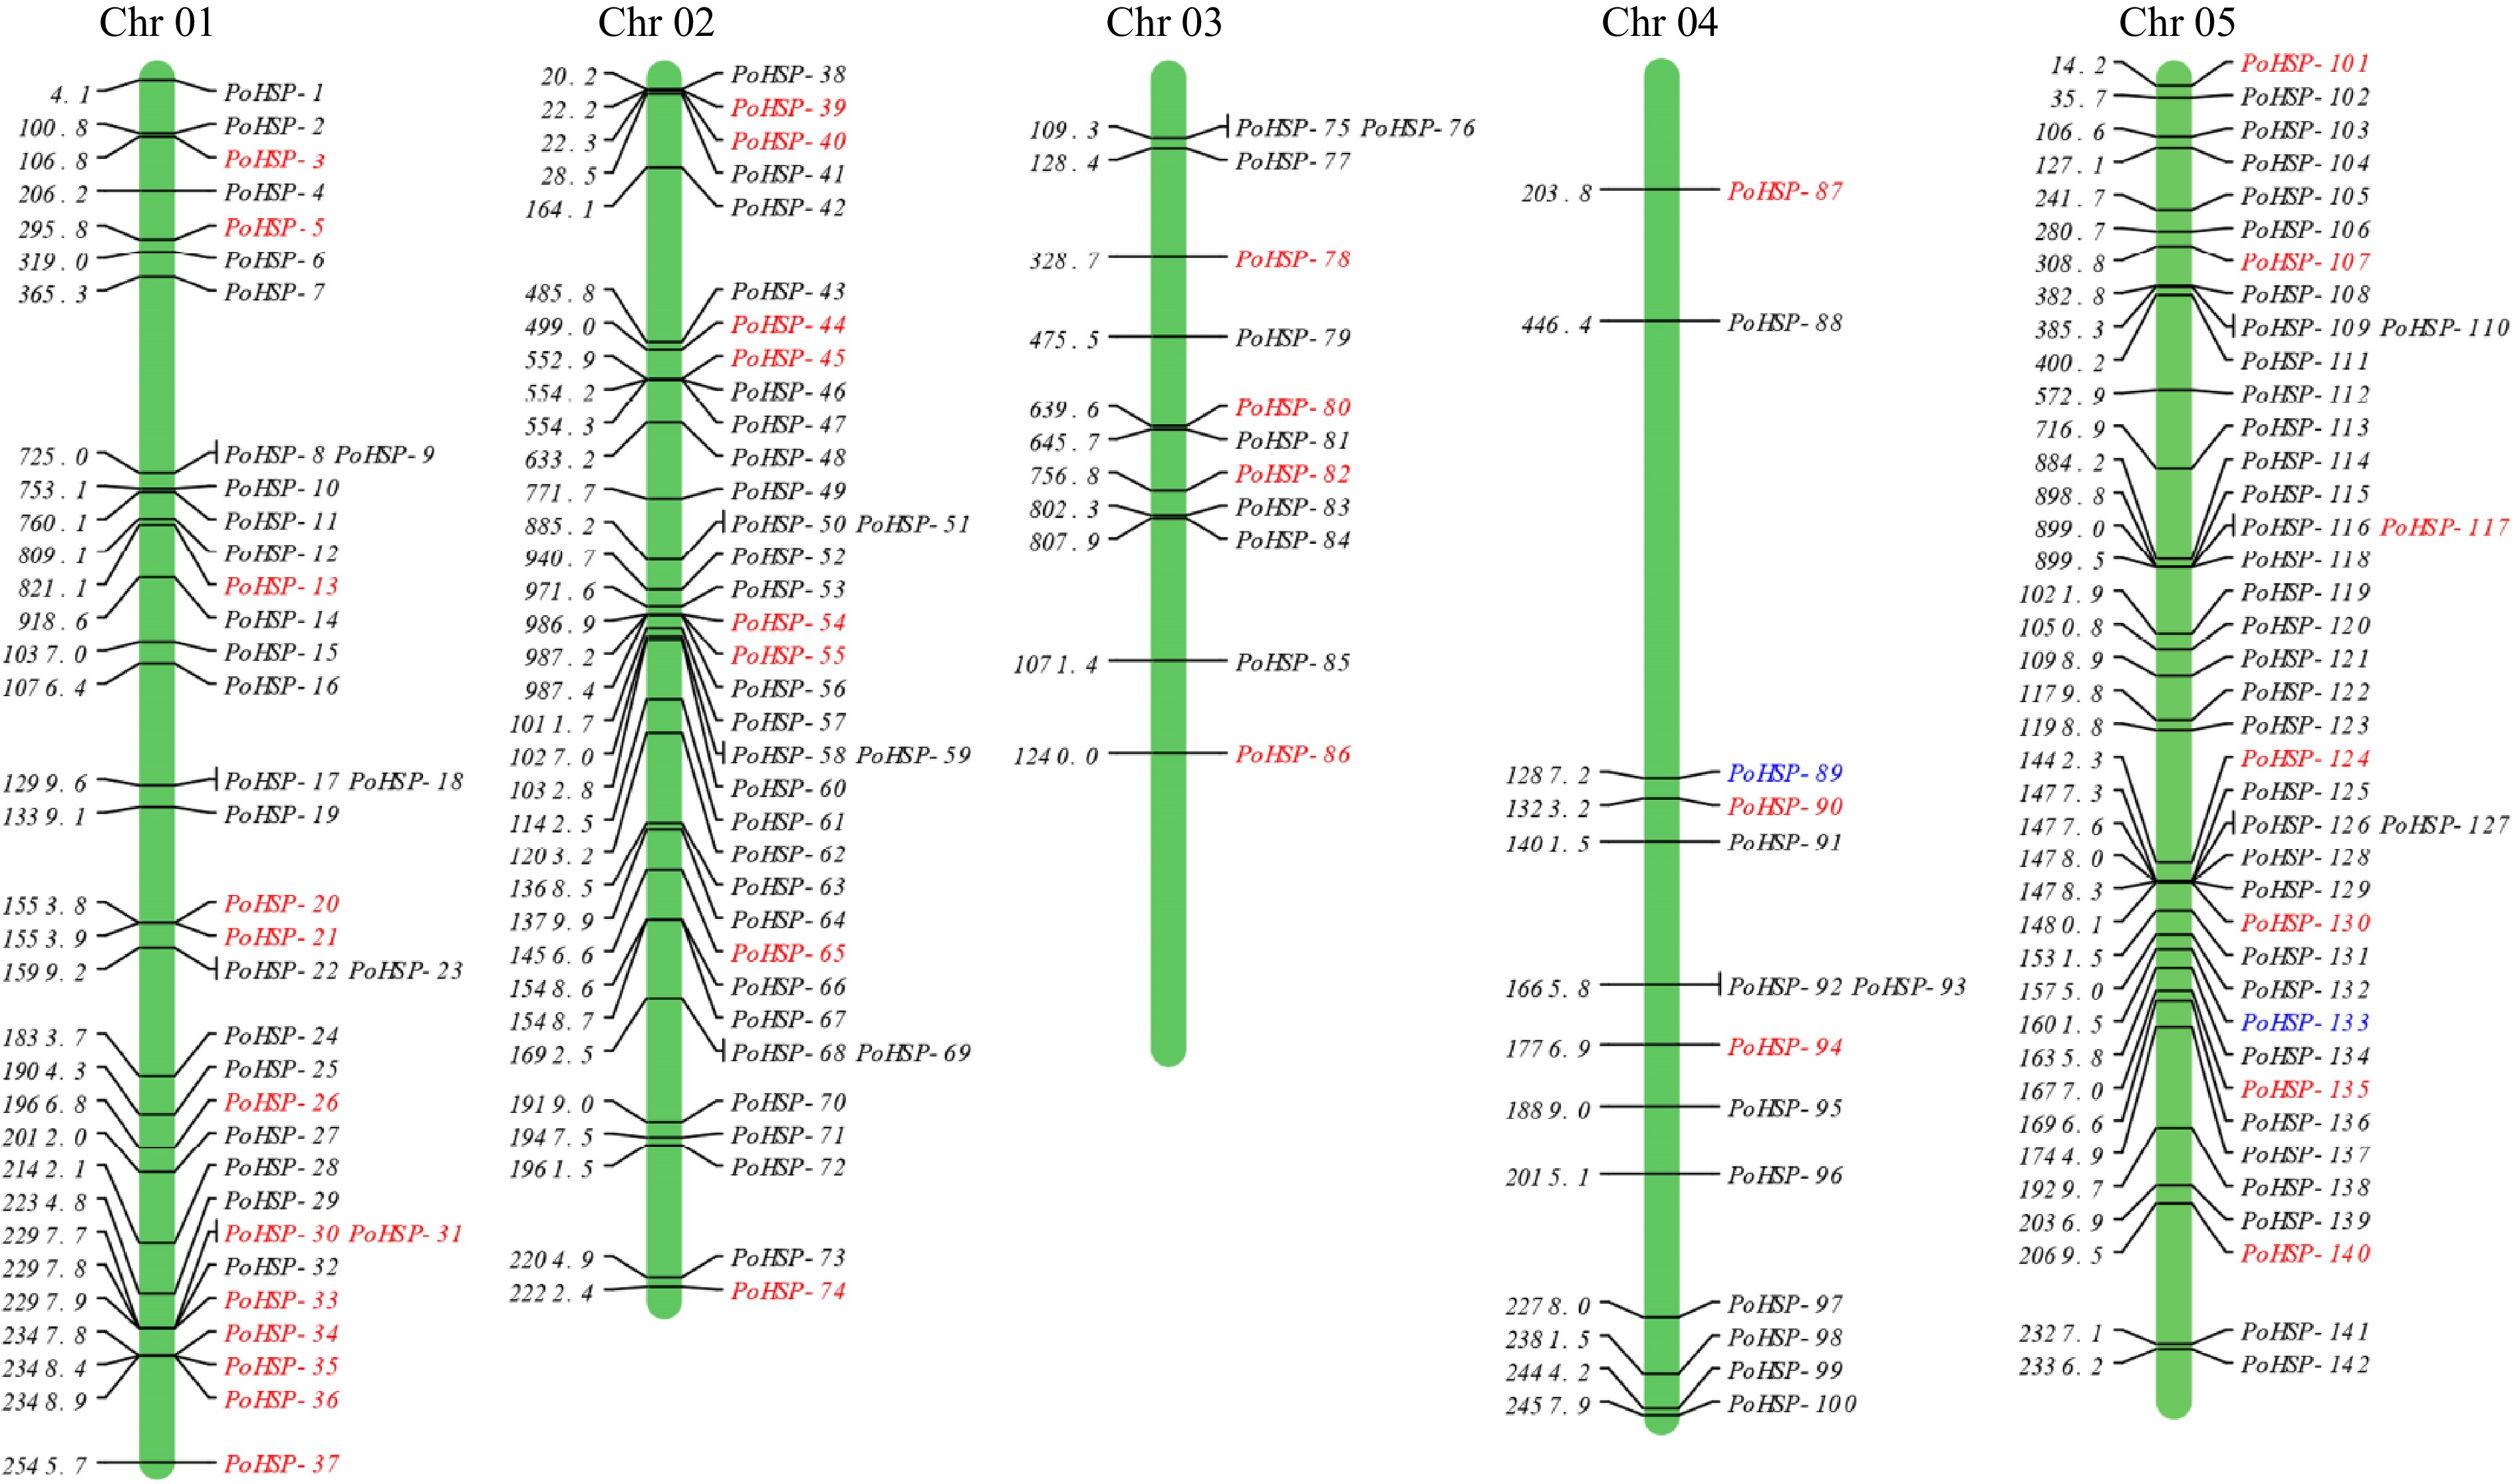
Figure 1.
Chromosomal locations of PoHSP20s on P. ostii chromosomes. The genes in red were also identified in the transcriptome of flower bud of P. ostii, the genes marked in blue were used for association analysis.
Phylogenetic analysis of PoHSP20s
-
In order to clarify the evolutionary relationship and grouping characteristics, a phylogenetic tree was generated from 149 PoHSP20s together with 19, 23 and 53 related proteins from A. thaliana, O. sativa, G. max, respectively (Fig. 2), which demonstrated high homology. The 149 PoHSP20s were divided into 10 subfamilies, including CI, CII, CIII, CV and CVII (cytoplasm or nucleus), MI and MII (mitochondria), P (plastid), Po (peroxysome), and ER (endoplasmic reticulum). Within each subfamily, CI has the highest number of members (51), followed by CIII (29), CII (24), Po (10), ER (9), MI (8), CVII (7), P (4), CV (1), and MII (1). The remaining five PoHSP20s could not be clustered into any subfamily, and were clustered into the unknown group, namely, UN1 (1) and UN3 (4). Most of the PoHSP20s were classified into CI, CII, CIII, CV and CVII, which were putatively located in cytoplasm or nucleus indicating their similar or conserved function.
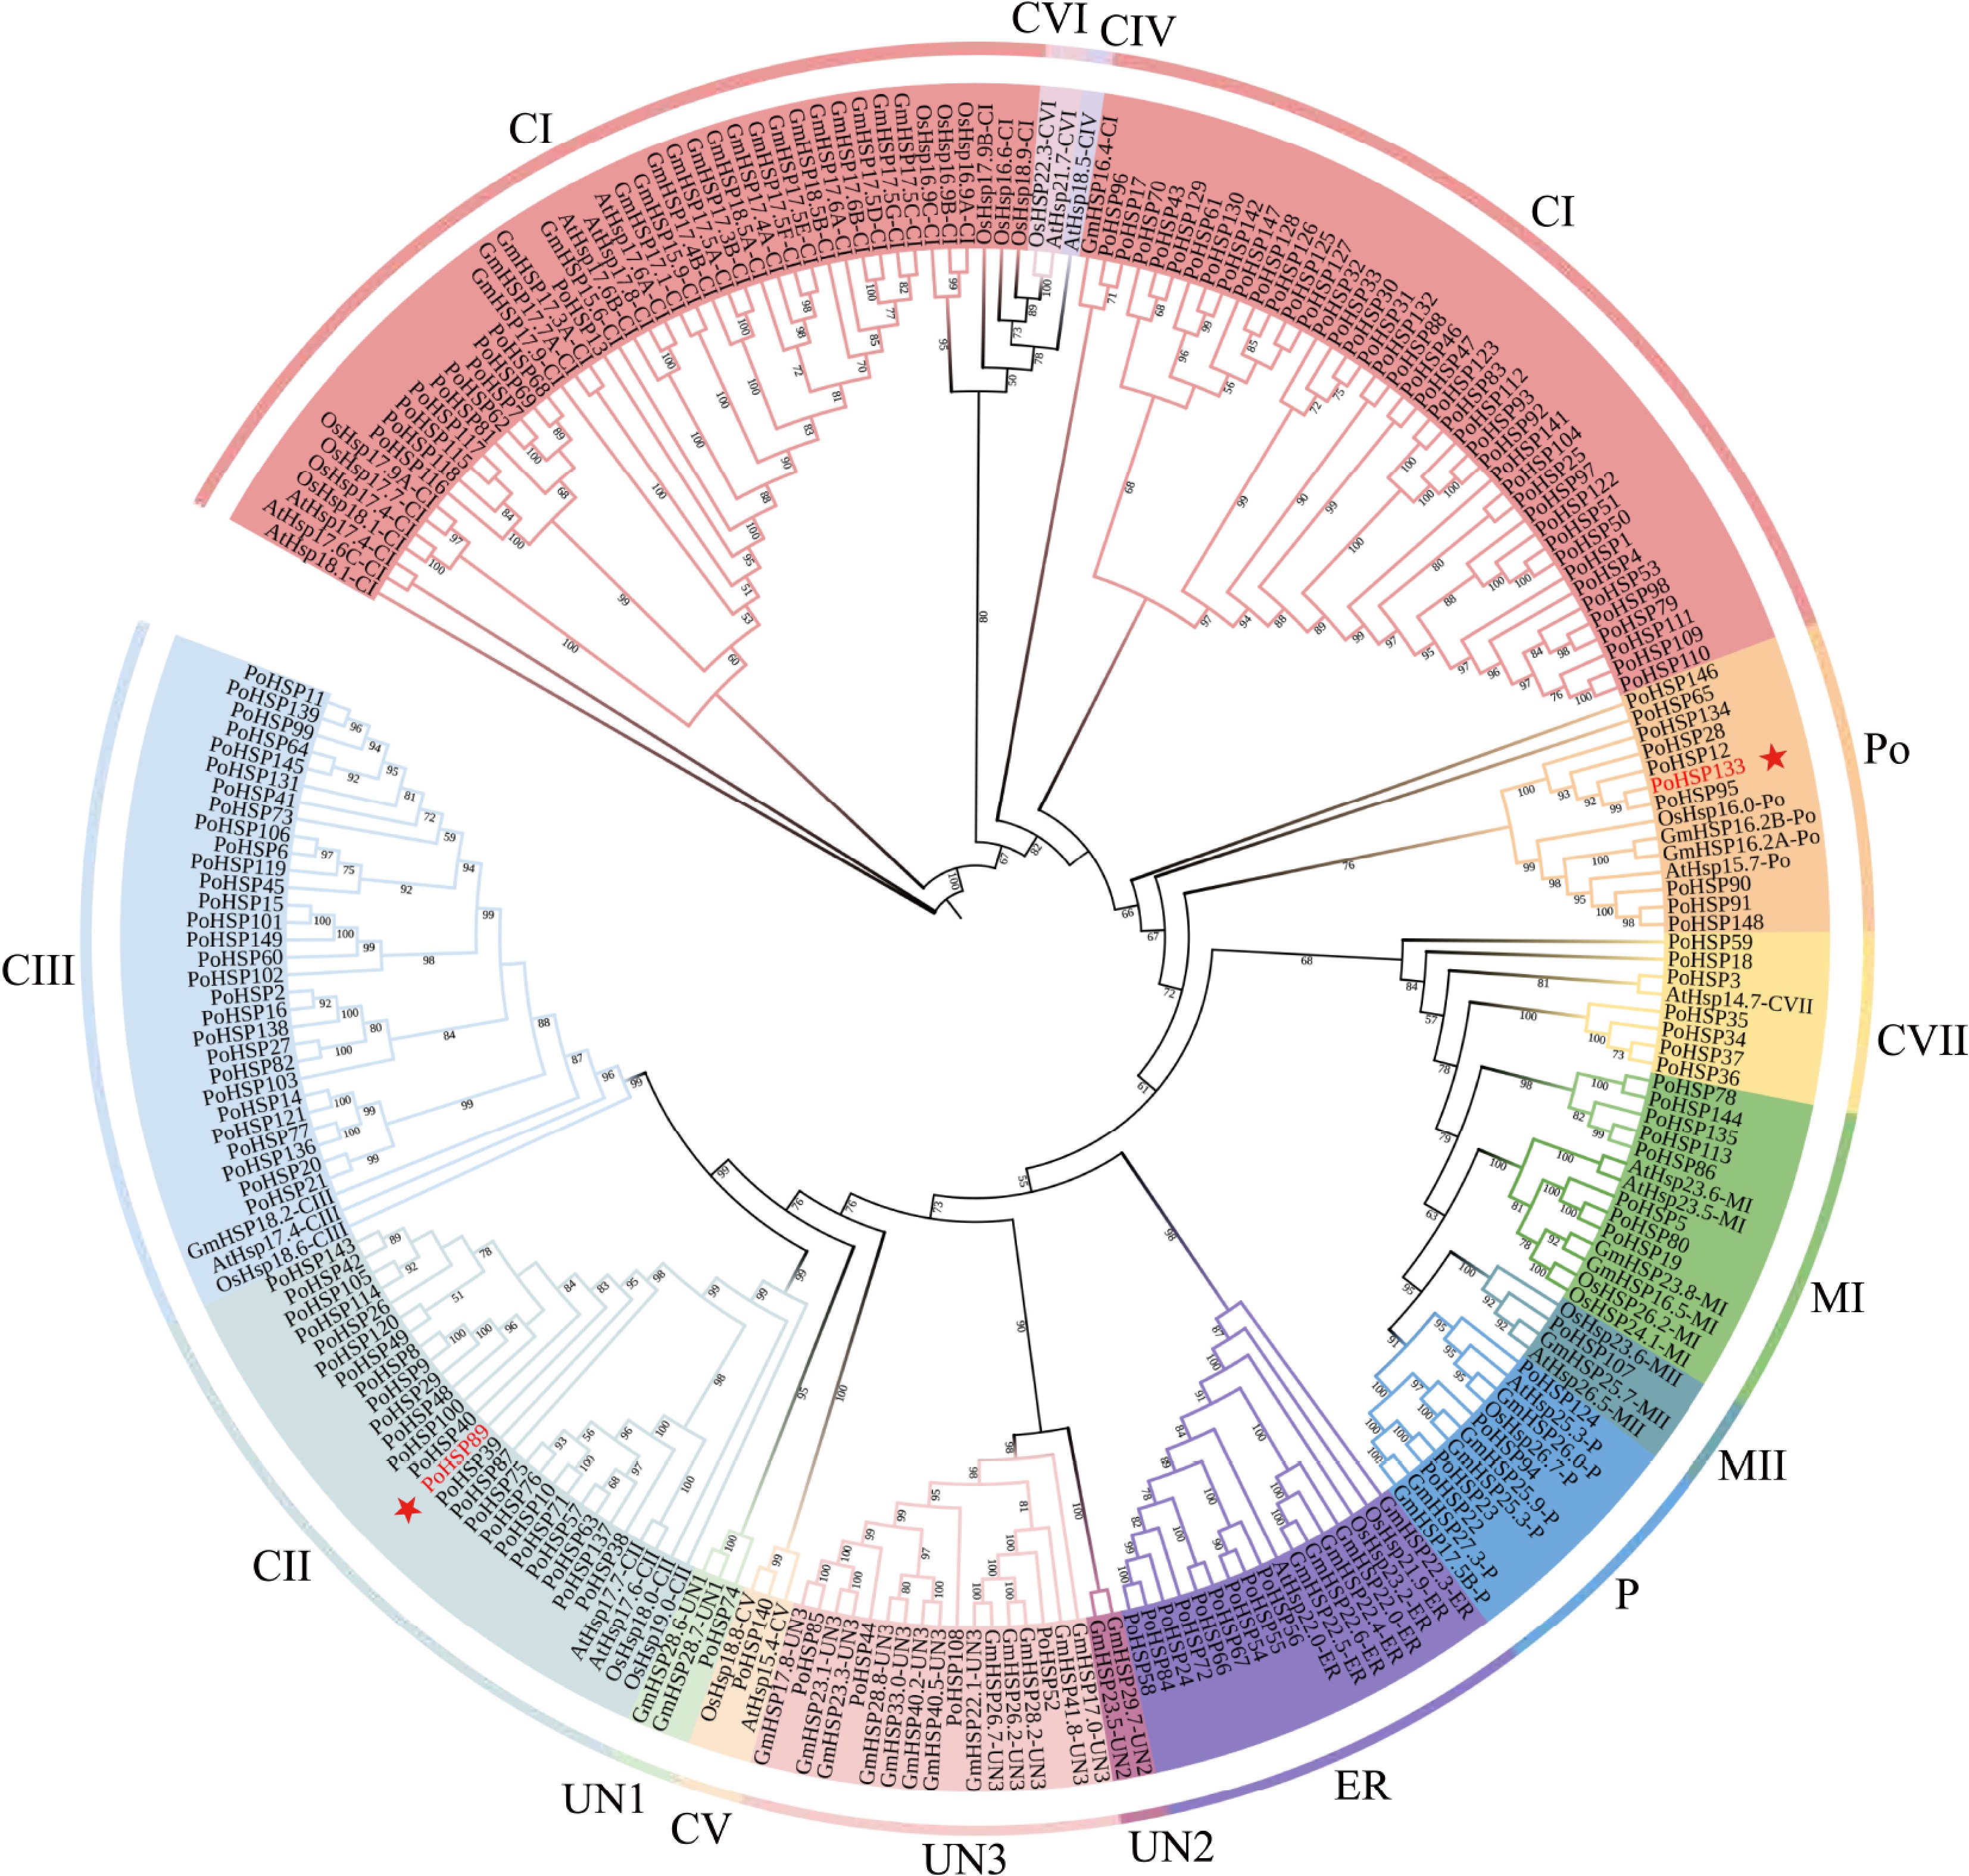
Figure 2.
The phylogenetic tree of HSP20s from A. thaliana, O. sativa, G. max and P. ostii. It was constructed using the ML method with 1,000 bootstrap replications. The colors indicate the different subfamilies, the stars indicate the genes for association analysis.
Gene structure and motif analysis of PoHSP20s
-
Among the PoHSP20s, 40 (26.85%) were intronless, 36 (24.16%), 22 (14.77%), 22 (14.77%) and 29 (19.46%) had one, two, three, and four or more introns, respectively. A total of 10 motifs were found, and the length of these conserved motifs varied from 15 to 29 amino acids (Fig. 3; Supplemental Table S2). Based on NCBI-CDD database, the motifs 1−5 together consisted of a highly conserved complete ACD. Among the 149 PoHSP20s, the motif 1, motif 2, motif 3, motif 4 and motif 5 was shared by 113, 60, 117, 52 and 76 members. While, 31 PoHSP20s (20.8%) contained the combination of motifs 1−5, others PoHSP20s lacked the complete five motifs.
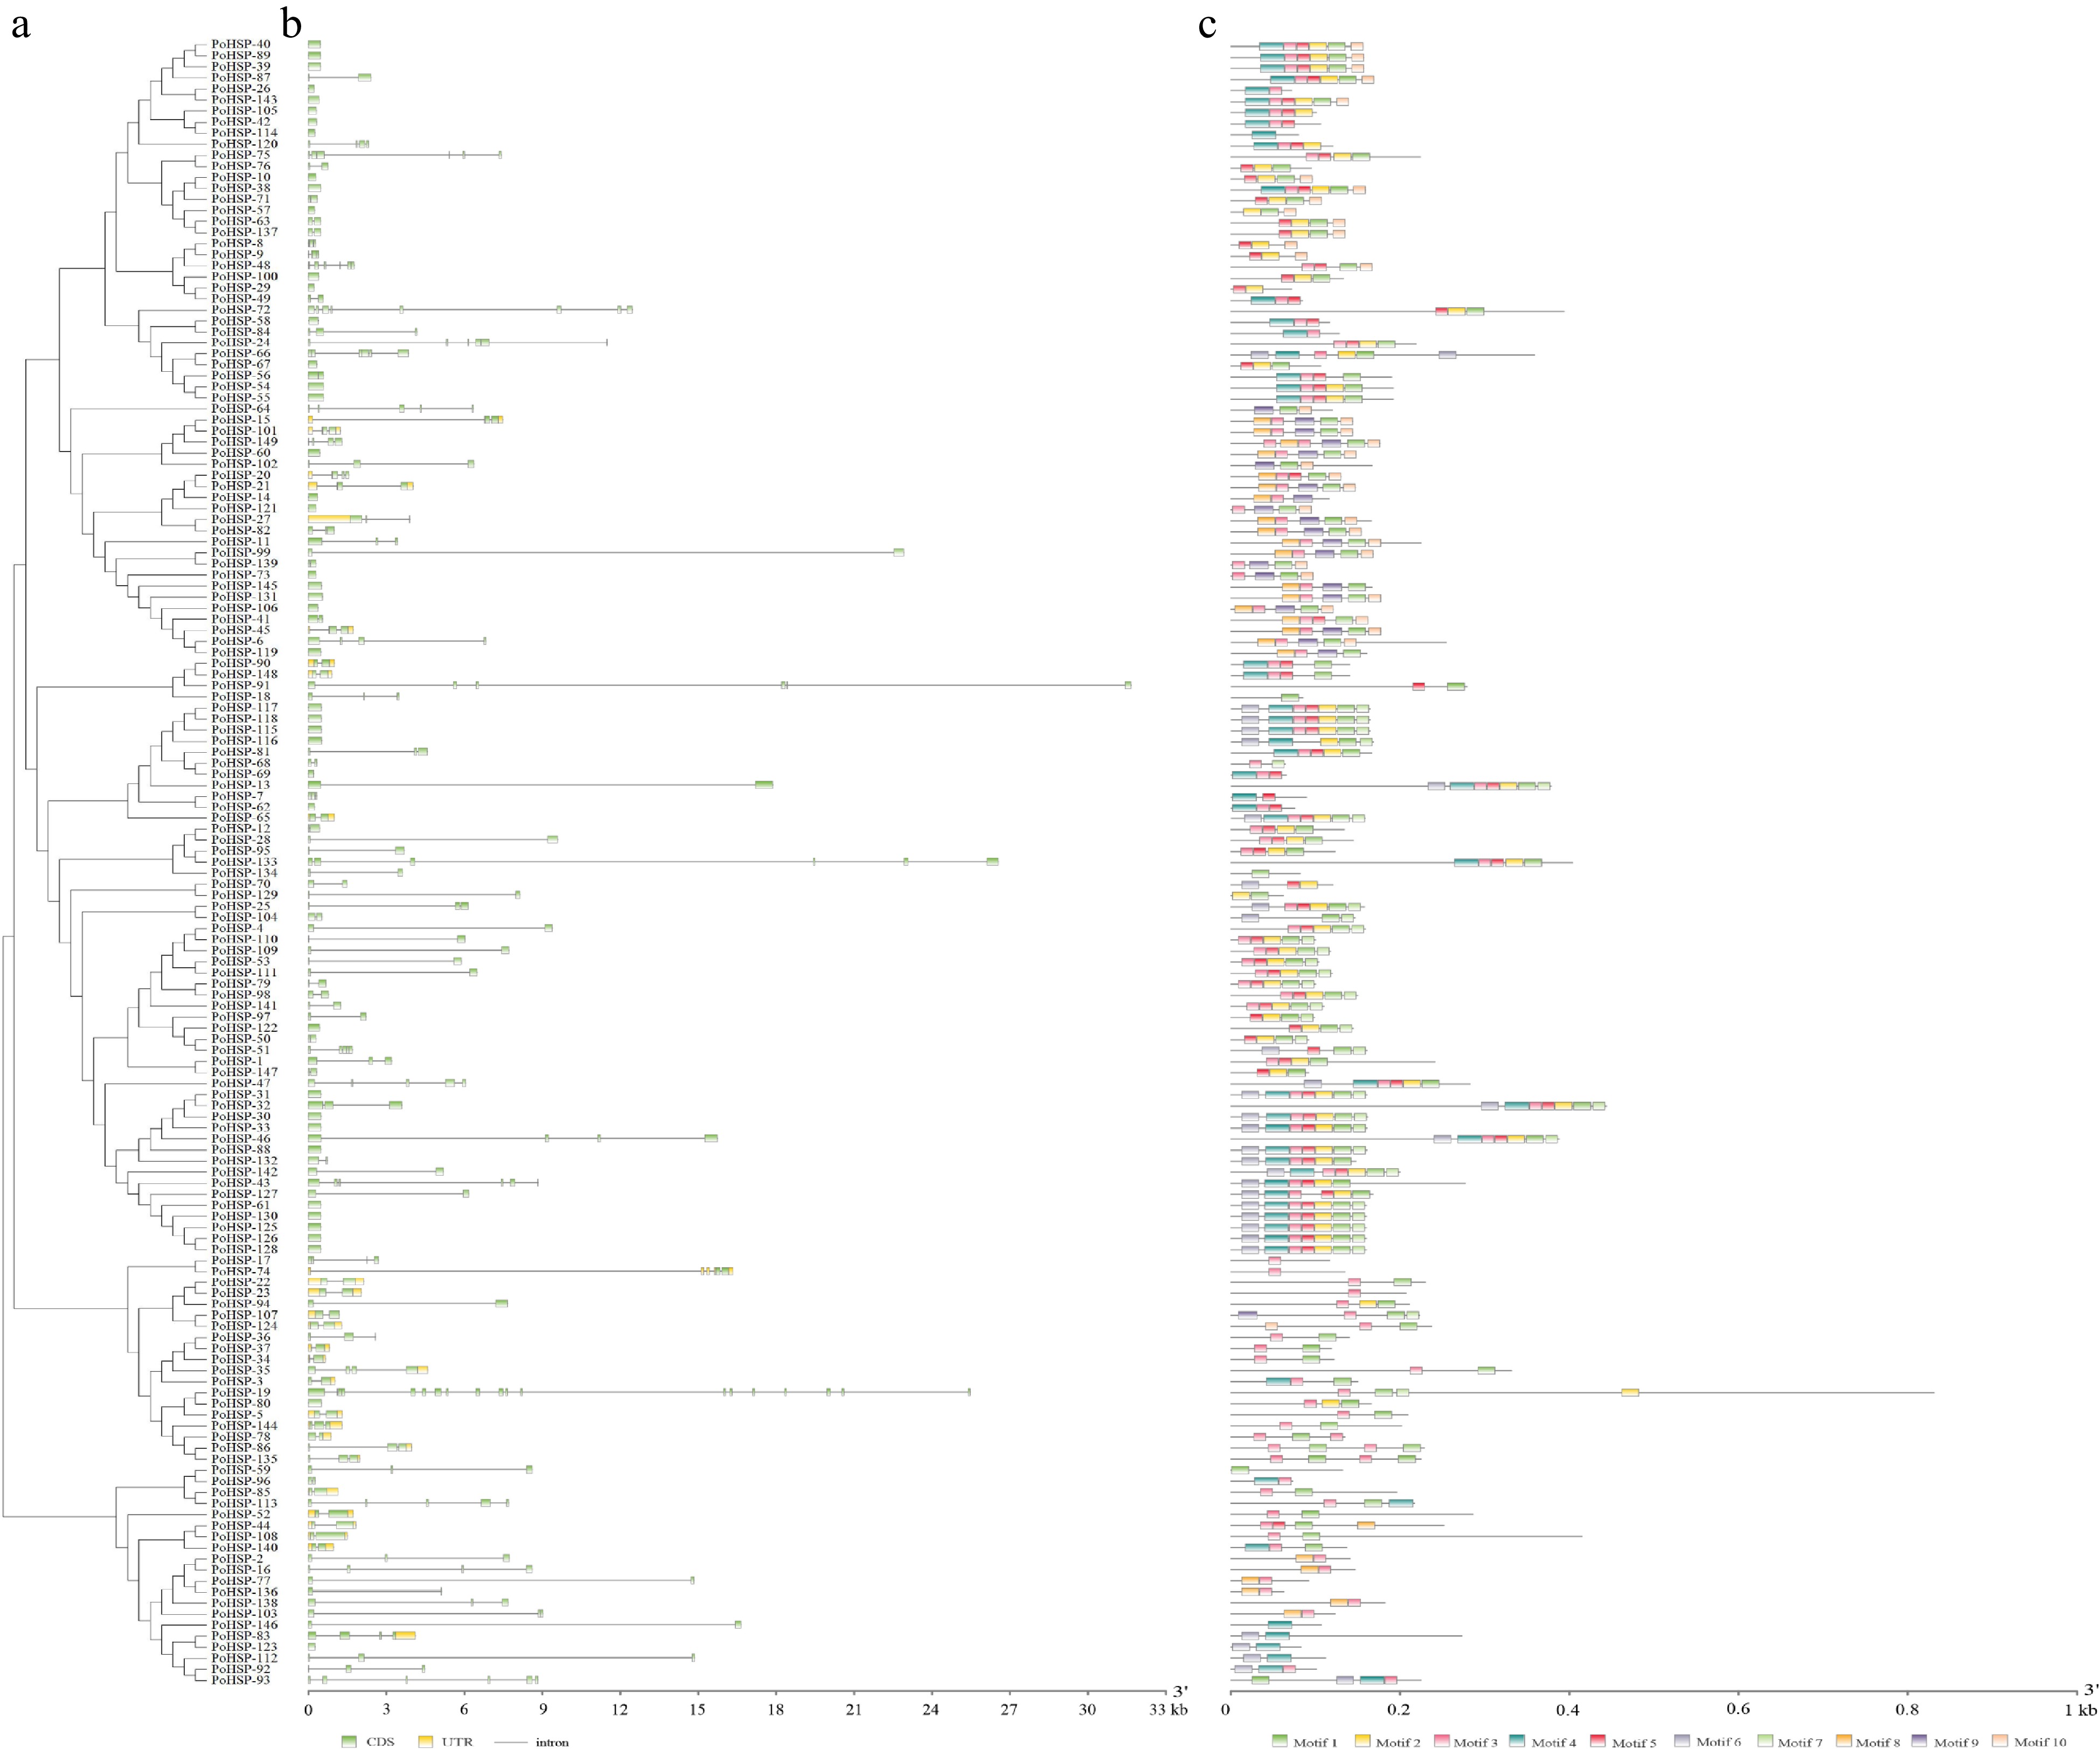
Figure 3.
Phylogenetic relationship, gene structure and conserved motif analysis of PoHSP20s. (a) The phylogenetic tree of 149 PoHSP20s. The unrooted neighbor-joining phylogenetic tree was constructed with MEGA11 using full-length amino acid sequences with 1,000 bootstrap replicates. (b) Exon/intron organization of PoHSP20s. Green and yellow box represents CDS and untranslated regions (UTR), and the black lines indicate introns, respectively. The length of sequence can be inferred by the scale at the bottom. (c) The distribution of conserved motifs in PoHSP20s. Ten putative motifs are indicated in different colored boxes, refer to Supplemental Table S2 for details.
Expression patterns of the PoHSP20s in flower bud with 5-carpels and polycarpels at three developmental stages
-
In order to further characterize the expression profiles of PoHSP20s, 38 differentially expressed PoHSP20s were obtained and grouped into four clusters based on the transcriptome of flower bud with 5-carpels and polycarpels at three developmental stages (Fig. 4). In conclusion, members of cluster I showed higher expression levels in Pa than that of 5a, while, for cluster III, it demonstrated an opposite trend in Pc and 5c, which suggests a possibly different function.
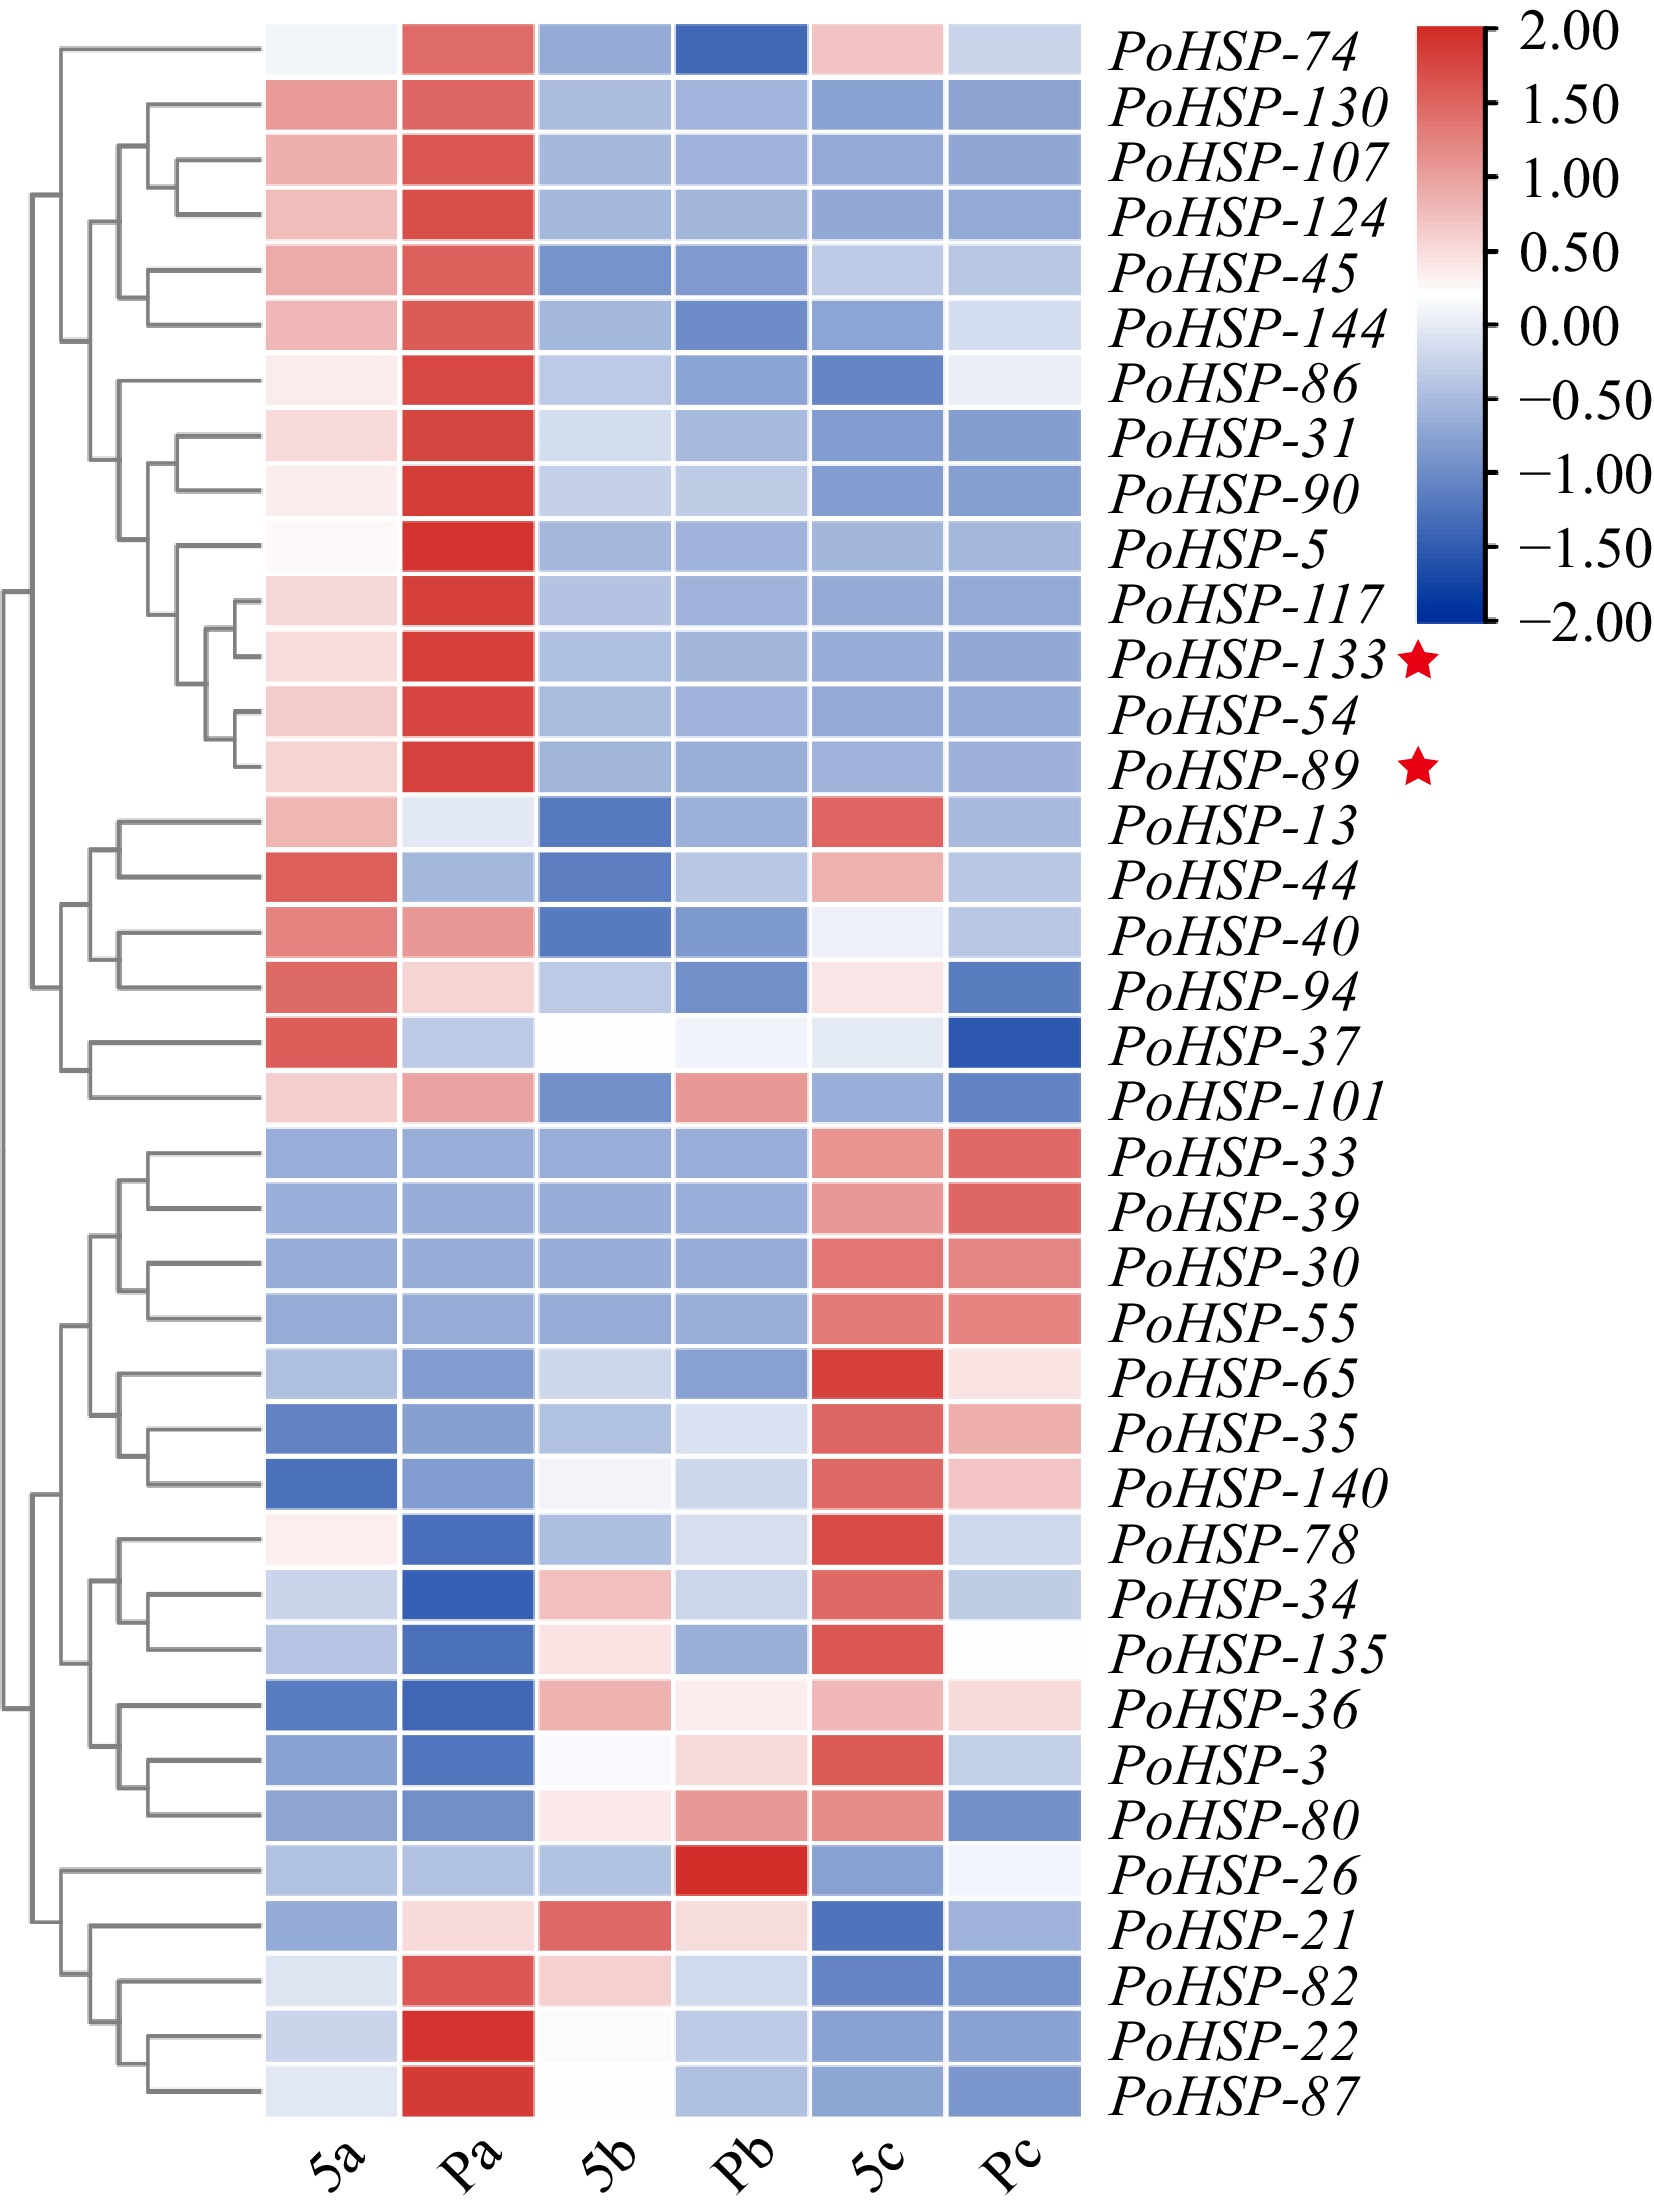
Figure 4.
Expression profiles of PoHSP20s in flower buds at different developmental stages of P. ostii with various carpels. Stage a, sepals and a few petal primordia appeared; stage b, stamen primordia initiated; stage c, carpel primordia initiated. 5, plants with five carpels; P, plants with more than 5 carpels (6−8 carpels). The stars indicate the genes for association analysis.
Sequence variation analysis of PoHSP89 and PoHSP133
-
Based on the expression pattern and SNPs provided by the transcriptome, two PoHSP20s (PoHSP89 and PoHSP133) of cluster I were identified for further cloning and association analysis. In total, we obtained the coding sequences of 215 and 265 ones in 271 tree peony cultivars, respectively. After removing the unmatched parts at both ends, the sequence of 461 bp long for PoHSP89 and 421 bp long for PoHSP133 were used for subsequent analysis. The sequences of PoHSP89 in 215 cultivars were detected, 37 SNPs with an average of 1 SNP per 12 bp, while, 32 SNPs were obtained in 265 cultivars with an average of 1 SNP per 13 bp. Among the SNPs, 18 for PoHSP89 and 14 for PoHSP133 occurred with a frequency higher than 5%, respectively, and 13 out of the 18 loci for PoHSP89 and 6 of 14 for PoHSP133 exhibited synonymous mutation, while the remaining ones contained non-synonymous mutation (Supplemental Table S3). The nucleotide polymorphism values of π and θ for PoHSP89 and PoHSP133 were 0.01795, 0.00799 and 0.01488, 0.01259, respectively.
Linkage disequilibrium and population structure analysis
-
Further, linkage disequilibrium analysis was performed on the high-frequency polymorphic loci of PoHSP89 and PoHSP133 (Fig. 5a, b). There were two block regions in PoHSP89, one containing three loci (21, 42, and 101 bp) and the other containing two loci (403 and 429 bp). The average R2 value between different loci was 0.30. R2 value between locus 342 and 403 was higher than 0.80, indicating a strong linkage between them. In addition, seven pairs of loci reached an R2 value of 0.70. For PoHSP133, only the linkage between locus 34 and 216 was strong with an R2 value greater than 0.80. A block region was found between locus 373 and 374 with an R2 value of 0.67.

Figure 5.
Linkage disequilibrium and population structure of associated populations. (a), (b) Linkage disequilibrium analysis of PoHSP89 and PoHSP133, respectively. Different colors indicate standard (D'/LOD) values, from white to red, the value increased; the value in the box indicates R2 and was magnified 100 times. (c) Variation tendency of ΔK. (d) Population structure of associated group when K = 3.
Population structure analysis is an important way to determine the kinship and taxon classification among different cultivars. Based on the SNPs of PoHSP89 and PoHSP133, the population structure was analyzed. It showed that the ΔK value was the largest at K = 3, thus the tested cultivars could be mainly divided into three groups (Fig. 5c, d).
Association analysis between candidate genes and floral organ number
-
Association analysis was performed between SNPs of PoHSP89 and PoHSP133 and floral organ number, and a total of 7 and 19 pairs of association combinations were identified, respectively, which explained the phenotypic variation by 1.79% to 4.06%, and 1.92% to 12.37%, respectively. In total, there were 9, 3, 14 SNPs associated with CN, PeN and SN, respectively. For PoHSP89, SNP on the locus 121 associated with CN has the highest R2 value (4.06%), others' were all lower than 3.00%. For PoHSP133, the R2 value of 15 pairs of association combinations were higher than 3.00%, among which SNP on the locus 237 associated with SN had the highest value (12.37%), followed by locus 34 associated with SN (9.16%) and CN (7.03%), locus 374 associated with SN (6.78%) and locus 216 associated with CN (6.51%) (Table 1).
Table 1. Associated combinations of PoHSP89 and PoSHP133 with flower organ number.
No. Trait Gene Locus SNP/Indel p value R2/% 1 CN PoHSP89 121 A/G 0.0028 4.06 2 CN PoHSP89 225 T/C 0.0199 2.48 3 CN PoHSP89 393 C/T 0.0484 1.79 4 PeN PoHSP89 436 A/G 0.0236 2.31 5 SN PoHSP89 342 A/C 0.0411 1.88 6 SN PoHSP89 402 A/G 0.0191 2.46 7 SN PoHSP89 403 T/C 0.0361 1.97 8 CN PoHSP133 5 C/A 0.0084 3.54 9 CN PoHSP133 34 G/A 0.0000 7.03 10 CN PoHSP133 150 C/T 0.0028 3.31 11 CN PoHSP133 216 T/G 0.0000 6.51 12 CN PoHSP133 237 A/G 0.0016 3.69 13 CN PoHSP133 374 G/T 0.0007 4.22 14 PeN PoHSP133 237 A/G 0.0008 3.87 15 PeN PoHSP133 373 C/T 0.0166 2.02 16 SN PoHSP133 5 C/A 0.0264 2.74 17 SN PoHSP133 34 G/A 0.0000 9.16 18 SN PoHSP133 150 C/T 0.0001 5.75 19 SN PoHSP133 210 G/A 0.0242 1.92 20 SN PoHSP133 216 T/G 0.0002 5.26 21 SN PoHSP133 218 G/A 0.0026 3.41 22 SN PoHSP133 219 C/T 0.0012 3.92 23 SN PoHSP133 237 A/G 0.0000 12.37 24 SN PoHSP133 373 C/T 0.0002 5.34 25 SN PoHSP133 374 G/T 0.0000 6.78 26 SN PoHSP133 393 C/A 0.0084 2.62 Phenotypic variation of significantly associated loci was further analyzed. It demonstrated that these cultivars with genotype GA at locus 121 of PoHSP89 had 26.24% higher CN than that of genotype GG. The SNPs had two alleles at the locus 34 and 216 of PoHSP133, and the average of CN associated with allele G was significantly different from the other allele and increased by 24.00% for locus 34 and decreased by 23.00% for locus 216, respectively (Fig. 6). The cultivars with allele G at the locus 34, 237 and 374 of PoHSP133 showed significantly higher SN than that of other alleles, and increased by 39.50% for locus 34, 47.43% for locus 237 and 32.93% for locus 374, respectively (Fig. 6).
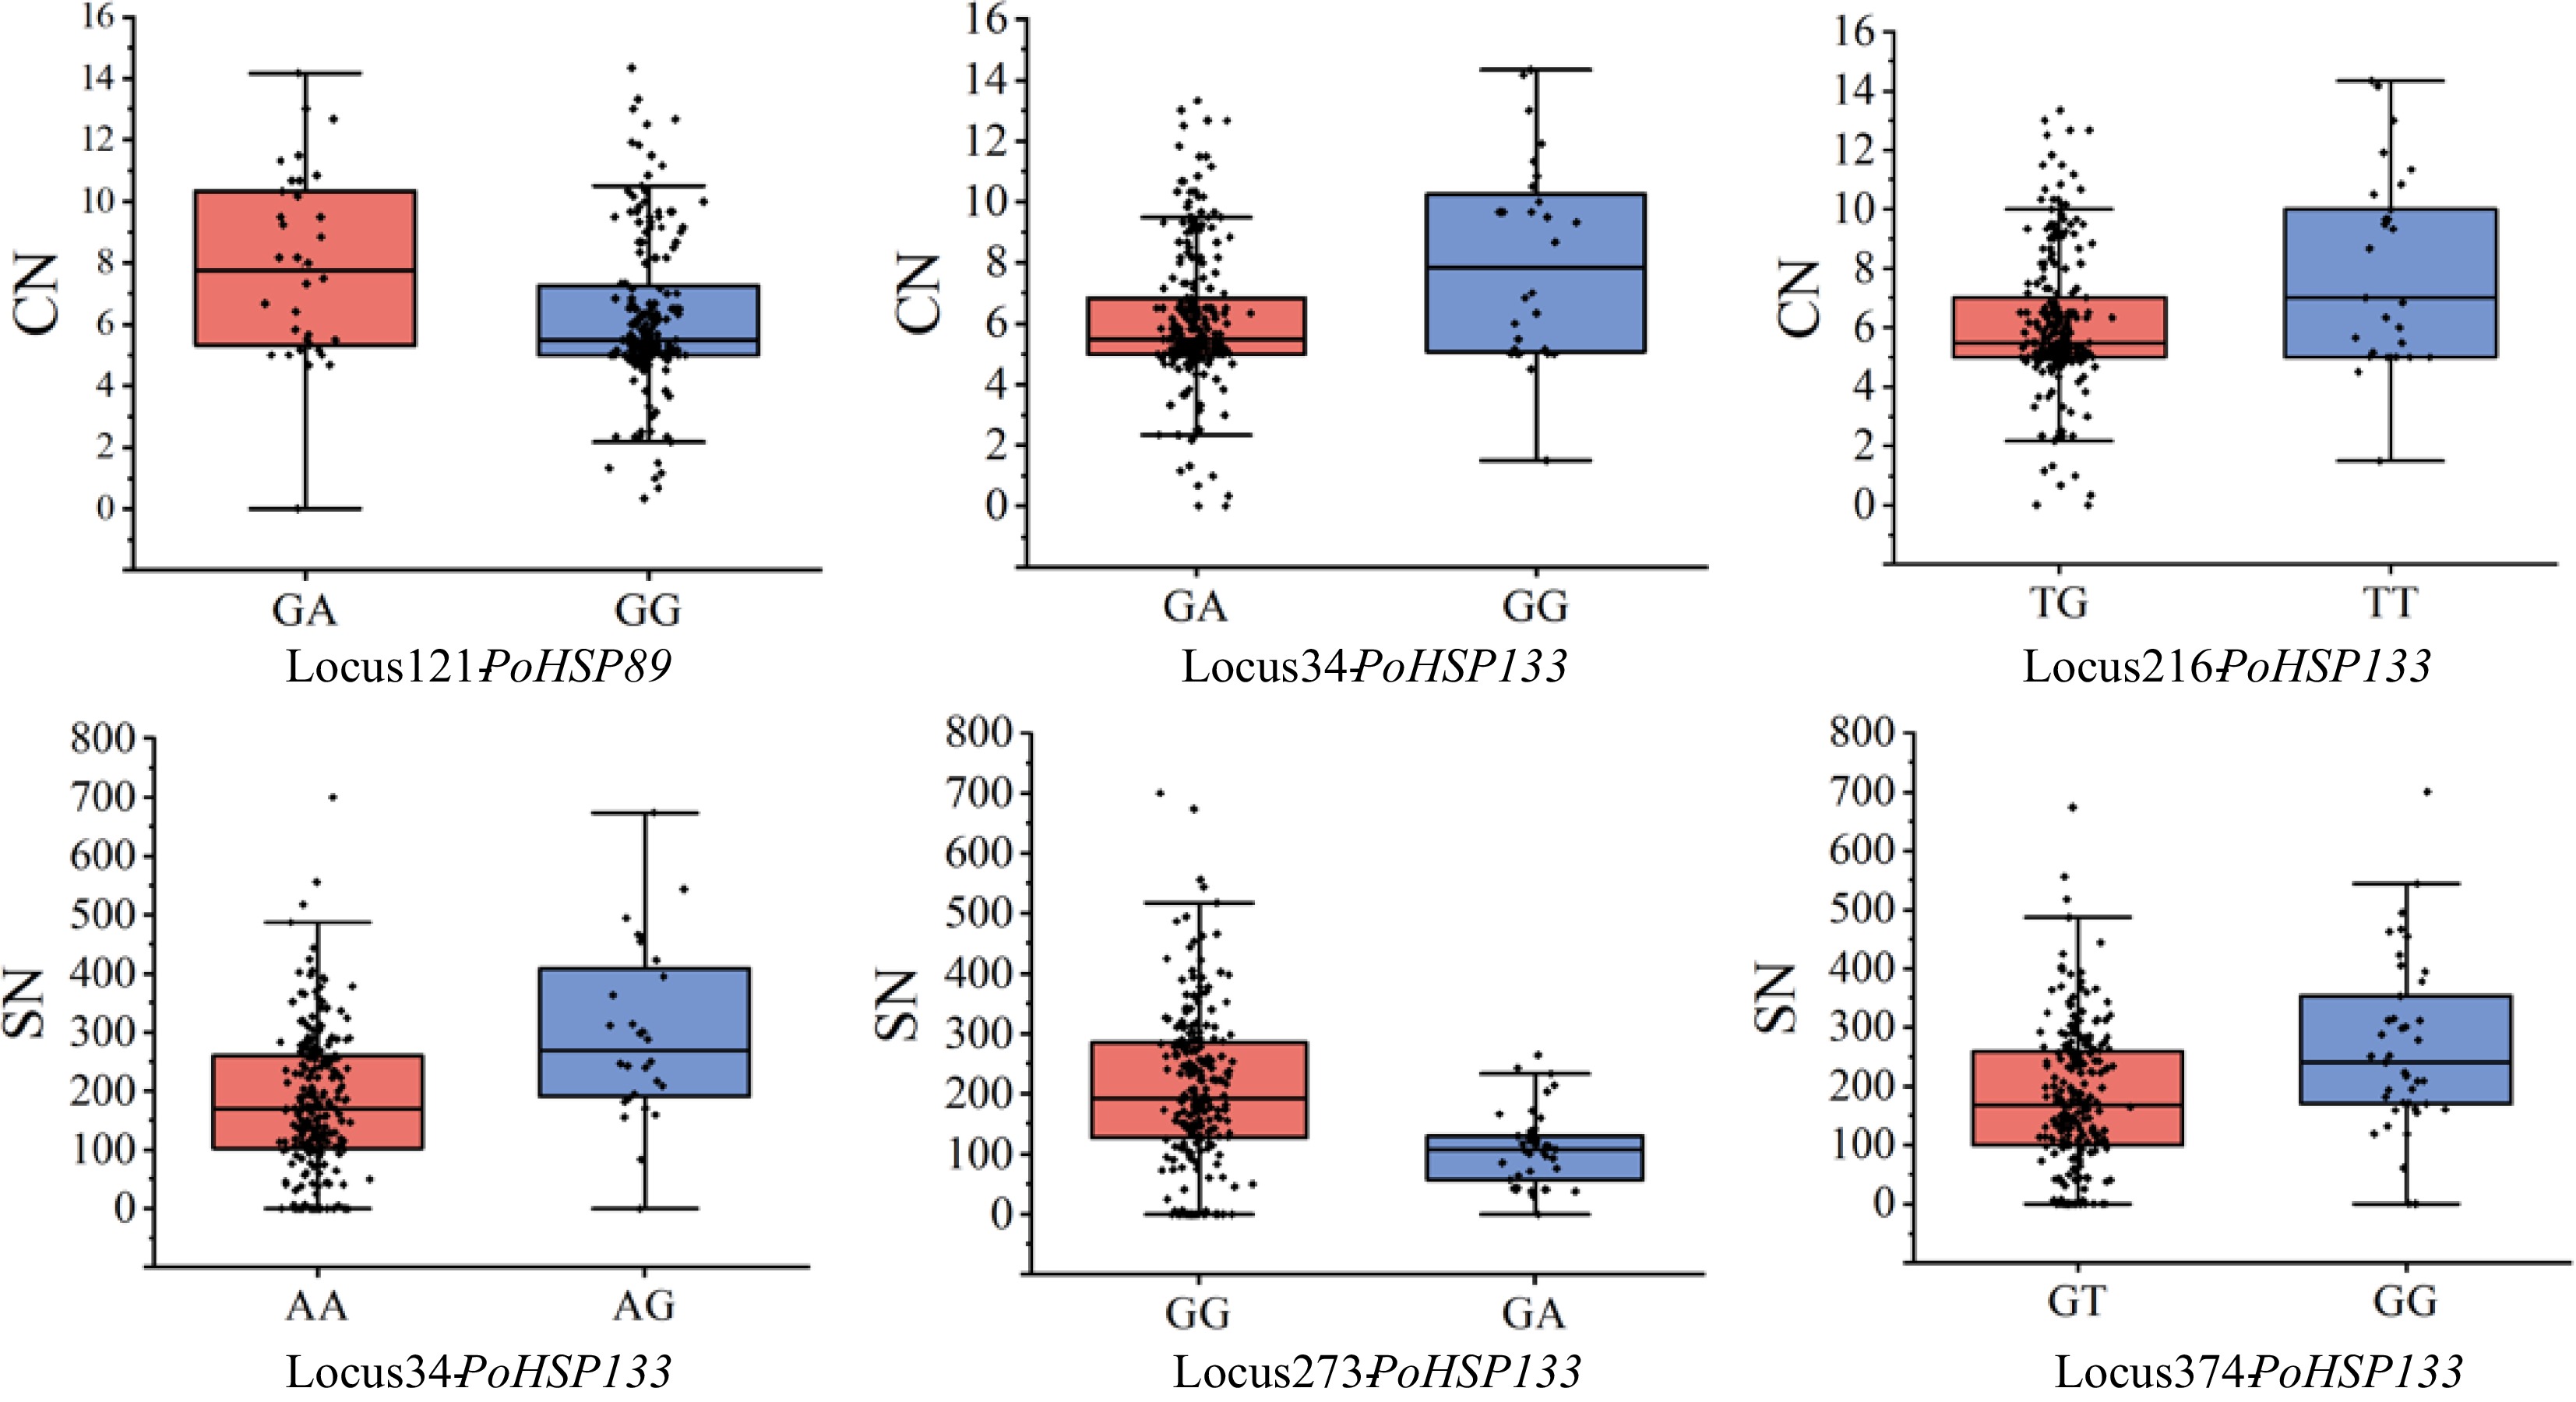
Figure 6.
Phenotypic variation of partly significantly associated loci of PoHSP89 and PoHSP133. CN, carpel number; SN, stamen number.
-
HSP20 is a diverse, ancient and important gene family exists in all plants, and considered to be conducive to fold proteins and prevent irreversible protein aggregation[33]. The HSP20s have also been shown to play an important role in the seed germination process, growth and development. Therefore, it is important to elucidate the function of PoHSP20s in tree peony. In this study, we identified all members of the HSP20 gene family in P. ostii genome, and analyzed their phylogenetic relationships, conserved motifs. The expression patterns were analyzed through comparative transcriptome. Then, the association analysis between SNPs of two candidate genes and floral organ number of tree peony cultivars were conducted. This study will provide valuable basis for clarifying the function of PoHSP20 gene family, and will be useful for molecular marker-assisted breeding of tree peony in view of improving ornamental traits and yields.
With the availability of the whole genome sequence of many plants, several HSP20s have been identified. It is reported that 19, 39, 51, 35, 42, 48, 39, 41 and 42 HSP20s were found in A. thaliana[34], O. sativa[35], G. max[7], C. annuum[36], Solanum lycopersicum[37], S. tuberosum[38], Ginkgo biloba[33], V. vinifera[10], Malus pumila[39] and Citrus canker[40], respectively. In this study, 149 PoHSP20s were identified in P. ostii genome, which is far more than the above mentioned species. The amino acids of the PoHSP20 is between 62 (PoHSP129) and 831 (PoHSP19) with the molecular weight between 7.00 and 94.12 kDa. Some members of the PoHSP20s with molecular weights outside the common range of 12 to 43 kDa are also defined as HSP20 because of containing typical ACD domain. Their large molecular weight may be due to the relatively much more modification or folding of the N and C terminals of the proteins, but whether it will affect its function or not, it still needs to be further characterized.
Phylogenetic analysis showed that 75.17% of PoHSP20s were classified into cytoplasmic and nucleus subgroup, which was consistent with the classification characteristics of other species and indicated their conserved function to avoid inappropriate aggregation or degradation between HSP20s and denatured proteins[7, 40]. In addition, 149 PoHSP20s were mainly divided into 10 subfamilies and missed CIV and CVI subfamily, which were less than that of A. thaliana with 12 subfamilies (CI-CVII, MI, MII, ER, P and Po)[5], while, it lacked the CIV and CVII subfamilies in O. sativa[6], CIV, CV and CVIII subfamilies in C. annuum[36], and the CVI and CVII subfamilies in Cannabis sativa[41]. It can be deduced that gene deletion events happened in the HSP20 subfamily in various plants, and the cause for this event could be addressed using a larger scale of plants in future studies. Furthermore, there are similar gene structures and conserved motifs among the PoHSP20 subfamilies, indicating that they are highly conserved or can perform similar functions. Since, most of the PoHSP20s had zero or less than three introns, and only 29 (19.46%) had four or more introns, which demonstrated that plants were more likely to retain genes with less introns to increase their expression levels[37, 42].
Previous studies have shown that the expression level of HSP20s is activated or increased by environmental stresses including heat, cold, drought and salinity in various developmental processes, such as embryogenesis, seed germination, and fruit ripening[7, 10, 43], which indicates their vital roles[44]. In this study, a spatial-temporal expression pattern of PoHSP20s was obtained in P. ostii plants with 5-carpel and polycarpels from the transcriptome of flower buds at three developmental stages. The expression level of 14 PoHSP20s (Cluster I in Fig. 4) in Pa was approximately twice as high as in that of 5a, which indicated their important role in regulating floral organ development and number. So far, although there is scarcely direct evidence that HSP20s is involved in the regulation of floral organ number in plant, AtHSPs can restore the carpel morphology of A. thaliana a810 mutant[45], which provides a reference for us to study the function of the PoHSP20s, and more work is needed in the future for functional verification.
The identification and characterization of alleles associated with agronomically important traits are indispensable for both understanding the genetic basis of phenotypic variation and efficient crop improvement[46]. In this study, we further conducted association studies for two genes (PoHSP89 and PoHSP133) with floral organ number, as it is related to the yield-related traits and flower shape. According to earlier research, sequence polymorphism analysis of the THICK TASSEL DWARF1 (TD1) and FASCIATED EAR2 (FEA2) genes in various maize inbred lines revealed an average of one SNP per 29 and 17 bp[47], and HSP17.8 in 210 barley genotypes revealed an average of one SNP per 54.5 bp[24]. We observed that a total of 37 and 32 SNP loci, with an average of one SNP per 12 and 13 bp in PoHSP89 and PoHSP133, respectively, demonstrated a greater variety, which mostly because of large genetic diversity of tree peonies. Then, association analysis was performed based on the effective SNP loci in PoHSP89 and PoHSP133, which could explain the phenotypic variation by 1.79% to 4.06%, and 1.92% to 12.37%, respectively. Compared to other studies, such as differences in unsaturated fatty acid content caused by significantly associated SNP in Camellia oleifera (1.87%−17.93%)[48], floral organ number variation caused by the SNPs in PoHSP89 and PoHSP133 demonstrated a relatively high level. The identified SNPs significantly associated with floral organ number would be useful for molecular marker-assisted breeding of tree peony with respect to increasing ornamental and oil values.
-
The HSP20 family is the major member of heat shock proteins that are essential components involved in plant growth and development, and stress response, but little is known about tree peony. A total of 149 PoHSPs were identified from P. ostii genome according to the conserved ACD domain and divided into 10 subfamilies based on phylogenetic relationships. A total of 38 deferentially expressed HSP20s were identified from transcriptome of flower buds with 5-carpels and polycarpels of P. ostii plants at three developmental stages. Association analysis indicated that the differential SNPs of PoHSP89 and PoHSP133 were related to floral organ number. This study would be useful for molecular marker-assisted breeding of tree peony with respect to increasing ornamental and oil values.
-
The authors confirm contribution to the paper as follows: research topic proposed: Shu Q; experiment design: Peng L, Li Y; experiment and data analysis: Song W, Peng L, Tan W; draft manuscript preparation: Peng L, Song W; phenotypical trait data collecting and analysis: Li Y, Liu Z, Wang X; manuscript revised: Li Y, Shu Q. All authors read and approved the final manuscript.
-
All data generated or analyzed during this study are included in this published article and its supplementary information files.
We would like to thank Miss Fan Kong, Mr. Xiao Zhang, and Miss Miaomiao Song from the Institute of Botany, Chinese Academy of Sciences, for helping to collect flower buds and investigate phenotypical traits. We appreciate Mr. Kun Han from Luoyang Academy of Agricultural and Forestry Sciences for collecting phenotypical trait data. This work was supported by the National Natural Science Foundation of China (Grant No. 32072605).
-
The authors declare that they have no conflict of interest.
-
# These authors contributed equally: Liping Peng, Wenjin Song
- Supplemental Table S1 The basic information of HSP20 gene family in P. ostii.
- Supplemental Table S2 List of the putative motifs of PoHSP20 proteins.
- Supplemental Table S3 Nucleotide polymorphisms and the corresponding amino acid of PoHSP89 and PoHSP133.
- Copyright: © 2023 by the author(s). Published by Maximum Academic Press, Fayetteville, GA. This article is an open access article distributed under Creative Commons Attribution License (CC BY 4.0), visit https://creativecommons.org/licenses/by/4.0/.
-
About this article
Cite this article
Peng L, Song W, Tan W, Liu Z, Wang X, et al. 2023. Integration of genome-wide identification, transcriptome and association analysis of HSP20 gene family to revealing genetic basis of floral organ number-related traits in tree peony. Ornamental Plant Research 3:22 doi: 10.48130/OPR-2023-0022 

Integration of genome-wide identification, transcriptome and association analysis of HSP20 gene family to revealing genetic basis of floral organ number-related traits in tree peony
- Received: 02 November 2023
- Accepted: 15 December 2023
- Published online: 26 December 2023
Abstract: The HSP20 family is the major member of heat shock proteins that are essential components involved in plant growth, development, and stress response, but little is known about tree peony (Paeonia suffruticosa). In this study, genome-wide analysis combining HSP20 gene family expression analysis of tree peony transcriptome was conducted, and the association between SNPs of HSP20s and flower organ number-related traits was analyzed. A total of 149 members were identified in the P. ostii genome, and divided into 10 subfamilies, most of which were classified into cytoplasm or nucleus. Interestingly, their protein sequences were highly conserved, mainly containing motif 1 or 3. In addition, a total of 38 deferentially expressed HSP20s were identified from transcriptome of flower buds with 5-carpels and polycarpels of P. ostii plants at three developmental stages, among which PoHSP89 and PoHSP133 were further cloned from 271 cultivars for association analysis. It indicated that seven or 19 pairs of associated combinations were obtained with the number of carpel, petal, stamen in PoHSP89 and PoHSP133, which could explain the phenotypic variation by 1.79% to 4.06%, and 1.92% to 12.37%, respectively. It will provide a valuable basis for clarifying the phylogenetic relationship to understand their biological function within the HSP20 gene family, and the identified candidate genes and their corresponding associated SNP loci would reveal the genetic basis on floral organ number variation and be useful for molecular marker-assisted breeding of tree peony in view to improving ornamental traits and yields.
-
Key words:
- HSP20 /
- Tree peony /
- Association study /
- Floral organ number variation