


-
Fertilizer application is key to achieving a rapid and effective rice yield increase[1]. A panicle fertilizer plays an important role in the high-yield management technology of rice, which accounts for 30%−50% of the total fertilizer application in the rice growth period[2]. A rice panicle fertilizer mainly consists of nitrogen and potassium, among which the main function of nitrogen is to promote the growth of young rice panicles, while that of potassium is to strengthen the stalk and lodging resistance[1,3]. In a previous study, when the proportion of nitrogen and potassium in panicle fertilizer accounted for 30%−50% and 50% of the whole growth period respectively, it was more conducive to the formation of rice yield in the later stage[3, 4]. However, at present, most commercial compound fertilizers contain nitrogen, phosphorus, and potassium elements, and there are no nitrogen and potassium compound fertilizers in line with the abovementioned ratio on the market. In addition, the nutrient sources of nitrogen and potassium for a rice panicle fertilizer are typically granular urea and powdery/irregular potassium chloride, respectively. Granular urea is more suitable for unmanned air vehicle (UAV) spraying, and potassium chloride (powdery or irregular) is still sprayed using the traditional manual spraying method. However, artificial fertilization not only increases labor costs but also leads to uneven spraying, reducing the economic benefits and fertilizer use efficiency[5]. The rural labor force is aging and reducing in number due to the transfer of the labor force and the aggravation of an aging population, resulting in difficulties with employment and high wages in agriculture. By contrast, UAVs not only provide the advantages of uniform fertilization and high efficiency but can also distribute the fertilizer without destroying the crop canopy[6]. Consequently, UAV fertilization will inevitably replace manual fertilization and become the main agricultural fertilization method in the late growth stage of plants. Therefore, research on and development of high-utilization-efficiency fertilizers suitable for UAV fertilization are crucial to promote UAV fertilization in agriculture.
Extensive studies have shown that the physical properties of fertilizer particles, including sphericity, hygroscopicity, hardness, and size, have a considerable impact on mechanical fertilization. Sphericity is an indicator of fertilizer particle roundness, which has a considerable impact on friction. However, friction between fertilizer particles is an important index for the performance evaluation of centrifugal fertilization devices[7]. Therefore, the particle size will indirectly affect the fertilizer feed efficiency via friction[8]. It is well known that mechanized fertilization can make the fertilizer particle distribution more uniform[9]. The moisture absorption and hardness of a fertilizer are also important indicators that affect mechanical fertilization. Higher moisture absorption will lead to an increase in fertilizer water content, thereby reducing the fertilizer hardness and resulting in fertilizer blockage outlet and reduced fertilization efficiency[10]. In addition, there is a functional relationship between fertilizer hardness and particle size, i.e., the particle hardness increases with an increase in particle size[11]. The higher the particle hardness, the less damage caused by the chemical fertilizer through mechanical collision[12]. Therefore, higher sphericity and hardness, lower hygroscopicity, and an appropriate particle size are necessary for granular fertilizer to adapt to mechanical fertilization.
In recent years, many new fertilizers with high efficiency have been developed, and the addition of environmentally friendly synergists has emerged as an effective approach for improving fertilizer utilization. Humic acid (HA), which comprises biological macromolecules degraded by microorganisms, is an important raw material used to produce organic and inorganic fertilizers[13]. HA contains many aromatic rings, ester bonds, carboxyl groups, and hydroxyl groups, which can combine with the nutrients in soil to reduce nutrient loss[14]. HA combined with urea can reduce the soil NH3 volatilization rate (9.70%) and N2O emission (40.48%) and thereby significantly improve the nitrogen-use efficiency (NUE)[15]. Polyaspartic acid (PASP), which contains free carboxyl and amide groups, is a non-toxic, biodegradable, eco-friendly polymer. PASP exhibits good chelation, dispersion, and adsorption capacity, and it can help enrich crops with N, P, K, and trace elements, thereby improving their N, P, and K utilization rates[16]. Therefore, PASP can be used as a controlled-release agent in agriculture to improve the synergy between nitrogen demand and nitrogen input in rice[17−19]. γ-aminobutyric acid (GABA) is a free-form four-carbon non-protein amino acid that is widely present in organisms. Recent studies have shown that GABA is a signal molecule produced in plants that enhances crop-stress resistance[20]. Therefore, HA, PASP, and GABA can improve nitrogen use and the environment to some extent.
In this study, to improve the efficiency of fertilization operation and fertilizer utilization, two types of high-granular fertilizers were produced using urea, potassium chloride, HA, PASP, and GABA as raw materials. It is assumed that the two developed fertilizers can fulfill the requirements of UAV fertilizer spraying as well as improve the NUE and rice yield stabilization. The physical properties and chemical-release characteristics of fertilizers, fertilizer distribution uniformity, and agronomic characters and economic benefits of rice in the field were investigated to evaluate the UAV adaptability and application value of the newly developed rice panicle fertilizers. To the best of our knowledge, this is the first report on a new type of synergistic compound fertilizer adapted to UAV operation, which represents a new development direction for fertilizers.
-
The FTIR results showed that there were many chemical bonds that were broken or recombined in the newly developed fertilizers Hcf-P and Hcf-G (Fig. 1). The most prominent HA peaks are located at 2,500−3,350, 693−797, 1,389, and 1,010−1,137 cm−1 (Fig. 1a). After binding with Cf as the control, the HA absorption peaks at different wavelengths were minimized or clearly weakened. The characteristic absorption band of GABA at 2,500−3,100 cm−1 disappeared in Hcf-G. The absorption peak of GABA at 788 cm−1 was weakened and that at 1,400 cm−1 shifted to 1,460 cm−1. The disappearance or weakening of these characteristic absorption peaks indicates that the functional groups they represent participated in chemical reactions.

Figure 1.
FTIR spectra of Cf, Hcf-P, Hcf-G and their raw materials. (a) is for the raw material such as Cf, (b) is the intermediate products for Cf-H, Hcf-P and Hcf-G. Cf: urea and potassium chloride mixture served as control, HA: humic acid, GABA: gamma butyric acid, Cf-H: Cf and HA mixture. Hcf-P: Compound fertilizer made of urea, potassium chloride, HA, and PASP. Hcf-G: Compound fertilizer made of urea, potassium chloride, HA, and GABA.
Changes of fertilizer morphology and structure
-
Owing to the chemical reactions, the structures of the Hcf-P and Hcf-G surfaces are covered by an adhesive material (Fig. 2). However, Cf exhibited a highly rough surface with a bulk dense distribution of small particles, which was clearly different from that of Hcf-P and Hcf-G. Many voids and irregular substances were observed in Hcf-P and Hcf-G, which were caused by a dehydration condensation reaction.

Figure 2.
SEM images of Cf (a, d); Hcf-P (b, e); and Hcf-P (c, f). (a, b & c) are surface form, (d, e & f) are section shape. The multiple of the scanning electron microscope image is x500. Cf: urea and potassium chloride mixture served as control. Hcf-P: Compound fertilizer made of urea, potassium chloride, HA, and PASP. Hcf-G: Compound fertilizer made of urea, potassium chloride, HA, and GABA.
Changes in physical properties of fertilizers
-
In addition, the physical properties of the new fertilizers also changed. As shown in Table 1, the moisture and hygroscopicity of Hcf-P and Hcf-G are higher than those of Cf, HA addition is the reason for this phenomenon. However, HA reacted with other raw materials to form dense complexes, which resulted in Hcf-P and Hcf-G having a higher hardness than Cf. The three fertilizers have roundness and sphericity values that are higher than 86%, which can reduce friction and improve fertilization uniformity. The organic matter content and N-to-K ratio were similar in Hcf-P and Hcf-G, as opposed to Cf.
Table 1. Particle characteristics related indicators
Formulation Moisture
(%)Hygroscopicity
(%)Hardness
(N)Sphericity
(%)Nutrition N (%) K (%) Organic matter (%) Hcf-P 5.4a 3.0a 25.3ab 86.7a 19.2 27.2 16.1 Hcf-G 5.3a 3.2a 27.2a 88.2a 18.9 26.8 16.0 Cf 3.4b 2.3b 21.7b 86.9a 23.2 31.8 / Cf: urea and potassium chloride mixture served as control. Hcf-P: Compound fertilizer made of urea, potassium chloride, HA, and PASP. Hcf-G: Compound fertilizer made of urea, potassium chloride, HA, and GABA. Characteristics and kinetics of nutrient release from fertilizers
-
The leaching test results showed that almost 28% of N was leached from Cf on the first day, reaching up to 58% at the end of the fifth day. This indicated a rapid nutrition loss with a high release amount from Cf. After the sixth day, decreased N accumulative release ratios suddenly occurred in Cf, which indicates that the chemical fertilizer had a poor sustainable release capacity. In contrast, Hcf-P and Hcf-G released approximately 21% and 24% of N on the first day, respectively, followed by a slow and sustained release. Moreover, the time taken for the cumulative release of N to reach 60% of the total nitrogen application in Cf, Hcf-P, and Hcf-G was 6, 11, and 16 d, respectively (Fig. 3). The soil column leaching results demonstrated the particular slow-release performance of Hcf-P and Hcf-G under a simulated irrigation water condition.
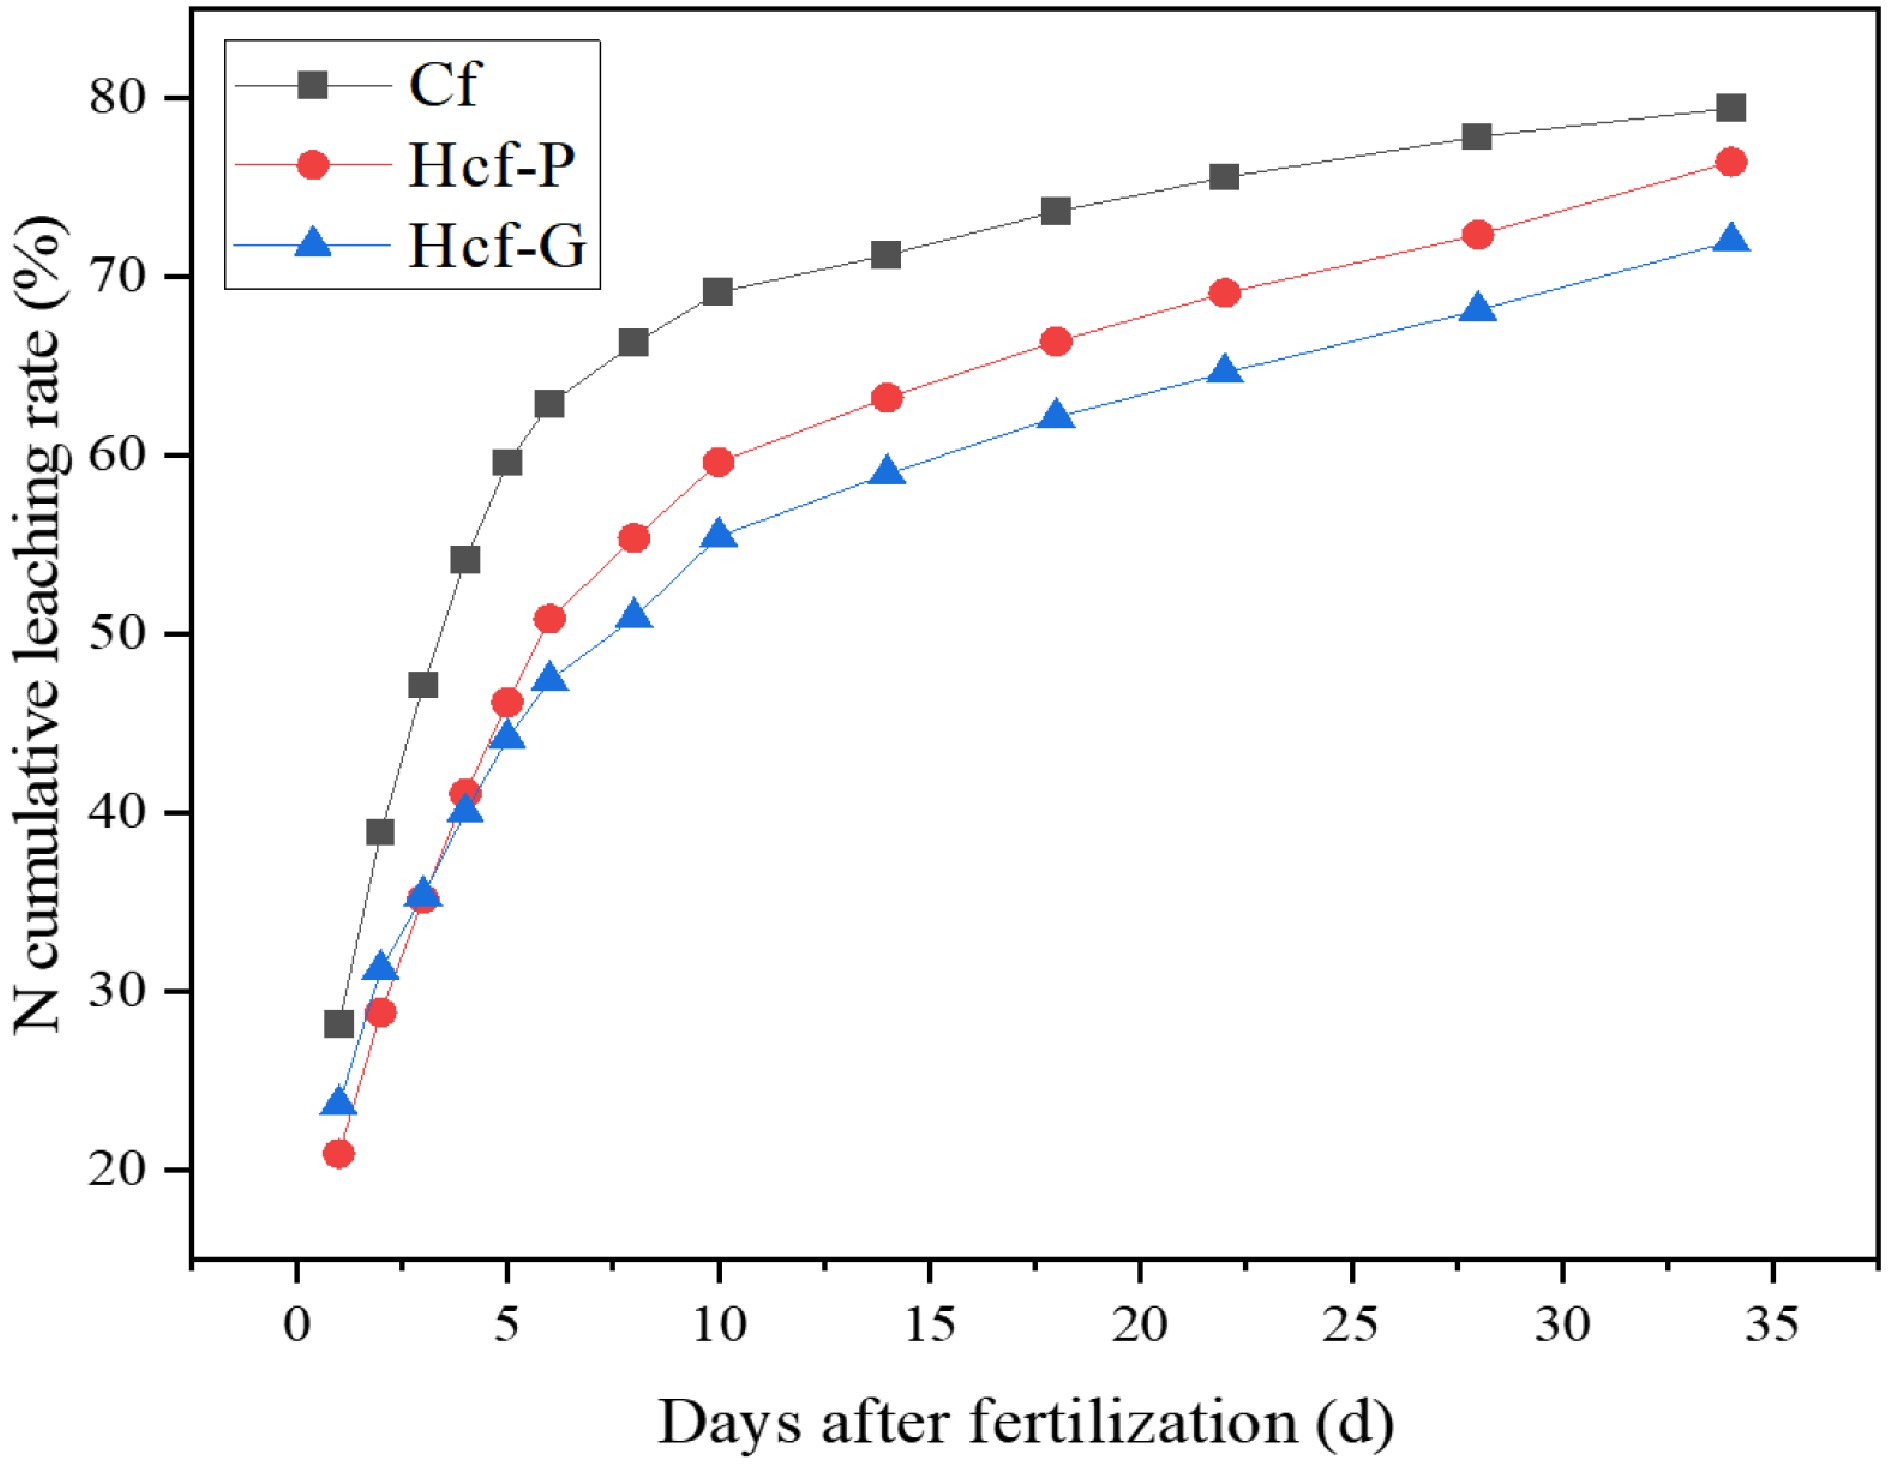
Figure 3.
Nitrogen cumulative leaching rate of different fertilizers. Cf: urea and potassium chloride mixture served as control. Hcf-P: Compound fertilizer made of urea, potassium chloride, HA, and PASP. Hcf-G: Compound fertilizer made of urea, potassium chloride, HA, and GABA.
To investigate the slow-release kinetics and mechanism, several mathematical models were employed to describe the slow release of N from Cf, Hcf-P, and Hcf-G, including the first-order kinetic equation, second-order kinetic equation, Elovich, and Freundlich models. As shown in Table 2, the release of N from Cf fitted the second-order model. For Hcf-G, the N release kinetics fitted the Elovich model well. Moreover, the release of N from Hcf-P fitted both the second-order and Elovich models. However, the difference in the second-order model between Hcf-P and Cf is primarily based on the solubility rate (k2) instead of the release amount at equilibrium (Qe). For the Elovich model of Hcf-P and Hcf-G, there are subtle differences in the desorption energy of the system.
Table 2. Dynamic formula for cumulative release of leached nitrogen in fertilizer soil column
Fertilizer First-order kinetic
equationSecond-order kinetic
equationElovich Freundlich Qe K1 R2 Qe K2 R2 α β R2 n K3 R2 Hcf-P 0.701 0.221 0.960 0.819 0.324 0.992 1.391 0.850 0.992 3.236 0.269 0.958 Hcf-G 0.647 0.247 0.904 0.743 0.424 0.972 1.391 0.870 0.996 3.520 0.271 0.952 Cf 0.745 0.339 0.960 0.835 0.558 0.995 1.529 0.865 0.959 4.391 0.380 0.904 Cf: urea and potassium chloride mixture served as control. Hcf-P: Compound fertilizer made of urea, potassium chloride, HA, and PASP. Hcf-G: Compound fertilizer made of urea, potassium chloride, HA, and GABA. Optimization of particle size of fertilizers for UAV fertilization
-
A three-factor five-level central composite design (CCD) was conducted to optimize the mutual effect of three independent variables on the lateral variation coefficient (CV). The factors include particle size (A), centrifugal speed (B), and flux (C). Supplemental Table S1 shows the CV design matrix. After these data were treated with the CCD, second-order polynomial equations were designed to reflect the empirical relationship between the CV and the independent variables (i.e., A, B, and C): CV = 205.9 – 25.71 A – 0.2490 B – 0.02511 C + 0.002007 AC + 3.015 A2 + 0.0001330 B2 + 3.344E-06 C2. The F value of the equation model was 26.97, and the p value was less than 0.0001, indicating that the model was highly statistically significant. The F and p values that indicated a lack of fit were 3.29 and 0.1084, respectively, which confirmed the goodness-of-fit and suitability of the regression model (Table 3). The optimal A, B, and C values of the equation solution were 3.35 mm, 936 r/min, and 2,751 grain/s, respectively, and the minimum CV value was 11.87%.
Table 3. Variation Variance Analysis of independent variables
Source Sum of squares df Mean square F-value P-value Significance Model 875.40 9 97.27 26.97 < 0.0001 ** A 49.35 1 49.35 13.69 0.0041 ** B 34.70 1 34.70 9.62 0.0112 * C 18.24 1 18.24 5.06 0.0482 * AB 3.11 1 3.11 0.86 0.3748 AC 64.47 1 64.47 17.88 0.0017 ** BC 0.93 1 0.93 0.26 0.6223 A² 262.05 1 262.05 72.67 < 0.0001 ** B² 259.45 1 259.45 71.94 < 0.0001 ** C² 322.30 1 322.30 89.37 < 0.0001 ** Residual 36.06 10 3.61 Lack of fit 27.66 5 5.53 3.29 0.1084 Pure error 8.40 5 1.68 Cor total 911.46 19 A: particle size (mm), B: centrifugal speed (r/min), C: flux (grain/s). * significant (P < 0.05), ** extermely significant (P < 0.01) The stereogram and contours of the response surface demonstrated that there is an interaction between A and C (Fig. 4); additionally, CV first increased and then decreased with an increase in A and C. The particle size was 2.40−4.20 mm, and the flux was 1,810−3,610 grain/s with a minimum CV value. Optimization matrices of A and C were set to further optimize the above interval (Supplemental Table S2). The results showed that when the particle size was 2.46−4.18 mm and the flux was 1,848−3,601 grain/s, the CV value was in the range of 12.24%−14.99%.
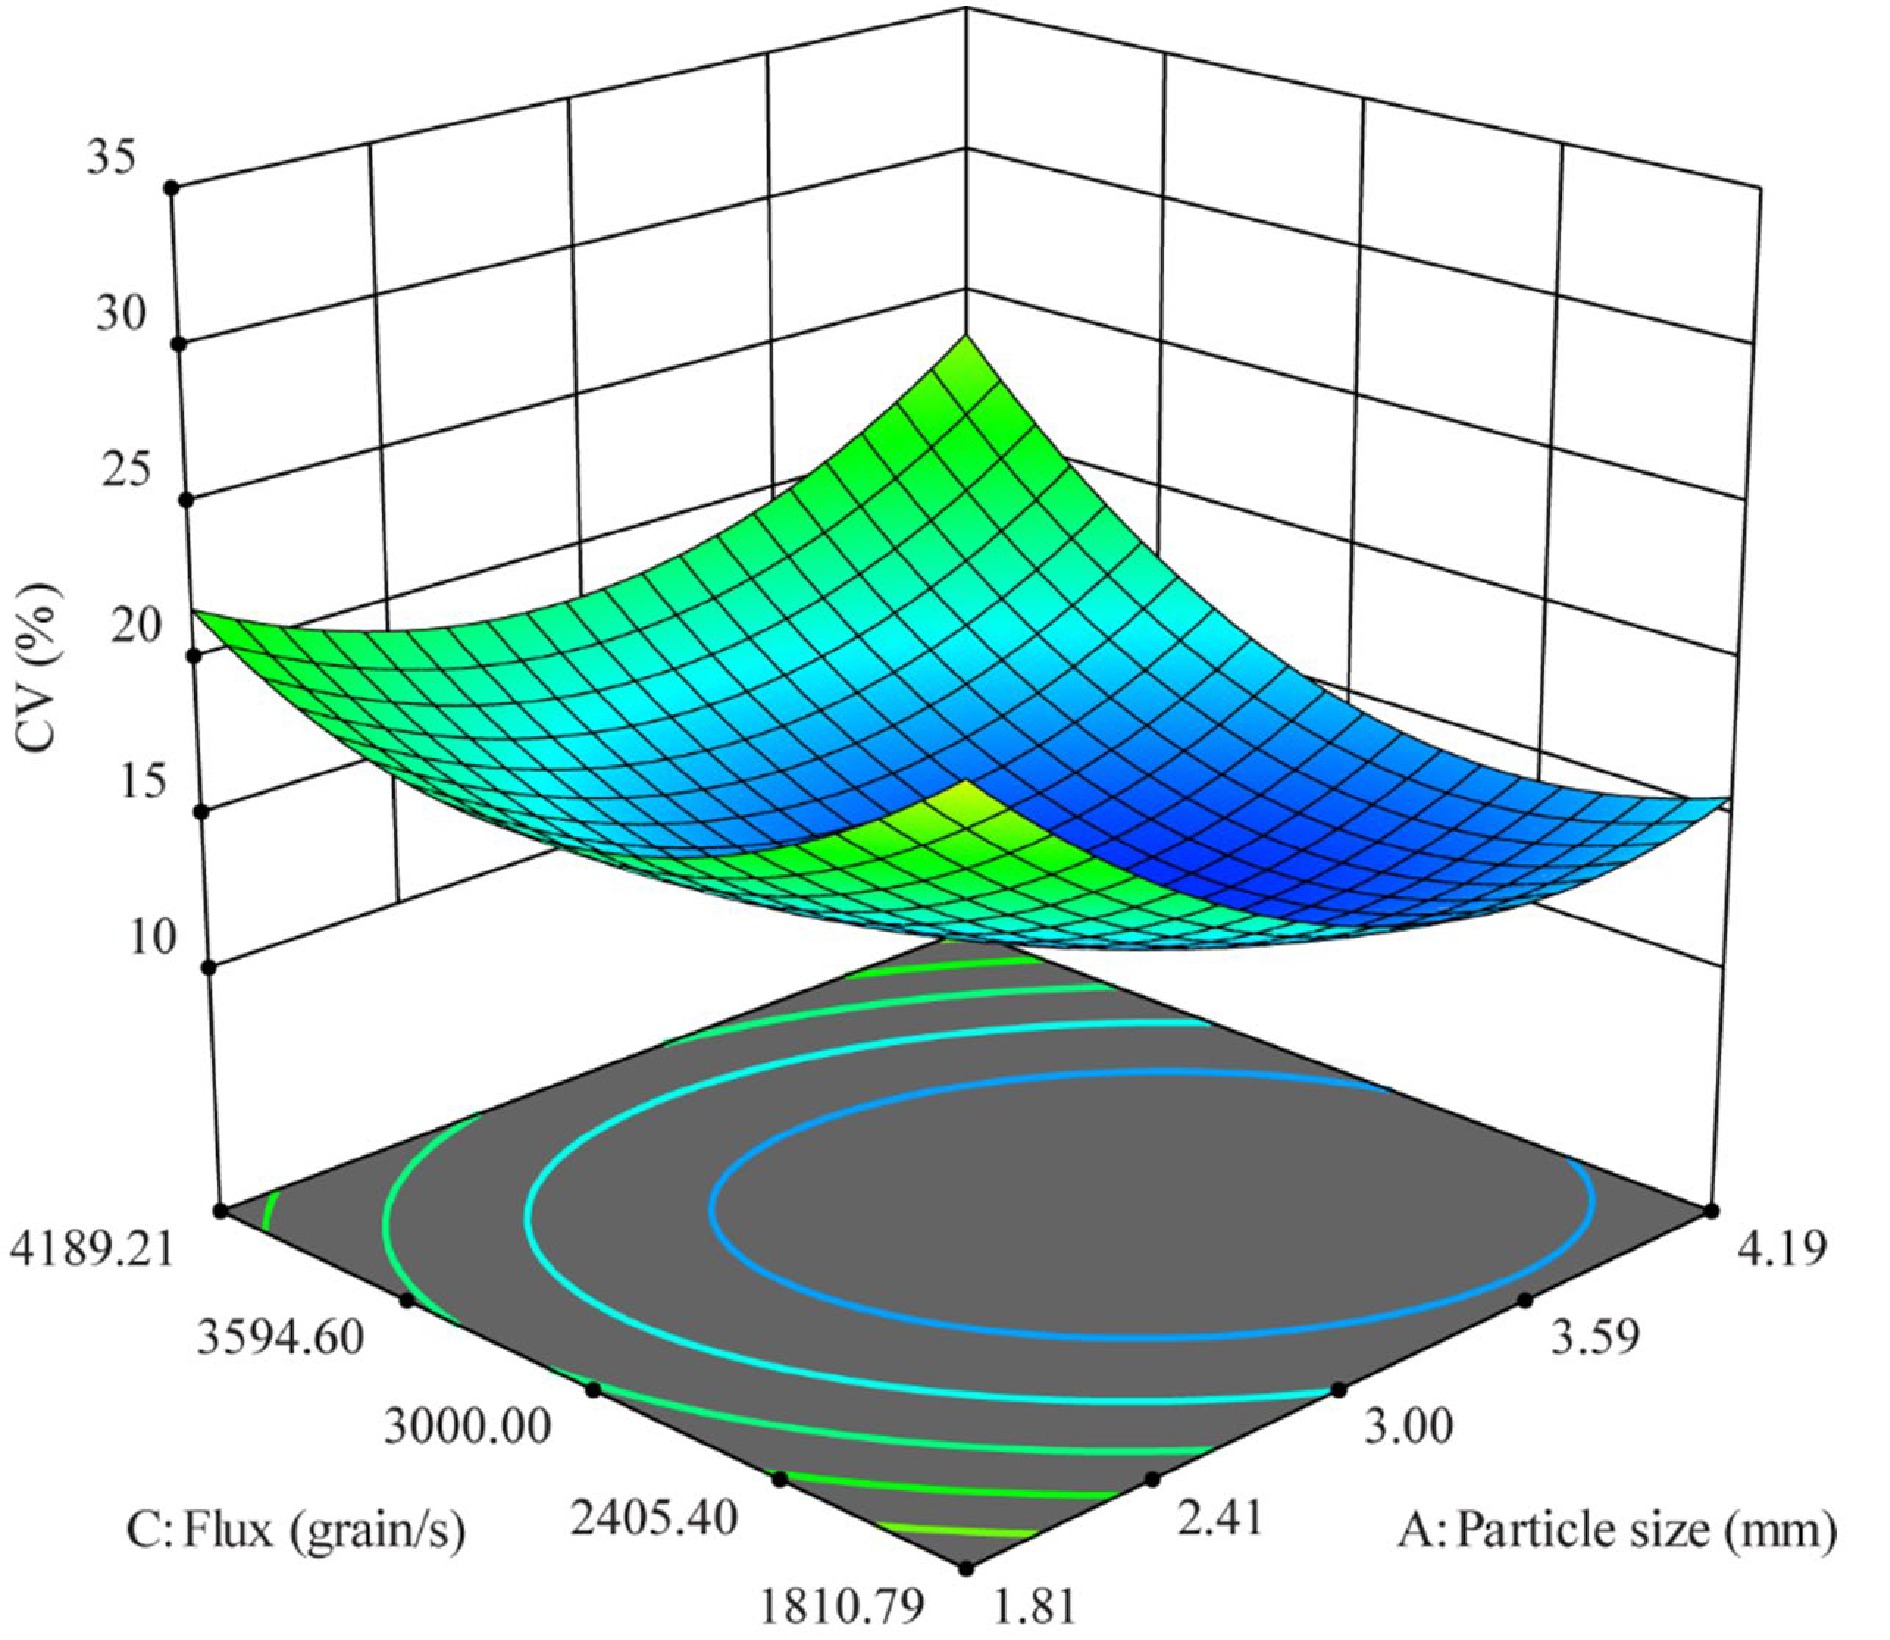
Figure 4.
Response surface analysis of factors affecting evenness.
The size of the three new fertilizer particles ranged from 2.07–5.13 mm, and more than 80% of the data were within the optimal simulation range of 2.46–4.18 mm. In addition, the average diameter of the three fertilizers was similar to the simulated value of 3.35 mm (Supplemental Fig S1). The results of the bench test showed that the CV of Hcf-P, Hcf-G, and Cf were 13.08%, 12.65%, and 14.89%, respectively.
Field application effects of the new fertilizers
-
Table 4 shows that for Hcf-G, dry matter, nitrogen accumulation, and NUE are significantly higher than those of Cu in 2020, and the yield is 6.89% higher than that of Cu. In 2021, dry matter, nitrogen accumulation, yield, and NUE were significantly higher than those of Cu. Therefore, Hcf-G can increase production and NUE. For Hcf-P, the two-year data showed no significant increase compared with Cu; however, the yield increased by 4.74%, and its NUE value was 36.28% higher than that of the Cu treatment on average. Therefore, Hcf-P can improve rice NUE and stabilize the rice yield. In addition, we calculated the NEB of different fertilizers according to the total cost and income of the rice yield (Supplemental Tables S3 & S4). Compared with Cu, the two-year NEBs of Hcf-P and Hcf-G increased by an average of 916 and 2,742 CNY ha–1, respectively. Although the annual data may vary owing to weather factors, the trends between different treatments were similar. Overall, UAV spraying of the new panicle fertilizer can increase economic benefits based on a stable or increased yield and NUE.
Table 4. Dry matter accumulation, nitrogen accumulation and yield at maturity stage of rice
Deal Dry matter (t ha–1) N accumulation (kg ha–1) Yield (t ha–1) NUE (%) NEB (CNY ha–1) 2020 2021 2020 2021 2020 2021 2020 2021 2020 2021 Hcf-P 15.33b 15.93b 185.11ab 161.01b 9.90a 8.32b 65.73ab 61.00b 9,254.94 5,218.33 Hcf-G 17.24a 19.15a 189.42a 175.80a 10.39a 9.30a 71.71a 81.54a 10,460.21 7,666.66 Cu 14.69b 16.16b 170.58b 151.34b 9.72a 7.73b 45.54b 47.57b 8,860.52 3,781.64 NEB is economic benefit. Cu refers to the application of urea by UAV and artificial potassium fertilizer. Cf: urea and potassium chloride mixture served as control. Hcf-P: Compound fertilizer made of urea, potassium chloride, HA, and PASP. Hcf-G: Compound fertilizer made of urea, potassium chloride, HA, and GABA. -
The fertilizer particle formation process directly affects the particle physical properties. Sastry and Fuerstenau[21] detailed the granulation mechanism of fertilizer particles, including nucleation, growth, random coalescence, pseudo-stratification, and rolling stratification. The state diagram theory of Iveson and Litster[22] shows that the type of particle growth behavior is the function of particle deformation and maximum pore saturation during collision. This means that the fertilizer raw material has a direct relationship with particle pore formation. This is the reason for the different SEM images of Hcf-P, Hcf-G and Cf in this study. Meanwhile, different raw materials have different degrees of chemical reactions during particle formation. Liang et al.[23] showed that the combination of HA and urea form a variety of chemical bonds with high chemical stability. In this study, there are several vibration bands in HA, including O-H bond vibrated at 2,500−3,350 cm−1[24, 25], CH2, C-CH vibrated at 693−797 cm−1, C-N vibrated at 1,389 cm−1, and C-O vibrated at 1,010−1,137 cm−1[26]. These compounds bind to -NH2 in urea to form C-NH-C and -CO-NH- complexes[23, 27]. In addition, because GABA and PASP are polypeptide amino acids, their-R and urea-NH2 binding are similar to HA. Therefore, after GABA and PASP were combined with intermediate product Cf-H, the same complex was formed with the vibration changes of chemical bonds such as C-H, C-O, N-H, and C-N. It is worth noting that the amount of GABA and PASP is only 3 ‰, resulting in a chemical reaction involving GABA and PASP being masked (Fig. 1b). However, we can still observe the disappearance of the absorption peak from the FTIR of GABA itself. The disappearance of the absorption peak caused by the C-N stretching vibration of PASP at 1,400 cm−1 proves that they are indeed involved in the reaction[15].
The physical and chemical reactions in the production of different fertilizers lead to the difference in the physicochemical properties, which affects the release rate of the new fertilizers. The release kinetics model shows that the release of Hcf-P and Cf conforms to the second-order kinetic equation. This means that the release of Hcf-P and Cf in the soil is a comprehensive dissolution, desorption, and diffusion process. It is worth noting that the second-order kinetic equation and the Langmuir equation are the same, and the fitting effect is better than the Freundlich equation. The release of Hcf-P was affected by chemical monolayer adsorption, which increases the adsorption difficulty[28]. The release of Hcf-G conforms to the Elorich model, which indicates that the release of Hcf-G is affected by the diffusion effect. The simulation equation does not pass through the coordinate origin, which proves that the adsorption process is affected by intraparticle diffusion[29−31], and the internal diffusion is directly related to the porosity of the intraparticle section. The release kinetics model results showed that the Hcf-P release was greatly affected by chemical action, and the physical properties of Hcf-G release were greatly affected. In addition, the slow degradation of the C-NH-C and-CO-NH- complexes formed by the chemical reactions of new fertilizers Hcf-G and Hcf-P will also delay the fertilizer release.
Because of the slow-release effect, the effective period of the new fertilizers is longer. The results of this study showed that it took approximately 30 d for the Hcf-P and Hcf-G fertilizers to release 70% of the total nitrogen. Previous studies have shown that the best nitrogen fertilizer application period for rice young panicle differentiation is 15−20 d after the jointing stage[32, 33]. In this study, it took approximately 10 d for fertilizer Cf to release 70% of the total nitrogen. In addition, the rice young panicle differentiation period was approximately 30 d. Therefore, according to the above time calculation, the new fertilizer efficiency can meet the nitrogen requirement in the entire rice young panicle differentiation stage. The application effect of the new fertilizers under field production showed stable yield and improved NUE, which also demonstrates that application of the new fertilizers at the early young panicle differentiation stage could meet the demand for nutrients in the later rice growth stage. The optimal application period and rate of the new fertilizers need to be further studied in order to reduce the cost and improve rice production efficiency.
Requirements for fertilizer particle characteristics adapted to UAV spraying
-
Previous studies have shown that the fertilizer hardness increases as the particle size increases and decreases as the moisture content increases. Furthermore, the static friction coefficient between fertilizer and organism increases as the moisture content increases[34]. However, the moisture absorption of fertilizer particles has a decisive effect on moisture content. This means that there is a close relationship between fertilizer particle moisture absorption, hardness, and size. A smaller particle moisture content and hygroscopicity and larger particle hardness are conducive to mechanized fertilization uniformity. In general, the particle size of small urea is less than 2.0 mm, and the hardness is approximately 10 N. In this study, the average particle size of Hcf-P and Hcf-G is approximately 3.3 mm (Supplemental Fig. S1), and the hardness is much larger than that of small urea, which is in agreement with previous studies, that is, an increase in fertilizer particle size improves the fertilizer hardness. It is worth noting that the fertilizer moisture absorption is determined by the raw materials and is generally difficult to change, while the fertilizer particle size is affected by a variety of factors and can be regulated. A simulated performance evaluation is typically used to understand the differences in the fertilization effect and emission distribution, owing to the differences in fertilization devices and fertilizer physical characteristics[35]. The particle size is typically set to a fixed value to evaluate the fertilization equipment[4, 36]. However, the particle size of factory-produced fertilizers does not have a fixed value. When the rotational speed is 936 r/min and the discharge volume of the UAV seeding device is 2,751.27 grain/s, the fertilizer distribution first exhibits a left and then a right deviation (Supplemental Fig S2) with an increase in particle size, which indicates that particle size has a considerable influence on the fertilizer deposition and distribution. In addition, the interaction between particle size and flux rate has a significant indigenous effect on fertilizer particle deposition and distribution; when these values were 2.46−4.18 mm and 1,810−3,610 grain/s, respectively, the CV was 12.24%−18.35% (Supplemental Table S2). Grift et al.[37] proposed that when the fertilization band width is small, the CV is below 15% and provides an acceptable fertilization uniformity. Therefore, the particle size was further optimized to ensure fertilization uniformity using an UAV. For CV ≤ 15%, the best simulated fertilizer particle size is 2.46−4.18 mm (Supplemental Table S2).
Although there is a difference between the optimal particle size in the simulation (2.46−4.18 mm) and the actual particle size (2.07−5.13 mm), the CV (13.50%) results from the bench tests still meet the simulation requirements (CV ≤ 15%). We suggest that this may be related to the effect of particle size on the particle deposition distribution. The single-factor results for particle size show that for a particle diameter less than 2.50 mm, the particle distribution exhibits a left-deviation trend, and when the particle diameter is larger than 4.00 mm, the particle distribution exhibits a right-deviation trend (Supplemental Fig S2). The left and right deviation of the particles complement each other and increase the fertilizer distribution uniformity. Therefore, although the optimal particle size in the simulation is 2.46−4.18 mm, the available fertilizer particle size range could be further expanded according to the actual production situation to reduce production costs. The actual particle size of the new fertilizers (2.07−5.13 mm) meets the uniformity requirements of UAV spraying; however, the appropriate maximum range needs to be further studied.
-
In this study, GABA, PASA, HA, urea, and potassium chloride were combined to prepare Hcf-P and Hcf-G compound fertilizers. The chemical reaction between Hcf-P and Hcf-G formed C-NH-C and -CO-NH- complexes and particle voids, which led to a slow-release effect in the fertilizer. The particle size of the new fertilizers is 2.07−5.13 mm, and the CV of the fertilizer distribution is only 13.5%, which indicates a higher fertilizer spraying uniformity using an UAV. Higher uniformity assists with ensuring a uniform fertilizer distribution in the field. As a result, the economic benefits of spraying the new panicle fertilizers via UAV increased by 916−2,742 CNY ha−1 with stable or increased yield and NUE. Therefore, the two new fertilizers, Hcf-P and Hcf-G, have the potential for large-scale production and application.
-
Urea, potassium chloride, PASP (provided by Sichuan Meiqing Company, Sichuan, China), GABA (provided by Shandong Aobang Biotechnology Co., Ltd., Shandong, China), and HA (provided by Guoke Zhongnong Biotechnology Co., Ltd, Sichuan, China; peat with HA ≥ 25%) were used as raw materials to produce three new types of rice panicle fertilizers; the proportion of each raw material is shown in Supplemental Table S5. Urea and HA were mixed and stirred for 30 min at 25 °C; then, potassium chloride, PASP, or GABA were added successively, and granulation was carried out via extrusion granulation. The particles were dried and reshaped for 1 h using a rolling dryer at 120 °C.
Fertilizer physicochemical properties
Chemical property
-
The total N and K contents in the fertilizer were measured using the Kjeldahl and flame photometric methods, respectively. The total organic carbon in the fertilizer was determined using an element analyzer (VARIO TOC, Elementer, Germany), and the organic matter content was converted. Under the condition of 400−4,000 cm−1, the Fourier transform infrared (FTIR) spectra of the Hcf-P, Hcf-G, and Cf fertilizers were obtained by scanning 16 times with a 4 cm−1 resolution, and the chemical functional group structures of the fertilizer particles were qualitatively compared.
Physical property
-
First, 10 g of Hcf-P, Hcf-G, and Cf were weighed and dried to a constant weight in an oven at 105 °C. Then, the three types of dried fertilizers were placed in the open air at room temperature (25 °C) for 20 h, and the hygroscopicity of the fertilizers was determined by weight difference with three repetitions per fertilizer. Subsequently, 200 grains were randomly selected from each fertilizer (i.e., Hcf-P, Hcf-G, and Cf), and their length, width, and height were measured using vernier calipers to calculate the sphericity of the grains. Twenty Hcf-P, Hcf-G, and Cf grains were randomly selected to measure the maximum stress intensity when they were damaged. The formula used to calculate the degree of sphericity (
$ \varnothing $ $ \varnothing ={\left({w}^{2}/hl\right)}^{1/3}\times 100{\text{%}} $ (1) where w, h, and l are the fertilizer particle width, height, and length, respectively; w is the minimum value of the triaxial size.
The morphology of the two new types of fertilizers (Hcf-P and Hcf-G) and control fertilizer (Cf) new types of fertilizers particles was observed using a scanning electron microscope under ×500 magnification and a 15-kV acceleration voltage; the changes in the appearance of the surface and internal sections of the fertilizer were measured.
Determining the fertilizer release characteristics
-
The nitrogen-release behavior of the Hcf-P, Hcf-G, and Cf fertilizers was studied via the soil column leaching method[25]. Quartz sand, soil, and fertilizer were inserted into the soil column, as shown in Supplemental Fig S3. Deionized water (170 mL) was injected into the soil column tube on the 1st, 2nd, 3rd, 4th, 5th, 6th, 8th, 10th, 14th, 18th, 22nd, 34th, and 40th day, and the leaching solution was collected at the bottom of the soil column with a clean beaker. The N concentration of the leaching solution was determined using the Kjeldahl method, and the cumulative release rate of the fertilizer was calculated. Each treatment was repeated three times, and a blank control without fertilizer was set. Moreover, four release kinetic models were used to fit the leaching data[25, 38].
$ {\rm{First{\text -}order\; kinetic\; equation:\; }}\ln (Q_{e} - Q_{t}) = \ln Q_{e} - k_{1} t$ (2) ${\rm{ Second{\text -}order\; kinetic\; equation:}}\; t / Q_{t} = 1 / (k_{2} Q_{e}^{2}) + t / Q_{e} $ (3) ${\rm{ Elovich:\;}} Q_{t} = 1/\beta \ln \alpha\beta + \ln 1/\beta \ln t $ (4) ${\rm{ Freundlich: \;}}Q_{t} = k_{3} t ^{1/n} $ (5) where Qe and Qt (both in mg·g−1) refer to the amount of fertilizer released at equilibrium and at time t (h), respectively. k1 (1·h−1) and k2 (g·(mg·h)−1) are the solubility rate of the first and second kinetics, respectively. α (mg·g−1·h−1) is the initial desorption rate, β (g·mg−1) is the system constant for the desorption energy, k3 (mg·g−1) represents the reaction rate constant of the Langmuir isotherm model, and n is the system temperature constant.
Fertilizer UAV adaptability evaluation
Simulation and orthogonal test
-
The particle parameters for optimum UAV fertilization were determined using an orthogonal simulation. Three variables, namely, particle size, flux, and centrifugal speed, were considered to be the influence factors of UAV fertilizer uniformity, and the lateral variation coefficient (CV) was used as the response index for the quadratic response surface-regression analysis. According to GB 15063-2020, the proportion of compound-fertilizer particles with a particle size of 1.00−4.75 mm should be more than 90%[39]. Accordingly, the particle diameter variation range was set to 1−5 mm. The spinner rotating speed and flow rate were set to 800−1,600 r/min and 1,000−5,000 grain/s, respectively[7, 31]. The factor level coding is shown in Supplemental Table S6.
Bench test
-
Based on the ASAE experimental standard, 14 × 33 boxes with an area of 300 mm × 400 mm were placed in the 10 m × 40 m collection area. The bottom of each paper box was covered with 500 g of fine sand to prevent the fertilizer from bouncing out of it. After spreading fertilizer via UAV, the fertilizer in the box was collected and the CV was calculated according to the number of particles as follows[34]:
$ cv=\sqrt{1/\left(n-1\right){\Sigma }_{i = 1}^{n}{\left({m}_{i}-\overline{m}\right)}^{2}} $ (6) where
$ \overline{m} $ Field experiment
-
Field experiments were conducted in Dayi County, Sichuan Province, China (30°49 N, 103°57 E), in 2020 and 2021. Rice variety Jingyou 781 was used as the test material. Dayi County belongs to a subtropical humid monsoon area, and the experimental soil is middle loam. The physical and chemical properties of the soil are shown in Supplemental Table S7. A single-factor randomized block design was used in the experiment. There were four treatments, CK (without panicle fertilizer), Cu (urea spread via UAV, potash spread artificially), and Hcf-P and Hcf-G (using an UAV to spread the corresponding fertilizer), which were applied with three repetitions. The panicle fertilizer application rates for N and K2O were 69 and 94 kg ha−1, respectively. The same amount of basal and tillering fertilizers had N, P2O5, and K2O application rates of 108, 90, and 90 kg ha−1, respectively. Three seedlings were planted in each hole with a 30 cm × 20 cm density and 50 m2 (5 m × 10 m) area per plot.
In the mature stage, the number of panicles was randomly investigated from 60 hills of rice plants. Three hills of rice plants were selected according to the average number of panicles in each plot. The stems, leaves, and panicles of rice were separately packed in kraft paper bags. Then, the samples were treated at 105 °C for 60 min and dried at 75 °C to a constant weight. The dry weight of each part was determined, and the N content (%) of each part was determined using the Kjeldahl method. Rice was harvested at the maturing stage. The yield of each plot was recorded after measuring the moisture content and removing impurities, and the standard grain yieid of each plot was determined at 13.5% moisture content. The synergistic N and K utilization efficiency of the new panicle fertilizer was expressed by the NUE, the economic benefit (NEB) of UAV fertilization were calculated according to Wang et al.[40].
$ NUE = (N_{\rm N} - N_{\rm{CK}}) / N $ (7) where NN is the nitrogen uptake in the panicle fertilizer application area, NCK is the nitrogen uptake in the area without spike fertilizer, and N is the panicle fertilizer application rate.
$ NEB=I-C $ (8) where I is the rice grain income, and the rice price is 2.56 CNY kg−1. C is the total gross cost (CNY ha−1), which includes expenditures associated with seeds, labor, fertilizers, pesticides, and land rent.
Statistical analysis
-
The software NX10.0 (Siemens PLM Software) was used for the three-dimensional modeling of the UAV seeding device, Design Expert 11 (Stat-Ease) was used for the orthogonal experiment analysis, EDEM (DEM-solutions) was used for the UAV spraying simulation analysis, and Origin 2021 (originlab) was used to plot the results. Excel (Microsoft) was used for the analysis of variance to determine the average difference between the data (p < 0.05).
The authors would like to thank all members of the Paddy Laboratory of the Sichuan Agriculture University of China for their suggestions and help. We would also like to thank Editage (
http://www.editage.cn ) for English language editing. This work was supported by the National Natural Science Foundation of China (NSFC) [grant number U20A2022] and the Ministry of Science and Technology of Sichuan Province Government [grant numbers 2022NSFSC1637, 2021YFYZ0005].-
The authors declare that they have no conflict of interest.
-
These authors contributed equally: Shilin Zhu, Wei Zhou
- Supplemental Table S1 Quadratic orthogonal regression rotation combination test scheme and results.
- Supplemental Table S2 Particle size and Flux interaction optimization scheme and results.
- Supplemental Table S3 Annual cost estimation.
- Supplemental Table S4 Annual economic benefit estimation.
- Supplemental Table S5 Weight ratio of fertilizer formula.
- Supplemental Table S6 Factor level coding table.
- Supplemental Table S7 Soil physicochemical properties.
- Supplemental Fig. S1 Particle size of different fertilizers ' - ' is the mean value of the data. The range of upper and lower ' -- ' was 2.46-4.18mm.
- Supplemental Fig. S2 Effect of different particle sizes on fertilizer deposition distribution.
- Supplemental Fig. S3 Simulation diagram of soil column leaching test. Soil column leaching tube from top to bottom is 25g quartz sand, 250g air-dried soil and 0.24g fertilizer, 250g air-dried soil, 25g quartz sand.
- Copyright: © 2022 by the author(s). Published by Maximum Academic Press, Fayetteville, GA. This article is an open access article distributed under Creative Commons Attribution License (CC BY 4.0), visit https://creativecommons.org/licenses/by/4.0/.
-
About this article
Cite this article
Zhu S, Zhou W, Zhu L, Sun B, Huang S, et al. 2022. Unmanned air vehicle adaptability and application evaluation for new rice panicle fertilizers: Fertilizer characteristics and mechanical adaptability. Technology in Agronomy 2:1 doi: 10.48130/TIA-2022-0001 

Unmanned air vehicle adaptability and application evaluation for new rice panicle fertilizers: Fertilizer characteristics and mechanical adaptability
- Received: 25 April 2022
- Accepted: 25 July 2022
- Published online: 26 August 2022
Abstract: High-efficiency fertilizers suitable for mechanical spraying can improve the fertilizer application and utilization efficiency. In this study, two types of granular compound fertilizers suitable for unmanned air vehicle spraying were developed using urea, potassium chloride, humic acid, and an amino acid synergist according to the fertilization requirements of rice at the booting stage. The physical and chemical properties of the compound fertilizers were analyzed by Fourier transform infrared spectroscopy and scanning electron microscopy. The release kinetics of the fertilizer was studied via a soil column leaching experiment. The effect of fertilizer particles on unmanned air vehicle spraying uniformity was studied via an orthogonal simulation experiment. Results showed that the chemical interaction between compound-fertilizer raw materials formed complexes such as C-NH-C and -CO-NH-, which caused a change in fertilizer particle morphology. This led to chemical monolayer adsorption or internal fertilizer diffusion, which in turn delayed the fertilizer release by 5−10 d. A simulation bench test showed that the fertilizer particle hardness and roundness exceeded 20 N and 85%, respectively, while the particle size was in the range of 2.07−5.13 mm, which resulted in good unmanned air vehicle spraying uniformity with a lateral variation coefficient of less than 15%. Finally, the experimental field results demonstrated that the new compound fertilizers, when sprayed by an unmanned air vehicle, could improve the economic benefit by 916−2742 CNY ha−1 without reducing the nitrogen utilization rate and rice yield. The new compound fertilizers exhibit delayed release, good spraying uniformity, and improved economic benefit, rendering them suitable for large-scale promotion and application.