


-
In order to quantify both development and growth, several studies have used the leaf production of cereal plants[1]. Thus the main focus has been devoted to the leaf area and its relation with growth[2]. At some point there are two main elements that largely influence the leaf number which are the rate of primordium formation at the stem apical meristem and the rate of leaf appearance[3]. To guarantee the expression of the crop potential growth the leaf number plays a significant role in crop leaf area development that in the end determine photosynthetic activities and crop growth[4]. Researchers have relied on leaf number and its appearance rate as an indicator to describe and interpret the growth and development of plants[5]. The leaf age model of any rice variety can be used for an extensive diversity of rice varieties to analyze and comprehend its growth process and through it present a theoretical basis for a suitable model for cultivation. Yet it can still be used to predict the organs formation since it is well correlated to the other organs such as spike stem and roots[6]. The leaf appearance rate is the result of the leaf number that is formed on a stem per unit of time[7]. Yet, leaf number is a result of the leaf initiation and their extension to leaves[8]. The crop simulation model can be carried out based on leaf appearance which is considered to be one of the most critical aspects of rice growth[9].
Rice growing stages such as flowering stage can be predicted once the leaf number is known based on the leaf appearance date[10]. Still it can be used to evaluate the crop response to various factors such as temperature and nutrients[11].
Each rice type presents its specific genetic characteristics, certainly their response to nitrogen applications will be different, their leaf number, leaf appearance rate and growth duration will also be different. To know and understand each rice type's response to different nitrogen applications becomes an important tool to control and manage leaf number and growth duration which will allow us to improve the yield. Different studies have focused on environmental factors and nitrogen rates and their impact on leaf number[12, 13]. However, most results of these studies concluded that high doses of nitrogen increased the leaf number[14].
However, none of the above-mentioned studies focused on two specific rice types using a considerable number of cultivars or compared their leaf number under different nitrogen rates. To analyze the difference of leaf number between different rice varieties under different nitrogen rates during vegetative stage, two rice types namely Hybrid Indica and Japonica rice were used, and three nitrogen applications rates (N0, N150 and N300) were applied. Leaf number, leaf appearance rate and time duration from transplant to panicle initiation stage were analyzed.
The results of the present experiment revealed that the variety, nitrogen applications, and years (planting season) have a significant effect on leaf number. However, the differences between varieties are considerably large, while the effects of nitrogen fertilizer and year on leaf number are less than 0.4. Leaf appearance rate increases exponentially along with duration from transplant up to panicle initiation. Hybrid Indica rice type revealed to be more responsive to nitrogen application as opposed to Japonica rice type.
-
The experiment was represented by the years 2017 and 2018 with the same design throughout the experiment in Danyang city Jiangsu Province in the experimental base of Nanjing Agricultural University in China Experimental Farm (East 119º28', Northern 31º54'). The soil is yellow, and the physical and chemical parameters of 0−20 cm are as follows: Organic matter 17.15 g kg−1, total nitrogen 0.97 g kg−1, total phosphorus 0.50 g kg−1, whole potassium 10.99 g kg−1, available nitrogen 70.60 mg kg−1, quick-acting phosphorus 13.23 mg kg−1, available potassium 119.41 mg kg−1, pH 6.9. The experiment was conducted using the Transplanting-Machine and was planted in May. The nursery nutrition tray propagated the seedlings. On June 15th transplant activities took place in the field, and the row spacing of the machine inserts was 17 cm × 30 cm, for Indica rice and 17 cm × 30 cm for Japonica rice (Table 1), with about three seedlings per hole. The design of the plot adopted the split zone design, with three different levels of nitrogen: N0 (no nitrogen applied during the whole growth period), N1 (150 kg hm−2 during the whole growth period) and N2 (300 kg hm−2 during the whole growth period).
Table 1. List of varieties used in 2017 and 2018.
2017 Year Varieties Type Year Varieties Type Year Varieties Type 2007 C Liangyou 396 Hybrid Indica 2011 xin Liangyou 611 Hybrid Indica 1957 Nong Ken 57 Japonica 2014 C Liangyou Huazhan Hybrid Indica 2002 xin Liangyou 6380 Hybrid Indica 2010 Nan Jing 0212 Japonica 2012 E Liangyou 476 Hybrid Indica 2003 xin Liangyou 6 Hybrid Indica 2004 Nan Jing 46 Japonica 2016 Y Liangyou 1964 Hybrid Indica 2002 Xinyou 188 Hybrid Indica 2005 Nan Jing 5055 Japonica 1993 Y Liangyou No.1 Hybrid Indica 2014 Zaoyou 929 Hybrid Indica 2009 Nan Jing 52 Japonica 2008 Y Liangyou 2 Hybrid Indica 1981 shanyou63 Hybrid Indica 2009 Nan Jing 9108 Japonica 2009 Liangyou 3905 Hybrid Indica 2009 Taifeng You208 Hybrid Indica 2001 Nan Jing No.1 Japonica 2008 Liangyou 688 Hybrid Indica 2006 Huai Liangyou 608 Hybrid Indica 2005 Nan Jing 2 Japonica 1999 Liang You Peijiu Hybrid Indica 2007 Shenliangyou 5814 Hybrid Indica 2005 Nan Jing 3 Japonica 2008 Zhongzheyou 10 Hybrid Indica 2002 Royou 8 Hybrid Indica 2007 Nan Jing 4 Japonica 2001 Zhongzheyou No.1 Hybrid Indica 2002 Anhui rice 153 Hybrid Indica 2007 Nan Jing 5 Japonica 2001 Zhongzheyou 8 Hybrid Indica 2009 Juliangyou 747 Hybrid Indica 2005 Nan Jing 6 Japonica 2005 Fengliangyou No.4 Hybrid Indica 2013 Quanyou 3301 Hybrid Indica 2011 Nan Jing 7 Japonica 2011 Fengliangyou 6348 Hybrid Indica 2008 Quan Zaoyou 406 Hybrid Indica 2008 Nan Jing 8 Japonica 2001 Fengyouxiangzhan Hybrid Indica 2006 Quan zaoyou simiao Hybrid Indica 2004 Yang Jing 4038 Japonica 2007 Wushan silk seedling Hybrid Indica 2014 Chao you 1000 Hybrid Indica 2006 Yangyu Jing 2 Japonica 2004 Tianliangyou 616 Hybrid Indica 2010 Qian You 911 Hybrid Indica 1999 Wu Jing 14 Japonica 2007 Tianyou Huazhan Hybrid Indica 2009 Qian You 930 Hybrid Indica 1990 Wuyujing 3 Japonica 2009 Yixiangyou 2115 Hybrid Indica 2005 Wuyunjing 23 Japonica 2012 Juliangyou 60 Hybrid Indica 2006 Wuyunjing 24 Japonica 2008 Guangliangyou 272 Hybrid Indica 2009 Wuyunjing 30 Japonica 2008 Guangliangyou 476 Hybrid Indica 2010 Wuyunjing 31 Japonica 2010 Guangliangyou 5 Hybrid Indica 1995 Wuyunjing 7 Japonica 2005 Guangliangyouxiang 66 Hybrid Indica 1994 Huaidao No.5 Japonica 2007 Huiliangyou No.6 Hybrid Indica 2008 Huaixiangjing 15 Japonica 2011 Huiliangyou 898 Hybrid Indica 2011 Su Xiangjing 100 Japonica 2008 Huiliangyou 996 Hybrid Indica 1995 Su Xiangjing No.1 Japonica 1992 Yangliangyou 6 Hybrid Indica 2006 Su Xiangjing 3 Japonica 2007 Zhendao 18 Japonica 2018 Year Varieties Type Year varieties Type Year Varieties Type 2007 C Liangyou Huazhan Hybrid Indica 1957 Nongken 57 Japonica 2006 Wu Yun Jing 24 Japonica 1993 Y two you 1 Hybrid Indica 2010 Nan Jing 0212 Japonica 2010 Wu Yun Jing 31 Japonica 2008 Two you 688 Hybrid Indica 2004 Nan Jing 46 Japonica 1995 Wuyunjing 7 Japonica 1999 Two you Pei nine Hybrid Indica 2005 Nan Jing 5055 Japonica 1994 Huai Dao 5 Japonica 2001 Zhongzheyou No.1 Hybrid Indica 2009 Nan Jing 52 Japonica 2011 Su Xiangjing 100 Japonica 2001 Zhongzheyou 8 Hybrid Indica 2009 Nan Jing 9108 Japonica 2006 Su Xiangjing 3 Japonica 2001 Feng you Xiang Ju Hybrid Indica 2001 Ning Jing 1 Japonica 2007 Tian You Hua Zhan Hybrid Indica 2005 Ning Jing Japonica 2012 Ju liang you 60 Hybrid Indica 2005 Ning Jing 3 Japonica 2005 Guangliangyouxiang 66 Hybrid Indica 2007 Ning Jing 4 Japonica 2011 Hui two you 898 Hybrid Indica 2007 Ning Jing 5 Japonica 1992 Yangliangyou 6 Hybrid Indica 2005 Ning Jing 6 Japonica 2003 xin Liangyou 6 Hybrid Indica 2011 Ning Jing 7 Japonica 1981 shanyou63 Hybrid Indica 2008 Ning Jing 8 Japonica 2007 Shenliangyou 5814 Hybrid Indica 1999 Wu Jing 14 Japonica 2013 Tsuen you 3301 Hybrid Indica 1990 Wuyujing 3 Japonica 2014 Chao you 1000 Hybrid Indica 2005 Wu Yun Jing 23 Japonica 2009 Qian You 930 Hybrid Indica The split area was 32 m2 and was repeated three times. The areas had different treatments, thus isolated with a brick wall which was high enough to ensure that each main area drained separately. Urea appliance followed the base fertilizer as follows: tiller fertilizer: panicle fertilizer = 4:3:3, P2O5 (150 kg hm−2 for the whole growth period) all used as base fertilizer, potassium chloride (300 kg hm−2 during the whole growth period) applied in the proportion of base fertilizer: panicle fertilizer = 5:5. We applied chemical herbicides in order to control different weeds during the experiment. The data for daily radiation and air temperature were measured at a meteorological station located within 3 km of the experimental site. The daily solar radiation and temperature were measured by a silicon pyranometer (LI-200, LI−COR Inc., Lincoln, NE, USA) and a temperature/RH probe (HMP45C, Vaisala Inc., Helsinki, Finland), respectively (Fig. 1).
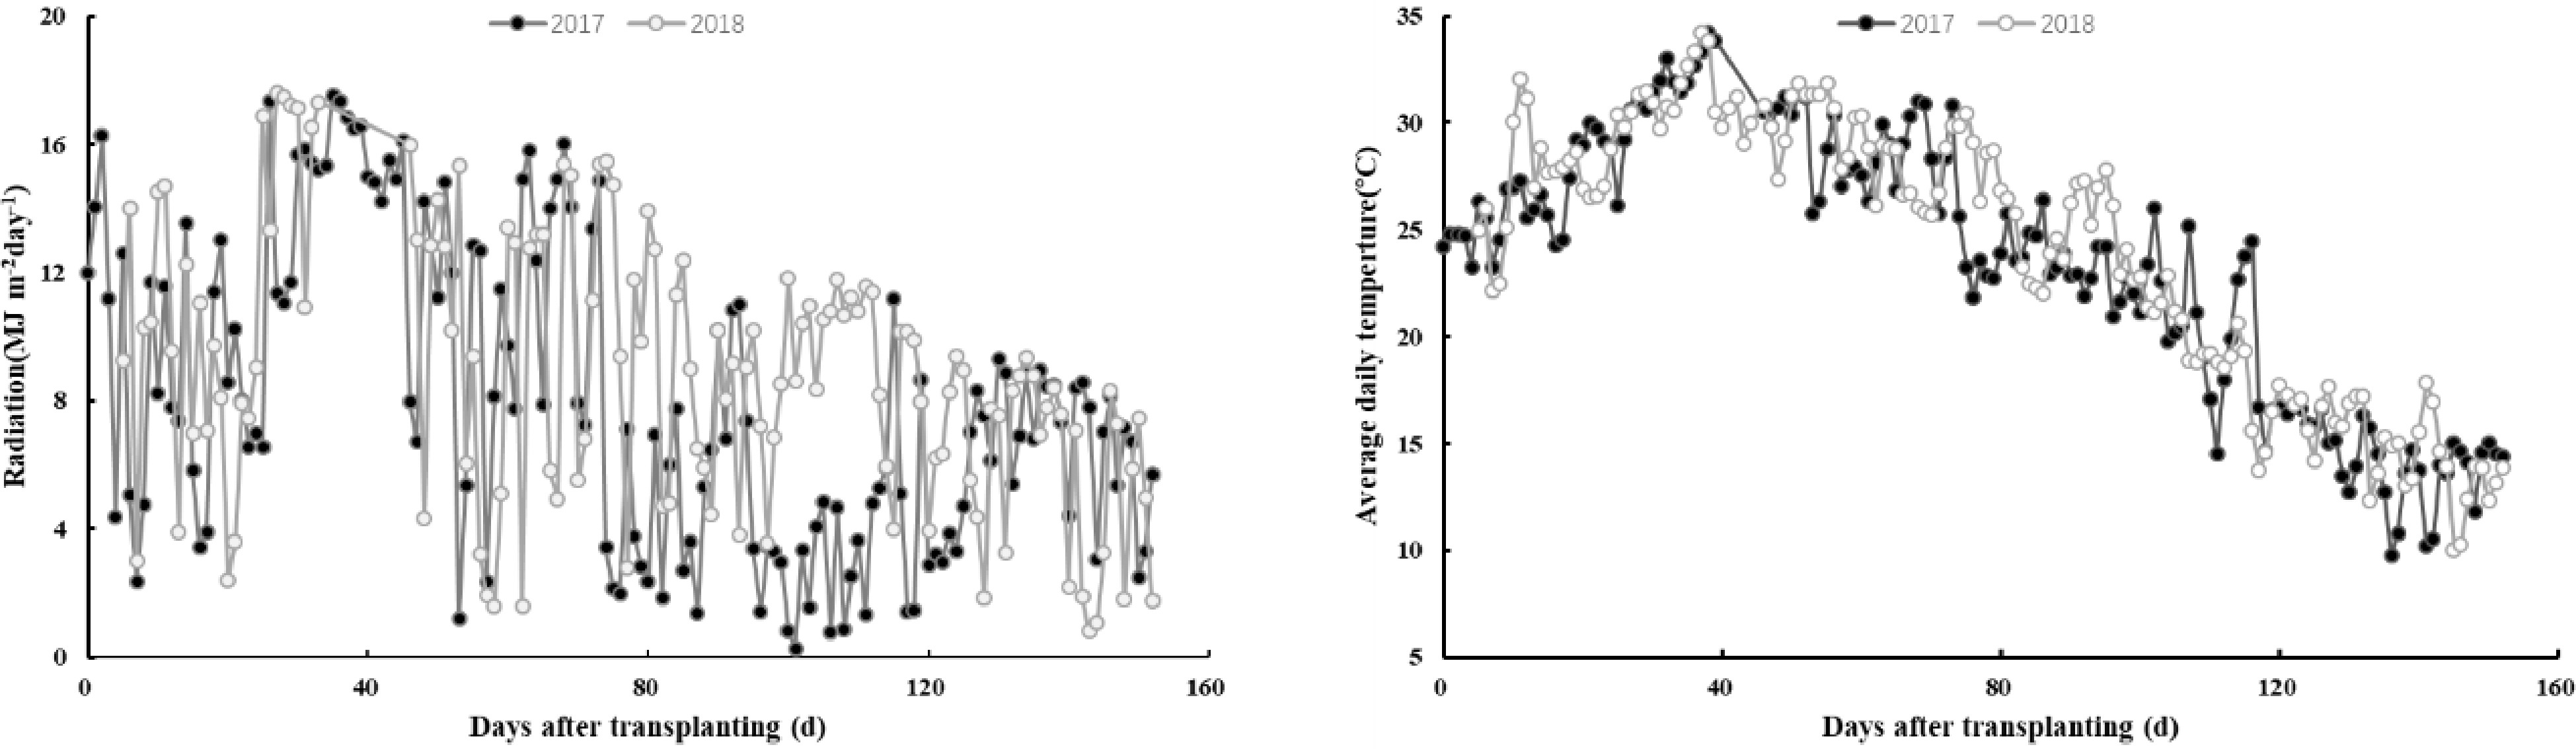
Figure 1.
Radiation (MJ m−2 day−1), average daily temperature (°C) during rice growing periods in 2017 and 2018. The climate data regarding daily radiation and air temperature were measured at a meteorological station located within 3 km of the experimental site. The daily solar radiation and temperature were measured by a silicon pyranometer (LI-200, LI−COR Inc., Lincoln, NE, USA) and a temperature/RH probe (HMP45C, Vaisala Inc., Helsinki, Finland), respectively.
Data collection
-
From each plot, ten consecutive plants with similar growth were targeted to record leafage, and the main stem leaf emergence was monitored every five days. The main stem leaf emergence was measured from the 3rd leaf stage up to flag leaf emergence. The data collection of leaf emergence was based on Haun’s method; it consists of identifying the leaves obeying their formation sequence, considering each leaf as a unit of development. For the remaining visible leaves, they are divided into four units and these units in turn are subdivided into decimals, starting their count from the oldest leaf ending with the youngest. The rate of development of the current leaf is determined based on the previous leaf i.e., the stage of the youngest leaf is determined by subtracting the stage of the oldest leaf that precedes it [1].
Statistical analysis
-
Data were analyzed using the programs of SPSS. Analysis of variance (ANOVA) was used to measure the relative significance of different treatments. We used (LSD) for Analysis of difference at a 5% level of probability and graphs were drawn using Excel.
-
The effect of nitrogen fertilizer on LN varied with varieties. The LN on the main stems in both years (2017 and 2018) had a significant difference between years at N0 and N150 nitrogen rate with 15.8−16.1 and 15.7−16.5 respectively, and no significant difference at N300 rate (Fig. 2). There was an ampler range of values of LN between the two years, mainly caused by (i) nitrogen rates, (ii) year, probably by (iii) genetic characteristics of the cultivars, (iv) radiation and temperature variations between the two years. These hypotheses are supported by (Table 2), which shows that nitrogen and year have a significant effect on LN. Japonica rice had more LN compared to Hybrid Indica in both years (Fig. 3), however, Hybrid Indica had an exponential increase from 15.7 to 16.3 reflecting a positive response to a high dosage of nitrogen, it had a range of 0.6 between the two years, as opposed to Japonica with 16.4 and 16.5 with a range of 0.1, i.e., Japonica rice type was less responsive to N rates compared to Hybrid Indica rice type. Nevertheless, Japonica rice had more LN (Fig. 4).
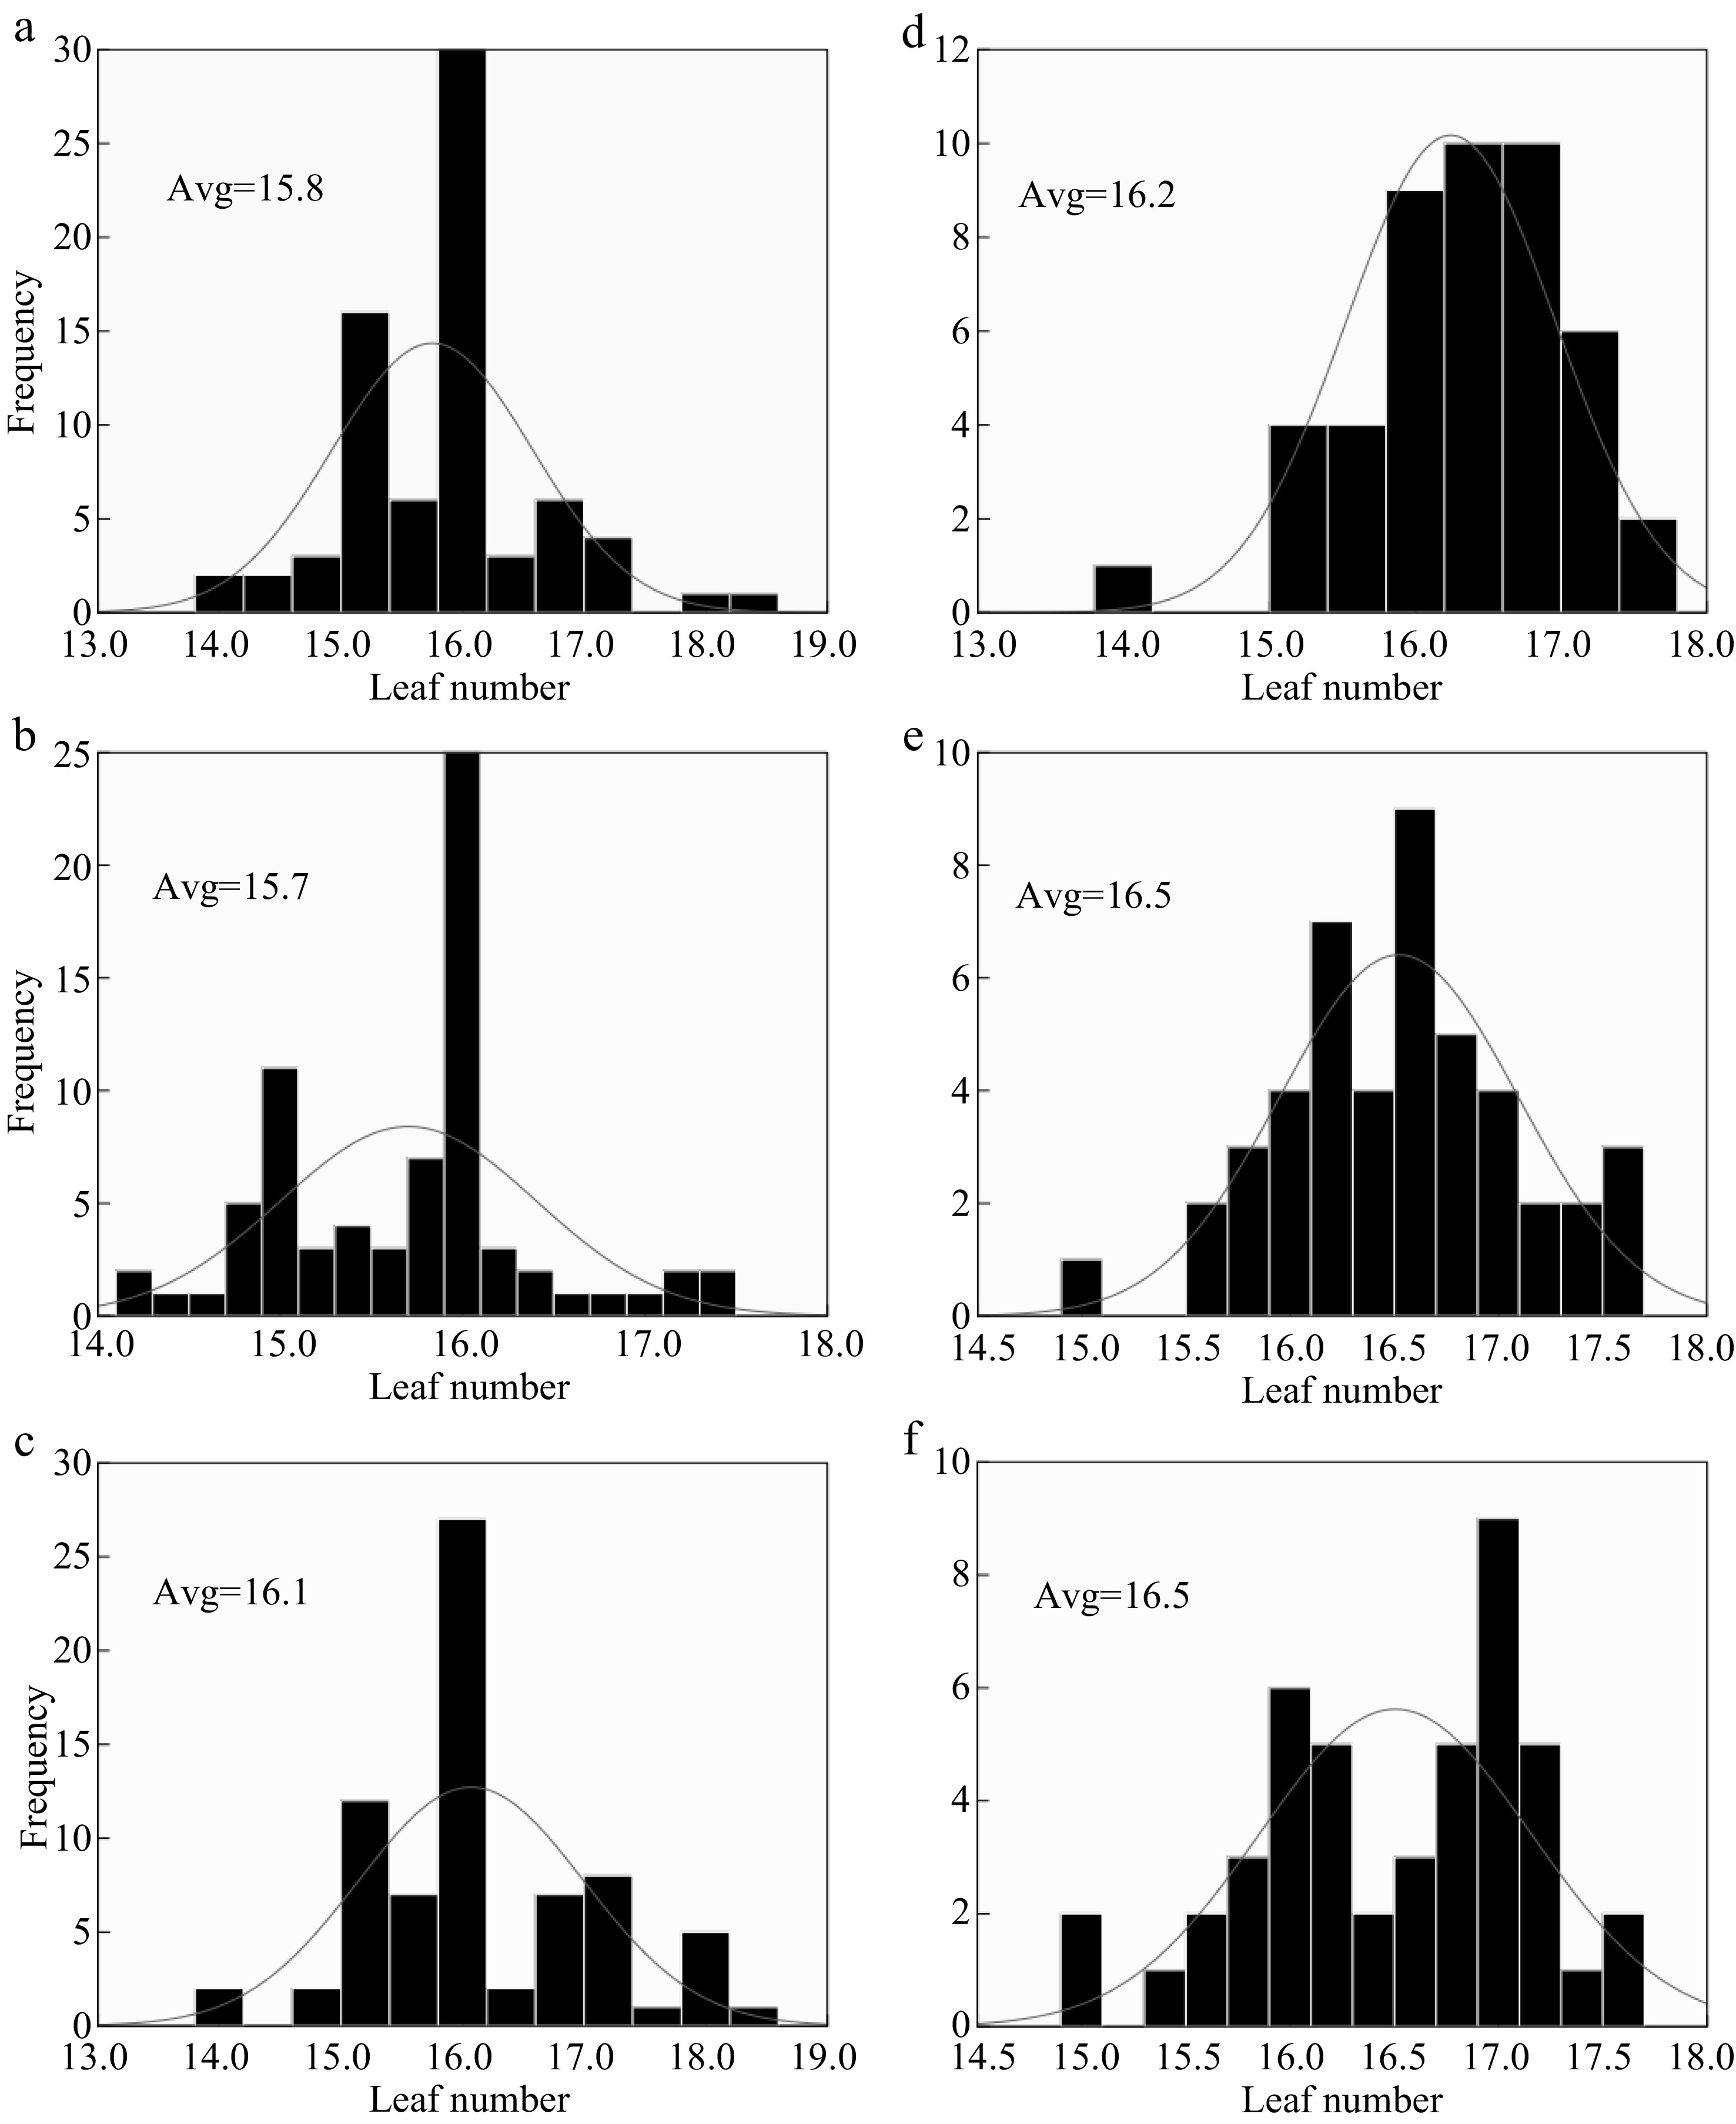
Figure 2.
The response of LN to different N rates in two years 2017 (a), (b), (c) and 2018 (d), (e), (f). (a), (b), (c) and (d), (e), (f) represent N0, N150, N300 nitrogen rates for 2017 and 2018 respectively; Avg. - an average of LN at each nitrogen rate. Comparing the range of the LN at each nitrogen rate between the two years N0 N150 and N300 were 0.4, 0.8 and 0.4, respectively.
Table 2. Leaf range between 2017 and 2018.
Year N0 N150 N300 LN range 2017 15.8b 15.7b 16.1 0.3 2018 16.1a 16.5a 16.5 0.4 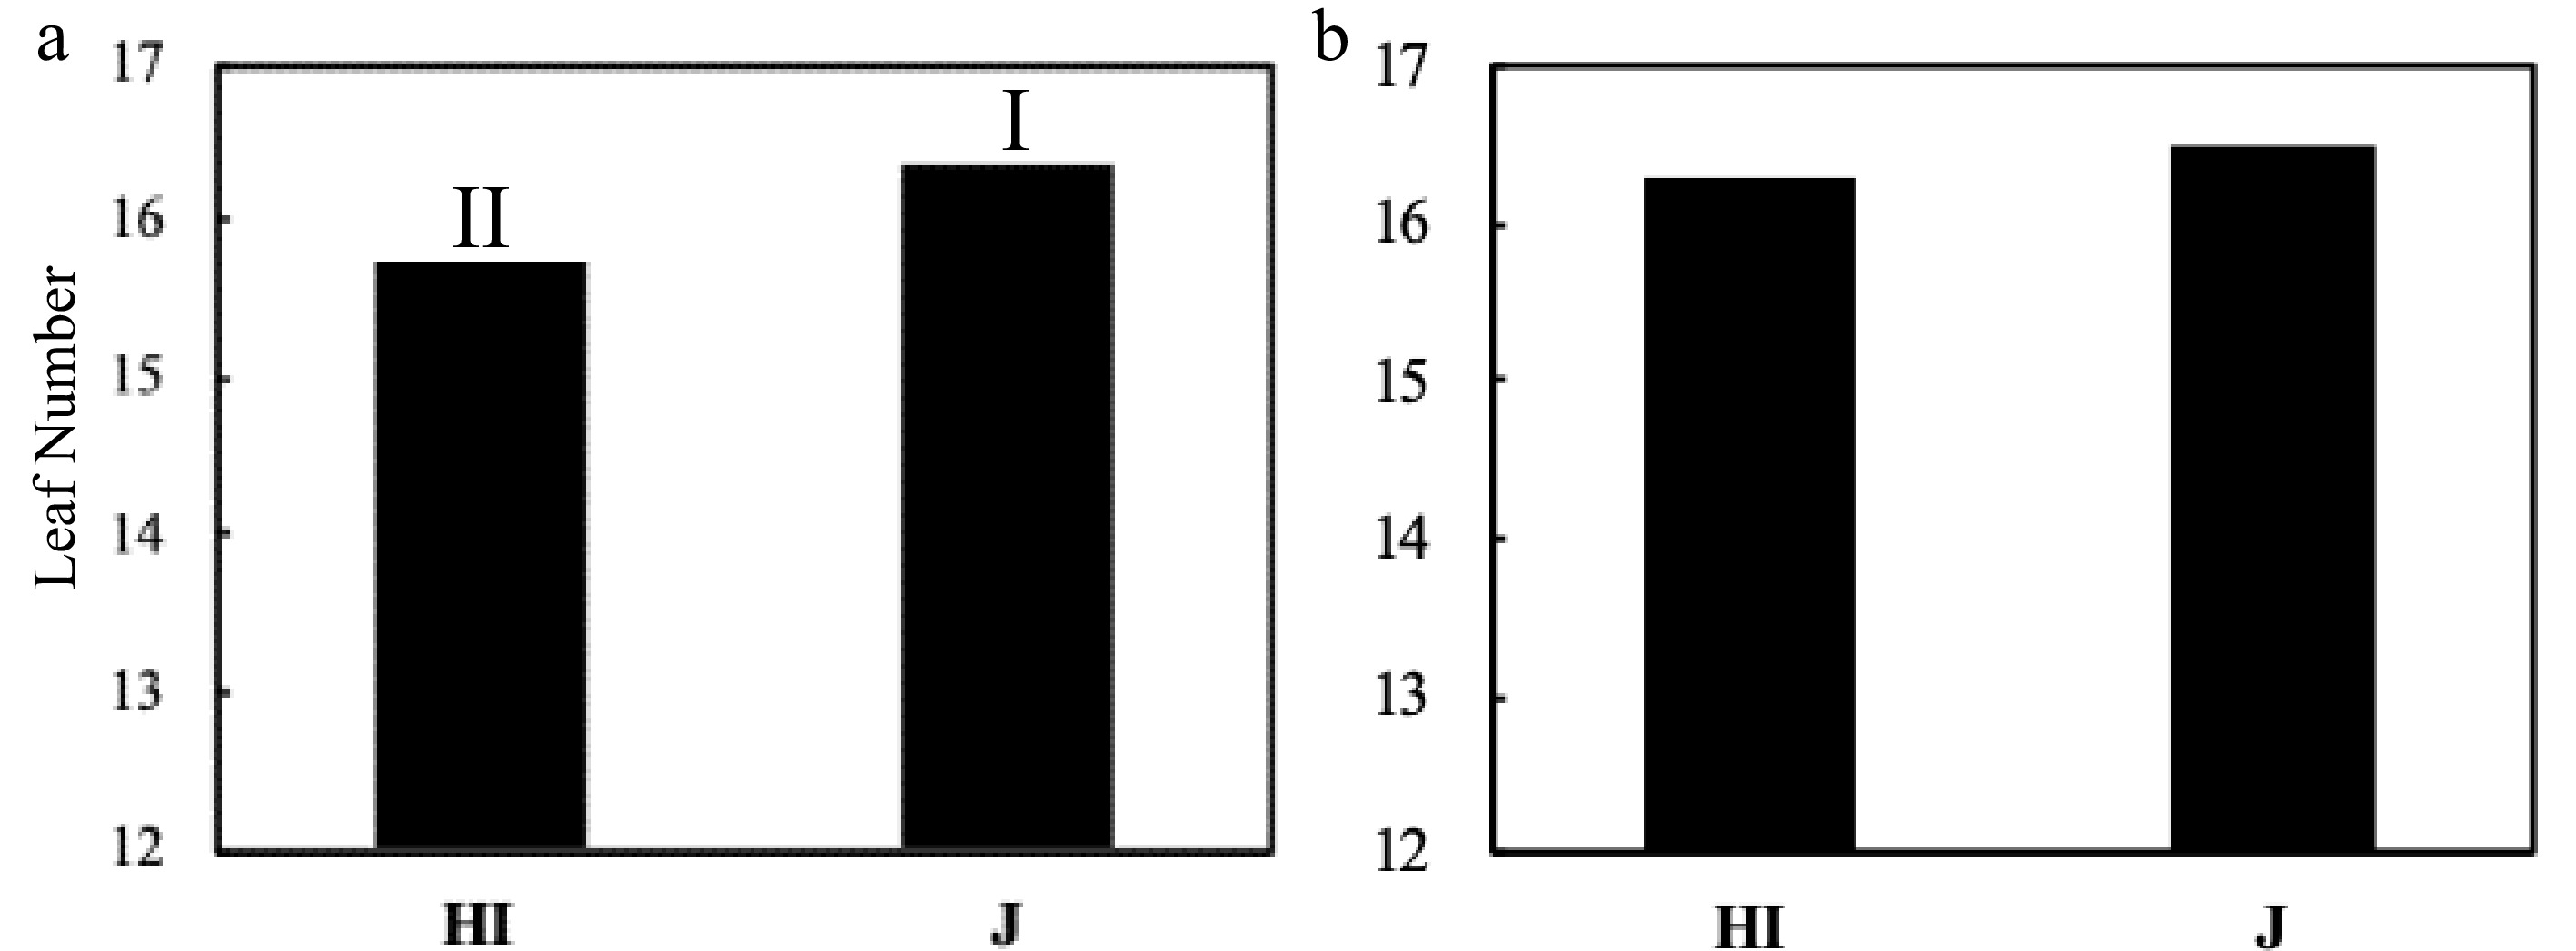
Figure 3.
The LN comparison of Hybrid Indica and Japonica rice type at panicle initiation stage. (a) Expt.1 2017, (b) Expt.2 2018; HI - Hybrid Indica, J - Japonica rice type. Rice type's response to different nitrogen rates for each year is expressed by I and II, and different letters are significantly different at P < 0.05 as determined by the LSD test. There was a significant difference in the first year between HI and J with a range of 0.7 of LN and no significant difference registered in the second year with a range of 0.2 between the rice types.
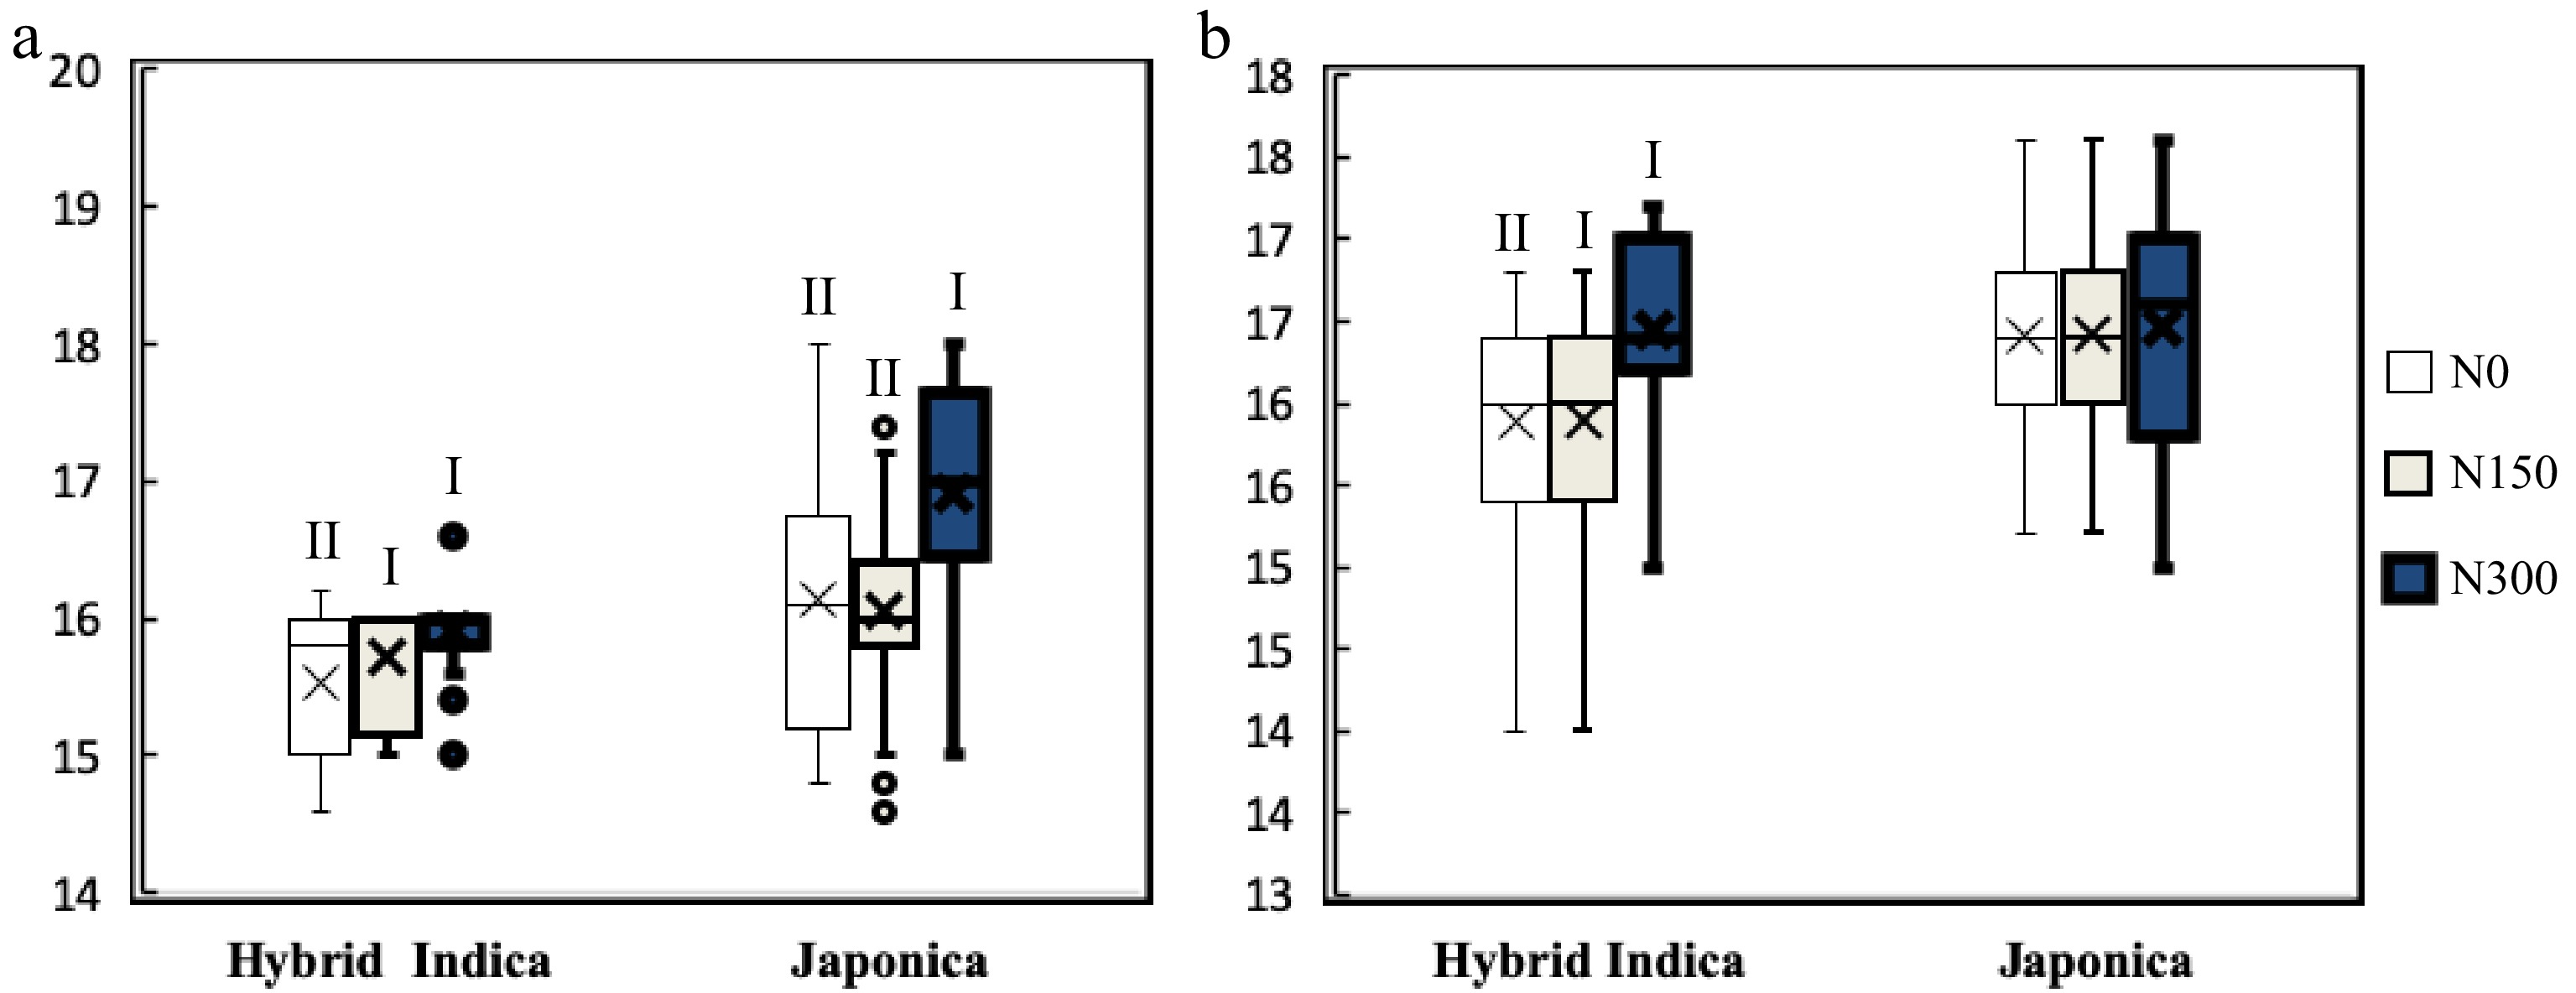
Figure 4.
Hybrid Indica and Japonica LN's responses to different nitrogen rate are expressed by I and II, and different letters are significantly different at P < 0.05 as determined by the LSD test. Hybrid Indica increased LN in function of nitrogen rate applications, with a maximum LN at N150 and N300 for both years ((a) 2017; (b) 2018)), and it decreased considerably in plots with less nitrogen rate at N0 registering the lowest LN. On the other hand, Japonica rice LN's response to different nitrogen rates was not as clear and uniform as it was in Hybrid Indica rice in both years.
Rice growing stage duration, from emergence up to panicle initiation (DTP) in response to different nitrogen rates
-
The difference in LN's frequency among varieties for both Hybrid Indica and Japonica was influenced by the rate of leaf emergency during vegetative growth stage, resulting from different nitrogen rates applications, i.e., nitrogen affected the duration of the growing stage (Nitrogen Significant effect on DTP) (Fig. 5). Both rice types had a different response to different dosages of nitrogen, where Hybrid Indica increased LN when exposed to higher dosages of nitrogen and decreased considerably in plots with less N, on the other and Japonica LN's response was not as clear and uniform as it was in Hybrid Indica (Fig. 4). These results suggest that high dosages of nitrogen reduced the time DTP for Hybrid Indica and Japonica. Yet, Japonica rice required more time to reach panicle initiation stage, as opposed to Hybrid Indica rice probably due to Japonica rice low photosynthetic rate, demanding additional time and accumulated temperature in order to fulfill its photosynthetic activities (Fig. 6).
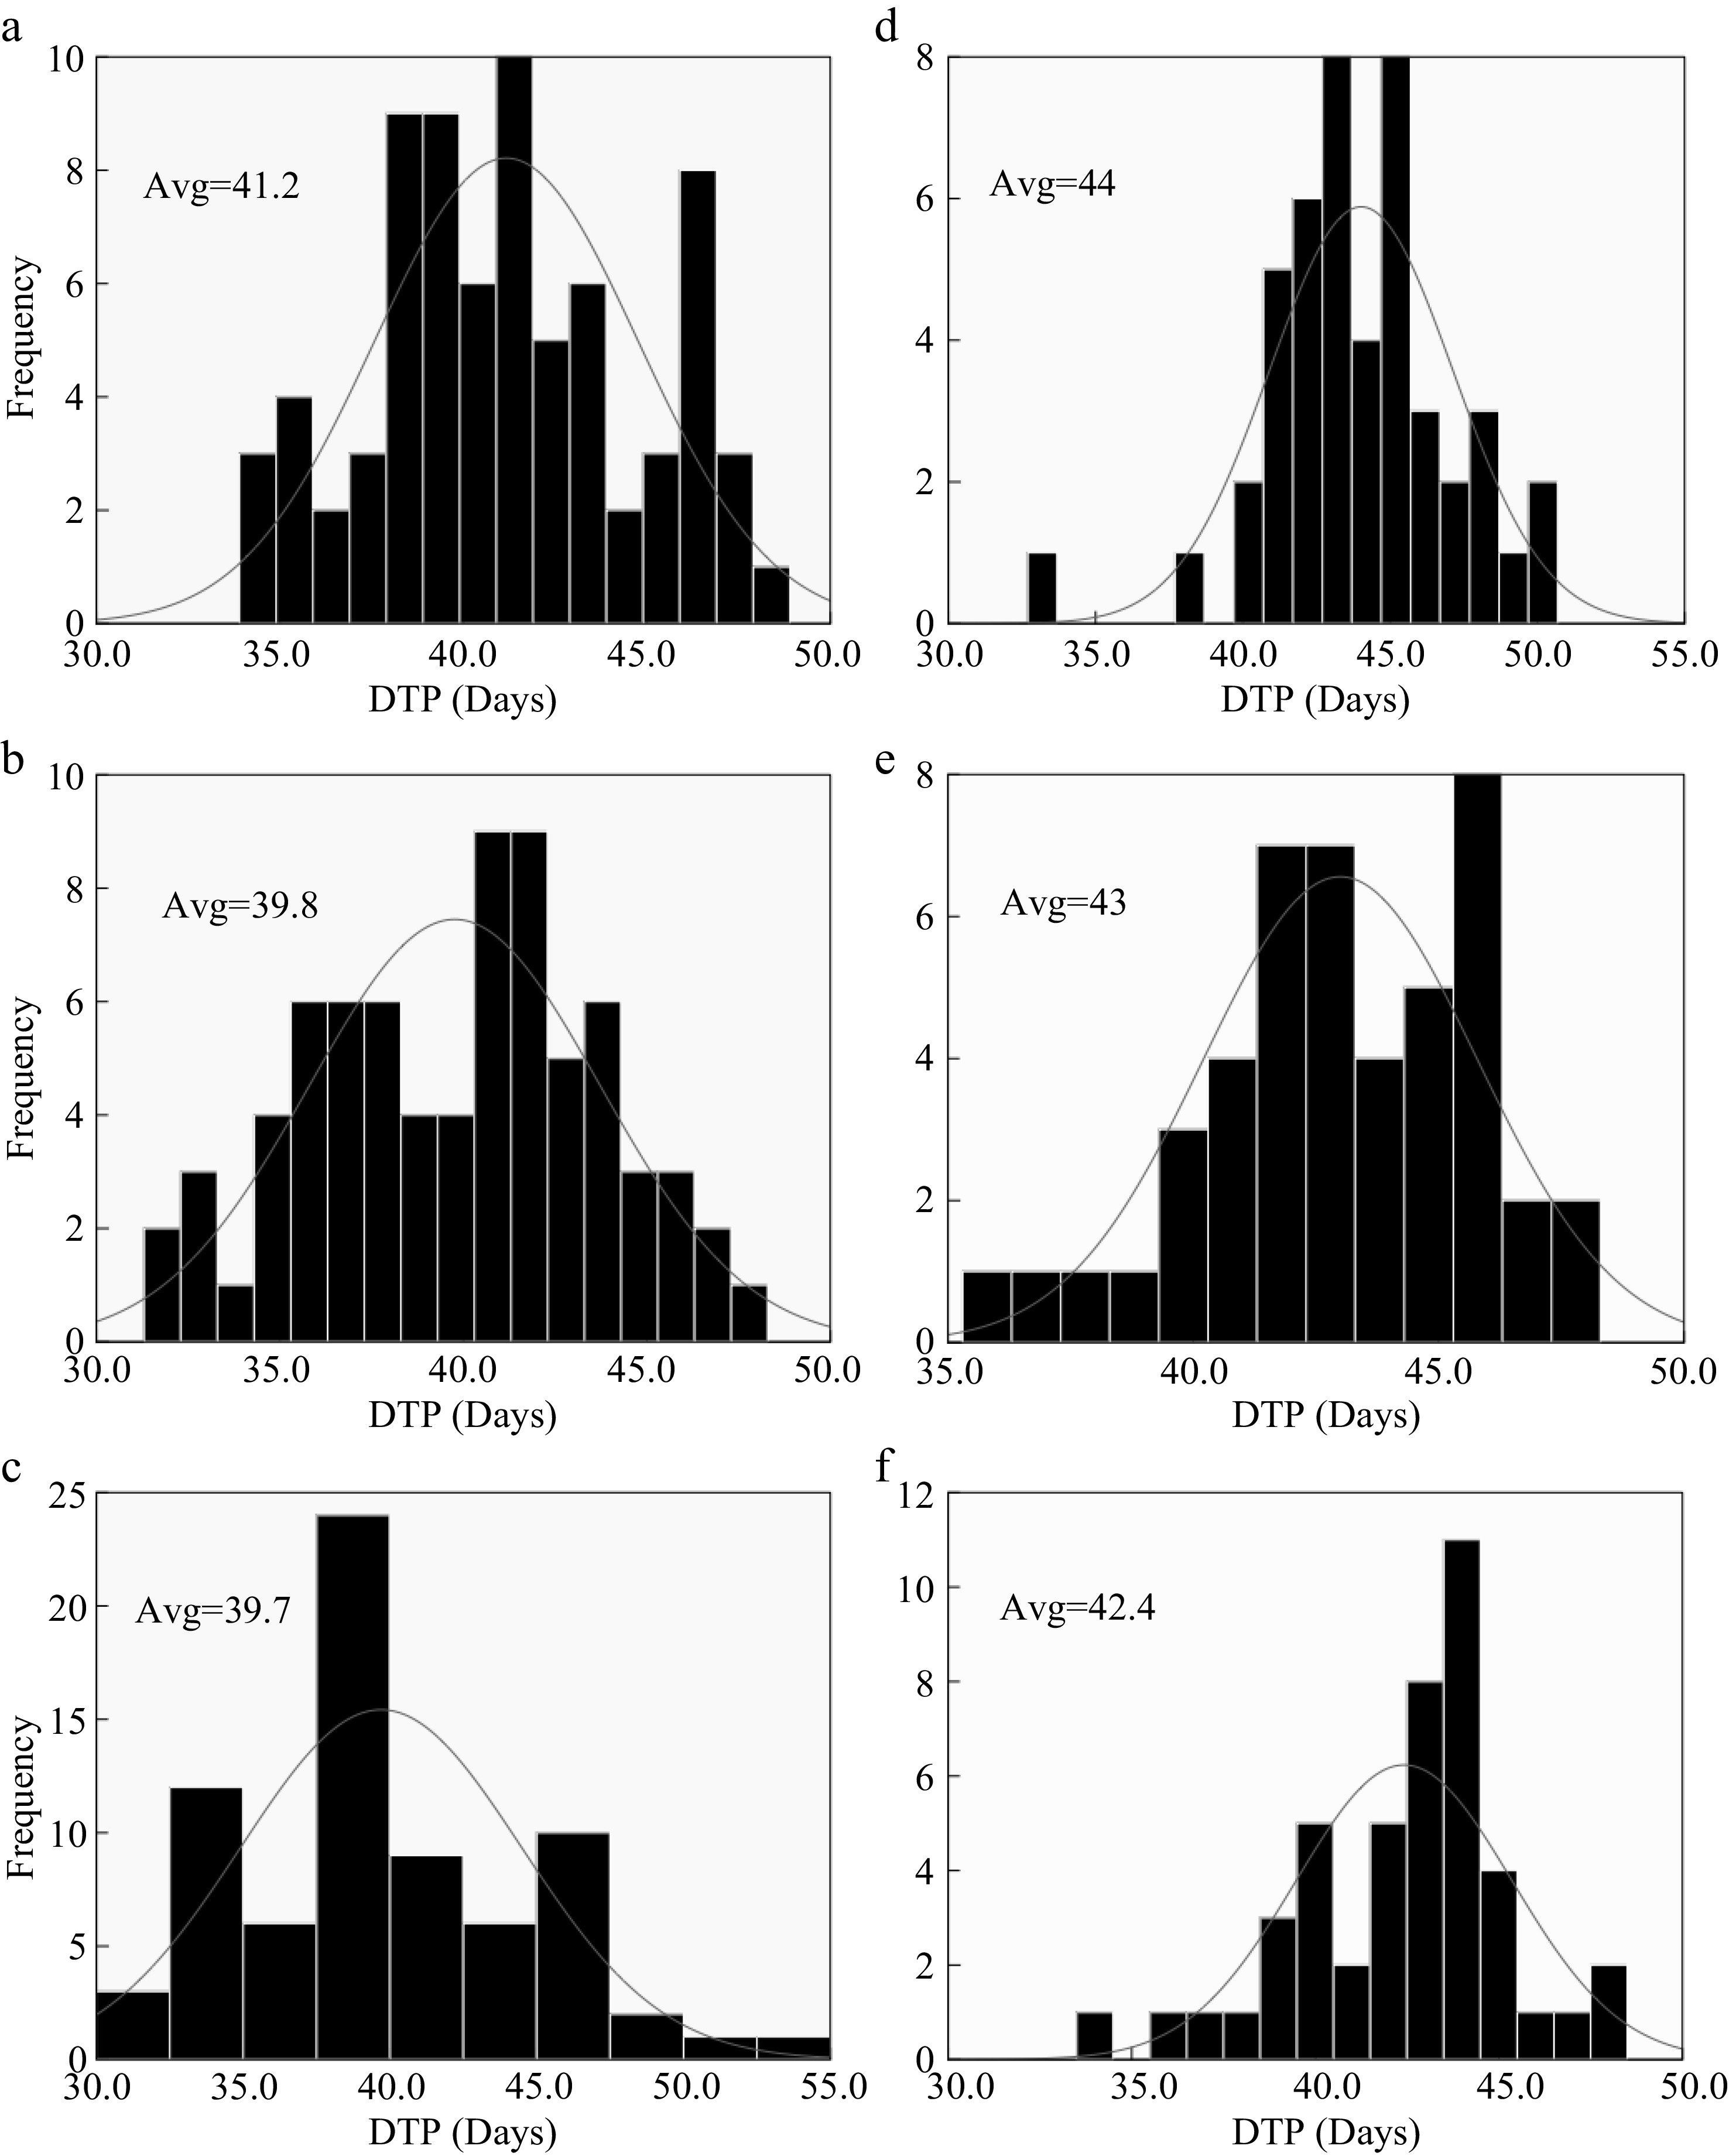
Figure 5.
Nitrogen effect on DTP for Hybrid Indica and Japonica rice types. (a), (b), (c) and (d), (e), (f) represent N0, N150, N300 nitrogen rates for 2017 and 2018 respectively. Avg. - an average of time duration from transplant up to panicle initiation. Nitrogen had a significant effect on DTP; however, the DTP had a downtrend in response to high dosages of nitrogen. The averaged values of LN for both years at different nitrogen rates had a range of 2.8, 3.2 and 2.7 for N0 N150 and N300 respectively.
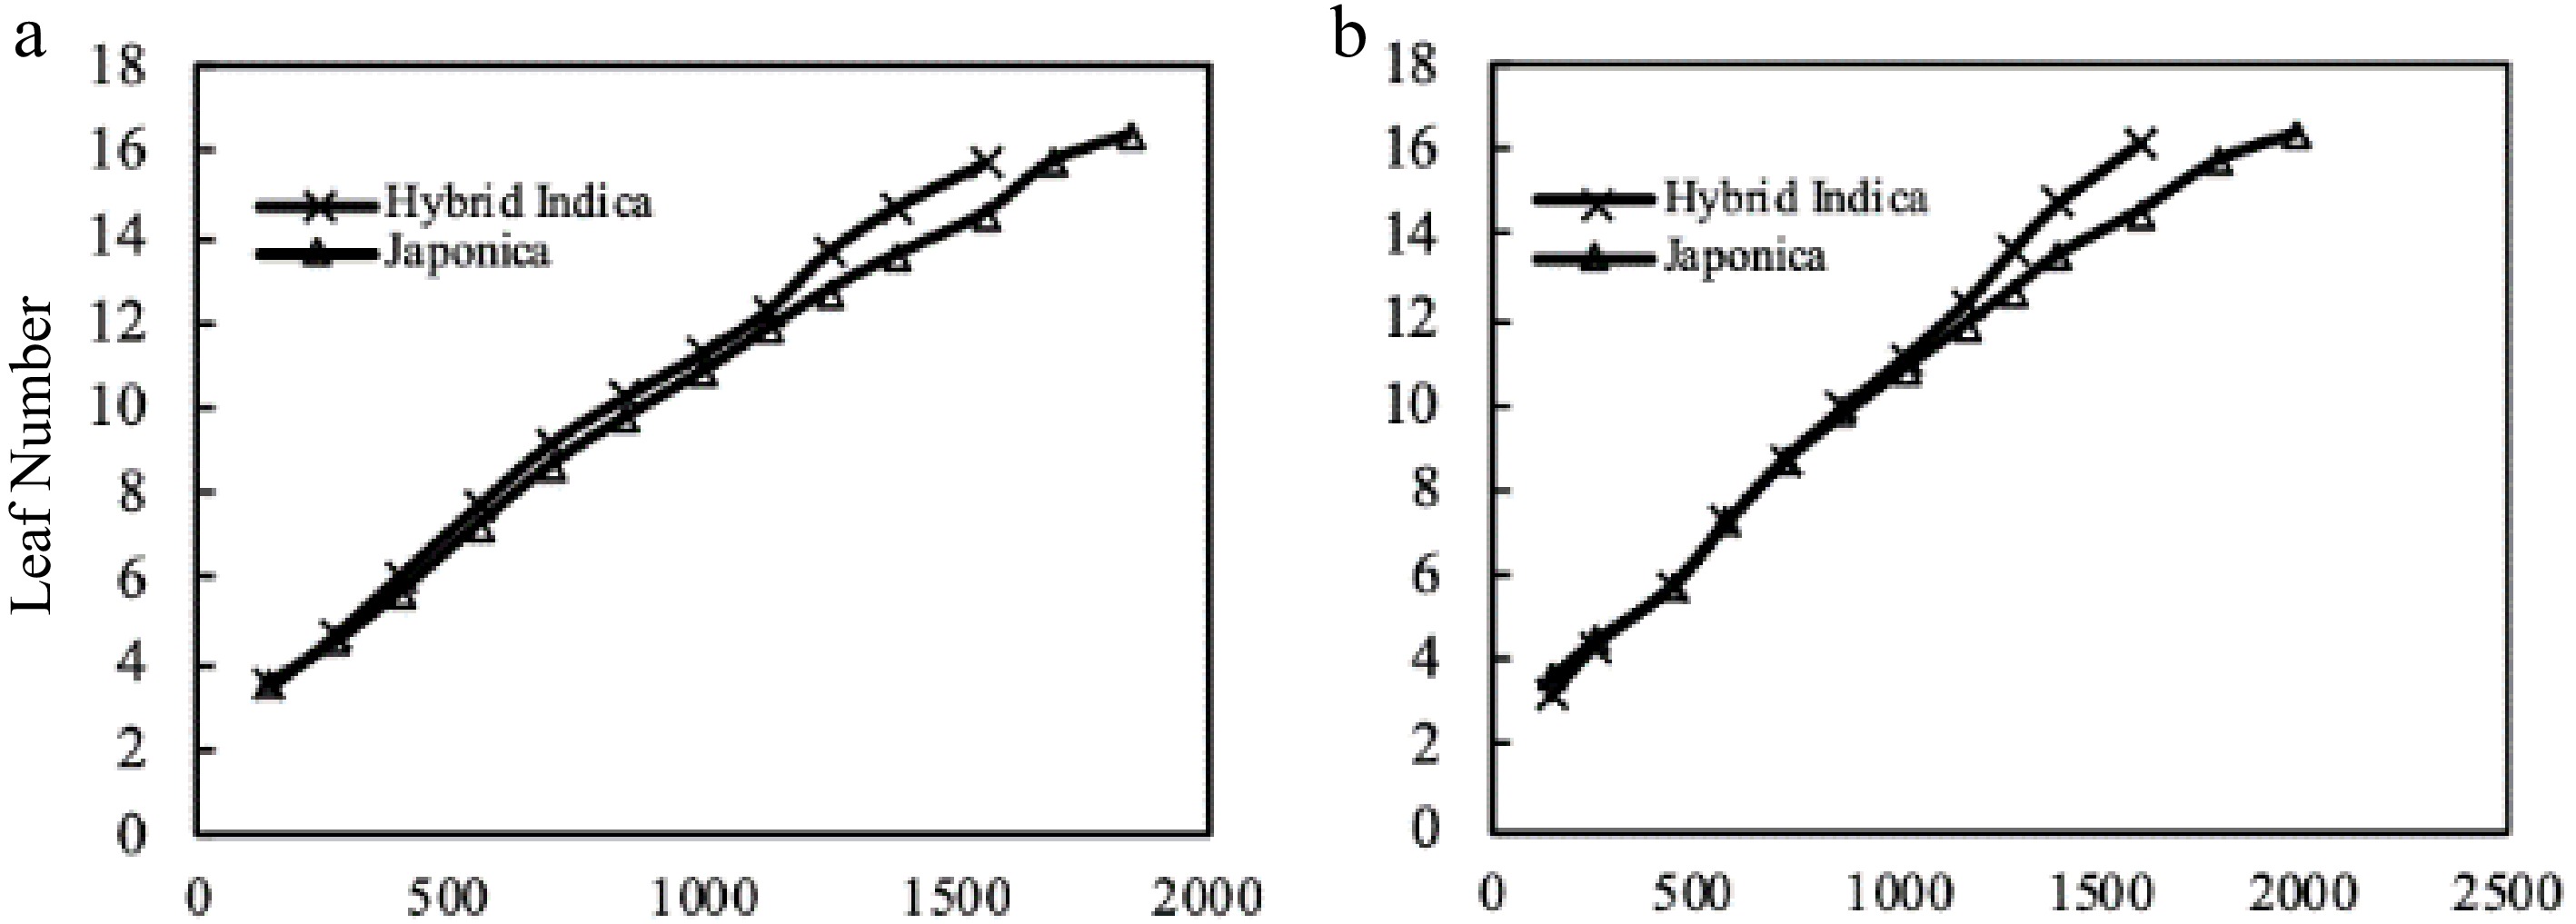
Figure 6.
Hybrid Indica and Japonica rice type LN and thermal time from transplant up to panicle initiation (TT °C/d). (a) 2017 Hybrid Indica and Japonica rice type, (b) 2018 Hybrid Indica and Japonica rice type, (TT - Thermal Time). The TT values resulted from averaged data of daily temperature. Based on the averaged data of both years Hybrid Indica and Japonica, LN under three different nitrogen rates was reached with less than 1,600 and 2,000 °C/d accumulated temperature respectively. Japonica cultivars required more accumulated daily temperature to reach panicle initiation stage as opposed to Hybrid Indica cultivars.
Effects of different nitrogen rates in LAR of Hybrid Indica and Japonica rice types
-
The two rice types expressed a significant difference between each other in DTP as a result of different Nitrogen dosages (Fig. 7). However, there was no significant difference in LAR between different cultivars (Fig. 8), yet, there was no significant difference in LAR between the two years for Hybrid Indica and Japonica (Fig. 9). Nitrogen rate may have significantly affected endogenous hormones and triggered plant growth rather than directly affect LAR. In both years there was a downtrend of LAR instigated by the increase of nitrogen dosages. Hybrid Indica had a higher LAR rate in the first year (4.3) and decreased in the second year (4.2) (Fig. 8). This reduction could be LAR’s response to different nitrogen rates. On the other hand, Japonica rice was precisely the opposite of Hybrid Indica’s performance. It was recorded LAR of 4.2 and 4.4 for the first and second year respectively, probably due to its lack of ability to respond to nitrogen applications. Besides,a correlation analysis showed that the LAR was positively linearly related to the DTP/day in each year (Fig. 10).
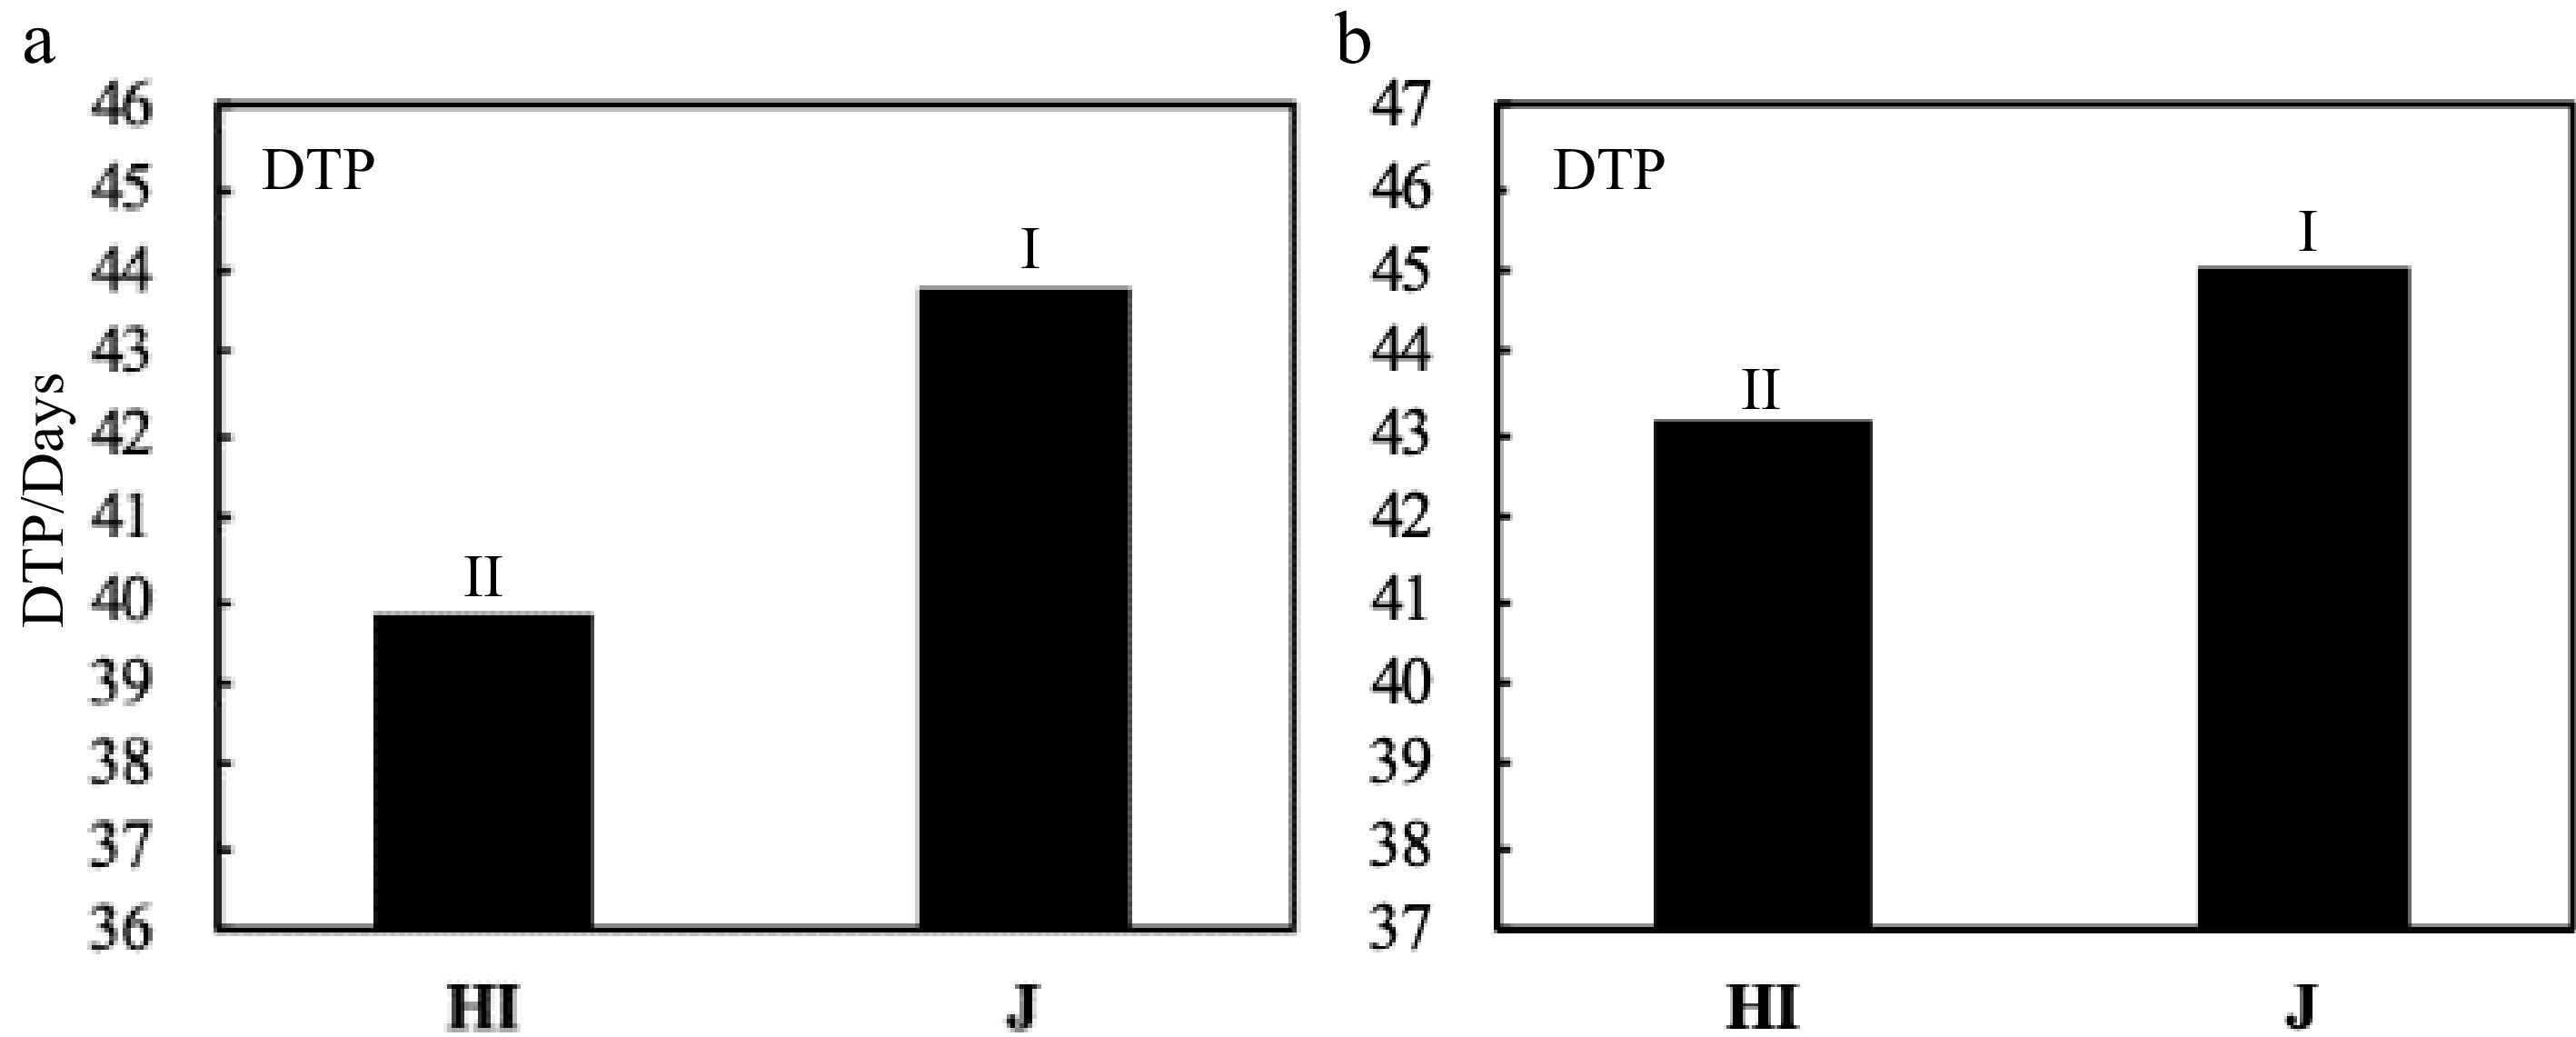
Figure 7.
Comparison of DTP between Hybrid Indica and Japonica rice type in response to different N rates. (a) and (b) represent 2017 and 2018 respectively. There was a significant difference between Hybrid Indica and Japonica rice type in (a) and (b) with a range of 4 and 1.9 respectively.
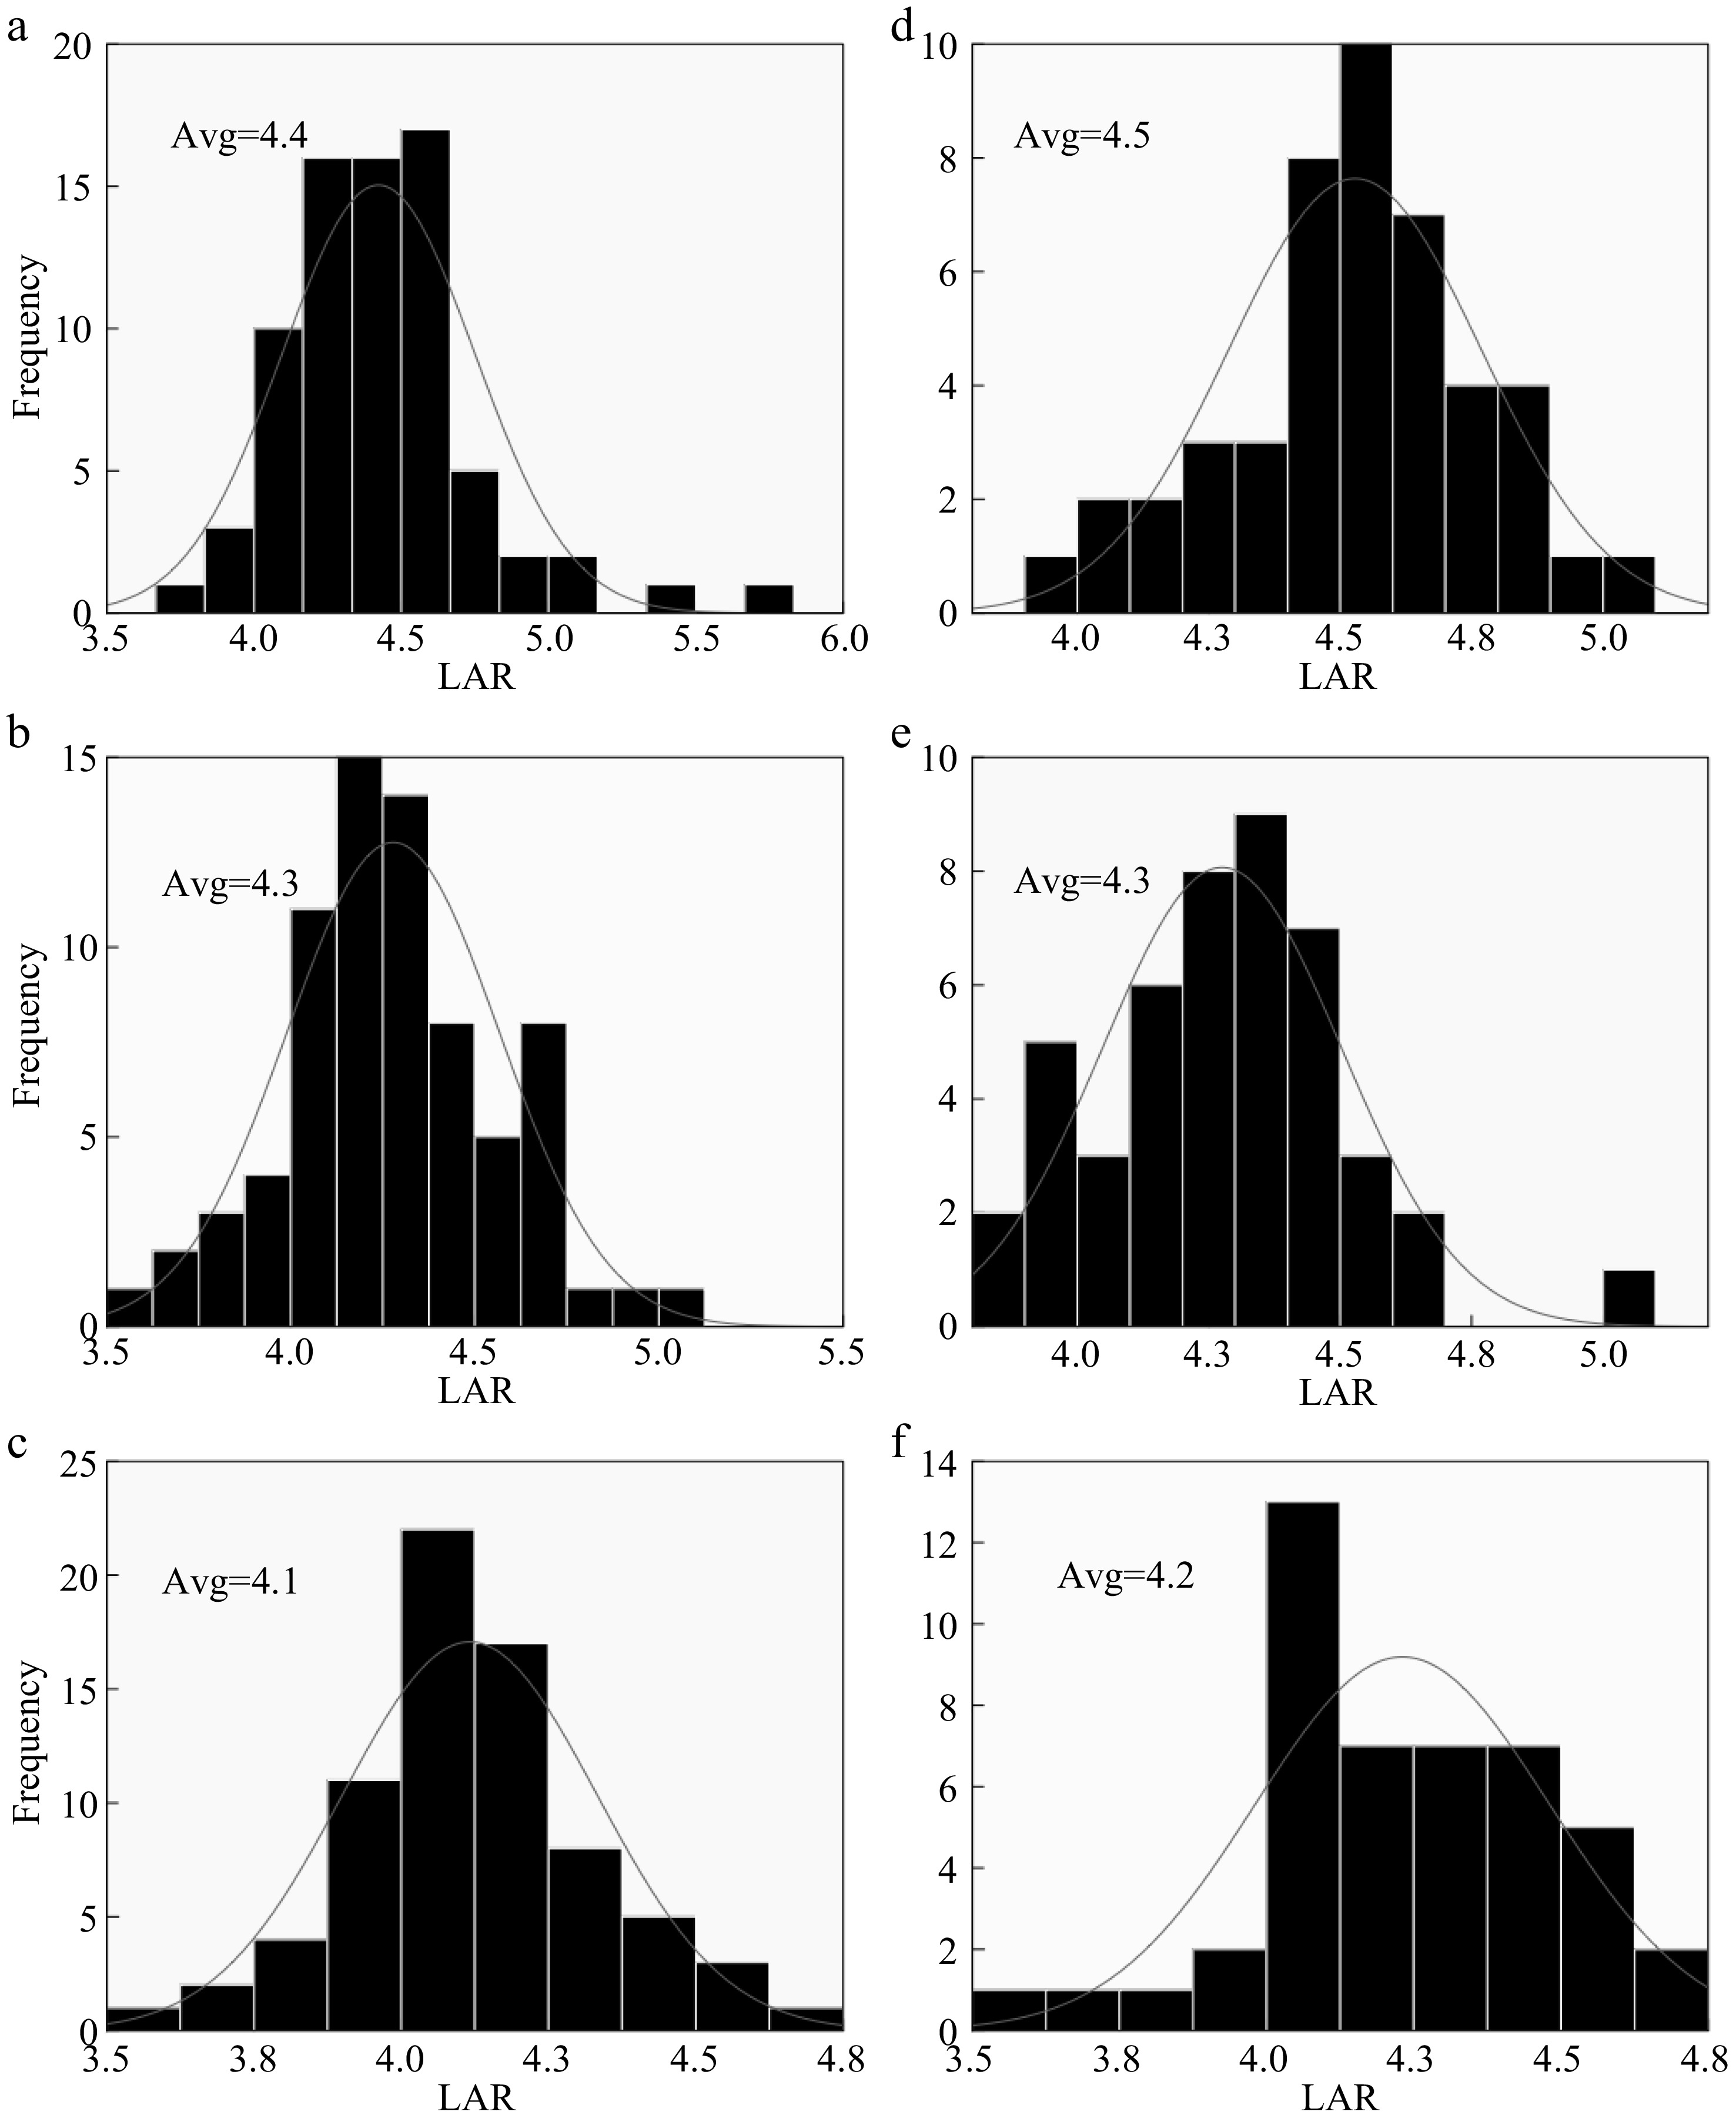
Figure 8.
Nitrogen effect on Hybrid Indica and Japonica rice types. (a), (b), (c) and (d), (e), (f) represent N0, N150, N300 nitrogen rates for 2017 and 2018 respectively. Avg. - Average of LAR at each nitrogen rate. The LAR had no significant difference between the two years and the ranges at N0, N150 and N300 were 0.1, 0, 0.1 respectively.
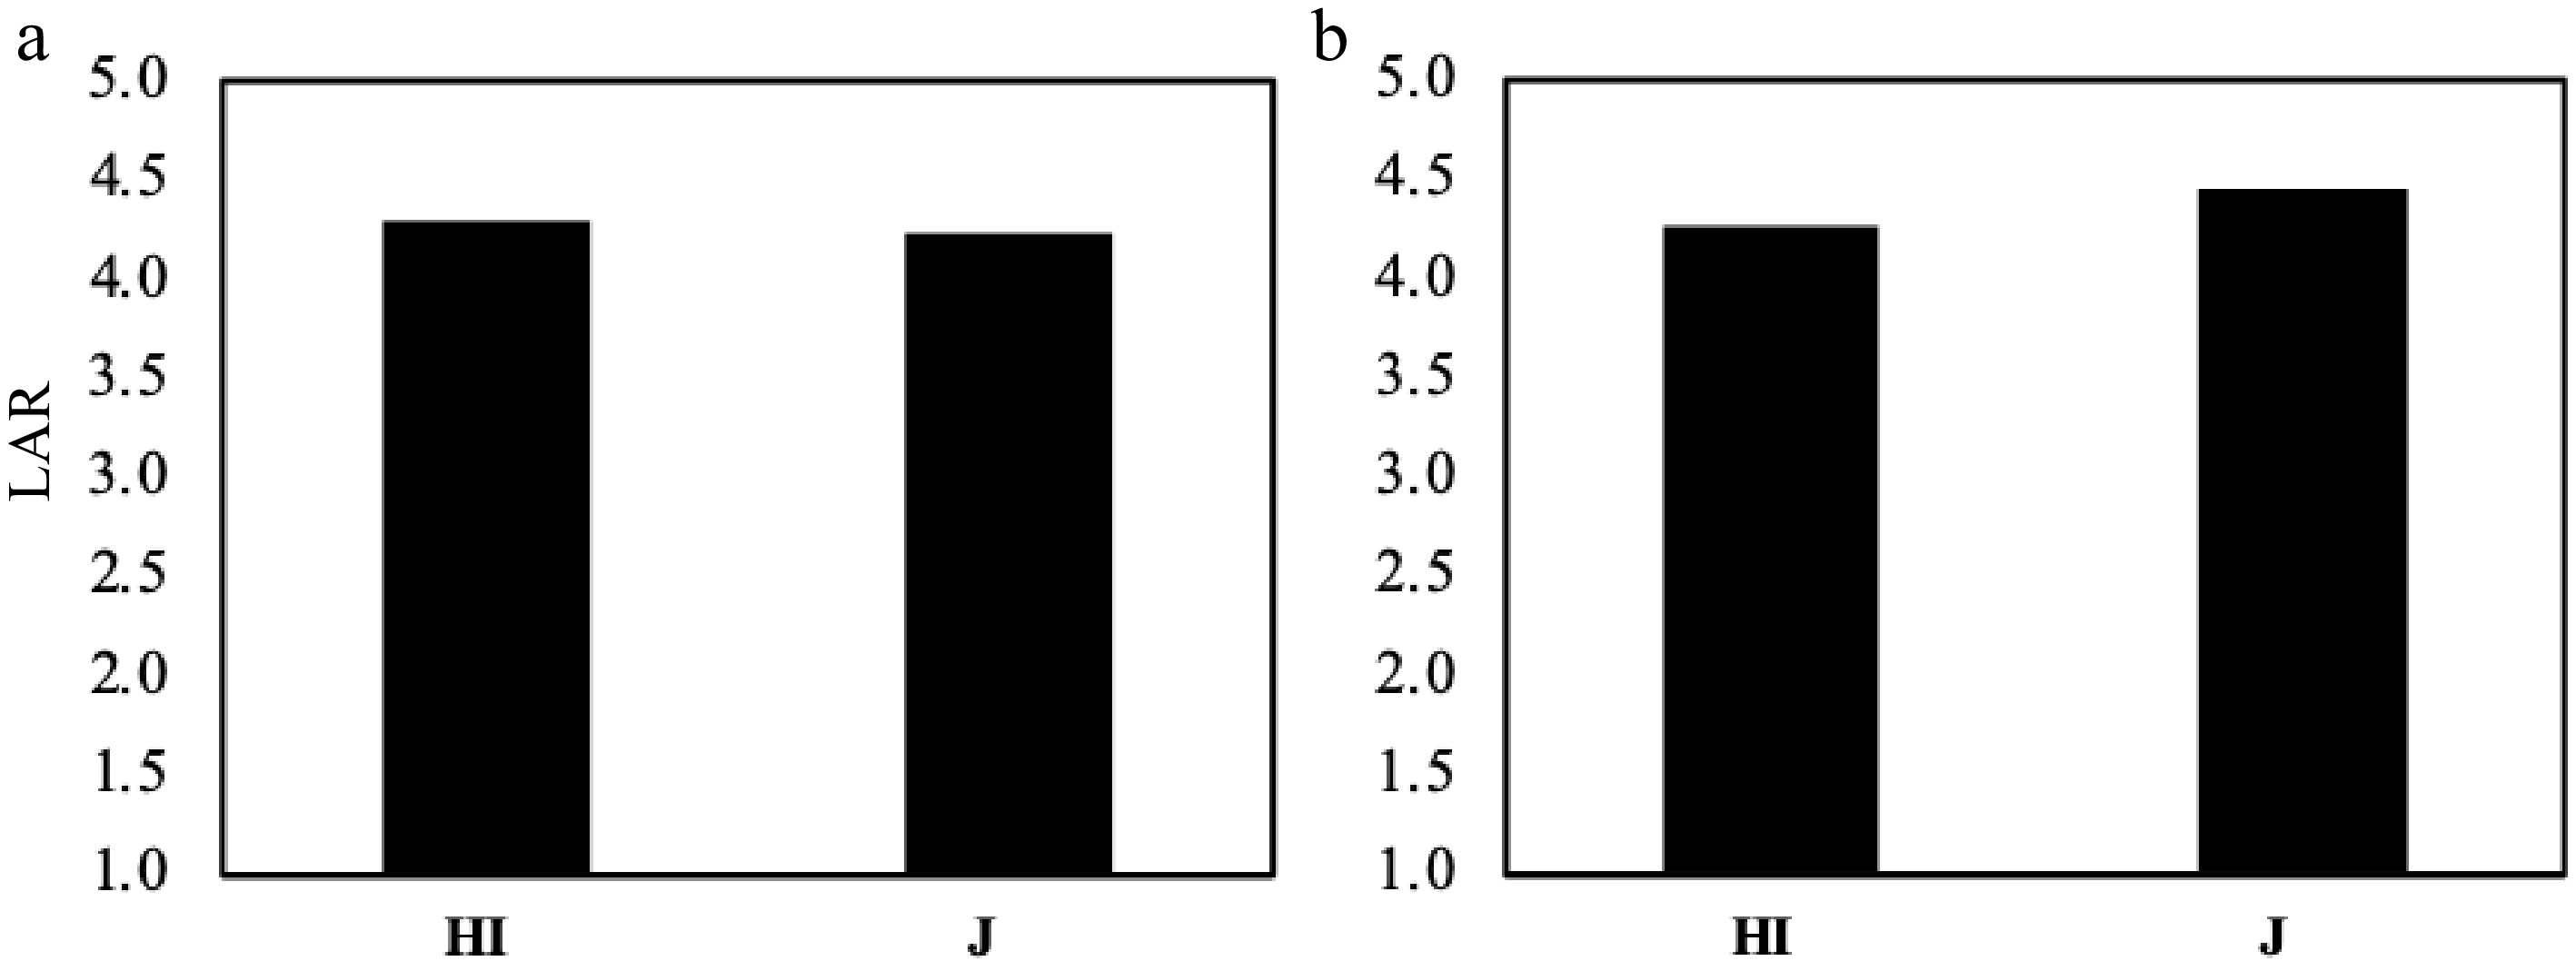
Figure 9.
The LAR comparison between Hybrid Indica and Japonica in response to different nitrogen rates. (a) 2017, (b) 2018. There was no significant difference between Hybrid Indica and Japonica rice type as a response to different nitrogen applications and the range between them in both years was 0.1 and 0.2 respectively.
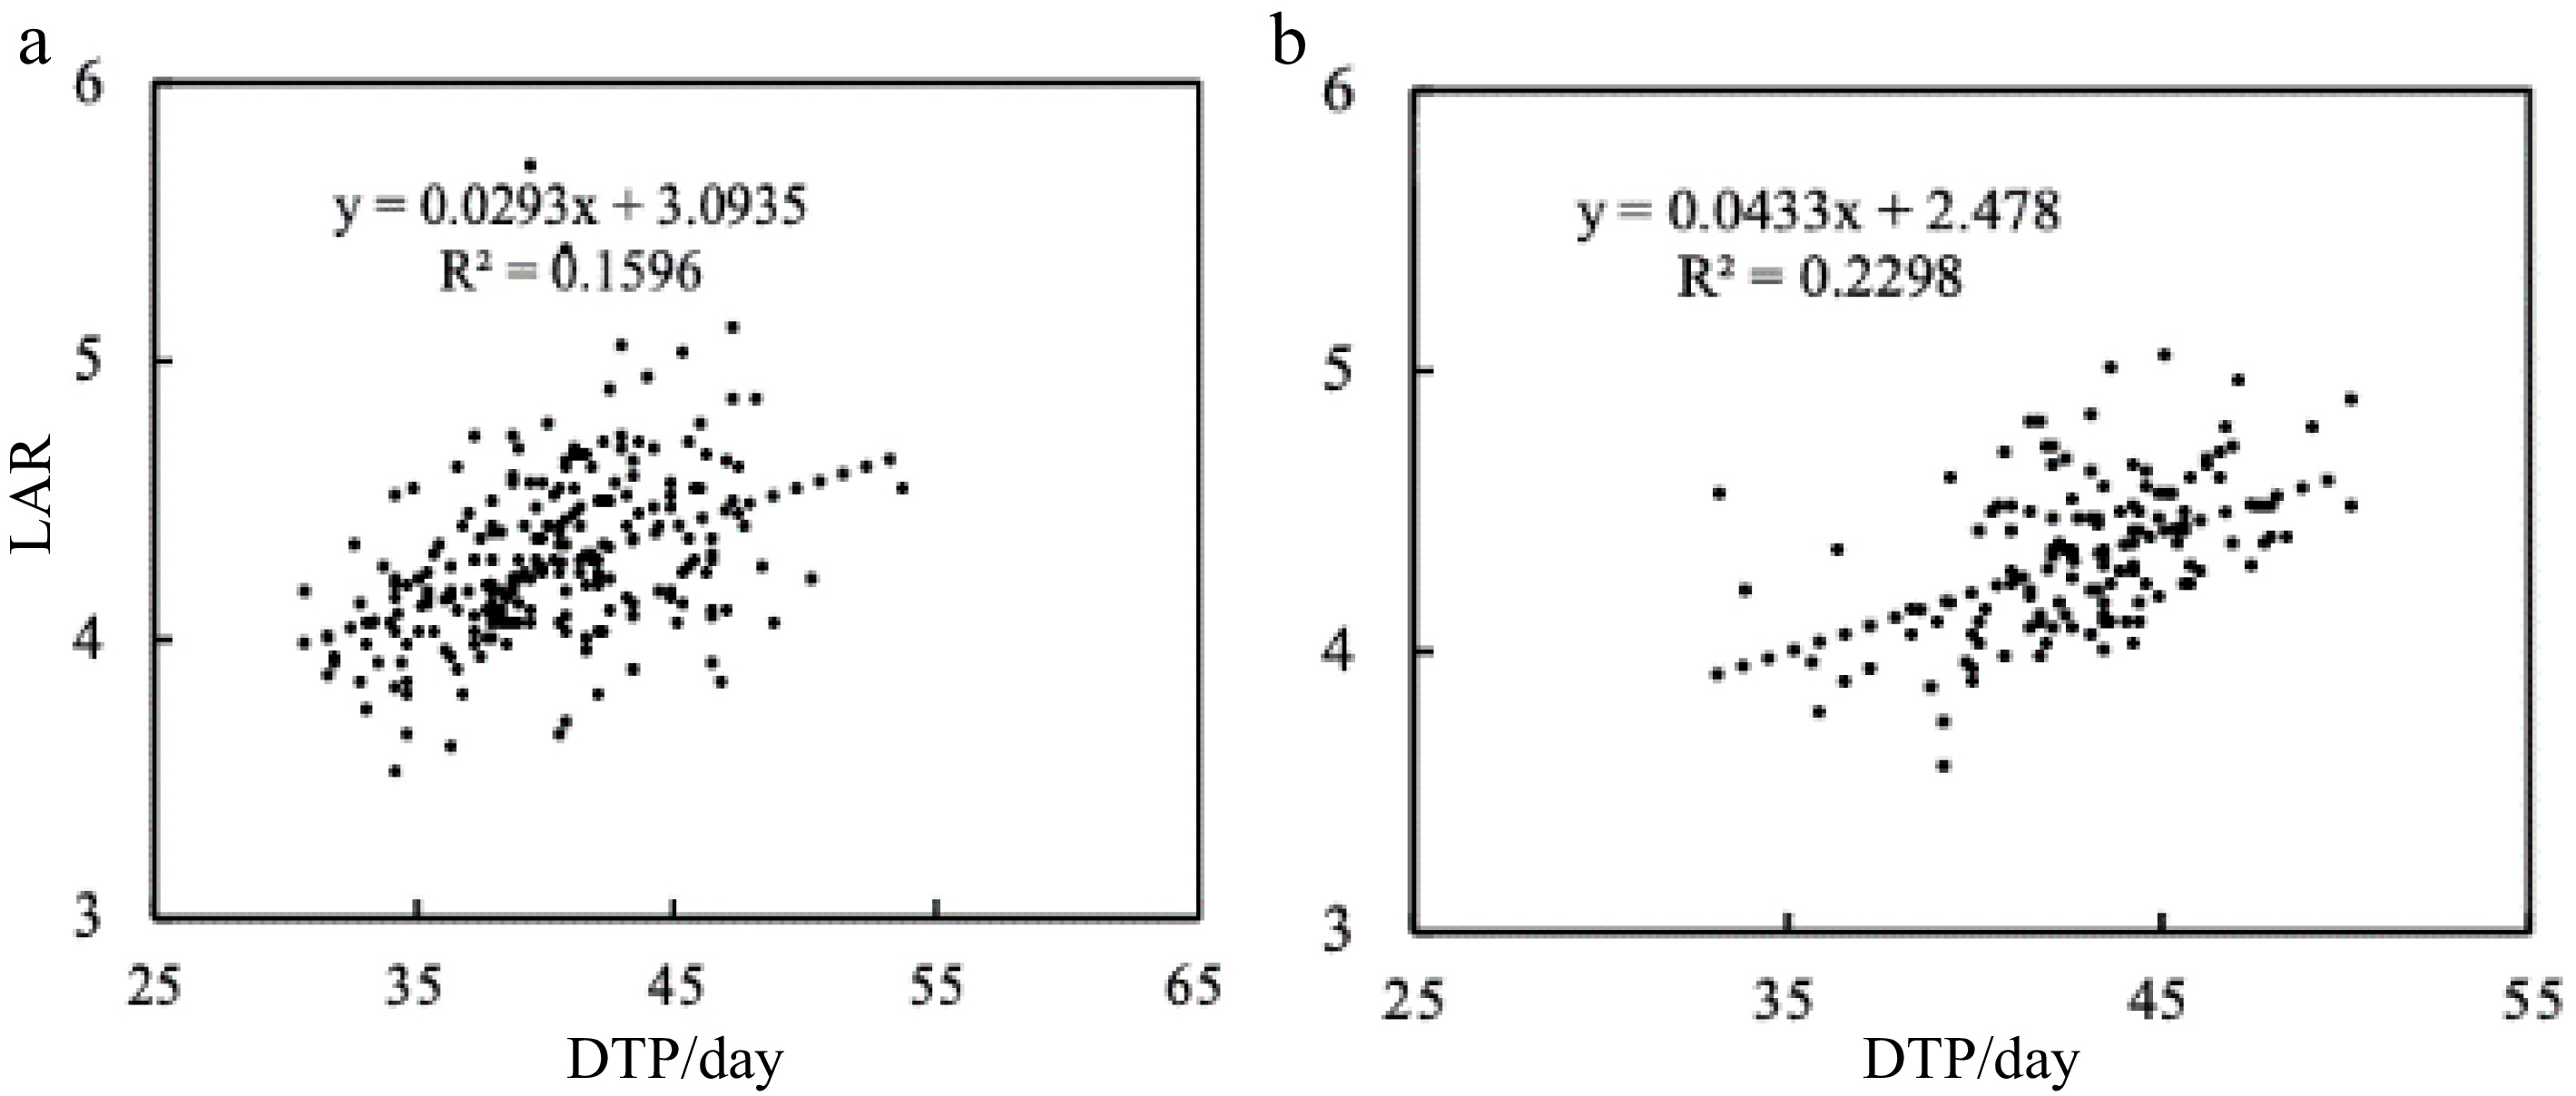
Figure 10.
The relationship between LAR and DTP. Linear regression analyses between DTP and LAR in (a) 2017 and (b) 2018. The LAR increases linearly with DTP, R² = 0.1596 and R² = 0.2298 for (a) and (b) respectively.
-
The difference of LN was mainly instigated by nitrogen rates and varieties as they were affected by DPT and LAR. Hybrid Indica had shorter DPT and LAR compared to Japonica, which caused Hybrid Indica to produce less LN probably due to its shorter duration. In general, the range of LN between the two years was 0.4 (Table 2). The LN ranges at each nitrogen rate between the two years N0, N150, and N300 were 0.4, 0.8 and 0.4, respectively. In response to different nitrogen rates, there was a significant difference among cultivars. The LN increased with high dosages of nitrogen (Fig. 2). Hybrid Indica increased LN in function of nitrogen rate applications, it had its maximum LN at N150 and N300 for both years (Fig. 4), and it decreased considerably in plots with less nitrogen rate.
Meanwhile, Japonica rice LN’s response to different nitrogen rates was not as clear and uniform as it was in Hybrid Indica rice in both years. The results of Hybrid Indica suggested that nitrogen availability enhanced the LN, these results are supported by previous studies that have reported the direct impact that different rates of nitrogen have on leaf number, and its deficit can considerably decline total leaf number[13]. A study on leaf emergence of spring wheat, targeting the leaf apex stage using different nitrogen concentrations, revealed that nitrogen is crucial for leaf number on the main steam, where plants with lower levels of nitrogen decreased their leaf number[15]. A study focused on the use efficiency of nitrogen for dry matter production and grain yield, using leaf number as a reference, verified a lighter production of leaf number only on plots with higher dosages of nitrogen, excluding the standing number of sterile tillers[16, 17].
Nitrogen is an essential nutrient, however its performance can be largely influenced by the way it is managed in different rice types, climate and other crops practices[18]. In 2017, Japonica rice registered its highest LN at N300 rate and no significant difference between N0 and N150, and in 2018, it had no significant difference at all rates (Fig. 4), which reveals its lack of ability to respond to nitrogen application compared to Hybrid Indica rice. A study stated a genetic difference between Indica and Japonica rice types, when both were exposed to different nitrogen rates and temperature, clarifying the difference of varieties in photosynthetic and dark respiration rate, and the study concluded that Indica varieties had a higher photosynthetic rate than Japonica varieties[19]. This study is in accordance with our results (Fig. 6), which illustrate that Japonica rice type required more daily accumulated temperature in order to reach the panicle stage compared to Hybrid Indica rice type.
Rice growing duration, from transplant to panicle initiation (DTP)
-
Beside varieties, DTP was a crucial source of difference in LN since the LAR was immensely influenced by it (Fig. 10), both in synchronism played a relevant role in leaf emergence; consequently, the LN as well. In Fig. 10, LAR increased along with DTP, meaning that as long as the time duration extended, the LAR values would increase exponentially along with DTP. Based on the results from 2017 and 2018 (Fig. 5), nitrogen rates triggered significant difference at this specific growth stage (DTP), in addition, the temperature variation during the two growing seasons could have affected the DTP. In both years the DTP decreased considerably with high dosages of nitrogen. This is similar to the findings of a previous a study that concluded that the rice Fine aman registered advancement at different growth stages under different dosages of nitrogen[16]. An experiment was carried out to study the effects of different nitrogen dosages on time duration from planting up to panicle initiation, and it discovered that, as the dosages of nitrogen increased, the time duration during this specific growth stage reduced[20]. It has also been reported the influence of growth duration and leaf appearance due to different nitrogen rates[13]. DTP and LAR had a positive linear relationship expressing the increase of LAR with extended time duration from transplant up to panicle initiation (Fig. 9). It has been equally reported that depending on the temperature, the vegetative stage could be fluctuant, i.e. it could slow down rice development during low temperatures and consequently extend the growth duration. Additionally, based on the temperature at which the plants develop faster or they stop their development due to the huge influence that the temperature has on them, the temperature can be used to describe or characterize the varieties[21]. Two experiments aiming to analyze the effect of high temperature on grain filling and leaf senescence concluded that high temperature increased the rate of grain filling and reduced the time duration of both[22].
Leaf appearance rate
-
Nitrogen rates and temperature fluctuation influenced both DTP and LAR a great deal, reducing DTP with high temperatures and increasing it with low temperatures, and LAR together with DTP was high and low respectively. These results imply that the LAR is likely to be influenced by other elements such as cultivars, temperature, DTP, genetics, sowing date than by nitrogen rates. The recorded reduction of LAR was instigated by temperature and DTP. Besides the inability of Japonica to respond to different nitrogen applications, which is believed to be due to its genetic characteristics, it still showed an increase of leaf appearance rate from 2017 to 2018 with variation of radiation and temperature[23, 24]. An experiment was led meaning to compare the response of rice cultivars and pears under the same radiation effects, supplementary ultra violet-B (UV-B), the results showed that both were affected by the radiation, though the pears suffered a greater decline in leaves[25, 26]. Furthermore, apart from the above mentioned factors that have a major effect on leaf appearance rate, there are still minor factors that when combined can have a greater impact on leaf appearance rate such as CO2, nutrients, water quality, radiation, soil compaction and depth sowing[27]. Also, previous studies have emphasized the positive correlation between temperature and leaf appearance, which increased along with an increase in temperature[4, 24]. Besides nitrogen there are still more factors that decrease the leaf appearance rate throughout the growth stages: (i) seed reserves and (ii) time new leaves take to appear due to the distance between the new and old leaves, since there were more leaves that preceded them, meaning the new ones have a longer distance to extend until they are visible[28]. However, it has been highlighted that the significance of temperature and light quality, and quantity as the most substantial factors that influence the leaf appearance rate[29]. It has been pointed out that a decrease of leaf appearance rate occurs at the panicle initiation stage[12]. Yet a hormonal signaling shift from one growing stage to another has been pointed as the reason of the sudden decrease in leaf appearance rate[30].
-
Varieties, nitrogen applications, and years of the experiment have a significant effect on LN. However, the differences between varieties are considerably large, while the effects of nitrogen fertilizer and year on LN are less than 0.4. High dosages of nitrogen reduce LAR and shorten DTP, yet increase LN. There is a positive correlation between LAR and DTP, meaning that LAR increases exponentially along with DTP. Hybrid Indica rice type was revealed to be more responsive to nitrogen application in comparison to Japonica rice type.
This work was funded by the National Key Research and Development Program of China (2017YFD0300100, 2017YFD0301204, and 2018YFD0300803), Jiangsu Key Research and Development Program (BE2017369). I would like to thank the Chinese Government, for providing such a huge opportunity for me to pursue my education through CSC program. And thank my classmates, lab mates, professors, specially my supervisor, Professor Li Gang Hua, for the support and guidance, to whom I am deeply grateful for all the lessons. To all the professors from our department that directly or indirectly played a role in my education I extend my gratitude to them.
-
The authors declare that they have no conflict of interest.
- Copyright: © 2022 by the author(s). Published by Maximum Academic Press, Fayetteville, GA. This article is an open access article distributed under Creative Commons Attribution License (CC BY 4.0), visit https://creativecommons.org/licenses/by/4.0/.
-
About this article
Cite this article
Elidio CD, Ding C, Zhu X, Li G. 2022. Different developments of rice leaf and their response to nitrogen. Technology in Agronomy 2:2 doi: 10.48130/TIA-2022-0002 

Different developments of rice leaf and their response to nitrogen
- Received: 09 May 2022
- Accepted: 02 September 2022
- Published online: 20 October 2022
Abstract:
The study evaluates and compares the leaf number (LN) of two rice types, Hybrid Indica (HI) and Japonica (J), and their response to three different nitrogen rates. A split plot experiment was conducted in Danyang District, Jiangsu Province in China, from 2017 to 2018 both rice growing seasons. It was carried out using the Transplanting machine, and the spacing was 17 cm × 30 cm. A split zone design was adopted, with three different levels of nitrogen: N0-0, N1-150 kg hm−2 and N2-300 kg hm−2. The areas were isolated with a brick wall to ensure that each main area drained separately. Urea appliance: tiller fertilizer: panicle fertilizer = 4:3:3, P2O5 - 150 kg hm−2 were used as base fertilizer, Potassium chloride 300 kg hm−2: panicle fertilizer = 5:5. Nitrogen rates (N) significantly influenced the LN of Hybrid Indica cultivars. The first year N0 = 15.5, N150 = 15.7, N300 = 15.9 and the second year N0 = 15.9, N150 = 16.3, N300 = 16.5 with a significant difference between both years. However, Japonica rice cultivars were not as responsive to N as Hybrid Indica's were. The Japonica LN on N0 = 16.2, N150 = 16, N300 = 16.8, and N0 = 16.4, N150 = 16.6, N300 = 16.5 for 2017 and 2018 respectively, with a significant difference in the first year only at N300. The results revealed that LN varies greatly among varieties, furthermore the nitrogen fertilizer and the year of the experiment played a major role on LN outcome.