


-
Maize is a multipurpose crop and is considered a staple crop in different parts of the world. The productivity of maize in the United States has increased nearly eight fold from 1,500 kg hm−2 in the 1930s to 11,864 kg hm−2 in 2018 (FAO 2020,
www.fao.org/faostat/en/#data ). The genetic gain in grain yield ranged from 99 to 109 kg ha−1 year−1 in the US maize belt over the past 50 years[1−3]. Plant density in the corn belt of the central US has increased at an average rate of approximately 1,000 plants ha−1 year−1[4]. China's maize productivity increased from 1,123 kg hm−2 in 1949 to 6,104 kg hm−2 in 2018, showing a more than five-fold increase (FAO 2020). The highest rate of gain for Chinese hybrids was 62 kg ha–1 year−1 at a medium planting density (52,500 plants ha–1) from 1964 to 2001[5]. Similarly, from the 1950s to the beginning of the 21st century, China’s maize planting density increased more than three-fold[6]. In the process of increasing the yield per unit area, researchers found that the yield per plant did not increase significantly, and the increase was mainly due to the planting density of the population (USDA-NASS 1965-2009; USDA-NASS 2010)[7]. Therefore, increasing planting density is an effective means of improving the yield of maize, but larger inputs are required to obtain maximum benefits.In fact, related studies have shown that the yield of modern hybrids is much higher than that of past hybrids under high-density conditions[7−9]. Meanwhile, the literature has reported that the crowding tolerance of modern hybrids is stronger than that of past hybrids[10−15]. The planting density of the winners of a high-yield competition in the United States in 2017 was mostly 85,500−109,500 plants hm−2 (National Corn Yield Contest, Virginia, 2017). Compared with the 67,700 plants hm−2 average plant density in Northwest China from 2014 to 2016, there was a large gap[16]. In short, to obtain maximum yield and increases per unit production of maize, new hybrids with the potential ability to perform better in dense populations are of prime importance. Considering this important point, the current study was conducted with the aim of screening the best genotypes showing resistance to high population density and adaptation in different environments.
All genotypes have different phenotypic responses to environmental changes. The interaction between genotype and environment (G × E) is one of the most important factors[17,18]. In multiple environments, G × E leads to differences in performance among varieties tested in different environments, which requires the new maize hybrids selected by breeders to be tested at multiple time points in multiple years before being commercialized in certain areas[19,20]. Furthermore, general combining ability (GCA) is one index used to evaluate the application potential of inbred lines, where a greater GCA indicates that a line can be used to create good hybrids. It is imperative to evaluate yield and GCA under high density and determine the potential of each hybrid under different densities.
To explore the effect of density on the GCA of inbred lines and screen density tolerance combinations, 16 inbred lines from the Shaan A and Shaan B groups were crossed with two elite inbred lines (Zheng58 and Chang7-2) to form 32 combinations, which were planted with three replications at three densities from 2014 to 2017. The effects of location and year on yield were explored to provide fruitful information for adjusting planting density. This study also aimed to provide a strong basis for the implementation of high-density breeding technology and the selection of density-tolerant maize hybrids.
-
In this study, 16 maize inbred lines originated from Shaan A and Shaan B heterotic groups, which were constructed by the Maize Biology and Genetic Breeding Team of Northwest A&F University (Supplemental Table S1). They were screened at a density of 120,000 plants ha−1 after continuous propagation and selfing to form inbred lines. Two elite lines, Zheng58 and Chang7-2, were used as test lines, and 32 combinations were obtained by line × tester design (Supplemental Table S1). The 32 combinations were planted at three densities (45,000, 67,500 and 90,000 plants hm−2) in three locations in China, i.e., Yangling (YL, 34°54′ N, 108°7′ E), Changwu (CW, 34°59′ N, 107°38′ E) and Yulin (YuL, 38°16′ N, 109°45′ E), from 2014 to 2017. The temperature, precipitation and soil characteristics of each site were shown in Supplemental Table S2 & S3, and the average total solar radiation was YuL ( > 6,100 MJ m−2 ), CW ( 5,400−5,500 MJ m−2 ), Yal ( 5,500−5,600 MJ m−2 ), respectively (Supplemental Table S4). The experiment was performed at each location with three replicates using a completely randomized experimental design. Each plot in all replicates had four rows with a 5 m length, 0.6 m row spacing and 37 cm plant spacing for low density with 45,000 plants hm−2 (LD), 24.7 cm plant spacing for middle density with 67,500 plants hm−2 (MD), 18.5 cm plant spacing for high density with 90,000 plants hm−2 (HD) plant spacing. Other field management practices were performed according to the local production agronomic practices for maize and applied at different densities.
Phenotyping
-
All combinations were evaluated for yield by harvesting the middle two rows. All ears from the middle two rows were harvested at physiological maturity, and ten representative ears were screened to measure ear weight, grain weight and grain moisture. Grain yield was adjusted to the standard moisture content of 14% using the following formula:
$ G_y = \frac{{W \times N}}{A} \times {\text{10000}} \times \frac{{1 - GM}}{{1 - 14{\text{% }}}} $ where Gy is the grain yield per hectare (Mg ha−1), which was adjusted to 14% grain moisture; W is the grain weight per ear; N is the harvested ears per location; A is the area of the location; and GM is the grain moisture measured by a grain moisture analyser (PM-8188-A, Kett Ltd., Tokyo, Japan).
Statistical analysis
Joint analysis of variance
-
Using SAS 9.2 software with the PROC GLM program and the RANDOM statement with the TEST option, combined analysis of variance was performed on the grain yield of hybrid combinations across 12 test environments (four years × three locations) at different densities. Environment (year-location combinations) and replicate were considered random factors, while hybrid combination was considered a fixed effect. The joint variance analysis model was as follows:
$ Y_{ijg} = \mu + E_i + R_{j(i)} + G_g + E_{Gig} + \varepsilon_{ ijg} $ where Yijg is the observed measurement for the g combinations in the j replication in the i environment; μ is the grand mean; Ei is the environmental effect; Rj(i) is the replication effect; Gg is the genotype effect; EGig is the genotype × environment effect; and εijg is the error term.
Analysis of combining ability
-
The effects of GCA and SCA on the measured traits were computed from the mean values adjusted for block effects in each environment and across environments in SAS version 9.2 (SAS Institute, 2001).
$ GCA_i = \bar y_i - \bar y $ $ SCA_{ij} = y_{ij} - GCA_i - GCA_j - \bar y $ where GCAi is the GCA of the i inbred line;
$ \overline{\boldsymbol{y}}_{i} $ $ \bar{y} $ $ y $ The statistical model used for the combined analysis across environments is as follows:
$ Y_{ijk} = \mu + E_e + g_i + g_j + s_{ij} + gE_{eg} + sE_{es} + \varepsilon_{ ijk} $ where Yijk is the observed measurement for the ijth cross grown in the kth environment; μ is the grand mean; gi and gj are the GCA effects; sij is the SCA effect; gEeg is the interaction effect between GCA and the environment; sEes is the interaction effect between SCA and the environment; and isεijg is the error term associated with the ijth cross evaluated in the kth replication and Ee environment.
GGE biplot analysis
-
This analysis was performed using GenStat 19.0 software (VSNC company, Beijing, China). The GGE biplot model equation is[21]:
$ Y_{ij} - Y_j = \lambda_ 1\xi_{ i1}\eta_{ j1} + \lambda_ 2\xi_{ i2}\eta_{ j2} + \varepsilon_{ ij} $ where Yij is the average yield of genotype I in environment j;
$ Y_{\mathbf{j}} $ -
By combined variance analysis, it suggested that grain yield was significantly affected by genotype (G), environment (E, location × year) and genotype × environment (G × E) under different density conditions. Also, the interaction between genotype with other factors (location, year) significantly affected the grain yield under different density conditions (Table 1). With the increase of density, the mean squares between genotypes, locations, genotype × location interactions, and genotype × location × year (G × L × Y) gradually increased, and the contributions of other sources of variation were slightly reduced at higher densities.
Table 1. Analysis of variance of grain yield under different densities.
Source of variation d.f. LD MD HD GY PSQ(%) GY PSQ(%) GY PSQ(%) Genotype (G) 31 18.80** 20.41% 23.91** 21.17% 33.01** 26.20% Environment (E) 11 173.74** 66.94% 193.23** 60.71% 193.09** 54.38% Location (L) 2 951.91** 66.68% 979.09** 55.93% 995.92** 51.00% Year (Y) 3 0.93** 0.10% 23.34** 2.00% 16.67** 1.28% Location × Year (L × Y) 6 0.75** 0.16% 16.24** 2.78% 13.70** 2.10% Genotype × Environment (G × E) 341 0.75** 8.90% 1.36** 13.20% 1.48** 12.94% Genotype × Location (G × L) 62 2.62** 5.69% 3.96** 7.01% 4.56** 7.24% Genotype × Year (G × Y) 93 0.38** 1.24% 0.90** 2.39% 0.73** 1.75% Genotype × Location × Year
(G × L × Y)186 0.30** 1.97% 0.72** 3.80% 0.83** 3.96% * and ** indicate significance at the 0.05 and 0.01 probability levels, respectively. GY: Grain yield; LD: 45,000 plants ha−1; MD: 67,500 plants ha−1; HD: 90,000 plants ha−1; Rep: Repetition; PSQ: Percentage of the sum of squares. Also, the results showed that the difference between environments was the most important cause of yield variation, followed by differences in genotype, and the interaction between genotype and environment was the least important cause. The impact of the environment on grain yield differences was much greater than that of the varieties themselves. Meanwhile, genotype variation showed a higher percentage of sum squares (SS) with increasing density, accounting for 20.41%, 21.17% and 26.20% from low density (45,000 plants ha−1) to high density (90,000 plants ha−1), respectively. However, environmental variation accounted for 66.94%, 60.71% and 54.38% of the SS in LD, MD and HD, respectively, which indicated lower variation at higher densities. This result suggested that genetic effect is larger under HD than LD. High-density planting is preferable to low-density planting in terms of stability.
Combining ability variance analysis
-
To screen inbred lines with high combining ability, we evaluated the combining ability variance under three densities. There was a significant difference between the GCA effect and the SCA effect on grain yield (Table 2). In addition, the GCA effect was larger than the SCA effect across environments, indicating that additive gene action was more important in the inheritance of grain yield. Under the three densities, there was a significant effect of the GCA × Location (G × L) interaction, GCA × Year (G × Y) interaction and GCA × Location × Year (G × L × Y) interaction. Along with the increasing density, the effects of the GCA × L interaction, GCA × Y interaction and GCA × L × Y interaction also gradually increased. Meanwhile, the mean square of the GCA × L interaction was far greater than the mean square of the GCA × Y interaction and GCA × L × Y interaction, indicating that the effect of location (L) on GCA was greater than that of year (Y) and the location × year (L × Y) interaction. This phenomenon was also observed for SCA. All results indicated that the use of multiple environments is more important than the use of multiple years.
Table 2. Analysis of variance of the combining ability of grain yield under different densities.
Source of variation d.f. LD MD HD GCA 15 23.02** 26.37** 39.54** SCA 15 15.83** 22.96** 24.94** GCA × L 30 1.65** 3.58** 3.69** GCA × Y 45 0.36** 0.93** 0.94** SCA × L 30 3.39** 2.80** 5.65** SCA × Y 45 0.32** 0.71** 0.53** GCA × L × Y 90 0.30** 0.83** 0.87** SCA × L × Y 90 0.29** 0.56** 0.80** Rep 2 0.001 0.37 3.28 Residual 766 0.14 0.22 0.32 * and ** indicate significance at the 0.05 and 0.01 probability levels, respectively; GCA: general combining ability; SCA: special combining ability; GCA × L: interaction of general combining ability and location; GCA × Y: interaction of general combining ability and year; SCA × L: interaction of special combining ability and location; SCA × Y: interaction of special combining ability and year; GCA × L × Y: interaction of general combining ability, location and year; SCA × L × L: interaction of special combining ability, location and year. Grain yield changes at different densities in different environments
-
By comparing the grain yield at different densities in different environments, it was found that the overall average yield of the combinations at three environments increased significantly with increasing planting density. The average grain yields were 10.08 Mg hm−2 under LD, 10.71 Mg hm−2 under MD and 11.22 Mg hm−2 under HD, respectively. The grain yield at MD increased by 6.25% compared to that at LD, and the grain yield at HD increased by 11.31% compared to that at LD (Fig. 1a).

Figure 1.
Yield changes under different conditions. (a) Yield changes at different densities. (b) Yield changes among different locations at each density. (c) Yield changes among different years at the each density.
For each location, the yield gradually increased with increasing density. The yields were ranked among locations as follows: YuL > CW > YL. It might be that YL is a summer maize area, in where the whole growth period for maize is short, and Yul belongs to the spring maize area, in where the whole growth period for maize is long and there was a higher solar radition intensity than CW[22]. The variation in yield among locations was significant at the different densities, indicating that the location effect was an important reason for the yield difference (Fig. 1b). A direct relationship with density was observed at each location. The increase in yield at each location was significant and stronger with increasing density. The higher the density, the greater the yield. At the YuL location, the yield at MD increased by 7.2% compared with that at LD, and the yield at MD increased by 11.6% compared with that at LD. In CW, the yield at MD increased by 1.9% compared to that at LD, and the yield at HD increased by 7.6% compared to that at LD. In Yangling, MD increased production by 10% compared to that at LD, and HD increased it by 15.2% compared to that at LD. These findings indicated that increasing planting density was an effective way to increase maize yield, and density was one of the main factors for achieving maximum productivity in potential hybrids.
Meanwhile, the negative pressure of artificial strengthening gradually increased with increasing density, and the yield difference between years gradually increased. Under LD conditions, there was no significant difference in inter-annual yield. Under MD and HD conditions, the overall differences between years were significant.
Relationship between environments and densities
-
To evaluate the discriminating power, representativeness of the test location, we performed a GGE biplot, as well as the correlation between locations. By principal component analysis, the first two principal components together explained 84.70% for LD, 77.73% for MD and 83.38% of the variation for HD, respectively, which fully reflected the effect of G + GE (Fig. 2). It means that GGE biplot could effectively evaluate the high yield and stability of the hybrid combinations. Under the three density conditions, the ability to identify varieties at the YL location was weaker than that at the YuL and CW locations in all years.
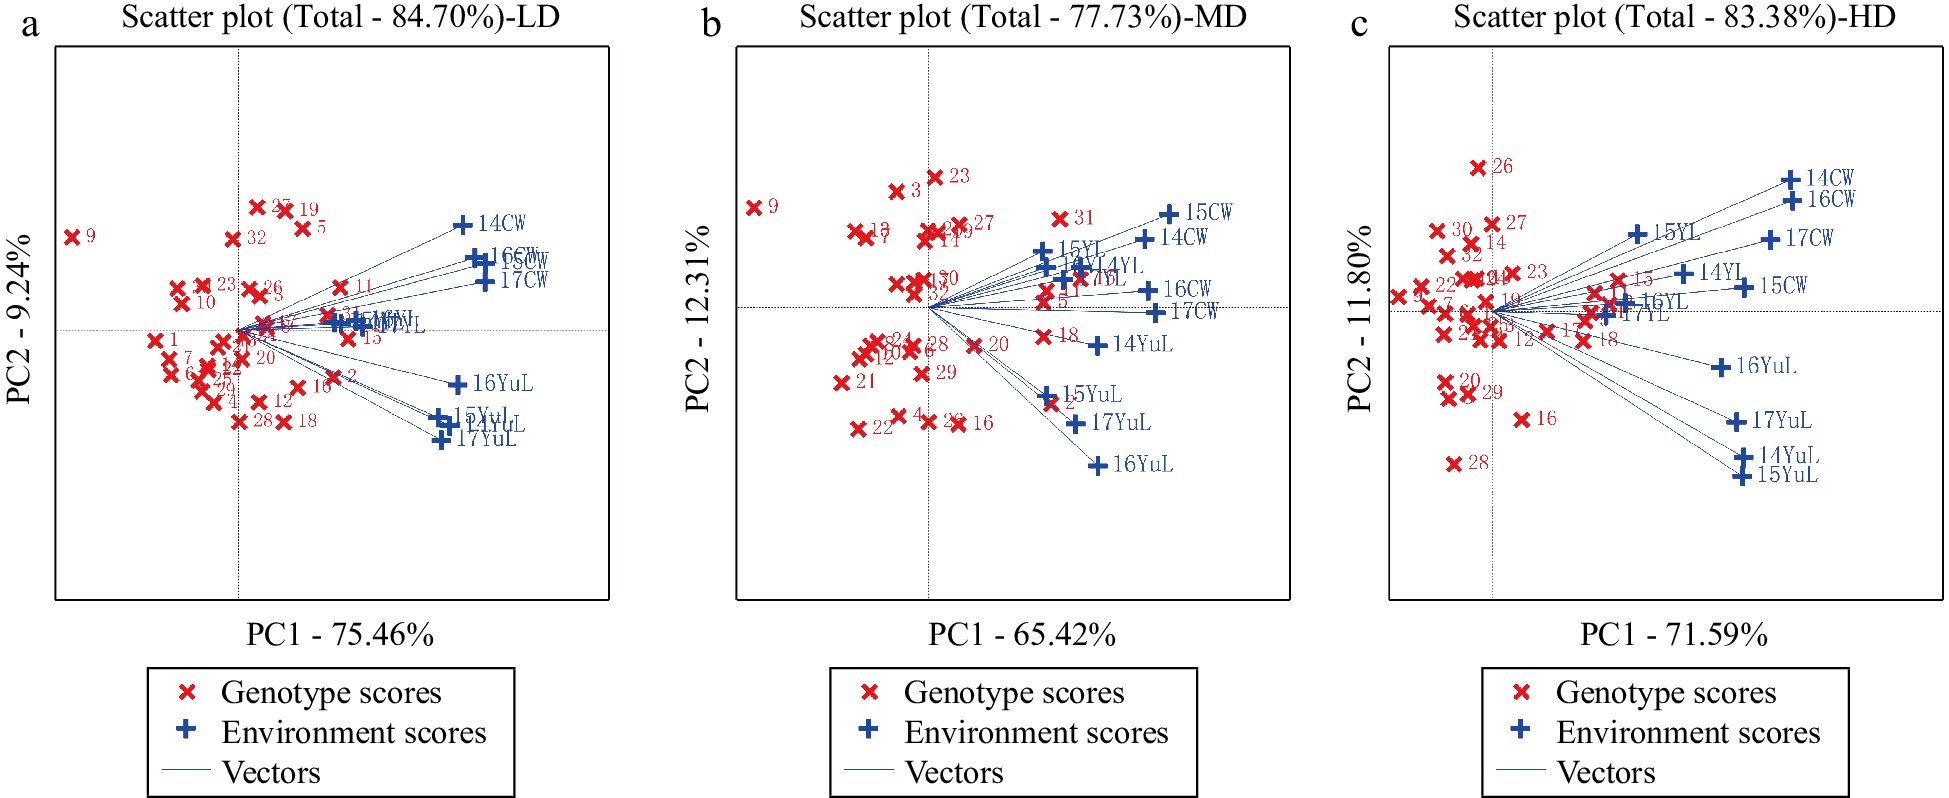
Figure 2.
Relationships between test environments at different densities.
The correlation analysis of different environments showed that grain yield was positively correlated with all environments under all density conditions, but with increasing density, the correlation decreased to a certain extent (Fig. 2). The correlation of yield with MD and LD in YL was higher than that in YuL and CW. The correlation between YL and CW was relatively strong, which may be due to both have adverse conditions. In contrast, YuL had a larger vector angle than the other two locations because of its superior environmental conditions.
In general, under all density conditions, the correlation of grain yield with years in the same location was stronger than that with locations in the same year. In sum, the effect of location on yield was greater than that of year.
Stability analysis of yield and related GCA in hybrid combinations
-
To identify the genotypes with high yield and strong adaptability, we used GGE biplots to analyse the yield stability of 32 hybrid combinations in 12 environments. Under LD, the combinations Zheng58 × KB102(15), Zheng58 × KB106(31), Chang7-2 × 91227(2), Zheng58 × KB081(11) and Chang7-2 × KB102(16) had outstanding performance and yield stability across research environments. Under MD, the genotype combinations with high yield included Zheng58 × KB102(15), Chang7-2 × KB106(31), Chang7-2 × 91227(2), Zheng58 × KB081(11), Zheng58 × PX04(5) and Chang7-2 × KA105(18). Under HD, Zheng58 × KB102(15), Zheng58 × KB081(11), Zheng58 × KB106(31), Chang7-2 × 91227(2), Zheng58 × PX04(5), Chang7-2 × KA105(18) and Zheng58 × KA105 (17) were the genotype combinations with the highest yields. In summary, as the density increased, the number of hybrid combinations with high yield and stability tended to increase gradually; the combination numbers were 5, 6 and 7, and the ratios for all hybrid combinations were 15.6%, 18.8% and 21.9%, respectively (Fig. 3).
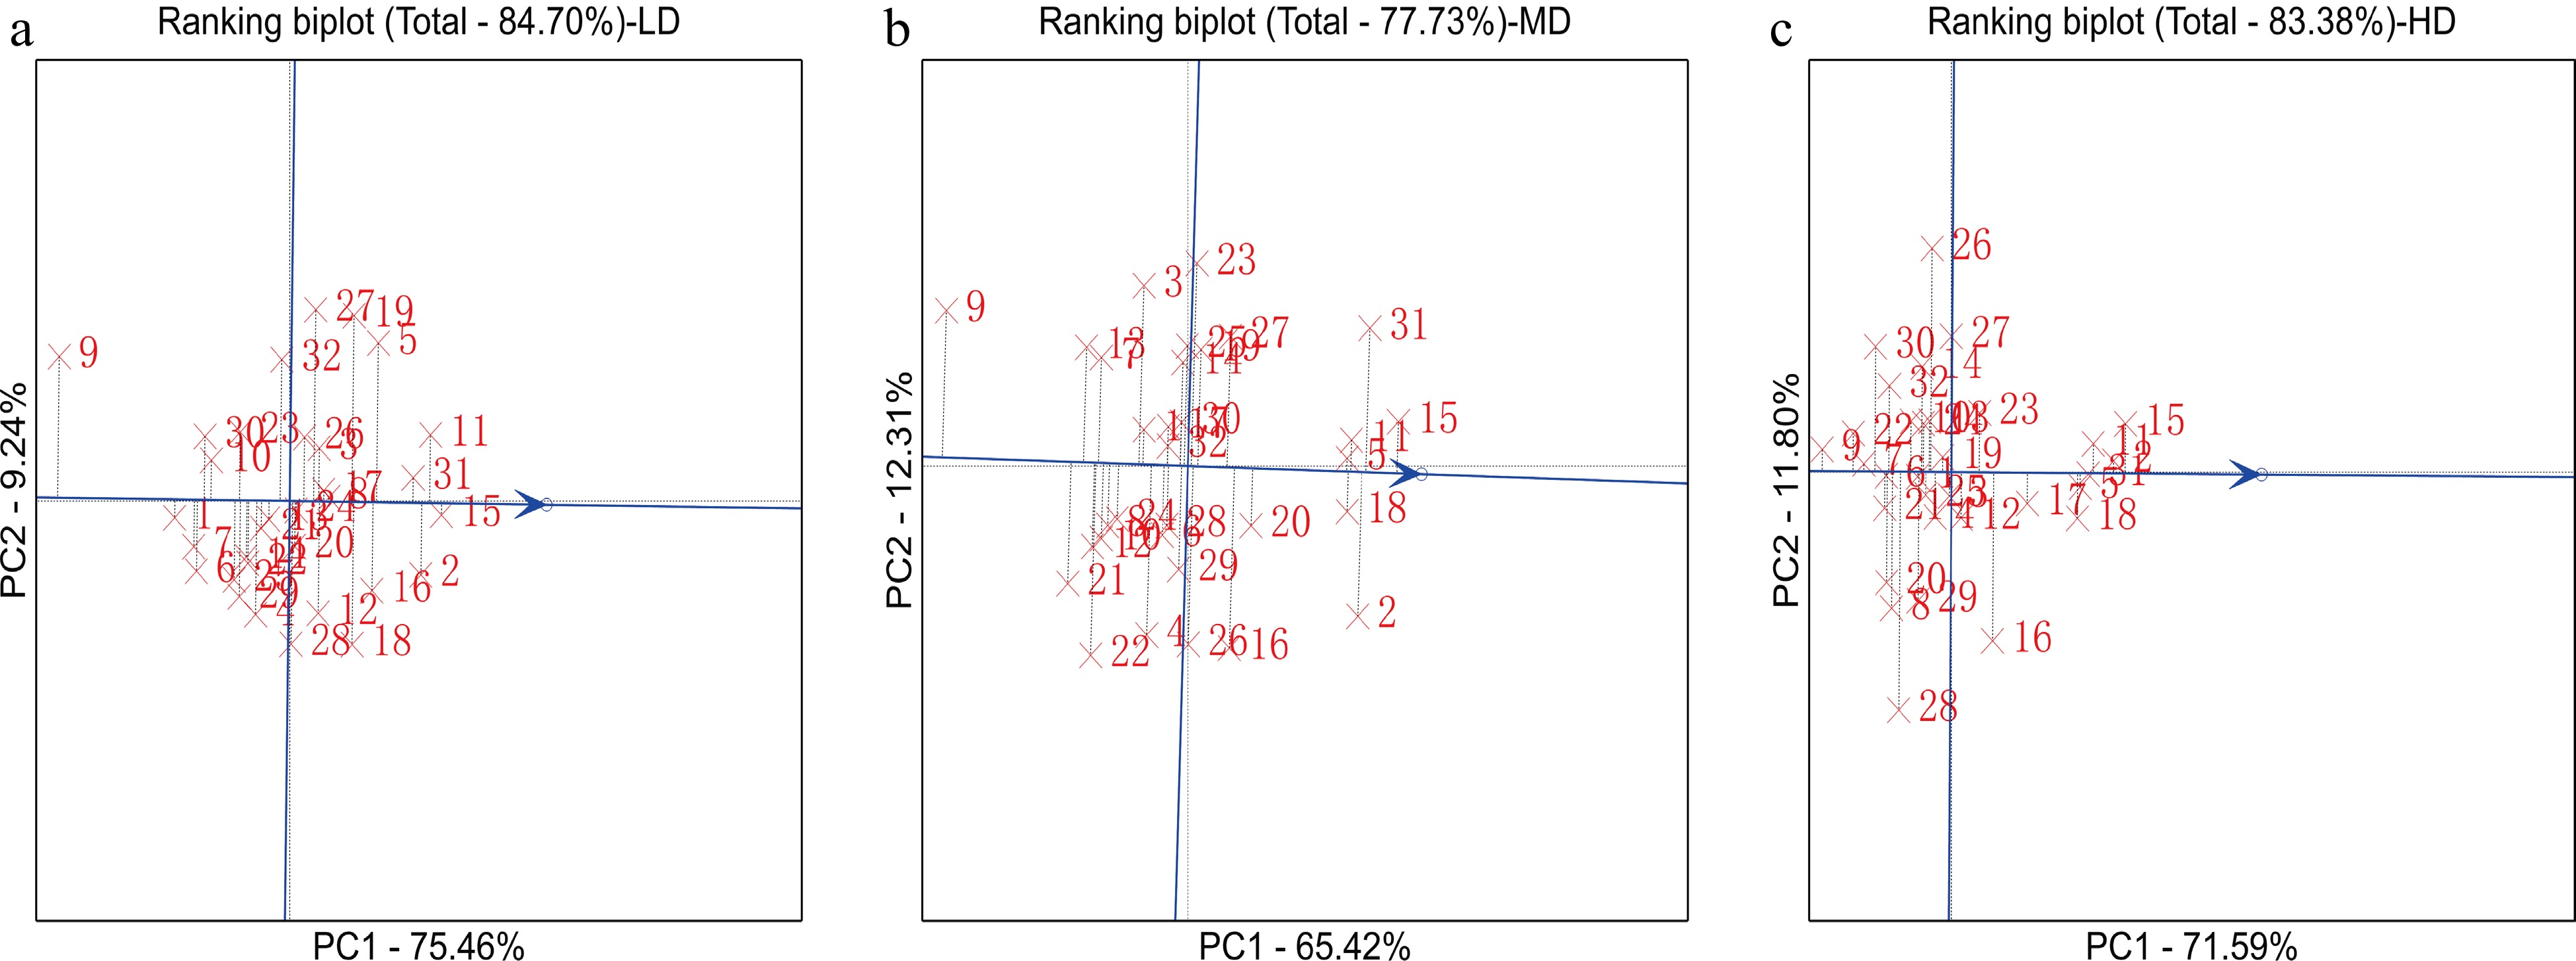
Figure 3.
GGE biplot for the grain yield of 32 hybrid combinations across 12 environments. From left to right, the graph shows the hybrid combinations with high yield and stability at LD, MD and HD. The data were not transformed (transform = 0), were not standardized (scale = 0), and were environment-centred (centring = 2). The biplot was created based on environment-focused singular value partitioning (SVP = 1) and is therefore appropriate for visualizing the relationships among genotypes.
Under different density conditions, the total amounts of variation explained by the first two principal components in the GGE double standard graph were 88.37% (LD), 81.93% (MD) and 84.46% (HD) (Fig. 4). Under LD, KB102(8), KB081(6), KB106(16), KA105(9), and KB020(10) were closer to the smallest concentric circle, indicating that they had outstanding performance and GCA stability across research environments. Under MD, KB102(8), KB106(16), KA105(9), 91227(1), KB020(10), and KB081(6) were closer to the smallest concentric circle, indicating that they had outstanding performance and GCA stability across research environments. Under HD, KB102(8), KA105(9), KB081(6), 91227(1), KB106(16) and PX04(3) had outstanding performance and GCA stability across research environments. In summary, under the three density conditions, the GCAs of KB102, KB106, and KA105 were high and stable, and 91,227 had a high and stable GCA at MD and HD. These results showed that the inbred lines had high crowding tolerance.
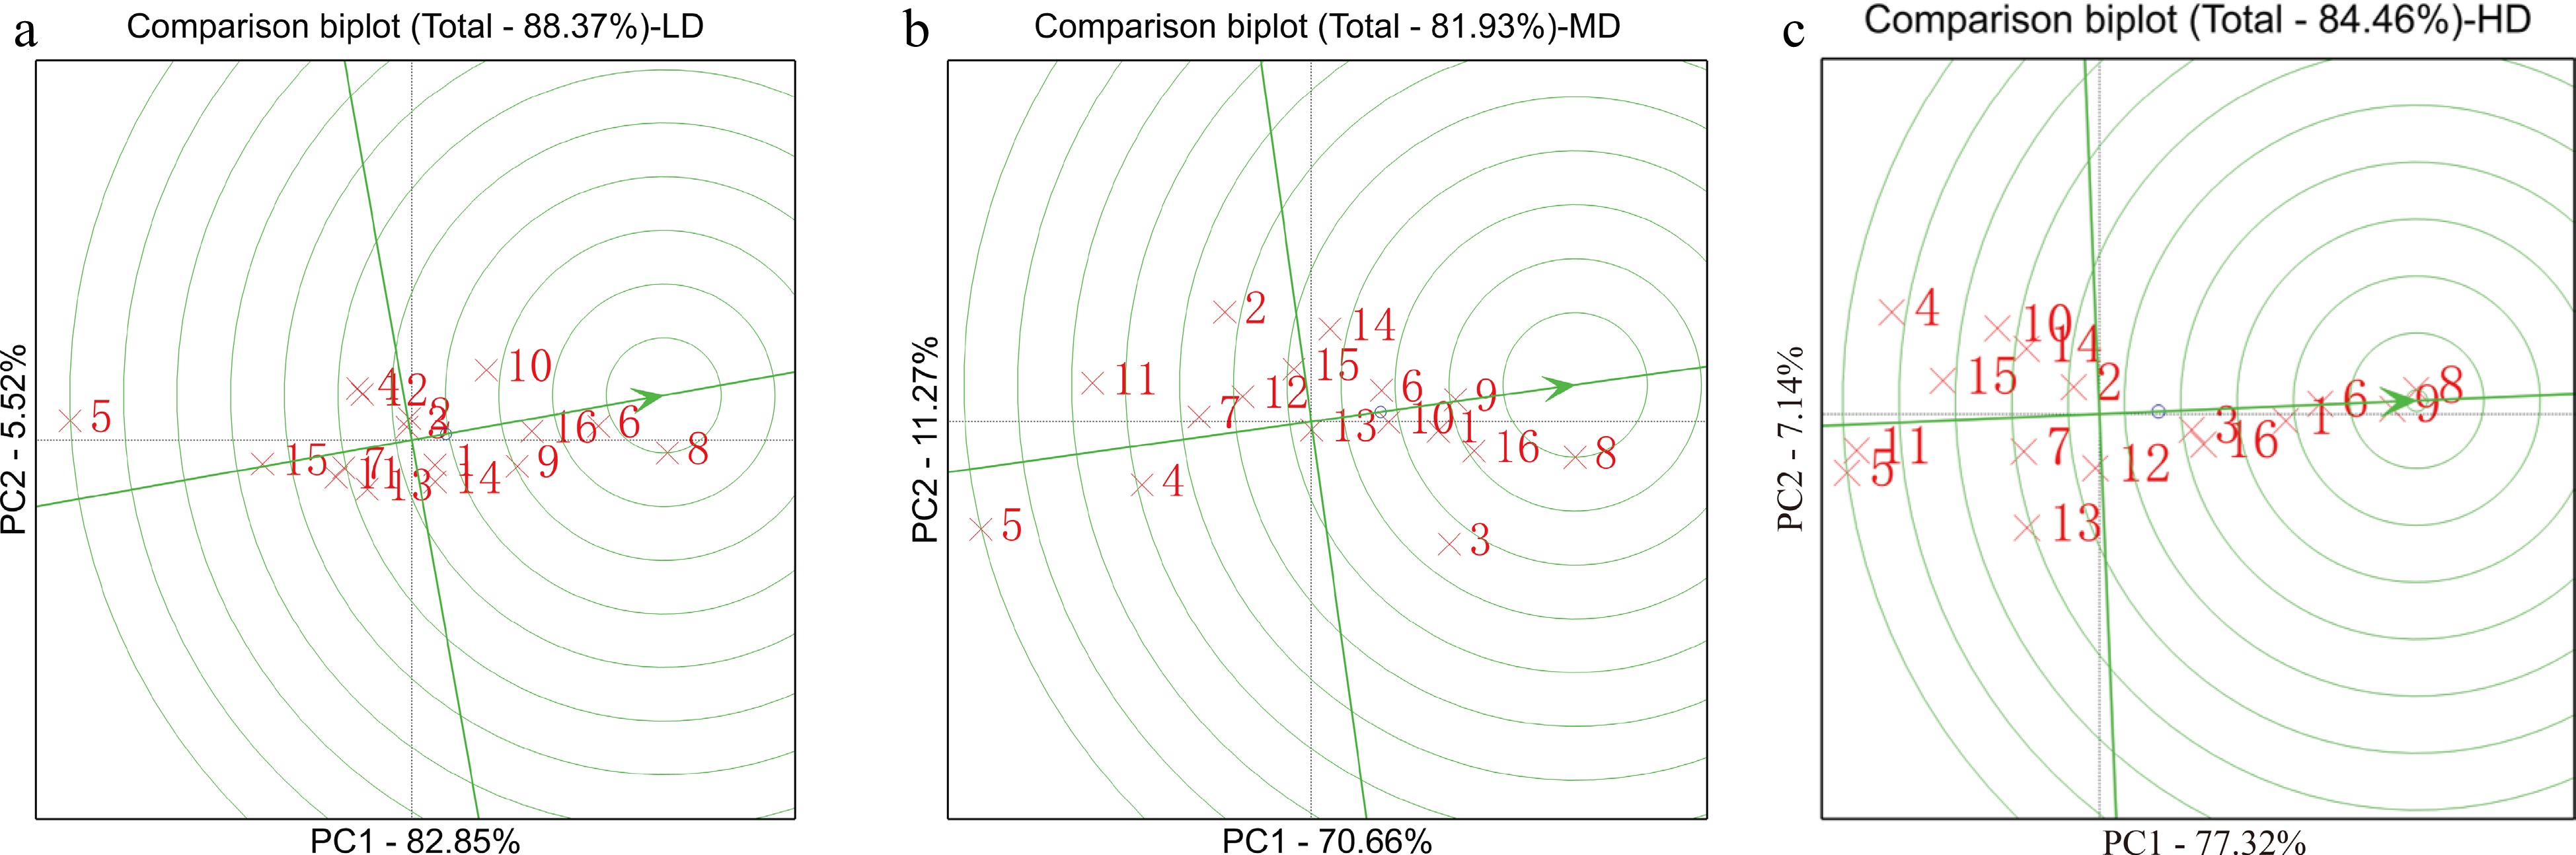
Figure 4.
GGE biplot for the GCA of 16 inbred lines across 12 environments. From left to right, the graph shows the high GCA and stability of inbred lines at LD, MD and HD. The parameters were not transformed (transform = 0), not standardized (scale = 0) and environment-centred (centring = 2). The biplot was created based on environment-focused singular value partitioning (SVP = 1) and is therefore appropriate for visualizing the relationships among genotypes. Understanding the genetic basis of inbred lines is crucial for appropriate breeding design.
-
The ever-growing global population and drastic changes in environmental conditions are potential threats to global food security. To bridge the gap between food supply and demand, scientists face the struggle of securing the future of humans by providing enough food. In the United States, the maize planting density increased by 250 plants hm−2 during the 1930s−1960s, and the growth rate of planting density reached 650 plants hm−2 per year during the 1960s−2010s. At the same time, the yield gain of maize in the United States was approximately 60 kg hm−2 from the 1930s to 1960s, while the yield gain increased to 130 kg hm−2 from the 1960s to 2010s[4, 23]. From 2012−2016, the density of maize production in North America reached 93,000 plants ha−1, with yields moving from 9.3 to 12.7 Mg ha−1, while during the same period, the maize production density in China was only 48,000−67,700 plants ha−1, and the yield was 5.96 Mg ha−1.[16, 24]. Many studies have shown that increasing planting density is an effective way to achieve high yield[25−28]. The current study also provides evidence that increasing the planting density of potential hybrids can significantly improve the yield of maize.
A field experiment including 32 hybrid combinations planted at different densities in multiple environments revealed an average yield increase of 11.2%. Compared with that at low planting density, the yield at high planting density increased by 7.6%−15.2%, which could help increase the overall production of the country. The most recently used approach for achieving maximum yield in a minimum area is increasing plant density[29]. This study provides convincing evidence that the yield of maize crops can be boosted by increasing the planting density and utilizing the available land to its maximum potential. This approach will drastically improve production efficiency, and germplasm tolerant to population density will be helpful for ensuring food security. Because the population density tolerant germplasm has a characteristic that the decrease of single ear weight due to the increase of planting density has less impact on yield than the increase of ears per unit area
The effect of location on yield was greater than that of year
-
For commercial maize hybrids, the stability of yield also plays an important role during the promotion process because yield depends upon genotype, environment and their interaction[30−33]. To determine the genetic variation of commercial hybrids in response to these stresses, scholars have performed many studies on the stability of yield of maize hybrids under diverse conditions, such as drought stress, high density and low nitrogen[34,35]. Yan pointed out that if long-term experimental research shows that the effects of G × Y and G × Y × L are small, then a multipoint test in one year can allow reliable evaluation and selection of test varieties[36]. This method is also applicable under conditions of high heritability (H > 80%). Hybrids that were adaptable to high plant density exhibited greater-than-average yield potential and yield variation across environments.
In this study, we also carried out stability analysis of yield through field experiments performed at three densities at three locations in four consecutive years (2014 to 2017). The environmental effects (L + Y + L × Y) accounted for a greater percentage of the variation than the effects of genotype and G × E. This indicates that the environmental effect is the most important factor determining yield. Meanwhile, the effects of Y (0.10%−2%), G × Y (1.24%−2.39%) and G × Y × L (1.97%−3.96%) on yield were much smaller than those of location, while the heritability of yield traits ranged from 75.6% to 87.96%. The coefficient of variation varied between 6.72 and 14.19% across three locations in 2014−2017 (Supplemental Table S5). Interestingly, the genotype effect gradually increased with increasing density, while the genotype × environment (G × E) interaction effect decreased with increasing density. This may be because the inbred lines selected under high density, multilocation tests, low N and drought can aid in the stress tolerance (especially crowding tolerance) and adaptability of modern maize hybrids[29,34,35]. Therefore, in the process of varietal selection, breeders should pay more attention to genotypic effects across large environments and identify stable genotypes to ease the processes of seed production and marketing. On the other hand, more efforts in terms of seed production and awareness among the farming community will be needed to promote hybrid use in each area.
Application of inbred lines with a high GCA
-
The GCA of KA105, KB106 and KB102 was high during evaluation at high density. The hybrid combination of these inbred lines resulted in higher yield and stability across locations in different years. We propose these inbred lines as potential sources of high-yield, more stable and density-tolerant hybrids, in view of the consumption of maize. Fortunately, these inbred lines have been used for the production of hybrids, and several hybrids have been approved by the government, including Shaandan620 (KA105 × KB106), Shaandan650 (KA105 × KB024), Shaandan660 (KA105 × KB089) and Shaandan680 (KA105 × KB207). Other hybrids have been approved by the Variety Approval Committee in Shaanxi Province (China), including Shaandan619 (KA105×KB020), Shaandan619 (KA203 × KB102) and Yuyu1 (91227 × KB102) etc. (Supplemental Table S6). Among these hybrids, Shaandan620 and Shaandan650 are ideal for mechanical harvesting and can adapt to a density of 75,000 plants hm−2, which is higher than the average density (67,700 plants hm−2) in Northwest China[16]. These findings showed that GCA evaluation of inbred lines can accelerate the breeding process by assessing the germplasm in multiple locations for several years. The most stable genotypes can be selected and used for hybrid production to enhance the overall yield in countries such as China. Stable hybrids across locations with enough tolerance to high density can facilitate a new era of maize production, as maize is the backbone of the poultry and livestock industries worldwide, in addition to being an important food for humans and a richer source of nutrients than wheat and rice.
This research was supported by the China Agriculture Research System (CARS-02), Key Research and Development Program of Shaanxi Province (2021LLRH-07) and the Seed Industry Innovation of Yangling (Ylzy-ym-01). Additionally, we thank the team of the Key Laboratory of Biology and Genetic Improvement of Maize in Arid Areas of the Northwest Region for helping with the field experiment and phenotyping.
-
The authors declare that they have no conflict of interest.
-
These authors contributed equally: Yuan Dong, Zhiqian Feng
- Supplemental Table S1 Maize inbred lines of Shaan A and Shaan B populations and their combinations.
- Supplemental Table S2 Data on temperature and precipitation of three test sites from 2014 to 2017.
- Supplemental Table S3 Soil properties of three test sites.
- Supplemental Table S4 Solar radiation intensity of three pilot sites.
- Supplemental Table S5 Maize hybrid approval information.
- Supplemental Table S6 Yield Heritability and Coefficient of Variation of Different Environmental Tests under Different Densities in 2014 - 2017.
- Copyright: © 2022 by the author(s). Published by Maximum Academic Press, Fayetteville, GA. This article is an open access article distributed under Creative Commons Attribution License (CC BY 4.0), visit https://creativecommons.org/licenses/by/4.0/.
-
About this article
Cite this article
Dong Y, Feng Z, Li T, Farhan A, Tian X, et al. 2022. Performance and stability of yield in response to plant density, year and location in maize hybrids of Northwest China. Technology in Agronomy 2:3 doi: 10.48130/TIA-2022-0003 

Performance and stability of yield in response to plant density, year and location in maize hybrids of Northwest China
- Received: 25 April 2022
- Accepted: 30 September 2022
- Published online: 22 November 2022
Abstract: Identifying desirable genotypes with the best performance in diverse environments is a perpetual aim of plant breeding, and the interaction between genotype and environment (G × E) always plays a key role. This study was conducted to elucidate the genetic behaviour of different hybrid combinations at various densities in diverse environments. According to a line × tester design, 32 hybrid combinations were obtained from 16 inbred individuals crossed with two testers and planted at three locations at three density levels (45,000, 67,500 and 90,000 plants ha−1) during 2014−2017. Genotype (G), environment (E) and the interaction of genotype and environment (G × E) significantly affected grain yield at different densities. Increasing planting density enhanced grain yield and improved the efficiency of germplasm screening, where the effect of location on grain yield at different densities was larger than that of year and the GCA was larger than the SCA. Finally, four inbred lines (KB102, KB081, KA105, and KB106) with a high GCA, environmental adaptability, and several combinations using them as parents have been approved in ShannXi Province and National of China. In conclusion, the evaluation of combining ability at multiple densities and locations can effectively screen inbred lines and improve breeding efficiency.
-
Key words:
- Maize /
- Density /
- Combining ability /
- Yield /
- Stability