


-
Global human population growth threatens current agricultural systems to sustain the rising demand for food and uncertainty in securing safe and nutritious food for society[1]. This highlights the significance of cultivating high-value crops, particularly those with high-quality nutritional components[2] and economical production with application of only essential fertilizers which are necessary for enhancing the nutrients in the soil and maintaining the sustainability for production[3, 4]. Soybean (Glycine max) is among the world's most important crops due to its high-quality plant-based protein and oil content[2−5]. Worldwide, the crop is grown on about 6% of available arable land[2] and 50% of the legume growing areas[6]. Globally, the major soybean-producing countries include the United States of America (USA), Brazil, Argentina, China, and India[7]. In Africa, the soybean crop is among the most common legumes grown in Sub-Saharan Africa (SSA)[1,8,9]. Despite the production of the crop, the yield obtained by smallholder farmers in SSA is not promising as compared with the major soybean growing areas in the world[9]. This needs alternate efforts to increase the productivity of crops while lowering the cost of production, which can be achieved with the judicious use of fertilizers with supplementation of biofertilizers, made from effective rhizobia, in which their effectiveness in increasing productivity lies in soil fertility evaluation for proper decision in type and quantity of fertilizers to be used[10].
Sub-Saharan Africa is among the regions with a fast-growing population but decreasing crop productivity[11]. The decrease in productivity of crops is contributed by different factors such as poor soil health especially soil fertility degradation due to continuous growing and harvesting of crops, unbalanced soil ecology and poor nutrient cycling. Other factors include pests and diseases, climate change, poor crop and nutrient management, use of low yielding varieties as well as unappropriated timing of planting[12−14]. Of all the factors, poor soil health, which includes soil fertility degradation, unbalanced soil ecology and nutrient cycling, is the major factor, which contributes to stagnating or decreasing crop productivity[15] in SSA hence unsustainability in agricultural systems.
Soil health, specifically soil fertility is a very important aspect in the productivity of soil and crops. Nutrient cycling and their availability for uptake by plants are among the key factors, which make the fertile soil productive and hence crop productivity. In the soil, nutrients are harvested through the growing and harvesting of crops. Moreover, when the crop residues are not recycled into the soil as manures, it is a complete harvesting of nutrients, which are taken by plants for their growth and development[16]. Leaving plant residues in the field after harvesting the edible and economic parts of plants is important for return of the nutrients into the soil. The harvesting of nutrients through crops results in serious degradation of soil fertility leading to inadequate nutrients for meeting the crop's requirements in the following season. To ensure sustainable availability of nutrients and good soil health, soil supplementation with fertilizers and manure is a key aspect[17]. For economical production of safe and nutritious food as well as environmental resilience, soil fertility evaluation is the most important aspect for decision-making on the type and amount of fertilizers and, manures to be supplemented for optimum growth and development of plants. This is because, excessive use of fertilizers and manures are linked to environmental pollution especially agricultural soils, water and air as well as higher levels of toxic metals in both the edible and non-edible parts of plants[18] calling for a shift in a use of alternative approaches such as biofertilizers made from beneficial soil microorganisms.
Biofertilizers like other fertilizers and manures supply different nutrients in soil for uptake by plants. Microorganisms as other living creatures are affected by different edaphic factors including[19]: stress environments such as moisture, temperature, acidity, alkalinity, salinity and nutrient composition. The evidence from research shows that the rhizobial effectiveness and populations in nitrogen fixation are interconnected with the fertility of soil whereby extreme soil conditions have been observed to negatively affect the effectiveness of rhizobial strains[20].
In SSA, smallholder farmers dominate the agricultural systems for food crops[21,22]. Synthetic fertilizers are most widely available and accessible ones to many farmers moreso than organic manure, because not all of them keep livestock. In addition, in order to meet crop requirements through application of organic manure, it needs larger quantities per hectare to meet crop requirements. Although, organic manure contain nutrients in very small quantities, they are well known to possess the characteristics of improving the soil conditions[23] making unreplaceable advantages of using organic manure along with other types of fertilizers. Despite their availability, smallholder farmers rarely use synthetic fertilizers due to their cost, hence less amount is used. Biofertilizers are observed to be cheaper, effective and environmentally friendly with more advantages in balancing the soil ecosystem as well as nutrient cycling[24]. For sustainability in agricultural systems the use of biofertilizers together with soil fertility evaluation is crucial in crop production. However, the evaluation of soil fertility for decision making in type (including biofertilizers) and quantity of fertilizers and the importance of biofertilizers have been ignored in smallholder farming systems. This calls for the creation of awareness of importance of soil fertility evaluation and the use of biofertilizers as an alternative approach to industrial fertilizers in meeting crop's requirements to improve productivity for optimum yield. Therefore, this study aimed at evaluating soil fertility between the soybean growing areas and the non soybean growing areas of Tanzania and their suitability for the use of rhizobia inoculants. The findings of this study will contribute to enriching the knowledge which the researchers could tap into, for the benefit of further studies on the management of soil nutrients as well as the importance of evaluating the fertility status of soil in improving the productivity of different crops in meeting the food demand.
-
Soils and nodules for this study were collected from the major soybean growing regions in the eastern, northern, and southern highlands, of Tanzania. In the southern highlands, the regions included were: Iringa, Njombe, Ruvuma, Songwe, Rukwa, and Mbeya. This zone is located between latitudes 7° and 11.5° S and longitudes 30° and 38° E with an elevation ranging from 302 to 2,925 meters above sea level (m.a.s.l.). Rainfall is unimodal falling in November to May with annual rainfall of 1,650 mm and dry periods ranging from June to September[25]. The mean annual temperature ranges from 7 to 32.2 °C. The eastern zone included Morogoro region which is located between latitudes 5° and 9° S and longitudes 35° and 38° E. The mean annual temperature ranges from 15 to 32 °C and the average annual rainfall is around 740 mm[26]. In the northern zone, Arusha and Kilimanjaro regions were included in the present study. The Arusha region lies between latitudes 1° and 4° S and longitudes 34° and 37° E with an average annual rainfall of 873 mm while the temperature ranges from 12.1 to 28.8 °C. The Kilimanjaro region lies between the latitudes 2° and 4° S and longitudes 36° and 38° E. The average annual rainfall in the Kilimanjaro region ranges from 700 mm to 2,000 mm and the temperature ranges from 12.5 to 27 °C. The site description of the sampled areas are presented in Fig. 1.
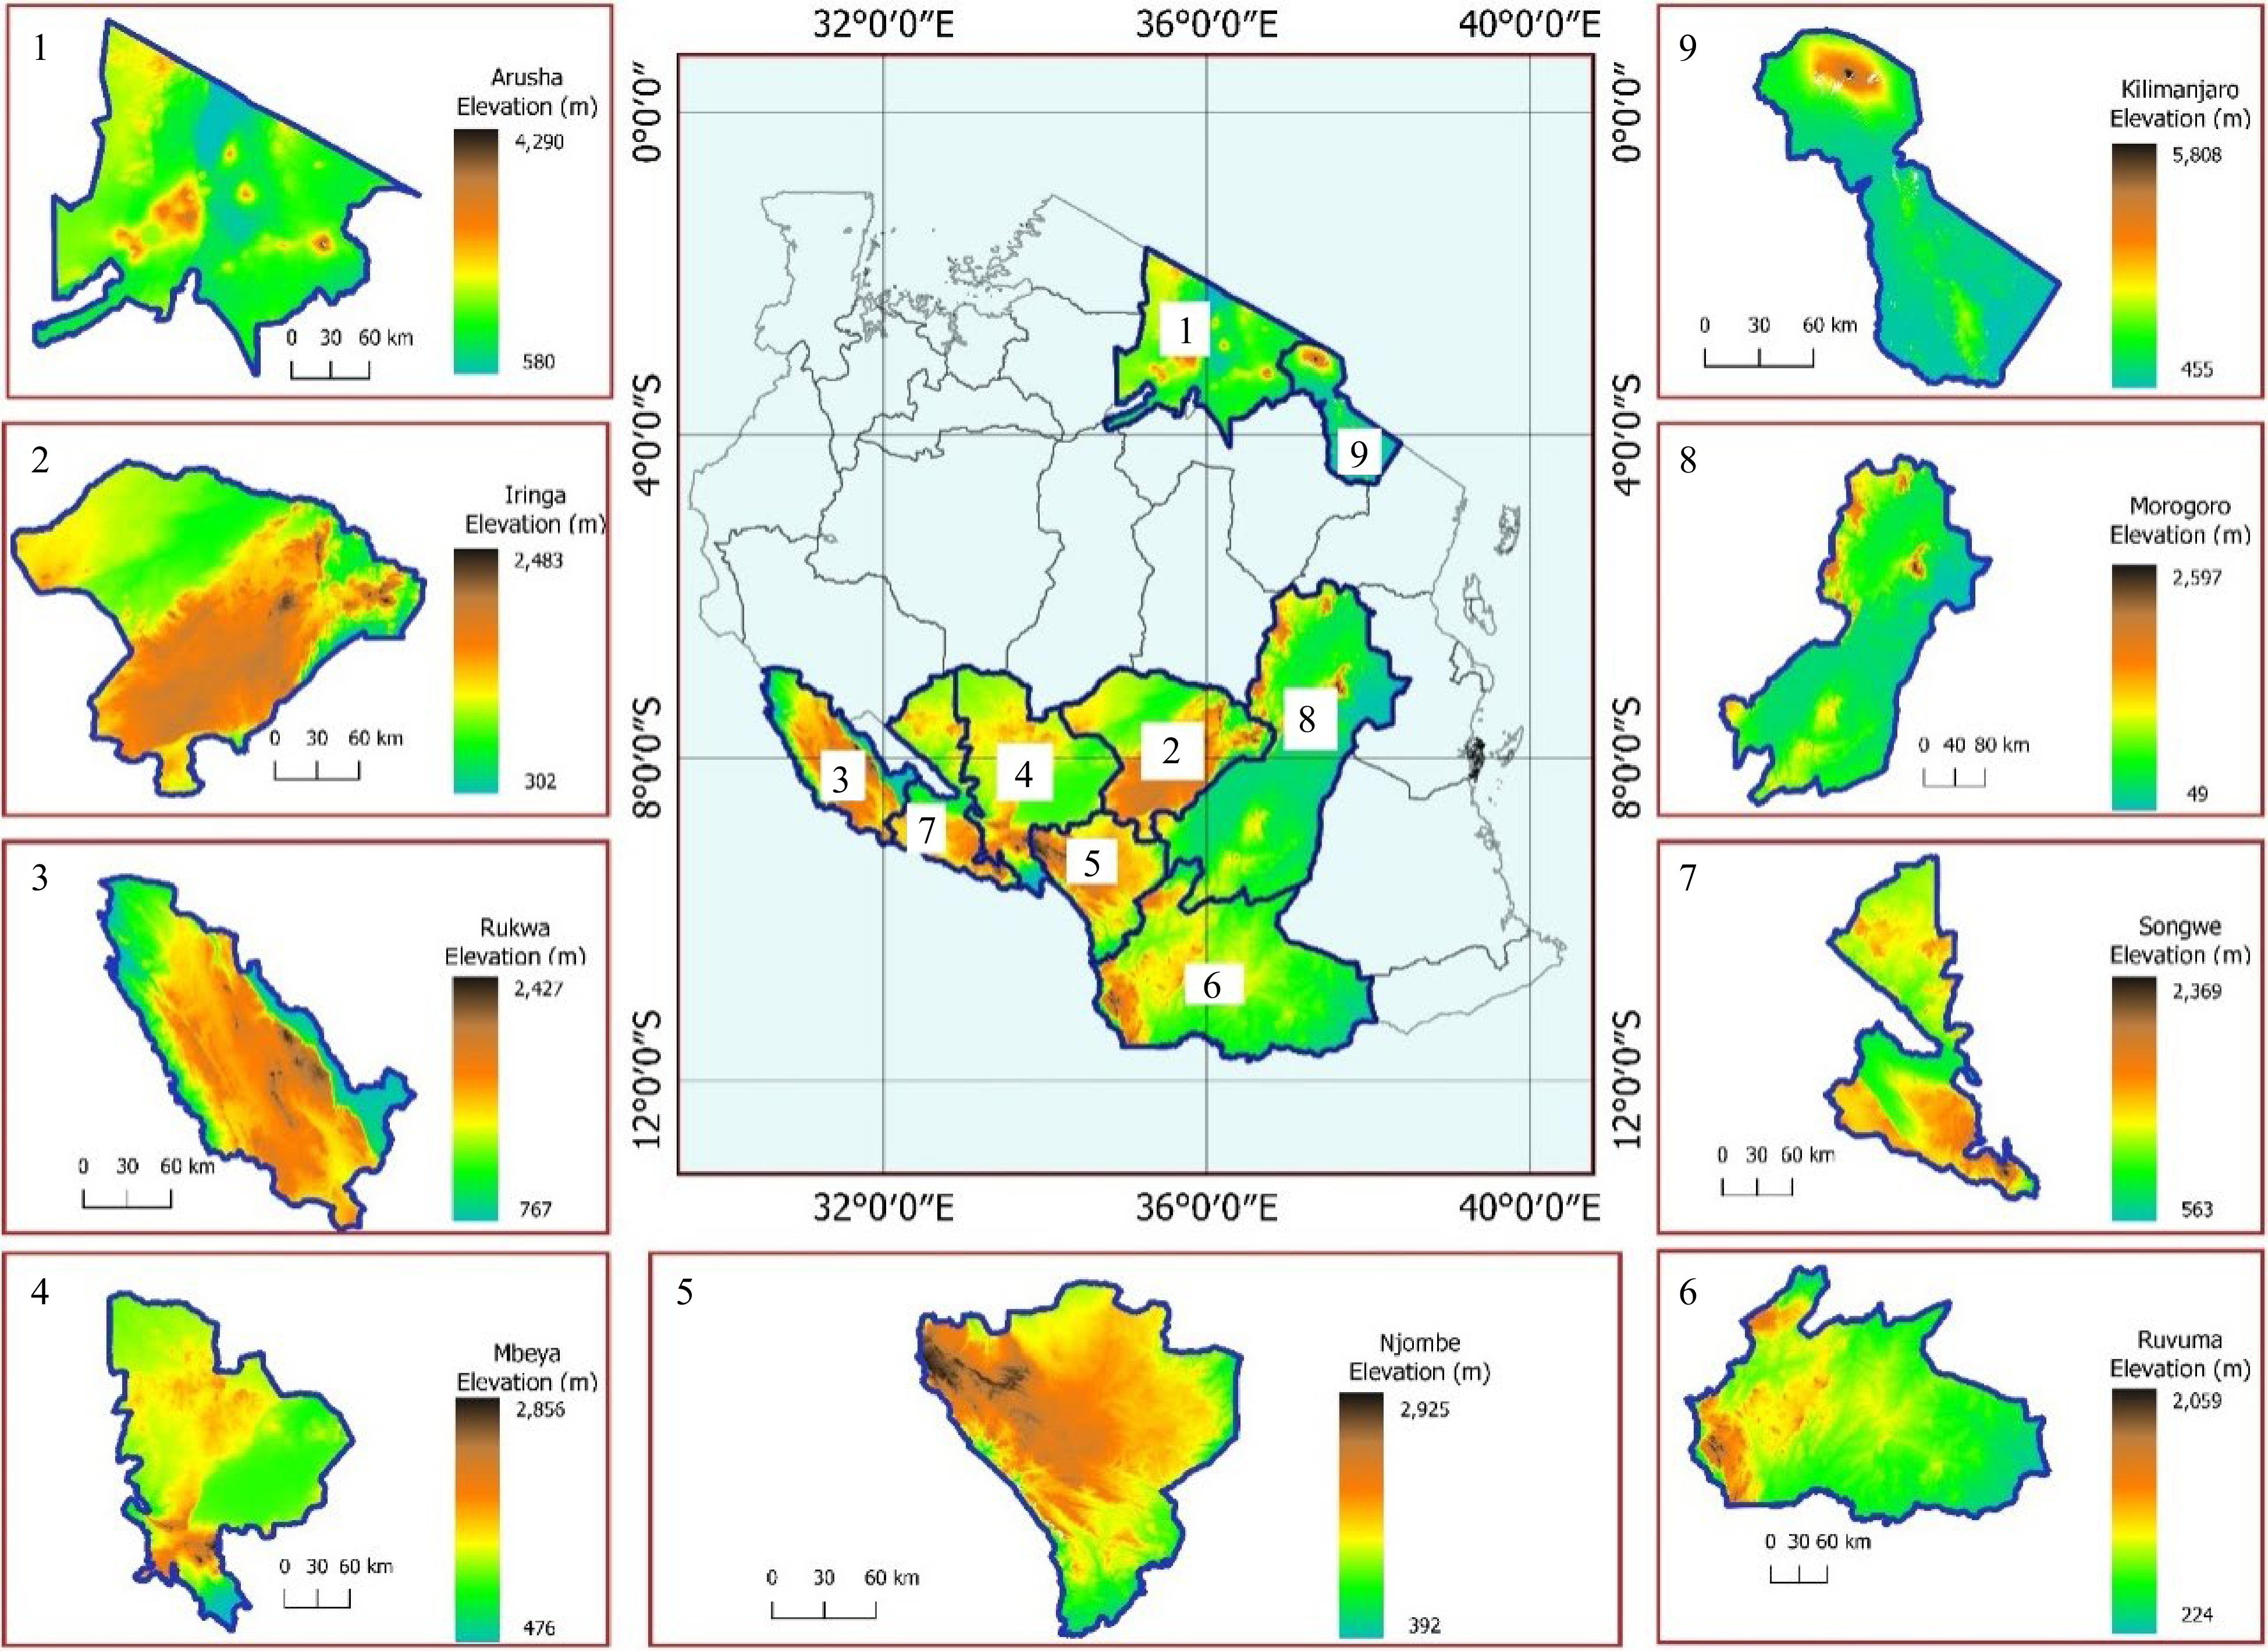
Figure 1.
Map showing maximum and minimum elevations of the regions in the study sites.
Soil sample collection and soil fertility evaluation
-
In each region, three representative districts were selected, three villages in each district, and one field with a history of using only organic manure, for at least three seasons, consecutively, were selected. The study sites and sampling location map was generated using QGIS 3.14.0 software (Fig. 2). Soil samples were taken from three spotted locations per field depending on the color of the soil because the area was too small (< one acre). For each spotted location, about 1 kg of soil sample was collected from a depth of 0−30 cm. One composite soil sample was prepared by mixing three soil samples, removing the roots and crumps. Prior to laboratory analysis, the soil was air-dried and sieved through 2 mm mesh.
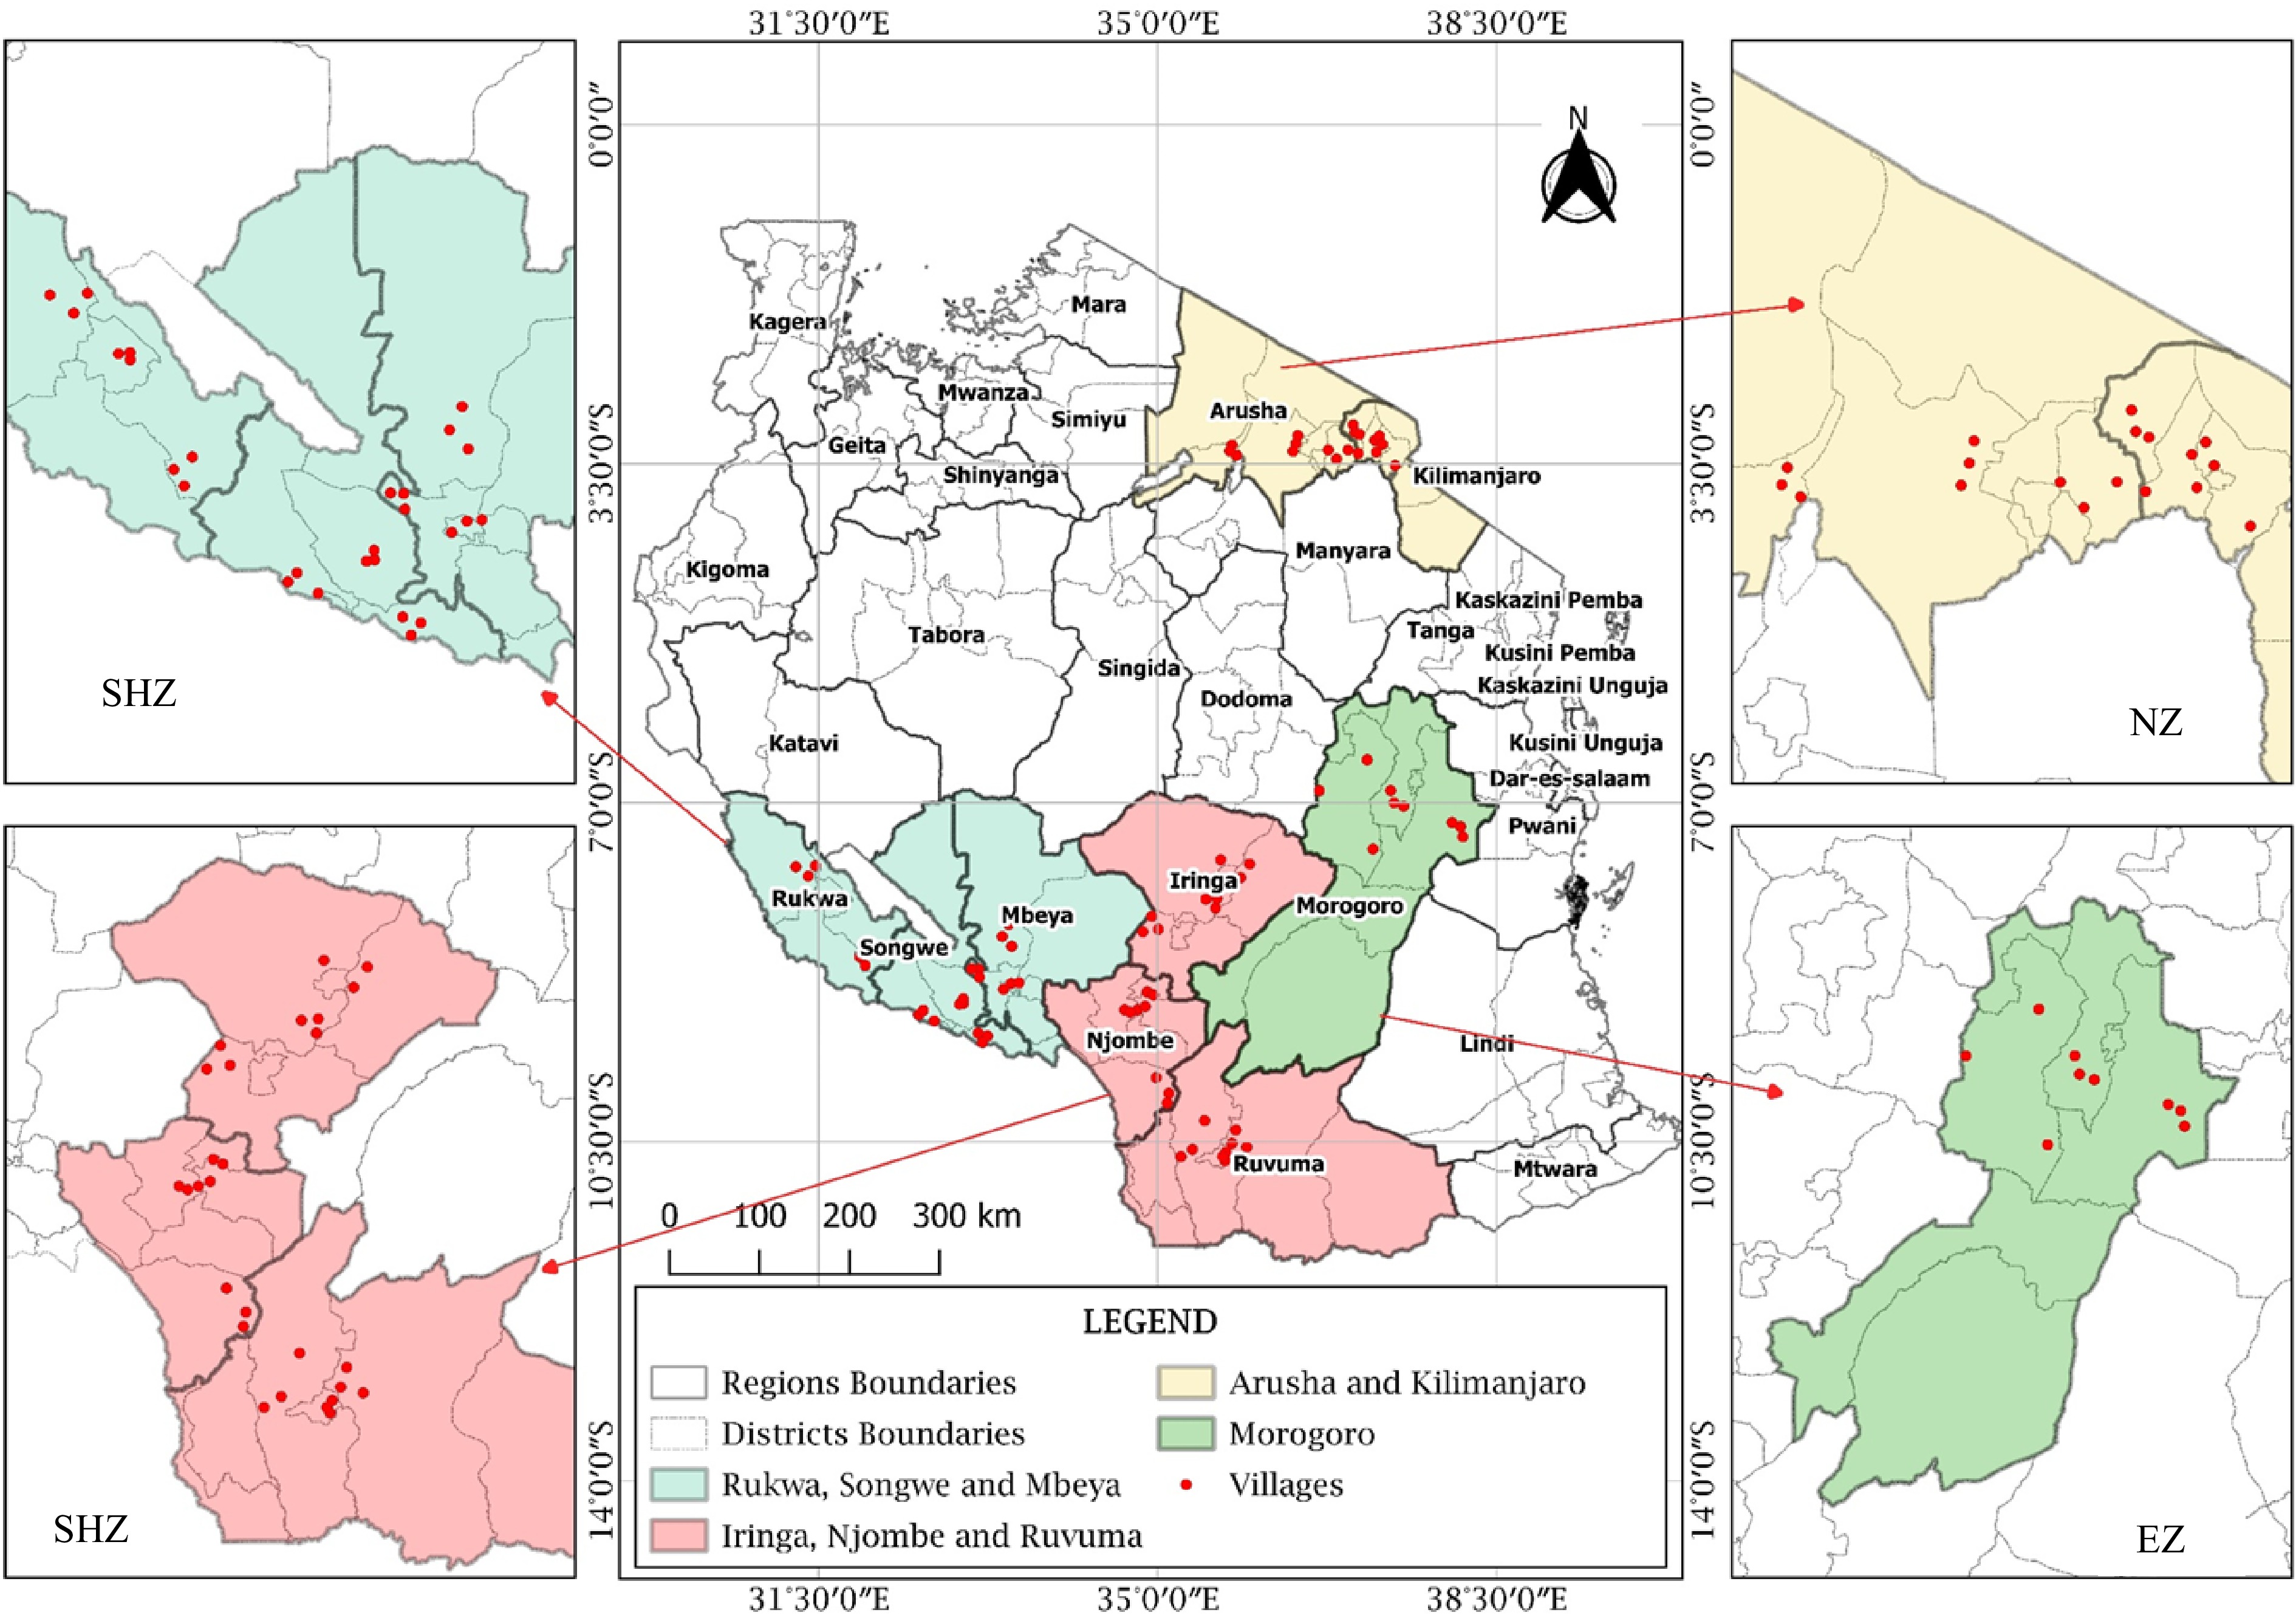
Figure 2.
Map showing soil and nodules sampling fields in different regions of Tanzania (SHZ-Southern Highland Zone, EZ-Eastern Zone and NZ-Northern Zone).
The soil texture was determined using the hydrometer method. Total nitrogen was determined by the micro-Kjeldahl digestion-distillation method. Cation exchange capacity was measured at pH 7 with 1 M Ammonium Acetate (NH4OAc) and exchangeable cations K+ and Na+ were determined by flame photometer while, Ca2+ and Mg2+ as well as micronutrients Iron (Fe), Copper (Cu), Zinc (Zn) and Manganese (Mn) were determined by an atomic absorption spectrophotometer[27]. The soil organic carbon was characterized by the wet digestion (oxidation) method of Walkley-Black[28]. The soil pH was measured electrochemically in 1:2.5 (weight/volume) soil using the water suspension potentiometric method[29]. The availability of P in soils is influenced by soil pH, hence P analysis of soils was done by two methods, for soils with pH ≥ 6.5, extractable P was determined by the Olsen method and for soils with pH ≤ 6.5, Bray 1 method was used[30].
Nodules collection
-
The nodule samples were collected during cropping seasons from the same sites where the soils were sampled. The collection of nodule samples focused on the farmers' fields where rhizobia inoculants have never been used before for the purpose of obtaining the indigenous rhizobia which can effectively form nodules with soybean in the soils of Tanzania. At 50% flowering, from each farmer field, three healthy plants (treated as replicates) with intense green leaves were randomly collected by uprooting to obtain nodules in each field, making a total of 243 plants which were treated as separate samples[31,32]. The intense greening of leaves was considered as sufficiency of nitrogen in plants. The nodules for each plant were counted and the data was recorded.
Statistical data analysis
-
Different statistical methods were applied to analyze the collected data in terms of its distribution and correlation among the studied parameters. The Principle Component Analysis (PCA) for Soil Quality Indices was plotted by using XLSTAT software Version 2023.5.1. All the collected nodule data were statistically analyzed by Jamovi version 2.3.2.0, GenStat 15th Edition and the graphs were plotted using Excel 2016 in Windows 10. The mean and standard errors within the sites for nutrients in soil as well as correlation matrix between nodules number and soil nutrients were calculated by using Jamovi version 2.3.2.0. The mean separation within and between sites for nodule number were determined by one-way analysis of variance (ANOVA) following the factor effect model as shown in Eqn 1. Tukey's-HSD multiple comparison test at a threshold of 5% in GenStat 15th Edition was conducted to separate mean values among replications of the nodule number. Therefore, only one factor – the sampling site (i.e., 81 sites) with different soil characteristics was considered as the fixed main effect whereas sample replicates were treated as random effect.
$ {\mathrm{Y}}_{i}=\mathrm{\mu }+{\mathrm{\alpha }}_{i}+{\mathrm{\varepsilon }}_{i} $ (1) Where Yi is the observed response variable in the ith factor; µ is the overall (grand) mean; αi is the main effect of the factor sampling site; εi is the random error associated with the observation of response variable in the ith factor.
-
The data for soil physico-chemical properties of the studied sites are summarized in Table 1 with details in Supplemental Tables S1 & S2. The soil pH in all 81 sites was extremely acidic to moderately alkaline with an average of 6.222 ± 0.655 and total acidity low to very high with an average of 0.292 ± 0.589 cmol(+)Kg−1. The CEC of the soils was very low to medium with an average of 7.899 ± 4.582 cmol(+)Kg−1. In the case of exchangeable bases, Ca was low to high with an average of 5.099 ± 3.698 cmol(+)Kg−1), Mg been very low to high with an average of 1.257 ± 0.906 cmol(+)Kg−1), while K was low to very high with an average of 0.277 ± 0.397 cmol(+)Kg−1) and Na was very low to low with an average value of 0.026 ± 0.034 cmol(+)Kg−1). The concentration of extractable P in the soils was low to very high with an average value of 33.909 ± 37.264 mg·kg−1. The OC in the soils ranged from very low to high with an average of 1.663% ± 0.893 and total N varied from very low to medium with an average of 0.153% ± 0.074% while the ratio of carbon and nitrogen (CN ratio) was of low quality which was less than 8 and moderate quality which was greater than 13 with an average value of 11.385 ± 2.591. On the other hand, there was variation in the levels of micronutrients whereby Cu and Zn ranged from very low to very high with their averages been 3.312 ± 7.984 and 4.410 ± 5.859 mg·kg−1 while Mn varied from medium to very high with an average of 80.462 ± 43.892 mg·kg−1 and Fe from high to very high with an average of 66.553 ± 63.671 mg·kg−1.
Table 1. Soil chemical parameters of the study sites.
Parameter Number Minimum Maximum Mean Std. deviation Soil pH (1:2.5) (H2O) 81 4.480 7.923 6.222 0.655 Cu (mg·kg−1) 81 0.048 49.185 3.312 7.984 Zn (mg·kg−1) 81 0.062 40.778 4.410 5.859 Mn (mg·kg−1) 81 1.597 172.535 80.462 43.892 Fe (mg·kg−1) 81 7.840 526.726 66.553 63.671 TN-Kjeld (%) 81 0.066 0.378 0.153 0.074 OC-BlkW (%) 81 0.427 4.993 1.663 0.893 C/N ratio 81 4.670 19.778 11.385 2.591 Ext. P (mg·kg−1) 81 2.352 166.179 33.909 37.264 CEC (cmol(+)Kg−1) 81 1.913 20.801 7.899 4.582 Ca2+ (cmol(+)Kg−1) 81 0.202 14.375 5.099 3.698 Mg2+ (cmol(+)Kg−1) 81 0.177 3.479 1.257 0.906 Na+ (cmol(+)Kg−1) 81 0.000 0.255 0.026 0.034 K+ (cmol(+)Kg−1) 81 0.034 2.692 0.277 0.397 Total acidity
(cmol(+)Kg−1)81 0.085 5.153 0.292 0.589 Exch. Al
(cmol(+)Kg−1)81 0.000 0.847 0.045 0.125 Exch. H
(cmol(+)Kg−1)81 0.000 4.743 0.247 0.543 Principal Component Analysis (PCA) shows that the first two PCs explain around 43.7% of the variance and the first five PCs explain 70.1% of the variance (Fig. 3; Supplemental Tables S3 & S4). These PCs were selected according to the method described by other researchers[33−35]. Twelve other PCs were excluded from the present study. The eigenvectors in the context of the PCA (Table 2; Fig. 4) revealed the relationships between the original variables (soil pH, Cu, Zn, Mn, Fe, TN-Kjeldahl, OC-BlkW, C/N ratio, P, CEC, Ca2+, Mg2+, Na+, K+, Total acidity, Al3+, and H+) and the extracted PCs (F1 to F5). Results further indicated that the first PC (F1) reflect relatively higher positive contributions from variables soil pH, Cu, Zn, Ext. P, CEC, Ca2+, Mg2+, K+, Total Acidity, Al3+, and H+. The PC (F2) has notable positive contributions from variables Fe, Na, K, Total acidity, Al3+, and H+. The third PC (F3) is negatively influenced by the variable soil pH, Cu, Zn, TN-Kjeld, OC-BlkW, C/N ratio, Total acidity, Al3+, and H+ while positively correlated with extractable P, Ca2+, Mg2+, Na+, and K+. The fourth PC has strong positive contributions from variables Cu, Zn, Mn, Fe, P, and C/N ratio and the last component F5 is negatively influenced by Fe, Na+, K+, Total acidity, Al3+, and H+.
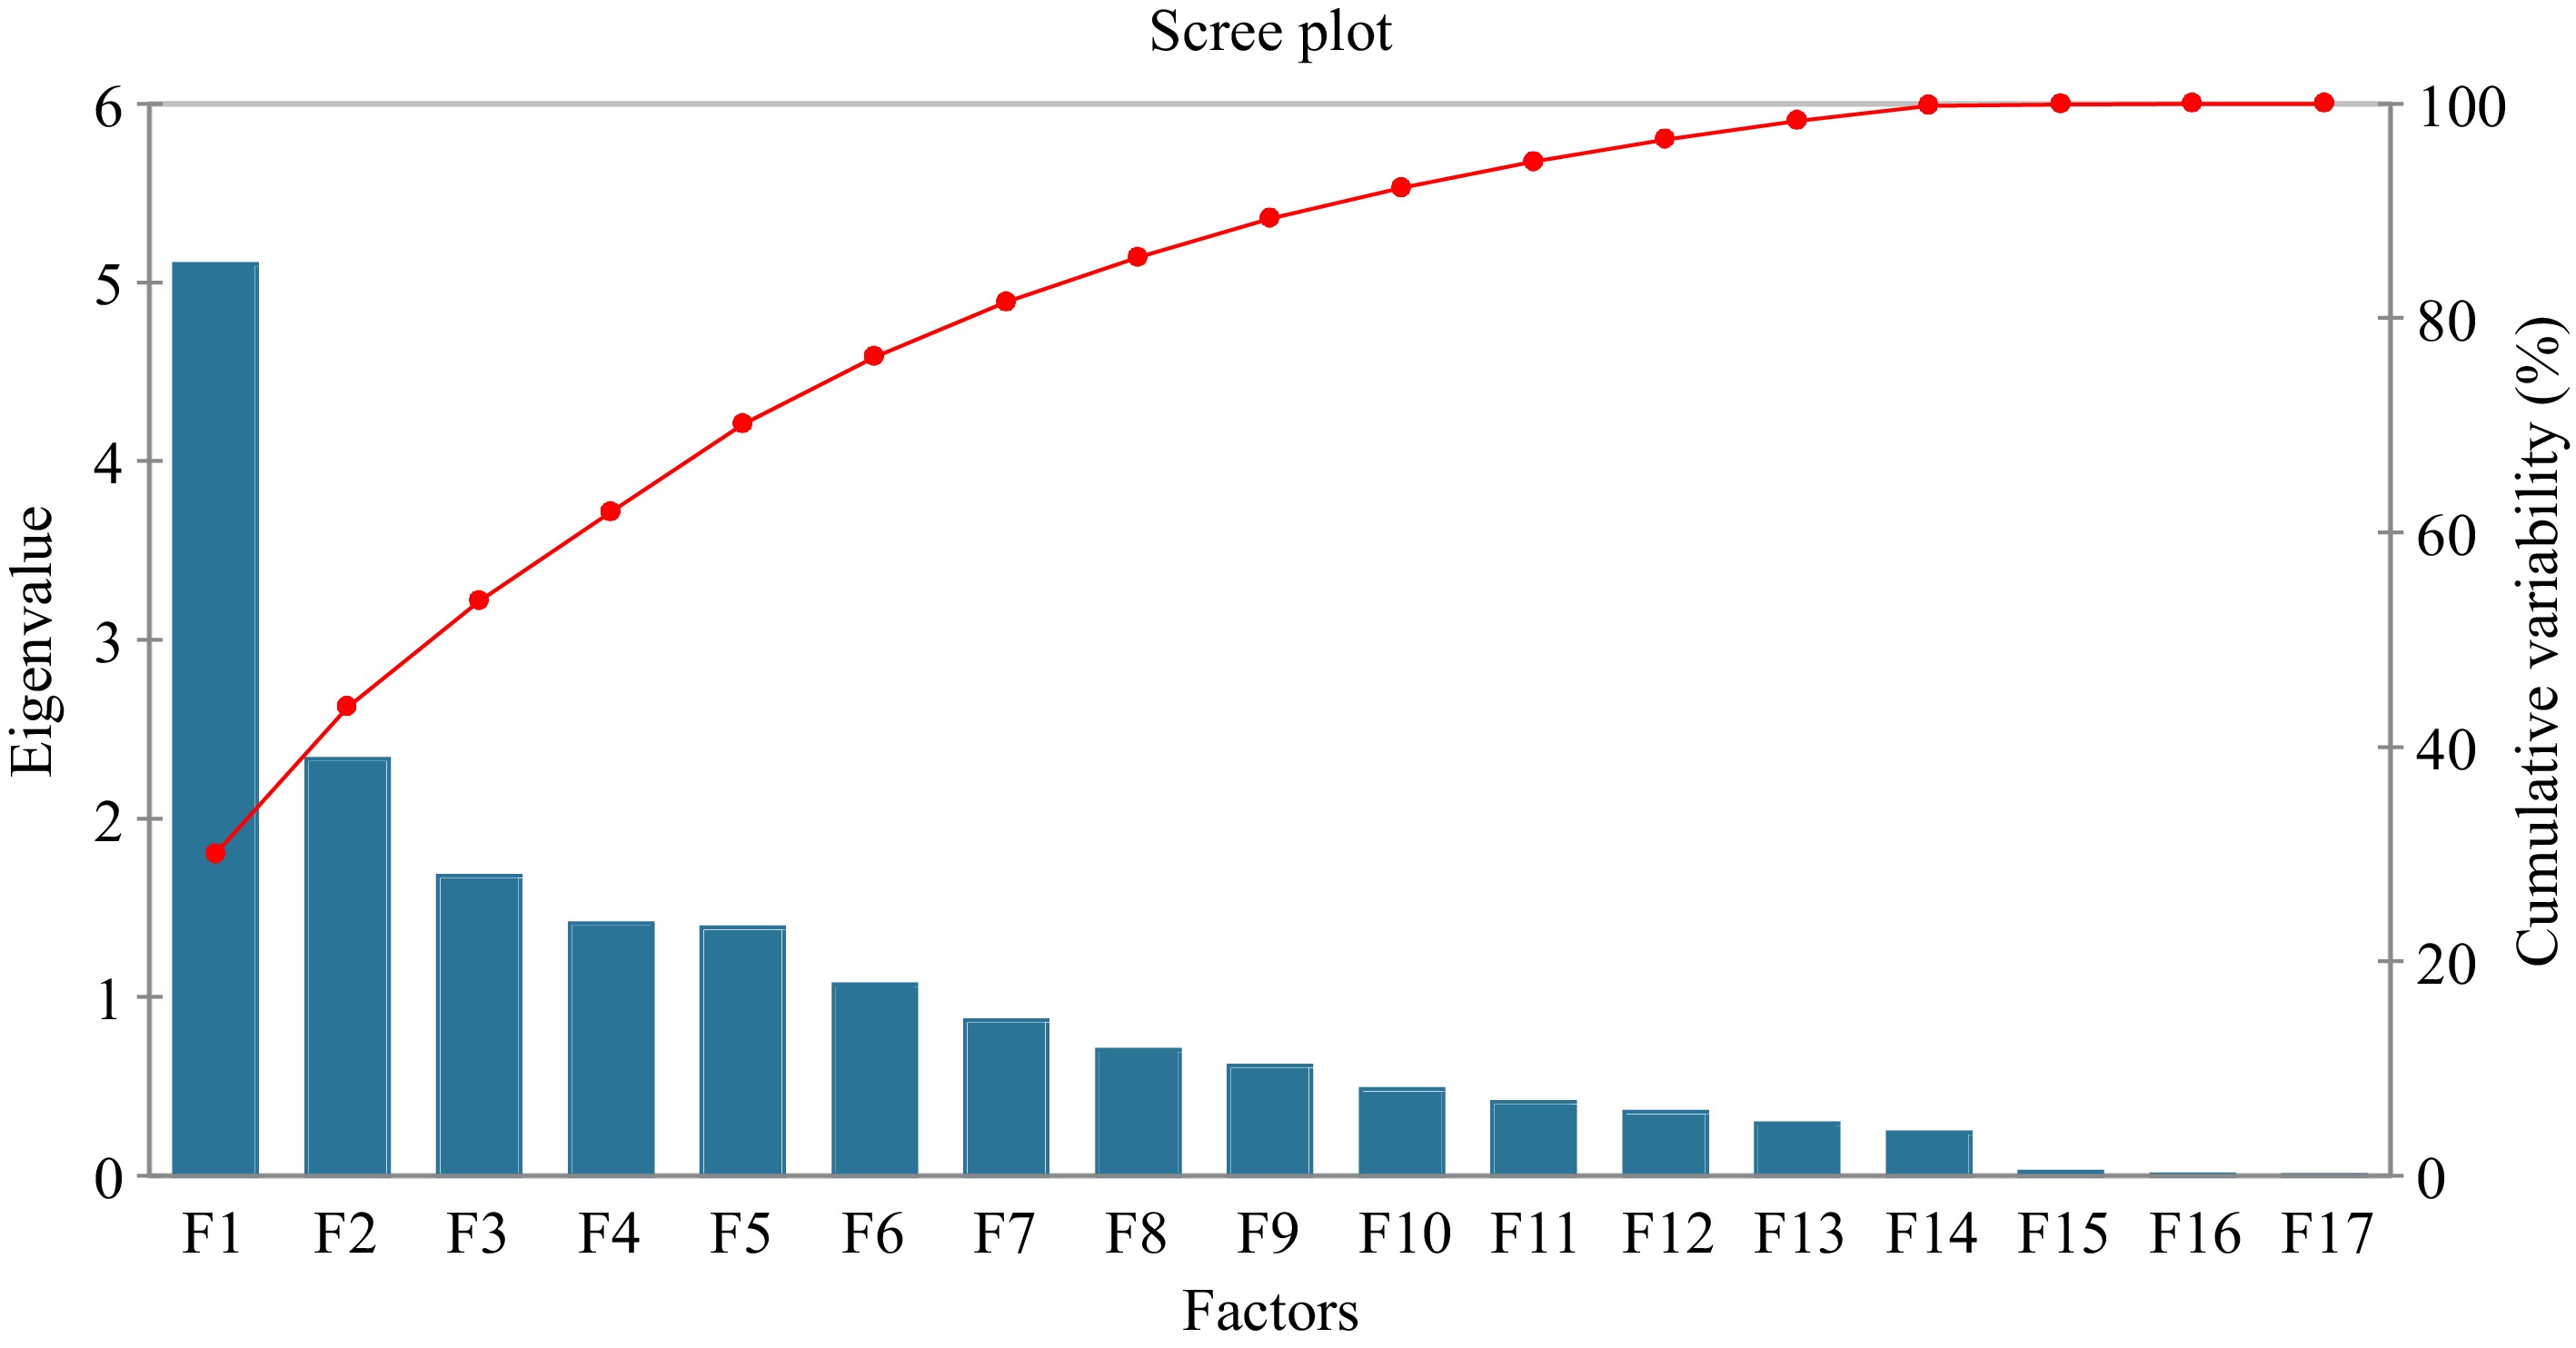
Figure 3.
Eigen values and cumulative variability of the Principal Component Analysis.
Table 2. Summarization of the Principal Component Analysis.
Variables F1 F2 F3 F4 F5 Soil pH (1:2.5) (H2O) 0.209 −0.143 0.520 0.031 0.033 Cu (mg·kg−1) 0.077 −0.002 −0.113 0.332 −0.515 Zn (mg·kg−1) 0.212 0.045 −0.008 0.521 0.045 Mn (mg·kg−1) −0.115 0.034 −0.066 0.406 −0.399 Fe (mg·kg−1) 0.015 0.318 −0.128 0.169 −0.008 TN-Kjeld (%) 0.291 0.104 −0.473 −0.071 −0.136 OC-BlkW (%) 0.284 0.137 −0.493 0.058 0.185 C/N ratio 0.063 0.115 −0.114 0.209 0.654 Ext. P (mg·kg−1) 0.285 0.050 0.304 0.190 −0.025 CEC (cmol(+)Kg−1) 0.406 0.089 0.157 0.021 0.010 Ca2+ (cmol(+)Kg−1) 0.396 0.008 0.171 0.093 0.025 Mg2+( cmol(+)Kg−1) 0.364 0.014 0.069 −0.014 0.006 Na+ (cmol(+)Kg−1) 0.251 0.035 −0.044 −0.431 −0.287 K+ (cmol(+)Kg−1) 0.317 0.058 −0.042 −0.345 −0.074 Total acidity (cmol(+)Kg−1) −0.103 0.606 0.171 −0.047 −0.040 Exch. Al (cmol(+)Kg−1) −0.061 0.335 0.044 −0.139 −0.026 Exch. H (cmol(+)Kg−1) −0.102 0.581 0.174 −0.021 −0.037 
Figure 4.
Principal component plot of soil physicochemical properties (81 samples).
Relationships among different soil parameters with nodulation
-
A correlation analysis (Table 3) performed across nodules number, chemical and physical parameters of the studied soils, showed variation across the parameters ranging from negative non-significant to strong positive correlations. A total of 13 out of 17 physico-chemical parameters were negatively correlated with nodules number. A positive significant (p < 0.05) correlations for nodules number was observed with soil pH (r = 0.14) and a negative significant (p < 0.05) correlations with total N (r = −0.22), OC (r = −0.27) and Mg2+ (r = −0.24). Soil pH had positive significant (p < 0.001) correlation with P (r = 0.48), CEC (r = 0.46), Ca2+ (r = 0.52), Mg2+ (r = 0.39) and p < 0.05 with K+ (r = 0.23). Total N had positive significant (p < 0.001) correlation with OC (r = 0.88), CEC (r = 0.47), Ca2+ (r = 0.43), Mg2+ (r = 0.50), Na+ (r = 0.44) and p < 0.05 with P (r = 0.22) and Zn (r = 0.25). There was positive significant (p < 0.001) correlation between OC and CN ratio (r = 0.37), CEC (r = 0.47), Ca2+ (r = 0.44), Mg2+ (r = 0.47) and K+ (r = 0.41) and at p < 0.01 with Zn (r = 0.33 while at p < 0.05 with P and Na+ both with r = 0.24.
Table 3. The correlation matrix among different soil chemical parameters and nodule number.
Parameters Nodules Soil pH % C/N
ratioMg/kg cmol(+)kg-1 Mg/kg TN-Kjeld OC-BlkW Ext. P CEC Ca2+ Mg2+ Na+ K+ Tot. acidity Al3+ H+ Cu Zn Mn Fe Nodules − Soil pH 0.14* − TN-Kjeld −0.22* −0.056ns − OC-BlkW −0.27* −0.09ns 0.88*** − C/N ratio −0.13ns −0.03ns −0.03ns 0.37*** − Ext. P −0.11ns 0.48*** 0.22* 0.24* 0.07ns − CEC −0.19ns 0.46*** 0.47*** 0.47*** 0.12ns 0.61*** − Ca2+ −0.15ns 0.52*** 0.43*** 0.44*** 0.11ns 0.61*** 0.97*** − Mg2+ −0.24* 0.39*** 0.50*** 0.47*** 0.07ns 0.54*** 0.79*** 0.70*** − Na+ −0.07ns 0.21ns 0.44*** 0.24* −0.12ns 0.16ns 0.47*** 0.42*** 0.38*** − K+ −0.03ns 0.23* 0.45*** 0.41*** 0.07ns 0.34** 0.62*** 0.52*** 0.51*** 0.68ns*** − Tot. acidity −0.07ns −0.17ns −0.11ns −0.10ns 0.05ns −0.03ns −0.04ns −0.16ns −0.15ns −0.05ns −0.08 − Al3+ 0.09ns −0.09ns 0.02ns 0.04ns −0.03ns 0.05ns −0.11ns −0.17ns −0.06ns −0.09ns 0.004 0.46*** − H+ −0.10ns −0.17ns −0.13ns −0.12ns 0.07ns −0.05ns −0.02ns −0.14ns −0.16ns −0.03ns −0.10 0.96*** 0.28* − Cu −0.15ns −0.01ns 0.18ns 0.09ns −0.16ns 0.19ns 0.11ns 0.12ns 0.07ns 0.09ns 0.07 −0.07 −0.09 −0.05 − Zn −0.05ns 0.23* 0.25* 0.33** 0.22ns 0.30** 0.42*** 0.46*** 0.31ns** 0.06ns 0.19 −0.08 −0.09 −0.07 0.17 − Mn 0.15ns −0.19ns −0.07ns −0.15ns −0.15ns −0.11ns −0.22ns −0.20ns −0.17ns −0.13ns −0.27* 0.10 0.06 0.09 0.17 0.14 − Fe −0.19ns −0.13ns 0.11ns 0.15ns 0.06ns −0.001ns 0.06ns 0.04ns 0.00ns −0.023ns 0.001 0.29** 0.004 0.32** 0.14 0.10 −0.08 − Correlation coefficients (r) in individual cells represent each correlation between variables. Values with asterisk (*) are statistically significant different at * < 0.05, ** p < 0.01 and *** p < 0.001. ns-non significant. The charges in initials of nutrient names represents exchangeable Furthermore, extractable P had positive significant (p < 0.001) correlation with CEC and Ca2+ (r = 0.61), Mg2+ (0.54), and at p < 0.01 with K+ (r = 0.34) and Zn (r = 0.30). Cation Exchange Capacity had positive significant (p < 0.001) correlation with Ca2+ (r = 0.97), Mg2+ (r = 0.79), Na+ (r = 97), K+ (r = 0.62) and Zn (r = 0.42). Calcium had positive significant (p < 0.001) correlation with Mg2+ (r = 0.70), Na+ (r = 0.42), K+ (r = 0.52) and Zn (r = 0.46). Magnesium had positive significant (p < 0.001) with Na+ (0.38), K+ (0.51) and at p < 0.01 with Zn (r = 0.31). Other parameters which were significantly (p < 0.001) correlated include Na+ with K+ (r = 0.64), total acidity with Al3+ (r = 0.46) and H+ (r = 0.98). On the other hand, there was significant (p < 0.01) correlation between total acidity and H+ with Fe (r = 0.29) and (r = 0.32), respectively, while K+ significantly (p = 0.05) correlated with Mn (r = −0.27) and Al3+ with H+ (r = 0.28).
Nodulation as influenced by different chemical parameters of the soils
-
Two hundred and forty-three plants were sampled from 81 farmers' fields and the number of nodules were counted per plant by treating one plant as a replicate. The distribution of the number of nodules was evaluated basing on the different physico-chemical characteristics of soils in study areas. Soil pH, total N, OC, extractable P, exchangeable Ca2+ and Mg2+ were observed to influence the formation of nodules in different areas (Fig. 5). In the case of soil pH, the higher average number of nodules (8.82) was observed in neutral pH soils which was closely followed by (8.67) in slightly acidic soils while the lowest (3.3) was in very strongly acidic soils. Nodules number were observed to be higher (10.86) in the soils with very low total N, closely followed by (6.98) in the soils with low total N while the lowest 6.19 was in soils with medium N levels. The soils with higher OC had the highest average nodules number (15.55) closely followed by (8.79) in soils with very high OC whilst the lowest (2.95) was in soils with very low OC.
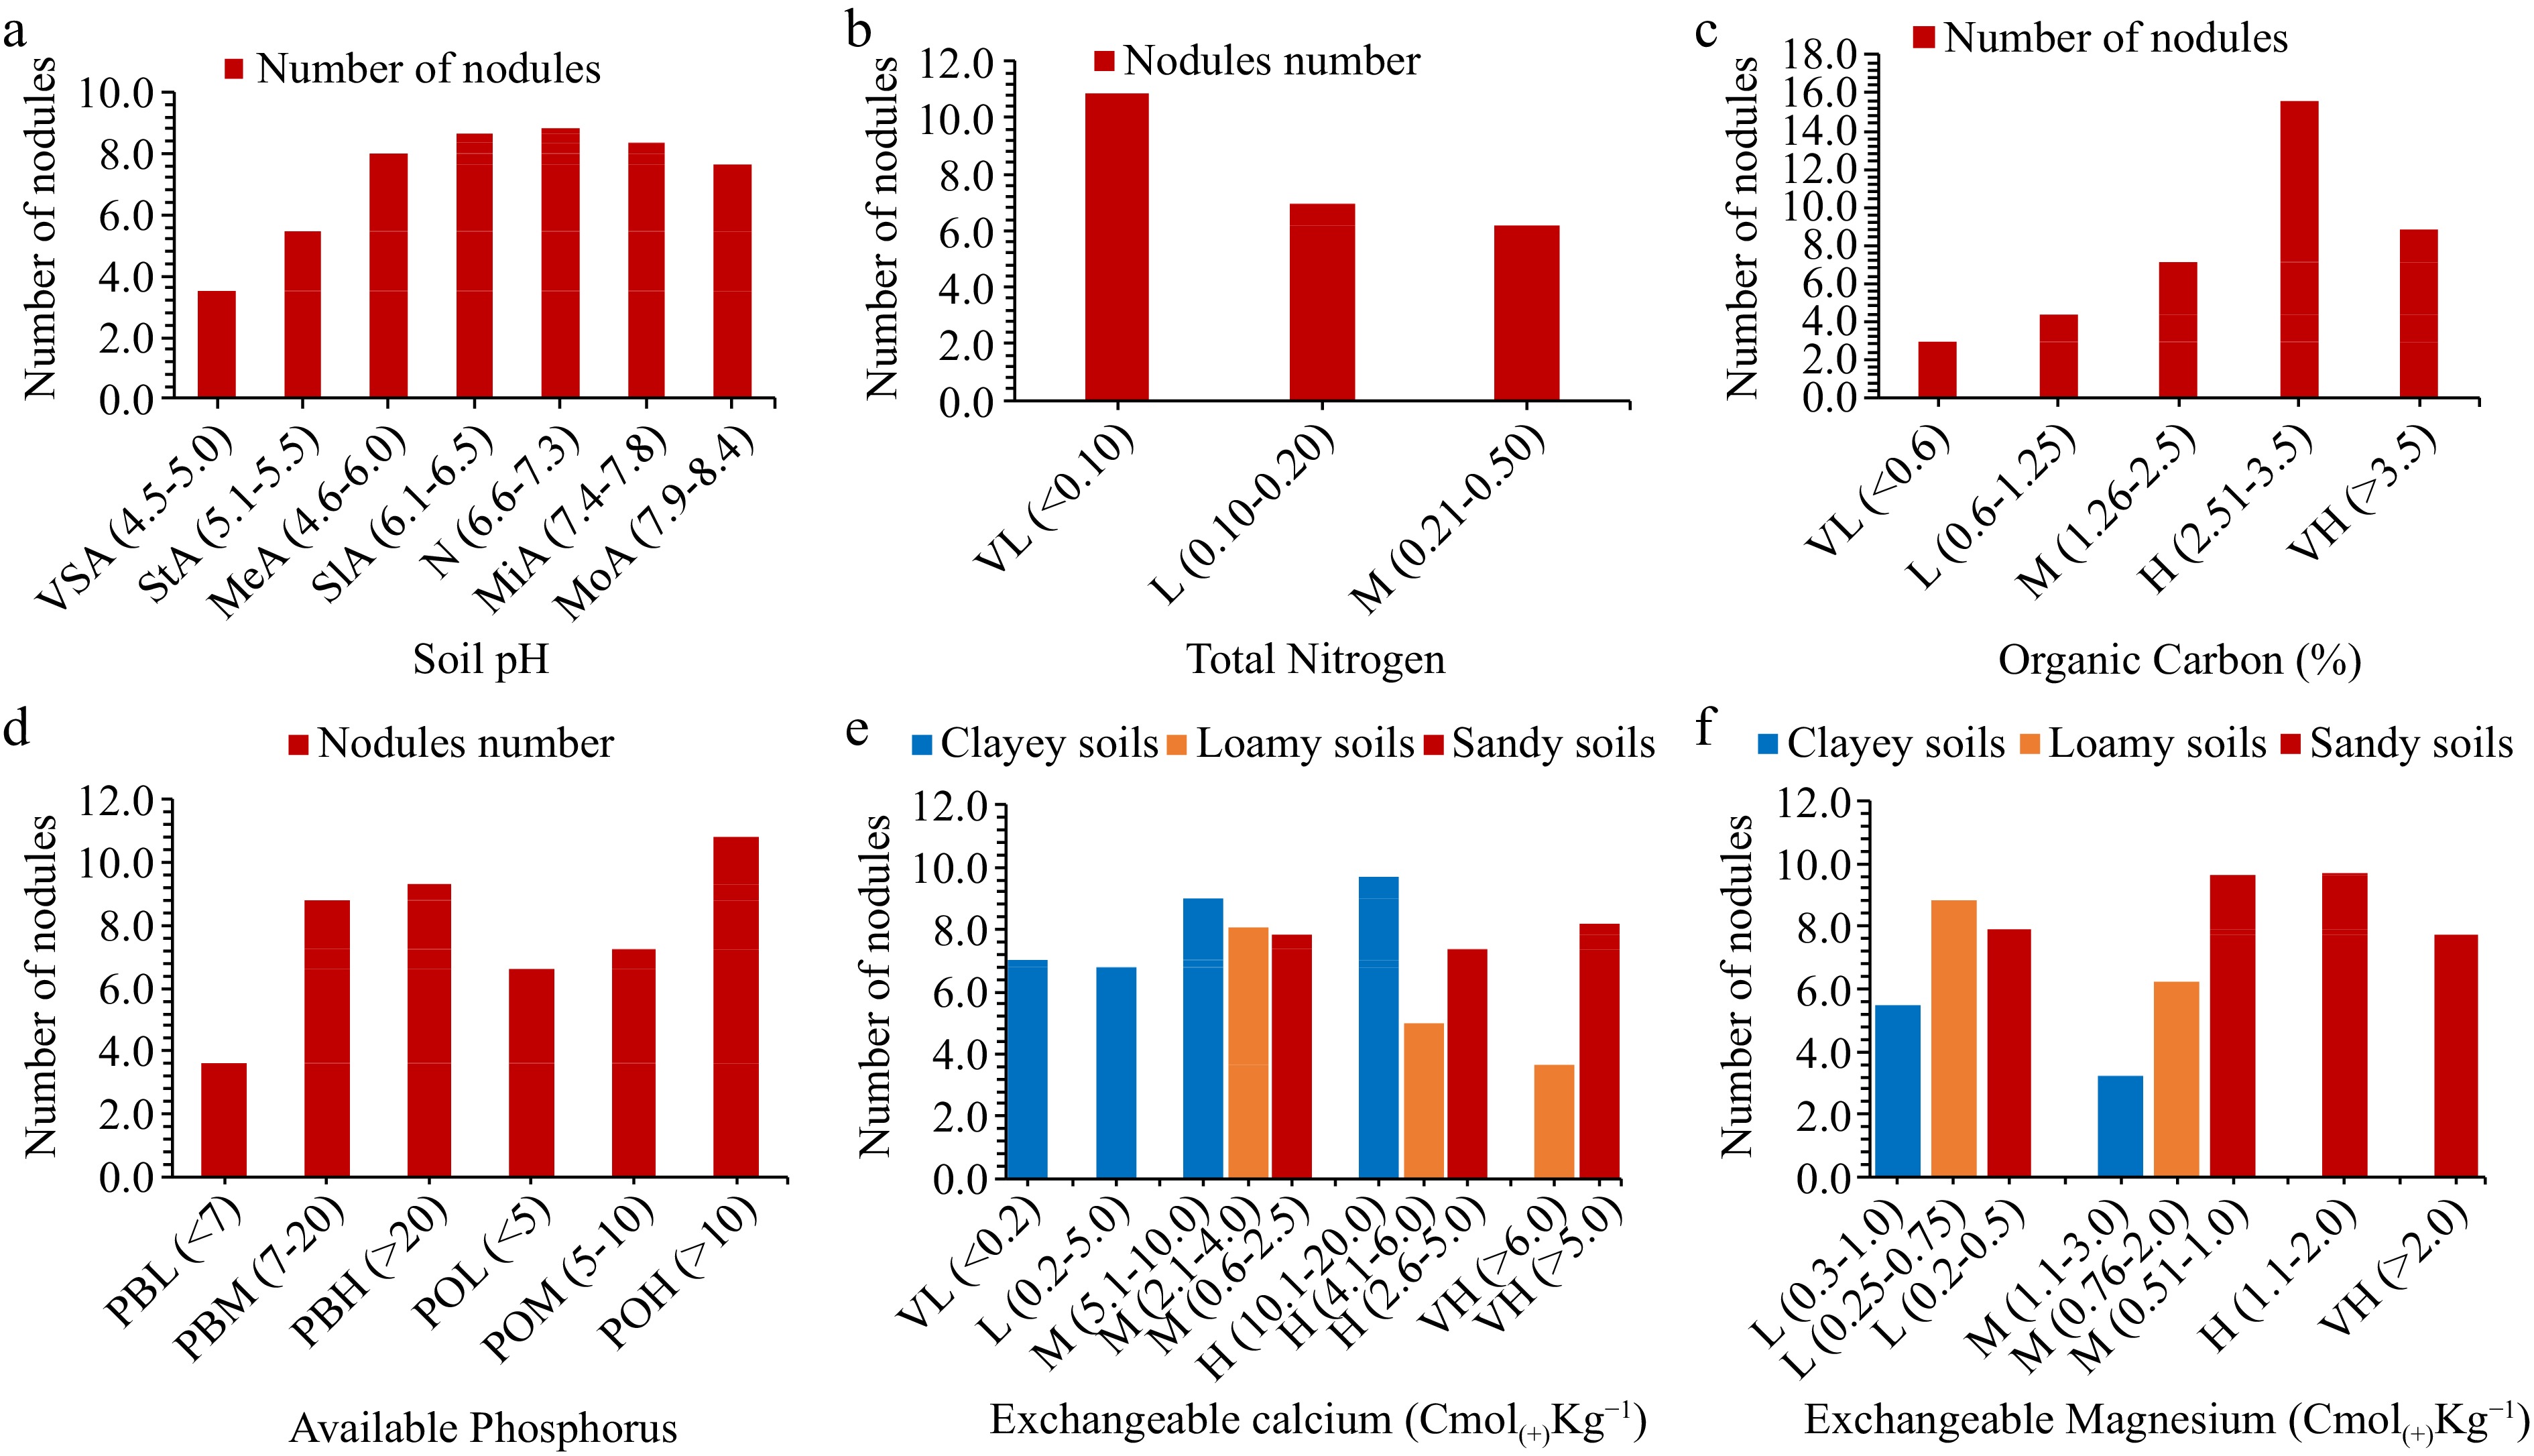
Figure 5.
The influence of total nitrogen, organic carbon and extractable phosphorus on nodulation (VL = very low, L = low, M = medium, H = high and VH = very high), soil pH ratings as per Msanya[36] (VSA = very strongly acidic, StA = strongly acidic, MeA = medium acidic, SlA = slightly acidic, N = neutral, MiA = mildly alkaline and MoA = moderate alkaline.
The highest average nodules number (10.81) was observed in soils with higher P (> 10, by Olsen method of determination) and (9.3) (extractable p > 10, by Bray method) while the lowest (3.62) was in soils with low extractable P (p < 7, by Bray method). For the case of exchangeable Ca, the highest number of nodules (9.7) was observed in clayey soils with high Ca levels, followed by sandy soils with very high Ca levels (8.10) and loamy soils with medium Ca levels (8.1) whereas the lowest number (3.66) was in loamy soils with very high Ca levels. Highest exchangeable Mg levels in sandy soils favored nodules formation by exhibiting the highest (9.7) nodules number, followed by low Mg loamy soils (8.8) and low Mg clayey soils (5.5) while, the lowest (3.2) was in medium Mg clayey soil.
Nodulation as influenced by exchangeable potassium, soil texture and micronutrients
-
Exchangeable potassium, soil texture and micronutrients (Cu, Zn, Mn, and Fe) were observed to influence nodule formation (Fig. 6). In this study, sandy soils with high levels of K were observed to possess the highest number of nodules (11.17), followed by clayey soils with medium levels of K (10.00) and clayey soils with low levels of K while loamy soils with very low levels of K had the lowest (6.2) number of nodules. Furthermore, the highest number of nodules (9.50) was observed in sandy soil closely followed by sandy loam soil (9.36) while the lowest (4.51) was in clay loamy soil. The soils with low levels of Cu had the highest nodules (11.4) which was closely followed by (9.0) in medium and (8.8) in high Cu levels whilst the lowest (5.6) was in soils with very low levels of Cu. For the case of Zn, the soils with very high levels had the highest (11.1) number of nodules, this was followed by (7.5) and (7.2) in medium and high Cu levels, respectively. Conversely, the soils with very low levels of Zn had the lowest (1.3) number of nodules. The soils with very high levels of Mn had the highest (7.8) number of nodules while those with medium levels had the lowest (5.3) nodules. For the case of Fe, the soils with very high levels possessed the highest (12.0) nodules while those with high Fe levels had the lowest (7) nodules. However, for the case of Mn and Fe, it is difficult to exactly determine the influence of the nutrients basing on the distribution of nodules as the soils were categorized only in two groups.

Figure 6.
The influence of exchangeable potassium, soil texture and micronutrients on nodulation (VL = very low, L = low, M = medium, H = high and VH = very high), soil texture (C = clay, CL = clay loam, LS = loamy sand, S = sandy, SC = sandy clay, SCL = sandy clay loam and SL = sandy loam).
-
Soils in the study area can be characterized as extremely to strongly acidic (13%), medium acidic to neutral (85%) and mildly to moderately alkaline (2%) (Table 1; Supplemental Table S1). This implies that, the fields with extremely to strongly acidic and alkaline soils are most likely to be associated with the deficiencies of phosphorus. The deficiency of phosphorus in acidic soils is caused by its fixation on the oxides and hydroxides of iron and aluminium while in alkaline soils it is fixed on the oxides and hydroxide of calcium and magnesium, hence, unavailable for uptake by plants[37]. Nevertheless, the two fields (Supplemental Table S1), one at the Ikovano site and the other at the Igomaa site were characterized as alkaline soils (pH > 7.5) yet, they are observed to have medium P levels which may be associated with addition of P fertilizers by farmers through organic manure. The 69 (85%) soils of the total surveyed fields with pH ranging from > 5.5 to 7.5 are within the favorable pH range for most crops[38]. Furthermore, the soil pH is observed to influence some chemical parameters[39] such as low CEC in soils with pH < 5.5 may be attributed to less basic cations in the exchange sites. Although, in some soils the total exchangeable acidity was higher, especially for those with detectable Al3+, but, their individual levels of Al3+ are below the critical concentration of 1 cmol(+)kg−1[38]. Despite the inhibition of nutrients availability and limitations to plant growth, which results in low productivity, extreme soil pH, has an influence on the activity and diversity of rhizobia[40]. This calls for the need to isolate rhizobia which are tolerant to extremely acidic and alkaline soils, as a starting point for site specific biofertilizer formulations. Furthermore, rhizobia which are capable of fixing N together with solubilization of nutrients such as P, K, and Zn have the added advantages as biofertilizers in particular soil pH conditions[41]. For successful improvement in the productivity of soybean along with the use of rhizobia biofertilizers, it is important to consider the suitability or amendment of soil pH.
The findings of this study revealed that, soils in most of the surveyed fields (81%) had low CEC (Supplemental Table S1). Such low CEC values are typical of weathered soils with limited capacity to supply essential plant nutrients[42]. For instance, under excessive rainfall or irrigation, such strongly weathered soils are prone to leaching of nutrients like Ca, K+, and Mg2+ leading to inefficient and more costly fertilization program[39,42]. The low CEC in acidic soils, is an indication of less exchange sites for exchangeable bases such as K+, Ca2+ and Mg2+ in colloidal surfaces, suggesting the need for some management practices such as addition of more organic matter to buffer the pH of soil, increase nutrients retention and exchange of nutrients[42] to improve rhizobia activities and hence improved productivity of soybean.
Different soils have different capacities of holding the basic cations, based on the exchange sites in colloidal surfaces (Supplemental Table S1). This is categorized based on the texture of soils which are clay rich in 2:1 clay minerals, loamy and sandy soils. In this study, the soil textures with regards to Ca, fell into three categories which are clayey, loamy and sandy. The findings of this study demonstrated that only 7% of the sites had low levels of exchangeable Ca, suggesting the deficiency of this nutrient. On the other hand, soils with high Ca signifies the dominance of cation in the exchange sites. Under highly weathered conditions, soils with high Ca levels tends to have low organic carbon and nitrogen, with limited availability of P, Fe, B and Zn, as well as imbalance of K and Mg[36,38,43]. To correct K and Mg imbalance as well as P, Fe, B and Zn, it needs addition of organic matter through compost or farmyard manure and addition of liming in Ca deficient soils, to buffer pH and increase the availability of essential plant nutrients as suggested in earlier studies[43]. The solubilization of limited P and Zn as well as Fe chelation by rhizobia is an added advantage to Ca deficient acidic soils[44].
Despite the importance in plant growth and development, Mg plays a key role in defense mechanisms in abiotic stress situations[45]. Low Mg concentrations in soils of most of the fields, in all textural classes, may be attributed to leaching losses due to its high mobility, which is linked to low affinity on the soil colloidal surfaces. Conversely, higher levels of Mg in some of the fields, may be attributed to natural soil fertility variations in the study site[45,46]. The amendment of high Mg levels in the soils needs an integrated approach such as, application of chemicals including CaCl2 and Ca(H2PO4) 2H2O. Furthermore, addition of OM is important for stabilizing the soil pH as it is hampered high Mg levels[45]. Correction of Mg levels for balanced soil nutrients and availability, is essential for improving crop productivity as well as, the use of rhizobia biofertilizers in legume production, including soybean.
Potassium is among the major essential nutrients for plant growth and development as well as rhizobia activities. The observed small amounts of K below the critical recommendations, suggests inadequacy for meeting crop nutrition requirements. Potassium in soil is lost through various ways such as, nutrient export by crop harvesting and leaching especially in acidic sandy, water logged or saline soils[38,47,48]. Optimum levels of K and other essential plant nutrients as well as, suitable soil pH is necessary for the better performance of biofertilizers as the nutrient is involved in regulation of water in plants, enhancement of root growth and thus, high chances of nodulation[49]. Nevertheless, K natural fertility may be high in the soil, but not necessarily available soil solution due to their slow release from the secondary minerals such as mica. Therefore, K solubilizing bacteria[50] including N2-fixing rhizobia has added advantages in effective utilization of the nutrient by crops. Furthermore, low levels of potassium in the soil, can be increased by co-addition of organic matter and biochar[51].
Conversant to varying potassium levels, the concentration of exchangeable Na in all soils except for the NM-AIST site was very low. Very low to low levels of Na are desirable for plant growth as this indicates low exchangeable Na percent, non-sodic soils and hence low electrical conductivity with no yield reduction impact[27,36,52], the desirability of soils in production of soybean. Sodium is less required in the soil for the growth of plants as well as rhizobia activities and its roles can be replaced by potassium which is mostly required for plant growth and development and, formation of symbiotic nodules[19,52].
In this study, 63% of the soils had Ca/Mg in the desired range of between 2 and 4, indicating the balance of these nutrients for suitability in the growth and development of the wide range of crops. On the other hand, only 23 % had favorable Mg/K, which ranged between 1 and 4. The shift of this ratio indicates that one cation is in excess and has to be amended to increase the availability of inhibited counterparts[36,46]. Therefore, very high levels of soil K in this case, may be attributed to the large quantities of mica minerals that can lead to imbalance of other nutrients including Mg, N, P, Zn and B[53].
Most of the investigated soil samples, had sufficient amounts of P, regardless of the methods used in the analysis (Supplemental Table S1). On the other hand, low P levels which are observed in some of the soils in this study, indicates the deficiency of the nutrient to support plant growth and development, as well as, rhizobial activities[54,55]. Phosphorus is a dynamic nutrient in soil which is highly affected by soil pH. In acidic soils, P is fixed in the oxides or hydroxides of aluminium/iron, while in alkaline soils the nutrient is fixed in the oxides and hydroxides of calcium/magnesium hence, becomes unavailable for plant uptake. Its deficiency leads to 30%−40% yield reduction, necessitating excessive application of P fertilizers to meet crop requirements. However, only 15%−20% is available for plant uptake[56] while the rest ends up contaminating surface and underground water[57]. Nevertheless, P solubilizing rhizobia have added advantages in the soils with extreme pH for effective utilization of the fixed P by plants[58].
Organic carbon, total nitrogen, CN ratio, micronutrients and soil texture
-
Organic carbon is a very important component of soil fertility as it is involved in the supply and balance of many nutrients as well as improvement of soil structure which allows the exchange of nutrients and water retention[59]. The low and very low OC (Table 1; Supplemental Table S2) in some soils for this study is attributed to less organic matter (OM) whereby the particular soils are in the risk of unbalanced exchange of many nutrients including exchangeable bases. The 58% of the studied soils which had high to very high levels of OC have the advantages of good nutrients exchange, improved water retention and enough substrate for symbiotic rhizobia[51,60]. Moreover, the observed good quality (8−13) of CN ratio for most of the soils in this study, is an indication of their desirability for soybean productivity along the use of rhizobia biofertilizers.
Micronutrients play different essential roles for the growth and development of plants as well as SNF[61]. The availability of micronutrients in different soils, apart from application of fertilizers and pesticides is influenced by parent rock materials, soil type, pH, quality and quantity of OM, redox potentials, soluble salts, macro and micro nutrients interactions and vegetation. The observed higher levels of micronutrients (Supplemental Table S2) in this study indicates their sufficiency for crop requirements while the lower levels suggests the need for their supplementation from various sources[62]. However, these nutrients are required in very small quantities, hence excess levels result in their toxicities in soils to plants. Nevertheless, rhizobia require more micronutrients in SNF than their host plants.
In this study, different textural classes which included clay, clay loam, sandy clay loam, sandy loam, sandy clay and loamy sand were determined. These results are in agreement with the previously explained textural characteristics of the soils in tropics. Soil texture is also a determinant of other factors such as nutrients availability, soil pH, organic matter and CEC as well as aeration and water movements[63−66]. In this study, soil OC and CEC were among the factors that were clearly influenced by soil texture. The observed decreasing trend of CEC with decrease in clay content may be attributed to the less exchange sites in colloidal particles[67]. Furthermore, soil texture has an influence in SNF especially on nodulation whereby medium textured soils are observed to favor more nodulation followed by light textured and then heavy textured soils. Medium texture soils such as sandy clay loam allows the penetration of roots than heavy textured clay soils while light textured soils are linked to low availability of nutrients and soil acidity which inhibits the growth of roots[68].
Soil quality index using principle component analysis
-
The results of PCA are summarized in Table 2, Supplemental Table S3 and S4. The contribution of variables to each principal component provides insights into which variables play the most significant role in forming the patterns captured by each component. Higher contribution percentages indicate that a variable strongly influences a particular principal component's variation[33,35,69]. The results show that the first PC explain CEC (16.464%), Ca2+ (15.675%), Mg2+ (13.241%). These variables representing overall soil nutrient contents and cation exchange capacity. The second principal component show highest contribution to H+ (33.748%), Al3+ (11.243%), Cu (0.594%) that representing soil acidity-related factors and likely indicating a relationship with soil acidity. The third component has highest contribution to TN-Kjeldahl (22.340%), OC-BlkW (24.302%), P (9.242%) representing nutrient availability and organic content[69]. The forth component has highest contribution: Cu (11.045%), Fe (10.112%), Mn (16.483%) indicating a relationship with heavy metals and nutrient concentrations and the last component has highest contribution to C/N ratio (42.735%), Na+ (18.574%), K+ (11.907%) indicating distinctions in these variables[34,69].
The factor scores represent the projected values of that observation onto each principal component. These scores highlight which aspects of soil properties are prominent for each location with respect to the identified principal components how much an observation contributes to each component. Results indicated that Songwe-Mbozi_Mbimba show strong negative score for F1 and F3 suggesting lower values related to CEC, Ca2+, Mg2+, nutrient availability, and organic content. The positive score for F2 suggests higher values associated with H+, Al3+, and Fe and negative score for F4 and F5 Suggests lower values for Cu, Mn, K+, and compositional differences[33,69] Mbeya-Chunya_Kibaoni has positive scores for F1, F2, and F5: indicates higher values for CEC, H+, Al3+, Fe, and K+ and negative score for F3: suggests lower values for TN-Kjeld, P, and OC-BlkW while positive score for F4 indicates higher values for Cu, Mn, and Fe. Njombe-Wanging'ombe_Mngate has egative score for F1, F2, and F4: suggests lower values for CEC, H+, Al3+, Fe, Cu, and Mn and positive score for F5 indicates higher values for K+ while near-zero score for F3 suggests average values for TN-Kjeldahl, P, and OC-BlkW[69].
Relationships between nodulation and different physico-chemical parameters of the soil
-
Pearson's correlations among different soil characteristics and the number of nodules showed a clear pattern of influence over each other, suggesting the influence of different factors over each other as well as in formation of nodules[39,45,46,53,70]. There was notable positive significant correlation between soil pH and the number of nodules indicating the influence of pH on nodulation[40]. On the other hand, the negative correlation of nodules number with OC and total N is an indication that, of low substrate (carbon source) SNF, influenced by the sites with low OC while that with total N signifies the shift of plants in utilizing mineral N which is influenced by the sites with sufficient N level[70]. Interestingly, there was positive significant correlation between the soil pH and the basic cations except for Na+, indicating less cation leaching in particular soils[56,70−73]. The observed positive and significant correlation of nitrogen and OC with extractable P and all basic cations indicates that, N enhances the uptake of the particular nutrients by plants and OM helps in retention and balance of nutrients[10,56,70−74].
The positive significant correlation between extractable P with CEC and basic cations except Na+ may be linked to availability of OM for cations retention and less P fixation due to stable soil pH[61,70,74]. The strong positive and significant (p < 0.001) correlation between CEC and basic cations, Ca2+, Mg2+ and K+ indicates that these cations are available in soil solution due to their abundance on soil colloidal surfaces, which also contributes to soil CEC optimization. The observed positive correlation between total acidity with Al3+, H+ and Fe, clearly suggest their substantial contribution in the acidity of soils[19,56,61,63,64,74]. The positive significant correlations were noted between Zn with soil pH, total N, OC, P, CEC, Ca and Mg, suggesting the availability of particular nutrients without being inhibited by the availability of Zn and this may further be attributed to availability of OM in most the studied soils[19,43,61,63,64,70].
The positive correlation between the Fe and H+ may be attributed to the fixation of Fe by 3-layer silicate clays and OM whereby Fe3+ is fixed in the hydroxides of exchangeable H. The fixation results to formation of Fe(OH)3 as explained by higher CEC and pH at the slow and extended release of hydrogen in soil[19,61,63,64]. However, the cause of the significant negative correlation between K+ and Zn in this study is not clear. The observed significant relationships among different soils though their characterization indicates their suitability for the use of rhizobia inoculants.
The effect of different physical and chemical parameters of soil in soybean nodulation
-
With regards to soil pH, the highest number of nodules (8.82) was observed in the soils with neutral pH. With the exception of extremely acidic soils, there was a distinct pattern showing an increase in nodules from very strongly acidic to neutral and a steady decrease in nodules from mildly alkaline to moderately alkaline soils. This is the clear indication that soil pH affects rhizobia population and nodules development[40,75]. The lower number of nodules in extremely and very strong acidic soils, suggest that the limited rhizobia population, recolonization and the chances of nodulation in particular soils. These results conform with other previous studies which demonstrated the effects of soil acidity in endangering the survival of microorganisms and injury of plant roots as well as impairing the nutrients availability to plants[19,75].
Interestingly, the nodulation was higher in the areas with low levels of nitrogen with decline towards the medium levels of nitrogen as a sign of the shifting from mineral N utilization to N2-fixation[70,75]. Conversely, the higher levels of N in the soil, especially from synthetic fertilizers affects the SNF as the plants uses lesser energy to utilize mineral N than fixing N, hence, shifting from symbiotic to inorganic N utilization. The shifting from N2-fixation to inorganic N utilization in the soils with higher levels of N, is attributed to reduced nitrogenase activity and infection threads, hence, limited N2 fixation. In the case of OC, the highest number of nodules were observed in the soils with high levels of percentage OC followed by very high and then medium levels. This signifies that rhizobia are carbon limited in nature. Furthermore, for better activity, rhizobia prefer the organic carbon which is naturally available in soil or through rhizodeposition[60,70,75]. Nevertheless, application of biofertilizer which is supplement with organic sources such as compost and farmyard manure are observed to yield many healthy nodules with higher dry weight and effective in fixing nitrogen.
Phosphorus plays a vital role of energy acquisition and storage in plants as well as utilization for the SNF process[54,76]. Adequate levels of extractable P in the soils, contributes in increasing the number, size and weight of nodules as compared with those with low levels of extractable P[55,76]. Therefore, higher levels of extractable P are crucial for effectiveness of rhizobia in fixing nitrogen. Similarly, in this study, higher number of nodules were observed in the soils with higher levels of extractable P. Also, increase in the number of nodules followed the increasing trend of extractable P, suggesting the essential influence of P in nodule development[37,55,76].
Nevertheless, exchangeable calcium plays several essential roles including an increase in rhizobia abundance, enhancement of rhizobia attachment to root hairs, infection of host plant roots and formation of nodules[37,77] Regardless of Ca variations basing on the clayey, loamy and sandy dominance, higher numbers of nodules were observed in medium, high and very high levels of calcium, respectively. This is a clear indication that, Ca is essential in the infection of plant roots leading to formation of nodules. Furthermore, higher numbers of nodules in Ca rich soils is linked to its involvement in plant-bacteria signaling and recognition of nod factors from rhizobia which increases the activity of Nod genes[19,77].
Despite the fact that the highest number of nodules were found in soils with low levels of Mg than in medium levels, the nodule formation in clayey and loamy soils did not exhibit a clear pattern. Nevertheless, in sandy soils, the pattern is evident as the highest number of nodules were found in soils with medium and higher Mg levels, indicating that the sufficient levels of Mg triggered the development of nodules[19,78]. Furthermore, it was stated earlier that, Mg is essential in the metabolism of rhizobia by facilitating the alteration of carbohydrate partitioning and transport into nodules[46, 78]. Therefore, it is important to explore more, on the direct and clear roles of Mg in the infection of host plant by rhizobia and formation of nodules.
Potassium is among the important essential nutrients in symbiotic nitrogen fixation and symbiotic rhizobia are observed to be more sensitive to lower levels of potassium than in higher levels, as compared with their host plants. This calls for special considerations in the levels of potassium in soils for effective symbiosis[19,52,78]. The observed higher levels of potassium in sandy soils, with the highest number of nodules (11.17), suggests availability of the nutrient in the favor of the light textured (sandy) soils to allow effective root penetration and nodulation. However, medium textured (loamy) soils, were observed to possess lowest (6.2) average number of nodules, which may be attributed to the lower levels of potassium[49,52,75,78].
Soil texture has substantial influence in the formation of nodules. Heavy textured soils are well known for having many exchange sites due to their large surface area for holding many cations and other nutrients. However, the textural class is observed to have limitations in the formation of nodules due to poor aeration and hindrance of plant root penetration[68,76,79]. Likewise, in this study, light textured (sandy) soils, possessed the highest (9.50) number of nodules which is closely followed (9.36) in medium textured (sandy loam) soils and lastly, clay loam soil which possessed the lowest (4.51) nodules.
Micronutrients play different roles in SNF, and rhizobia needs more micronutrients in their activities than their host plants[61,63,79]. Zinc is an important micronutrient, for the expression of superoxide dismutase required by plants and rhizobia during the development of nodules. Copper is required in promotion of N2-fixation per nodule as well as raising the levels of N in plant tissues[61,64,79]. The results of this study for Zn showed the clear trend that, the number of nodules were higher in soils with the higher levels of zinc. Although, the levels of Cu were low to very low in the soils, even the slight increase in the level of Cu was associated with increased nodule numbers similar to report by Kafeel et al.[79] and Rubio et al.[64]. Manganese is required in the initial colonization of root, formation of nodule and N2-fixation while Fe is the component of nitrogenase enzyme and co-factor for proteins such as cytochrome and leghemoglobin which are inside the nodules and bacteroides, crucial for N2-fixation. The observed higher number of nodules in Mn and Fe rich soils, signifies the influence of the particular nutrients in the development of nodules[19,61,79]. Therefore, it is crucial to observe the availability and sufficient levels of micronutrients for successful BNF process.
-
Basing on the results of this study, the positive significant correlation between the number of nodules and soil pH is an evidence that, the particular soil parameter had the greater influence in the development of nodules. The positive significant correlations among different chemical parameters is an evidence that, there are common influencing factors across the studied soils. Soil pH was observed as the best indicator which favors the development of nodules with up to 8.82 in neutral pH soils, however, the number may be smaller than those obtained in inoculated seeds. More interestingly, the number of nodules were observed to be influenced by different individual physical and chemical parameters as evidenced by the distribution of nodules number following their different concentrations in the soils. The results of this study suggests the suitability of the soils for production of soybean and the use of rhizobia inoculants. However, the site specific inoculants will have added advantages for the very strongly acidic soils which had much fewer nodules.
-
The authors confirm contribution to the paper as follows: conceptualization and methodology: Nakei MD, Ndakidemi PA, and Venkataramana PB; original draft preparation: Nakei MD; review and editing: Ndakidemi PA and Venkataramana PB. All authors have read and agreed to the published version of the manuscript.
-
All data generated or analyzed during this study are included in this published article and its supplementary information files.
-
The authors thank all staff and technical experts from Nelson Mandela African Institution of Science and Technology (NMAIST), Arusha-Tanzania for their guidance and support during sampling, laboratory and screen house experiments.
-
The authors declare that they have no conflict of interest.
- Supplemental Table S1 Soil chemical parameters and nodules number of the study sites.
- Supplemental Table S2 chemical and physical parameters of the soils from study sites.
- Supplemental Table S3 Summarization of Eigen values in the Principal Component Analysis.
- Supplemental Table S4 Factor scores loading/eigen vector.
- S4
- Copyright: © 2023 by the author(s). Published by Maximum Academic Press, Fayetteville, GA. This article is an open access article distributed under Creative Commons Attribution License (CC BY 4.0), visit https://creativecommons.org/licenses/by/4.0/.
-
About this article
Cite this article
Nakei MD, Venkataramana PB, Ndakidemi PA. 2023. Assessment of the soil suitability for soybean growth and the prospect biofertilizers use in selected areas of Tanzania. Technology in Agronomy 3:11 doi: 10.48130/TIA-2023-0011 

Assessment of the soil suitability for soybean growth and the prospect biofertilizers use in selected areas of Tanzania
- Received: 26 June 2023
- Accepted: 13 September 2023
- Published online: 19 October 2023
Abstract: The rapidly increasing global human population threatens the availability of safe and nutritious food. Among others, soil fertility degradation, insufficient use of proper fertilizers and scanty soil characterizations have major contributions in lowering the productivity of crops. To ensure the use of sufficient proper fertilizers for optimum crop productivity, it is important to evaluate the fertility status of soil which is a vital tool in deciding the type and the amount of fertilizer to be supplemented. This study aimed at evaluating soil fertility in the soybean growing and the non growing areas of Tanzania and to assess their suitability for growing the soybean crop as well as prospective use of rhizobia biofertilizers through the assessment of nodule formation in non-inoculated soybean plants grown in different farmers' fields. A total of 81 soil samples including those in soybean growing and non growing areas of Tanzania, were evaluated in terms of their fertility status through different physico-chemical parameters. From each field, three healthy plants with intense green leaves were selected for nodule counting. The study indicated that, most of the soils (85%) have medium acidic to neutral soil pH with 58% having sufficient organic carbon and 78% at risk of nitrogen deficiency. Soil pH, total N and OC had significant (p < 0.05) correlations (r) of 0.14, −0.22 and −0.27 with nodule number. The higher number of nodules were in medium acidic to neutral soils, with the highest number, 8.82 in neutral pH soils, indicating the favorability of the particular pH ranges for rhizobia activities. The results of this study suggest that most of the soils are suitable for the production of soybean and the use of rhizobia inoculants.
-
Key words:
- Nodules /
- Rhizobia inoculants /
- Soil fertility /
- Symbiotic nitrogen fixation