


-
The tree and understory crops grown at high density in agroforestry compete for light, water, nutrients, and space. Low interception of light is a major reason for the low productivity of banana in shaded perennial cropping systems[1]. Light interception in the canopy of an adult areca nut (Areca catechu) garden was 48%[2]. Intercrops under the coconut (Cocos nucifera L.) based cropping systems received only 25%–33% of radiation[3]. Areca nut a chewing /masticatory crop is grown on 1.03 million hectares[4]. Areca nut plantations offer scope for intercropping[5] in the alley spaces. Banana is a choice component crop in several agroforestry systems[6] and is grown as a companion crop with coconut[7], immature rubber[8], coffee[9], or cacao[1]. Banana grown with areca nut enhances profitability and resource use efficiency[5].
Shade affects the growth rate and productivity[10] of banana. Areca-based cropping systems including banana require recycling organic matter to reach the target yields[5]. Nutrient balance investigations compare the reflux of nutrients in and out of the agroecosystems and help understand the competition for nutrients and identify the accumulation (positive balance) or mining (negative balance) pattern of plants. Nutrient use efficiency and yield of most intercrops are reduced in the areca agroforestry system[2]. Banana is a nutrient-exhaustive crop for nitrogen (N), phosphorus (P), and especially potassium (K)[11−13]. Each ton of banana bunch removes 5.6, 1.3, 20.3 kg[11], or 6.1, 0.61, 17.8 kg[14] of available NPK from the soil, respectively. The K balance turns increasingly negative in densely planted banana[12] orchards due to mutual shade.
Most shade tolerance studies on banana are restricted to either the Cavendish (AAA)[10] or French Plantains (AAB)[15]. The response of banana plants, either to shade stress in agroforestry systems[1,6] or to the nutrient balance in mono-cropped orchards[12,13], was studied independently. Response of banana varieties to shade under areca garden including soil nutrient balance analysis was performed to address this gap. The objective of the study was to investigate the performance of different banana varieties for cultivation in an arecanut-shaded system by trait variation in growth, phenology, fresh bunch mass (yield), and soil nutrient balance patterns.
-
The experiment was conducted from 2015 to 2018 at farm B at ICAR-Central Coastal Agricultural Research Institute Old Goa (North Goa District, Goa state, India) (15.5° N, 73.91° E, 16 meters above sea level). The temperature varies from 24 to 37 °C at the location with an average annual rainfall of 3,500 mm. The soil is lateritic in texture with an acidic pH of 5.53 to 5.75 organic carbon content of 0.62 to 0.88%, available N content of 292 to 330 kg·ha−1, available P content of 11.3 to 14 kg·ha−1, and available K content of 124 to 193 Kg·ha−1.
The sprinkler irrigation method is used to irrigate the plants at twice-a-week intervals from September to May. The main crop areca cultivar Mangala was planted at a spacing of 2 m × 2 m (2,500 plants per hectare) in 1989. The canopy height of areca nut palms during the study ranged from 16−18 m. About 92% of palms were alive during the study period. One banana was planted in the middle of the interspaces of four areca plants on 19 July 2015 at 2 m × 2 m spacing.
Study design
-
The experiment was laid out with seven banana (Supplemental Table S1) varieties with four replications in a randomized block design (RBD) with a plot size of six plants. Yield and reproductive traits were recorded only in five or six varieties in the later stages due to mortality or non-bearing of Myndoli and Red Banana. During the reproductive stage, 23 plants in Myndoli and 12 plants in the Red banana variety died out of the 24 plants in each variety. Weather data from the Meteorological Observatory of the ICAR-CCARI were used. Heat units or cumulative growing degree days (GDD) were computed from planting to the date of recording observation using a base temperature of 14 °C.
Plant traits measurements
-
Observations were recorded on the banana plants including the height of pseudostem (cm) and the number of leaves at five-time intervals i.e. Aug 2015, Sep 2015, Feb 2016, Jun 2016, and Aug 2016 approximately corresponding to 500, 1,000, 3,000, 5,000, and 5,500 growing degree days from the day of planting respectively. The height (cm) of the pseudostem was measured from the base of the pseudostem till the emerging point of a new leaf. The number of leaves that emerged on the plant were counted, summed, and recorded. Internodal length (cm) was calculated by dividing the height (cm) by the number of leaves.
Height increment per thousand degree days was calculated by subtracting the pseudostem height at two different time intervals and dividing the value by the number of thousand accumulated growing degree days (GDD) between the given two-time intervals. The leaf emergence rate per month (ERM) was calculated from the difference between the number of leaves recorded at two given time intervals and by dividing the value by the number of months between the time intervals. The four differential time intervals used for height increment and EMR in the study were Aug 2015 to Sep 2015, Sep 2015 to Feb 2016 (winter) and Feb 2016 to Jun 2016 (summer), Jun to Aug 2016 (rainy).
At the time of harvest, lamina/leaf length (cm) excluding the petiole was measured on the entire leaf. Lamina/leaf width (cm) was measured at the widest point on the leaf. Leaf area (m2) was calculated using the formula length (m) × width (m) × 0.83[10]. Bunch yield (kg/plant) in the plant and first ratoon crop was recorded by measuring the fresh weight of the whole bunch in each plant. All banana plants do not form a harvestable bunch under shade or any other stress. Hence the percentage of plants in each variety is counted where harvestable bunch was formed and recorded as percent harvest to express the percentage of plants with harvestable bunch. The percent harvest was calculated by the ratio of the number of bearing plants to the number of plants planted in each plot. Bunch yield (fresh weight in kg per plot) per plant crop was calculated by summing the yield obtained in a plot of six plants. The yield obtained from the bearing plants only is summed to work out the yield per plot (25 m2). Hence, bunch yield (fresh weight in kg per plot) was multiplied by 400 to get the yield in kg per hectare assuming 400 plots per hectare. The ratoon crop yield per hectare was calculated in a similar way using the first ratoon crop till May 2018 and expressed without statistical analysis. The number of hands per bunch and the number of fruits per plant were counted in the plant crop.
Soil samples
-
The soil samples were collected at 0–60 cm depth in the middle of each plot of banana intercrop. The initial soil sample was collected one month before planting the intercrops and the final sample was collected after harvest. The samples were air-dried, powdered using a wooden roller, and sieved through a 2 mm sieve. The alkaline potassium permanganate (KMnO4) methodology was used to assess available nitrogen content using a Kjeldahl Semi-Auto Nitrogen Analyzer (Kjelteck 1026) by distillation with KMnO4 followed by titration against 0.02 N sulphuric acid[16]. The available phosphorus concentration was evaluated using the Bray I solution comprising ammonium fluoride and hydrochloric acid, followed by measuring the degree of blue color formed when treated with Molybdate–ascorbic acid, as described by Bray & Kurtz[17]. Following Hanway & Heidal[18], the available potassium content was calculated by extracting the soil with ammonium acetate solution, filtering, and measuring with a Flame photometer (Analab Scientific Instruments Private Ltd, India).
Soil nutrient availability means the amounts of soil nutrients in chemical forms accessible to plant roots or compounds likely to be convertible to such forms during the growing season. As there is not much variation in the bulk density of the soil due to different treatments from initiation to after completion of the study, the mean value of 1.41 kg·m−3 was considered for all the varietal treatments, and the soil nutrient availability was expressed in kg ·ha−1. A similar methodology of soil nutrient budgeting was followed by Alves et al.[19] in an earlier report.
Nutrient budget
-
The recommended dose of manures and fertilizers was applied to both areca and banana every year during the study. The chemical fertilizers included per hectare include urea (885.7 kg), rock phosphate (81.5 kg), and muriate of potash (925.9 kg). The vermicompost containing 1.5% nitrogen, 0.9% P2O5, and 1.2% K2O was applied at the rate of 2 kg per plant during October of each year and it supplied 93 kg N, 56 kg P2O5, and 74 kg K2O per ha.To calculate the nutrient budget, all inputs of nutrients such as NPK via fertilizers and vermicompost, and the crop uptakes were quantified. Crop nutrient uptake of NPK was considered by following the work of Rethinam[20] and Lahav & Turner[14]. Nutrient uptake was considered per year basis for calculation. Again a mean bulk density of 1.41 kg·m−3 was considered for all the varietal treatments.
The soil nutrient budget (SNB) was computed following Alves et al.[19] considering initial and final available soil nutrientsusing the available NPK for the 0–60 cm soil layer, as presented in Eqn. (1):
$ S NB=F S N-IS N $ (1) Where, SNB = soil nutrient budget, FSN = final soil nutrient content (kg ha−1), ISN = initial soil nutrient content (kg ha−1).
The effective budget of nutrients in the soil was calculated by taking into account the initial and final levels in the 0–60 cm soil layer, in addition to all inputs, via fertilizer, organic manures, and the exits, via crop uptake, as presented in Eqn. (2):
$ EB=(F S N-IS N)-(NI-NO) $ (2) Where, EB = effective budget, FSN = final soil nutrient content (kg·ha−1), ISN = initial soil nutrient content (kg·ha−1), NI = nutrient input via fertilizer and FYM, NO = nutrient output via crop nutrient uptake.
Data analysis
-
The trait mean of six or existing plants in each plot was calculated and subjected to statistical analysis using analysis of variance (ANOVA) using the F test (ratio of treatment mean square to error mean square) and comparing with table values to test the significant differences among the treatments. The LSD method (Least Significant Difference) test was used for mean separations using the CD (Critical Difference) at a 5% level of significance. SAS (Statistical Analysis Software) version 13.0 at web portal
http://stat.iasri.res.in/sscnarsportal/ of ICAR-IASRI (Indian Council of Agricultural Research-Indian Agricultural Statistics Research Institute) was used. -
Plants of the Velchi variety grew fast to a height of nearly 2 m and were significantly taller than other varieties after 3000 GDD of planting. Significant differences were found between banana varieties for pseudostem height and height increment at all five-time intervals (Table 1). Grand Nain recorded the lowest internodal length during all five-time intervals (Table 2).
Table 1. Height of pseudostem and height increment of banana varieties at different time intervals.
Variety Height of pesudostem (cm) Height increment (per thousand degree days) Aug 2015 Sept 2015 Feb 2016 Jun 2016 Aug 2016 Aug 15 – Sept 15 Sep t15 – Feb 16 Feb 16 – Jun 16 Jun 16 - Aug 16 Mean Mean Mean Mean Mean Mean Mean Mean Mean Velchi 58.0 ± 16.5b 72.4 ± 14.0 ab 191.5 ± 30.1c 286.5 ± 30.2bc 302.6 ± 21.8bc 31.4 ± 6.2 61.3 ± 21.5a 49.1 ± 7.0 36.7 ± 21.1 Amti 59.5 ± 11.1b 65.8 ± 12.6 ab 138.6 ± 23.4ab 217.8 ± 51.7ab 258.0 ± 44.1 b 14.0 ± 15.4 37.4 ± 14.3ab 45.6 ± 19.3 70.8 ± 22.5 Rasbali 56.5 ± 11.1b 72.9 ± 14.6 ab 135.8 ± 40.7ab 209.4 ± 78.9ab 233.3 ± 75.9 b 35.8 ± 12.0 32.3 ± 14.3 b 38.0 ± 27.3 40.5 ± 19.9 Myndoli 61.0 ± 11.3ab 77.0 ± 18.2 bc 142.1 ± 38.2ab 168.8 ± 46.8a 169.9 ± 55.7 a 34.9 ± 27.8 36.6 ± 10.9ab 23.5 ± 10.3 46.8 ± 22.5 Robusta 38.5 ± 14.4a 47.6 ± 14.0 a 93.3 ± 23.2 a 148.1 ± 30.7 a 164.5 ± 34.4 a 19.9 ± 4.9 23.5 ± 8.3 b 28.3 ± 7.1 37.3 ± 27.4 Grand Nain 25.9 ± 10.6 a 39.3 ± 8.2 a 91.3 ± 6.4 a 144.3 ± 31.3 a 157.3 ± 34.3 a 29.2 ± 6.0 26.7 ± 3.4 b 27.4 ± 15.6 29.5 ± 13.8 Red Banana 41.2 ± 10.0 a 56.9 ± 9.6 a 116.9 ± 7.6 a 184.3 ± 23.1 a 198.9 ± 29.1a 34.3 ± 14.4 30.8 ± 2.2 b 34.8 ± 12.6 33.3 ± 16.5 Significance ** ** ** ** ** NS * NS NS Statistical significance at * 5% level of significance, ** at 1% level of significance, and at *** 0.1% level of significance. Different lowercase letters within the same column represent significant differences among treatment means at 5% level of significance. Table 2. Number of leaves produced and leaf emergence rate by banana varieties at different time intervals.
Variety Number of leaves Leaf emergence rate Internodal length (cm) Aug 2015 Sep 2015 Feb 2016 Jun 2016 Aug 2016 Aug 15 – Sept 15 Sept 15 – Feb 16 Feb 16 –Jun 16 Jun 16 – Aug 16 Aug 2015 Sep 2015 Feb 2016 Jun 2016 Aug 2016 Mean Mean Mean Mean Mean Mean Mean Mean Mean Mean Mean Mean Mean Mean Velchi 5 ± 1.2ab 9 ± 0.5 b 19 ± 1.0 c 28 ± 0.3c 29 ± 0.4c 0.09 ± 0.019 0.08 ± 0.005 a 0.07 ± 0.007 a 0.04 ± 0.014 12.54 ± 6.6 ab 8.30 ± 1.9 ab 10.28 ± 1.5 a 10.40 ± 1.1 ab 10.45 ± ab Amti 4 ± 0.4 a 6 ± 0.9a 13 ± 1.9 a 18 ± 3.3 a 21 ± 3.7 ab 0.06 ± 0.019 0.05 ± 0.010 b 0.04 ± 0.012 bcd 0.09 ± 0.059 16.73 ± 2.6 a 11.15 ± 2.5 a 10.75 ± 1.1 a 12.68 ± 1.1 a 12.15 ± 2.2 a Rasbali 5 ± 0.9ab 9 ± 1.6b 15 ± 0.6 a 22 ± 3.1 b 24 ± 2.7 b 0.09 ± 0.032 0.05 ± 0.008 b 0.06 ± 0.021 ab 0.05 ± 0.015 11.56 ± 2.7 ab 8.23 ± 0.3 ab 9.03 ± 2.3 ab 9.17 ± 2.3 bc 9.22 ± 4.5 ab Myndoli 5 ± 1.0 ab 9 ± 0.9 b 14 ± 1.7 a 17 ± 1.1 a 17 ± 1.7 a 0.10 ± 0.012 0.04 ± 0.018 b 0.02 ± 0.008 d 0.01 ± 0.054 11.89 ± 1.6 ab 8.38 ± 1.7 ab 10.41 ± 2.9a 11.37 ± 2.4 ab 12.60 ± 1.0 a Robusta 6 ± 0.6bc 9 ± 0.9 b 16 ± 1.1 ab 22 ± 2.3 b 24 ± 1.8 b 0.08 ± 0.013 0.05 ± 0.007 b 0.04 ± 0.019 bc 0.06 ± 0.028 6.66 ± 2.3 bc 5.40 ± 1.6 bc 5.88 ± 1.2 b 6.83 ± 0.7 c 6.83 ± 1.4 b Grand Nain 6 ± 0.4 bc 9 ± 1.1 b 16 ± 0.8 ab 22 ± 1.0 b 23 ± 0.5 b 0.09 ± 0.029 0.05 ± 0.007 b 0.05 ± 0.011 abc 0.03 ± 0.013 4.69 ± 2.2 c 4.19 ± 0.7 c 5.83 ± 0.5 b 6.59 ± 1.2 c 6.79 ± 1.8 b Red Banana 4 ± 0.4 a 7 ± 0.8a 14 ± 1.4 a 18 ± 1.0 a 20 ± 1.0 a 0.07 ± 0.011 0.05 ± 0.005 b 0.03 ± 0.007 cd 0.05 ± 0.020 9.46 ± 2.5 bc 8.02 ± 2.1 ab 8.40 ± 1.2 ab 10.60 ± 1.8 ab 10.25 ± 0.5 ab Significance * ** ** ** ** NS *** *** NS *** *** *** *** *** Different lowercase letters within the same column represent significant differences among treatment means at 5% level of significance. Statistical significance at * 5% level of significance, ** at 1% level of significance, SD -Standard deviation. Leaf traits
-
Velchi plants recorded a large number of leaves during 3000, 5000, and 5500 GDD (Table 2). Leaf and petiole dimensions including leaf area at harvest differed significantly among varieties (Table 3). Amti and Red banana had fewer leaves after 1000 GDD from planting than other varieties (Table 2). Amti plants had the widest leaves and Rasbali plants recorded the longest petiole (Table 3).
Table 3. Dimensions of leaf and length petiole of banana plants at harvest and yield components of banana varieties during plant crop.
Variety Leaf length
(cm)Leaf width
(cm)Leaf area
(m2)Petiole length
(cm)No. of hands No. of fruits
per bunchBunch weight
(kg)Fruit weight per
plant (kg)Mean Mean Mean Mean Mean Mean Mean Mean Velchi 171.3 ± 23.1 bc 60.6 ± 3.7 b 0.8 ± 0.16 b 47.6 ± 2.90 ab 8.2 ± 0.55 b 119.7 ± 11.96 b 4.7 ± 1.00 c 3.5 ± 1.06 Amti 201.5 ± 12.1 ab 79.9 ± 11.1 a 1.3 ± 0.26 a 42.7 ± 1.63 b 10.9 ± 1.74 a 186.2 ± 25.13 a 11.9 ± 0.90 a 10.1 ± 0.72 Rasbali 219.8 ± 36.2a 59.1 ± 6.1 b 1.0 ± 0.28 ab 52.9 ± 11.64 a 6.2 ± 1.10c 83.4 ± 22.79 c 7.7 ± 2.49 bc 6.7 ± 1.07 Robusta 158.4 ± 12.8 c 63.1 ± 4.0 b 0.8 ± 0.11 b 26.2 ± 2.06 c 7.0 ± 0.62 bc 84.3 ± 13.16 c 8.8 ± 3.90 ab 7.7 ± 2.83 Grand Nain 150.1 ± 5.4 c 67.6 ± 5.7 b 0.8 ± 0.08 b 25.2 ± 1.49 c 7.4 ± 0.79bc 90.4 ± 25.91 bc 9.9 ± 3.89ab 18.8 ± 2.92 Significance *** * * *** *** *** * NS Different lowercase letters within the same column represent significant differences among treatment means at p < 0.05. Statistical significance at *** 0.1% level of significance, Statistical significance at * 5% level of significance, NS-Non Significant. Phenology traits
-
Height increment per thousand GDD was significantly different between varieties only from 1000 to 3000 GDD. Leaf emergence rate (EMR) differed significantly among the banana varieties especially from Sep 2015 to Feb 2016 (winter) and Feb 2016 to Jun 2016 (summer). All banana varieties except Velchi recorded lower leaf emergence rates during winter under the areca nut canopy. The Velchi variety produced several leaves during winter and took only 399 days to flower while others flowered after 430 d. The leaf emergence rate was significantly different among varieties only from 1000 to 3000 GDD and 3000 to 5000 GDD. Velchi had a high leaf emergence rate from 1000 to 3000 GDD periods (Table 2). Time from planting to flowering and harvesting did not differ significantly among varieties (Supplemental Table S2). Velchi variety recorded the highest leaf emergence rate during winter (Table 2) and the highest percentage of plants with a harvestable bunch in plant and first ratoon crops (Table 4).
Table 4. Yield and percent harvest of banana varieties during plant crop and including first ratoon.
Variety Plant
crop harvest
(% plants)Bunch yield (fresh mass) plant crop (kg·ha−1) Ratoon harvest
(% plants)Ratoon yield (fresh mass)
(kg·ha−1)Mean Mean Mean Mean Velchi 91.6 ± 10 a 10237.3 ±
2079 bc62.5 ± 21 5032.0 ±
809Amti 75.0 ± 29 ab 21320.1 ±
6511 a45.8 ± 16 13458.5 ±
4359Rasbali 45.8 ± 28 bc 7984.6 ±
2739 c4.2 ± 8 176.0 ± 37 Robusta 62.5 ± 16 abc 12918.20 ±
3329 bc29.2 ± 8 4481.4 ± 835 Grand Nain 70.8 ± 21 ab 18012.20 ±
7193 ab20.8 ± 8 3970.7 ±
1169Red Banana 33.3 ± 19 c 6067.40 ±
1415 c0.0 ± 16 0.0 ± 0 Significance * ** NS NS Different lowercase letters within the same column represent significant differences among treatment means at 5% level of significance. Statistical significance at ** 1% level of significance, Statistical significance at * 5% level of significance, NS-Non Significant. Yield traits
-
Amti had (Fig. 1) the highest number of hands and fruits (Table 3), followed by Grand Nain. Velchi bunches matured early but some of the middle hands did not develop (Fig. 1) properly. Red banana remained a poor yielder in terms of the percent of plants with harvestable bunch and bunch yield and did not yield the first ratoon crop (Table 4).

Figure 1.
Bunches of banana varieties (Robusta, Velchi, Grand Nain, Rasbali, Amti from left to right in order) grown in areca as intercrops.
Nutrient balance
-
The soil nutrient balance and effective balance of nitrogen, phosphorous, and potassium of five banana varieties are depicted in Fig. 2. An effective balance of the available phosphorus (kg·ha−1·year−1) was found to be highly negative for Grand Nain (−50.3) almost double that of (−23.6) Amti. An effective balance of the available nitrogen (kg·ha−1·year−1) was more negative for Grand Nain (−284.9) than other varieties (−227 to −256.6). Velchi recorded a higher effective negative balance (−185.8) of available potassium (kg·ha−1·year−1) than other varieties (−125 to −141.3) while grown in areca shade (Table 5).
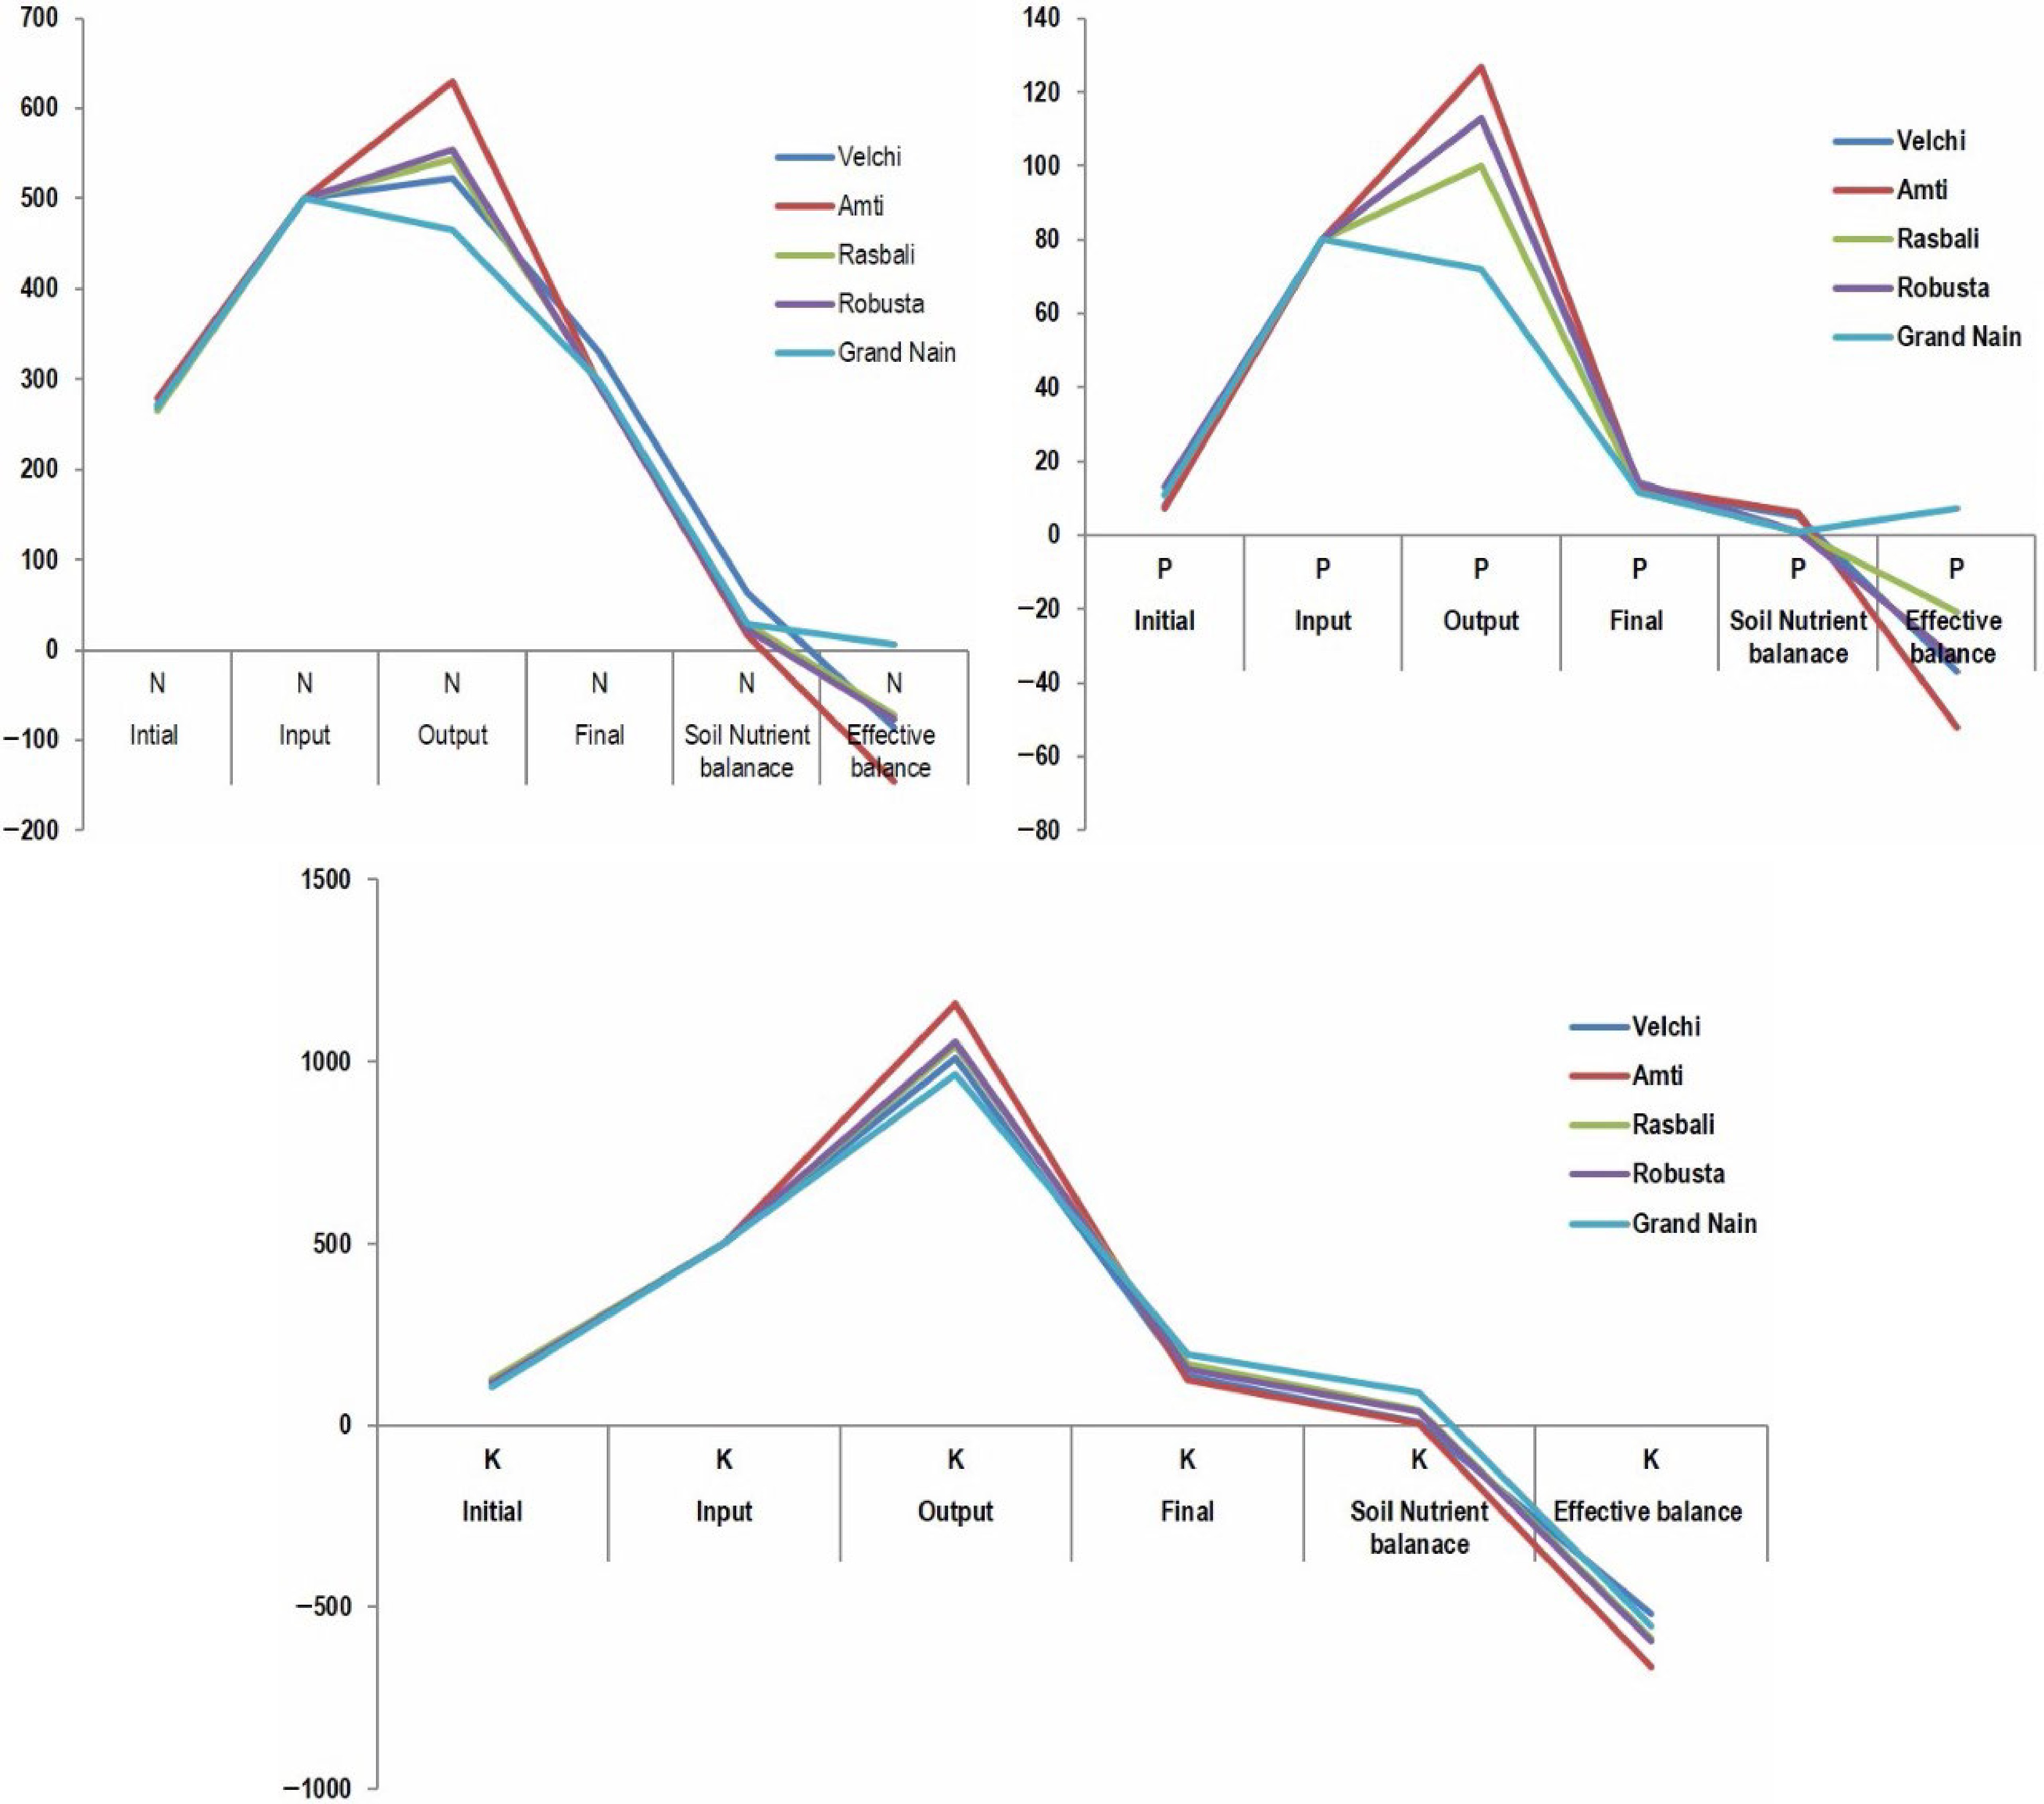
Figure 2.
Soil nutrient budgeting.
Table 5. Nutrient budget of banana varieties under arecanut banana system (kg·ha−1·year−1).
Intial Input Output Final Soil nutrient balance Effective balance N P K N P K N P K N P K N P K N P K Mean Mean Mean Mean Mean Mean Mean Mean Mean Mean Mean Mean Velchi 266 ±
46.348 ±
2.53124 ±
45.11500 80 500 522 113 1010 330.0 ±
9.3712.8 ±
4.11134.1 ±
47.0463.9 4.5 10.0 −227.1 −30.4 −185.8 Amti 278 ±
78.927 ±
0.97120 ±
42.10500 80 500 630 127 1160 293.5 ±
7.4112.9 ±
2.09124.1 ±
62.1615.7 5.8 4.5 −232.3 −23.6 −131.5 Rasbali 265 ±
22.1411 ±
0.45127 ±
5.56500 80 500 543 100 1044 294.5 ±
2.4411.4 ±
3.18169.8 ±
51.7729.2 0.8 42.9 −253.5 −39.2 −139.5 Robusta 271 ±
59.6113 ±
5.16118 ±
39.58500 80 500 554 113 1055 292.6 ±
19.5614.1 ±
3.63154.7 ±
48.7421.8 0.8 36.7 −256.6 −34.0 −141.3 Grande
Nain269 ±
42.7911 ±
2.15105 ±
11.64500 80 500 465 72 965 298.3 ±
62.1411.6 ±
2.78193.7 ±
51.2729.1 0.9 89.0 −284.9 −50.3 −125.0 -
Banana varieties differed significantly for height increment during winter only. Grand Nain recorded the lowest internodal length during all five time intervals of the study. Shade-sensitive plant species tend to grow tall with elongated internodes under shade in search of light whereas shade-tolerant ones develop short internodes and remain short in stature[21]. Arunachalam & Reddy[21] observed longer shoots of jasmine plants under coconut canopy shade with more nodes during winter than during the rainy season. Similarly, Rodrigo et al.[22]observed an increase in the plant height of both rubber and banana (Kolikuttu AAB group Silk) under the rubber-banana intercropping system compared to their respective sole crops.
Leaf traits
-
Amti, the high-yielding cultivar in the areca intercropping system, recorded the widest leaves and high leaf area. Excessive shading reduces the leaf area of banana plants[1, 10], this might be the possible reason for the reduction in leaf width in other varieties. Moreover, the long and narrow leaves are due to genetic mutation in banana[23]. Leaf width and pseudostem height varied widely among the somaclonal variants of banana due to management practices[24]. Arunachalam & Reddy[21] reported a significant difference in leaf width under the shade of coconut for jasmine. Large leaf area leads to high radiation use efficiency[6] thereby increasing dry matter production and high yield[25].
Phenology traits
-
All banana varieties recorded significantly lower leaf emergence rates during winter under the areca canopy except Velchi. Neither fertilizers nor shading affects the rate of leaf production during the first six months of planting[25]. Reduction in leaf emergence rate[1, 10] was also observed earlier in the shade-grown banana plants. The Velchi variety produced several leaves during winter and took only 399 d to flower while others took more than 430 d. Banana plants producing more leaves during cool temperatures tend to flower early[26, 27]. A higher leaf emergence rate is observed under trees at low density compared to higher density[28].
Yield traits
-
Amti and Grand Nain recorded a significantly higher individual plant yield and total yield per hectare. Amti variety recorded more hands and fruits than other varieties under the areca nut shade. Marimuthu[7] noticed higher bunch yield and higher yield per hectare in Poovan a cultivar similar to the Amti group of Mysore AAB banana under the coconut-based multi-storey cropping system. The percentage harvest and the fresh bunch yield were higher in the less shaded locations[15]. The number of hands, fruits, and bunch yield per unit area diminished when the planting density of banana increased from 1,400 to > 5,000 plants per hectare[12].
Nutrient balance
-
The effective balance (−185.8 kg·ha−1·year−1) of available soil potassium of Velchi was more negative than all other varieties (−125 to −141.3 kg·ha−1·year−1). The middle hands of Velchi did not develop, perhaps due to a deficiency of potassium. Neypoovan variety (similar to Velchi) required 2.98:0.64:12.9 kg each of available N, P, and K respectively to produce a one-ton yield[13]. The effective balance of the available soil P was highly negative for Grand Nain. Ashokan et al.[29] observed higher P uptake and good yield in the Mysore (similar to Amti) variety in the cassava-banana-elephant foot yam system. Similarly, highly negative nutrient balances were reported for N and P in mutually shaded dense banana orchards of Rwanda, Africa[30]. Velchi recorded a very high negative balance (−185.8 kg·ha−1·year−1) of available soil K than all other varieties. This negative balance of all the major nutrients can be mainly due to lower nutrient use efficiency, higher nutrient leaching due to heavy rainfall, and high crop requirements. Banana plants grown in the rubber-banana system[8] are not supplied with sufficient fertilizers which can lead to low yields of banana. The application of nutrients as per the requirements of both main and intercrops leads to higher production and improved soil quality[31,32].
Banana is grown as a preferred component crop in tropical agroforestry systems across the world. Although the current study is conducted at a single location, the results of suitable cultivar type, traits, and nutrient budgeting are applicable after validation at other geographical conditions. The current study was conducted at the Goa Konkan coast on mid west coast of India and found the Mysore Poovan AAB group banana variety Amti as suitable for an arecanut-based agroforestry system. Marimuthu[7] noticed higher bunch yield and higher yield per hectare in Poovan a cultivar similar to the Amti group of Mysore AAB banana under the coconut-based multi-storey cropping system at Tamil Nadu Southeast coast of India. Palayam Kodan (Syn. Mysore Poovan) is suitable for intercropping in coconut at Kerala Southwest coast of India. Rajan et al.[33] AAB Prata Sub group banana cultivar is the preferred cultivar for the cacao abruca agroforestry system in Brazil[34]. Dwarf banana cultivars Mas and Goroho with fast growth and early bearing nature are found suitable as intercrop in coconut at North Sulawesi Indonesia[35].
-
The current study suggests Mysore and Grand Nain banana varieties as suitable for intercropping in high-density areca nut gardens with good performance during plant and ratoon crops. Mining nitrogen, phosphorous, and potassium nutrients in the areca–banana system is a concern and should be managed by cultivar-specific nutrient management practices. There is a need to develop a package of practices for growing banana under areca nut shade. Modification in planting geometry of areca nut is required to reduce the competition for space, nutrients, and light from intercrops.The findings of this study provide valuable insights for banana growers and researchers, highlighting the strengths and weaknesses of different banana varieties under specific environmental conditions. Further investigations into the factors affecting nutrient balance and bunch development could lead to improved cultivation practices for various banana varieties, enhancing productivity and sustainability in banana farming.
-
The authors confirm contribution to the paper as follows: design of experiments, supervision, methodology, data analysis, drafting manuscript: Arunachalam V; methodology field layout foliar observations: Vanjari SS; nutrient budget analysis, soil analysis, drafting manuscript: Paramesh V; method, soil nutrient analysis: Vishwakarma S; data tabulation, analysis: Prabhu DC; methodology yield observations: Dsouza AV; literature review: Fernandes CM. All authors reviewed the results and approved the final version of the manuscript.
-
All data generated or analyzed during this study are included in this published article and its supplementary information files.
The authors are grateful to the Indian Council of Agricultural Research (ICAR) for funding through the ICAR-All India Coordinated Research Project on Palms of ICAR-Central Plantation Crops Research Institute for the initial support and the facilities and support through ICAR-Central Coastal Agricultural Institute at a later stage.
-
The authors declare that they have no conflict of interest.
- Supplemental Table S1 Varieties used in the study and their international name/group and genome type.
- Supplemental Table S2 Duration and growing degree days of banana varieties to flowering and harvest.
- Supplemental Table S3 Final soil available nutrient contents of banana varieties under Arecanut-banana system.
- Copyright: © 2023 by the author(s). Published by Maximum Academic Press, Fayetteville, GA. This article is an open access article distributed under Creative Commons Attribution License (CC BY 4.0), visit https://creativecommons.org/licenses/by/4.0/.
-
About this article
Cite this article
Arunachalam V, Vanjari SS, Paramesh V, Viswakarma S, Prabhu DC, et al. 2023. Variation in plant traits and nutrient uptake among banana varieties in shaded agroecology under areca nut canopy. Technology in Agronomy 3:15 doi: 10.48130/TIA-2023-0015 

Variation in plant traits and nutrient uptake among banana varieties in shaded agroecology under areca nut canopy
- Received: 01 August 2023
- Accepted: 07 November 2023
- Published online: 30 November 2023
Abstract: Banana is an excellent companion crop cultivated with coconut, areca nut, coffee, or cacao. The yield performance of bananas however differs due to cultivar response to light, water, and nutrient availability in the intercropping system. The current study aims to understand the performance of different banana varieties under the areca nut shaded system by trait variation in growth, phenology, fresh bunch mass (yield), and soil nutrient balance patterns. Five banana varieties were screened in a field experiment in a high-density areca garden for vegetative traits, phenology, yield components, and nutrient budgets. Variety Amti recorded wider leaves and greater leaf area and also recorded higher bunch yield in plant and first ratoon crop than other varieties. The Velchi variety recorded the highest leaf emergence rate during winter and recorded the highest percentage of plants with a bunch in both the plant and first ratoon crops. The study revealed nutrient mining of nitrogen, phosphorous, and potassium in the areca–banana system. The effective balance of the available soil phosphorus was found to be highly negative for Grand Nain (−50.3 kg·ha−1·year−1) and negative (−23.6 kg·ha−1·year−1) for Amti. The results reveal the role of choice variety, indicator traits, and nutrient management strategies in enhancing banana productivity in agroforestry systems.
-
Key words:
- Leaf width /
- Musa /
- Phenology /
- Potassium balance /
- Shade tolerance /
- Yield