


-
Biochar, a carbon-rich solid produced by thermochemical conversion of biomass[1], has been described by some researchers as 'agrichar' for its important use as a soil amendment[2]. Large scale use of biochar to improve soil productivity is however limited. Although there has been minimal field use, numerous greenhouse experiments have demonstrated its potential[3]. Biochar is now known to be a valuable carbon-rich material in improving soil properties including water holding capacity, cation exchange capacity (CEC), pH, bulk density, and porosity, among others[4]. It is produced through pyrolysis under oxygen-limited environment[5]. Pyrolysis temperature, residence time, nature, and condition of the feedstock, among others affect the quality of biochar and the extent to which it contributes to improving soil properties and crop growth[5]. Irrespective of the feedstock, it has been documented that pyrolysis leads to biochar with a well-developed pore structure, high biochemical stability and increased sorption capacity due to its high surface area[6]. These are important chemical and physical attributes that enhance soil productivity when biochar is used as a soil amendment[7]. There are benefits to this enhancement of the chemical and physical characteristics of soil. However, biochar itself is known to be low in volatile nutrients that are lost especially when produced under high temperatures. To complement its function as a soil amendment, it has been suggested that biochar needs to be applied in combination with inorganic nutrients[8]. Plant utilization of N and other cation nutrients may be improved when biochar and inorganic N are combined. Specifically, simultaneous addition of biochar with N is linked to the increased bioavailability of fertilizer-N and native soil N[9]. This study focused on three soil chemical properties; CEC, pH, and EC and how they are influenced by soil amendments with biochar.
The CEC is among the most important soil chemical properties that can be altered through biochar application[10]. It refers to the total number of negative charges available in a given mass of soil and denotes the capacity of the soil to sorb cation plant nutrients against the force of leaching[10]. The CEC of a soil is primarily determined by the organic matter and clay content. Early work by Helling et al.[11] indicated the total CEC of organic matter was observed between 19 and 45%. In their study, the CEC of clay content varied from 3.3% to 13.3%. The authors mentioned that CEC of organic matter was pH dependent where the highest % was observed at pH 8.0 while the lowest was seen at a pH of 2.5. Any soil amendment that increases the colloidal surfaces will also raise the CEC. Biochar is known to possess negative charges due to the oxidation of aromatic C eventually forming functional groups such as carboxyl and phenolic[12,13]. Laird et al.[14] observed 20% increase in soil CEC as a result of biochar amendment. The high CEC of biochar increases the capacity of the soil to sorb and retain cations such as ammonium against leaching[15]. Simultaneous application of biochar and N could be a good strategy to increase CEC thus enabling the retention of cation nutrients in the soil.
The pH of the soil influences the quality of soil as a medium for crop growth. This is because it affects the diversity and population of desirable soil microbes, determines plant nutrient availability, and uptake[16]. Field crops are normally grown in soils with near neutral pH of 7. Nitrogen fertilizer application at extremely high rates for a long period lowers soil pH and affects crops that are not adapted to grow under acidic soil environment. This is due to the oxidation of ammonium ion that produce hydrogen ions hence lowering soil pH. A report by Aula et al.[17] indicated a significant decrease in pH from the initial values (5.1–7.5) to 4.3 of a 0–15 cm soil layer when N rates were above 90 kg·ha−1. At low pH, the high acidity due to increased hydrogen ions reduces phosphorus availability for plant uptake through fixation by aluminum and iron[18]. Additionally, the high hydrogen ions also induce the leaching loss of base cations from the exchange complex via displacement. Soil acidity is commonly managed through the application of lime. However, lime application rates depend on the buffer capacity of the soil where rates could be different even at similar pH. Several research reports have indicated that biochar has the potential to neutralize soil acidity. For instance, Chintala et al.[19] confirmed the efficacy of biochar soil amendment in reducing soil acidity. Nonetheless, they noted that this significantly depends on feedstock type, pyrolysis process parameters such as residence time and temperature. When Yuan & Xu[20] correlated the liming effect of biochar with soil acidity, they noted that amendment of soil with biochar made from leguminous feed stock decreased exchangeable soil acidity. Biochar application together with mineral fertilizer N could counter the reductions in soil pH that are commonly experienced at high fertilizer N rates.
Soil electrical conductivity (EC) is another chemical property that is influenced by the amendment of soil with biochar. The rise in salt levels of soils include use of saline water during irrigation, excessive irrigation, and unsuitable fertilizer application[21,22]. Irrigation is a common practice in environments with limited rainfall such as arid and semi-arid. However, when applied in excessive quantities, it can increase the salinity level of the soil. Fertilizer application techniques such as fertigation, application rate, type, and timing have great potential to increase soluble salt concentrations. For instance, a report by Lichtfouse[22] showed that an increase in cattle manure rate led to an increase in the EC of the studied soil. There is no doubt that fertilizer application that exceeds crop requirement will lead to increase of salt in the soil. Ju et al.[23] studied changes in EC under excessive N fertilizer applications on different cropping systems. They observed higher EC in the vegetable field compared to the wheat-maize rotation field. This indicates that salt accumulation due to fertilizer N in excess of plant requirements affects crop growth differently depending on the crop grown. Biochar amendment could have a significant positive or negative influence on soil EC depending on the selected pyrolysis parameters. Hossain et al.[24] indicated that biochar pyrolyzed at 700 °C was high in EC. Furthermore, Brewer et al.[25] noted that pyrolysis feedstock and temperatures affect the quality of biochar produced and hence EC. The authors observed that the EC of soils amended with urea fertilizer was greater than those under biochar amendment. Biochar produced at elevated temperatures is normally alkaline. However, it is imperative to note that higher EC in soils applied with such biochar type does not significantly reduce crop growth. Thus, the synchronized application of biochar and fertilizer N could lower the potential accumulation of salt from the fertilizer. The objective of this paper was to compare changes in CEC, soil pH, and soil EC following a synchronized application of NB and NF. We hypothesized that mixing biochar with inorganic N would improve the CEC, pH and EC of sandy soils.
-
Field trials were conducted in 2018 and 2019 at Efaw and Lake Carl Blackwell (LCB) research farms, OK, USA. Efaw (36°08′12.6′′ N, 97°06′25.8′′ W) is on an Ashport silty clay loam (fine-silty, mixed, superactive, thermic Fluventic Haplustoll) soil while LCB (36°08′58.0′′ N, 97°17′19.3′′ W) is on a Pulaski fine-sandy loam (coarse/loamy, mixed nonacid, themic Udic Ustifluvent) soil (
http://websoilsurvey.sc.egov.usda.gov/ ). The study was set as a randomized complete block design with ten treatments, each replicated three times. The treatments had three levels of fertilizers N: 50, 100, and 150 N·kg·ha−1 and three levels of biochar: 5, 10, and 15 t·ha−1. The biochar rates were chosen based on commonly used rates in field experiments. Additionally, a control plot with neither N nor biochar was included in the treatment structure. Southern Yellow Pine biochar was obtained from Wakefield Agricultural Carbon (Columbia, Missouri, USA) pyrolyzed at 500 °C. The physical and chemical properties of biochar used are indicated in Table 1. Biochar and fertilizer N - UAN (28:0:0) were simultaneously applied pre-plant on the soil surface by hand, incorporated into a 15-cm layer by discing. Biochar was used as received from the supplier without special preparation prior to field application. Different pyrolysis parameters yield biochar of different physical and chemical properties. This study had no control over the pyrolysis process, probably the most important limitation. The total monthly rainfall (mm) and the average air temperature (°C) at Efaw and LCB (OK, USA) from April to August of 2018 and 2019 are presented in Figs 1 & 2.Table 1. Physical and chemical properties of soft wood (Southern Yellow Pine) biochar (supplied by Wakefield Biochar, Columbia, MO, USA). The initial soil chemical properties at Lake Carl Blackwell (LCB) and Efaw research sites (Stillwater, OK, USA).
Biochar/Site pH K
mg·kg−1Ca
mg·kg−1Mg
mg·kg−1Mn
mg·kg−1Fe
mg·kg−1BD
g·cm−1TP
mg·kg−1TN
g·kg−1TOC
g·kg−1Biochar 7.4 612 4128 1225 234 595 0.48 4.53 5.9 876.7 LCB 5.7 349 804 207 x x x 12 0.8 9.1 Efaw 5.6 153 1466 354 x x x 13 0.7 6.8 TP, Total phosphate; TN, Total nitrogen; TOC, Total organic carbon; BD, Bulk density; x, values not determined. Initial soil properties were determined before the first year of biochar application. 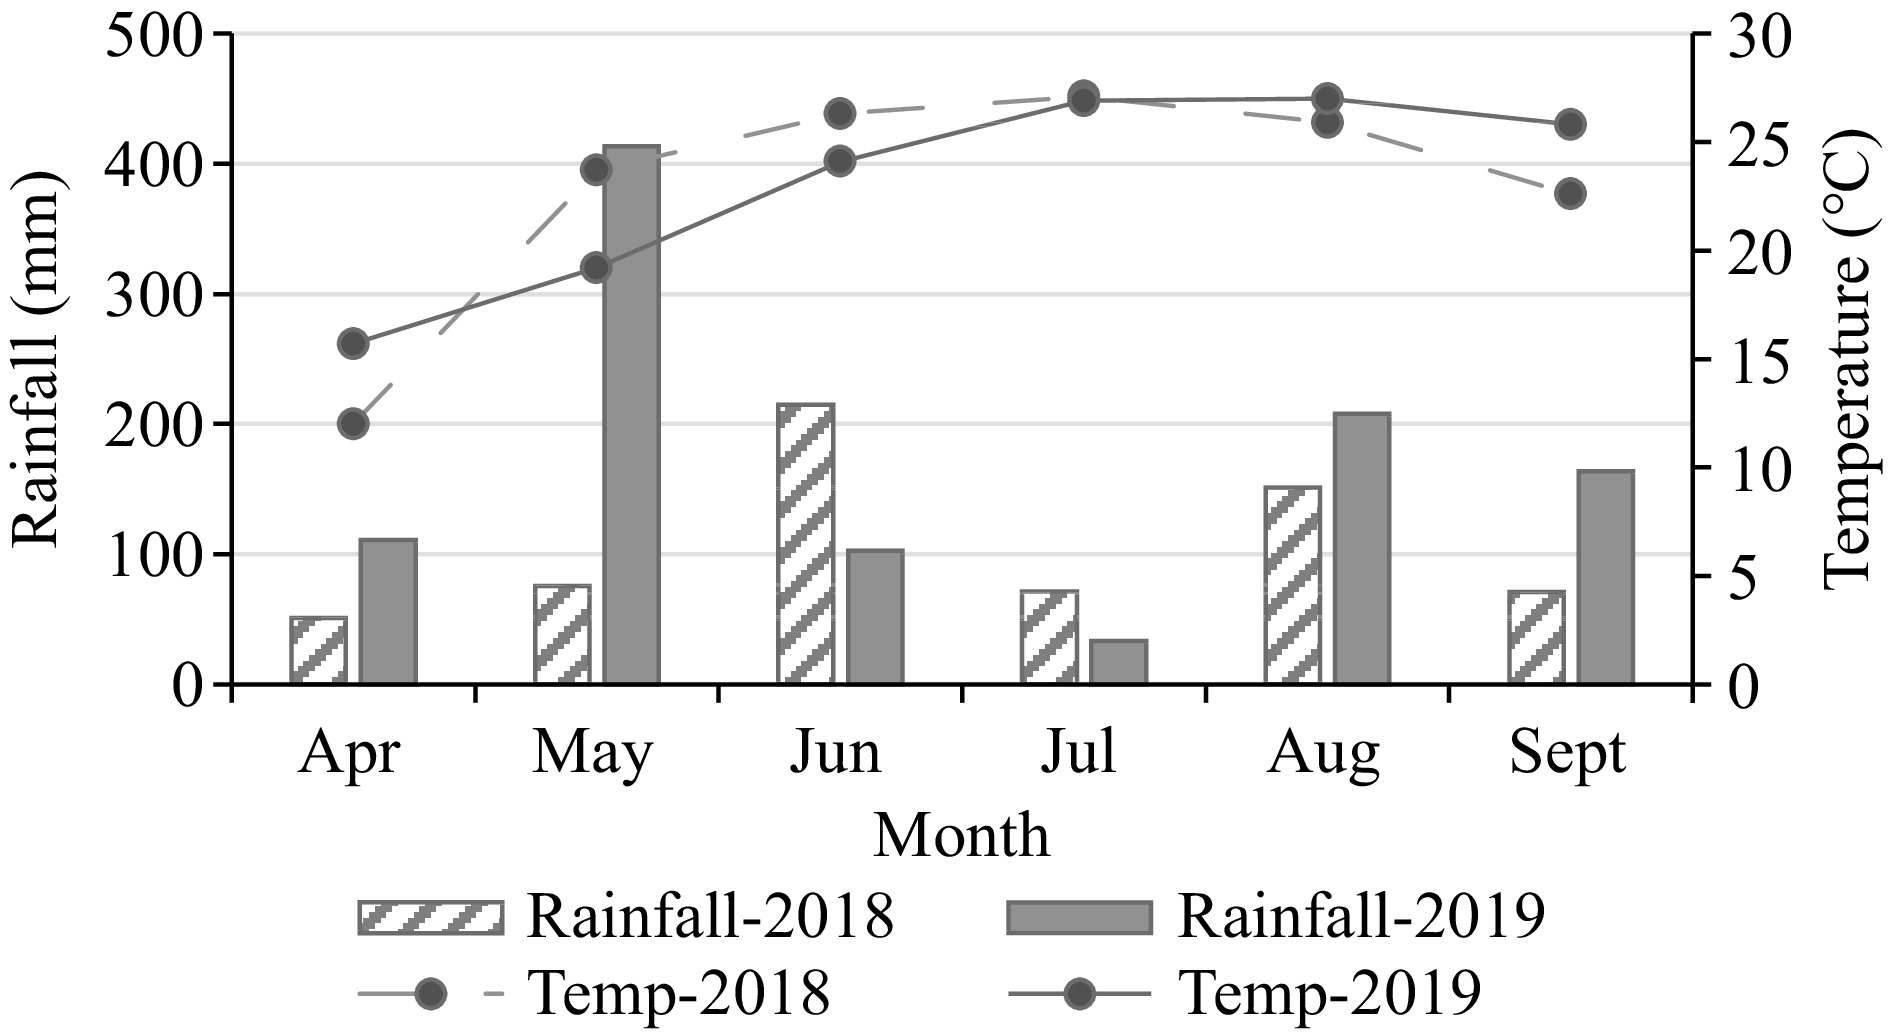
Figure 1.
Average daily air temperature and total monthly rainfall (April, May, June, July, August, and September) in 2018 and 2019 at Lake Carl Blackwell (LCB), OK, USA.
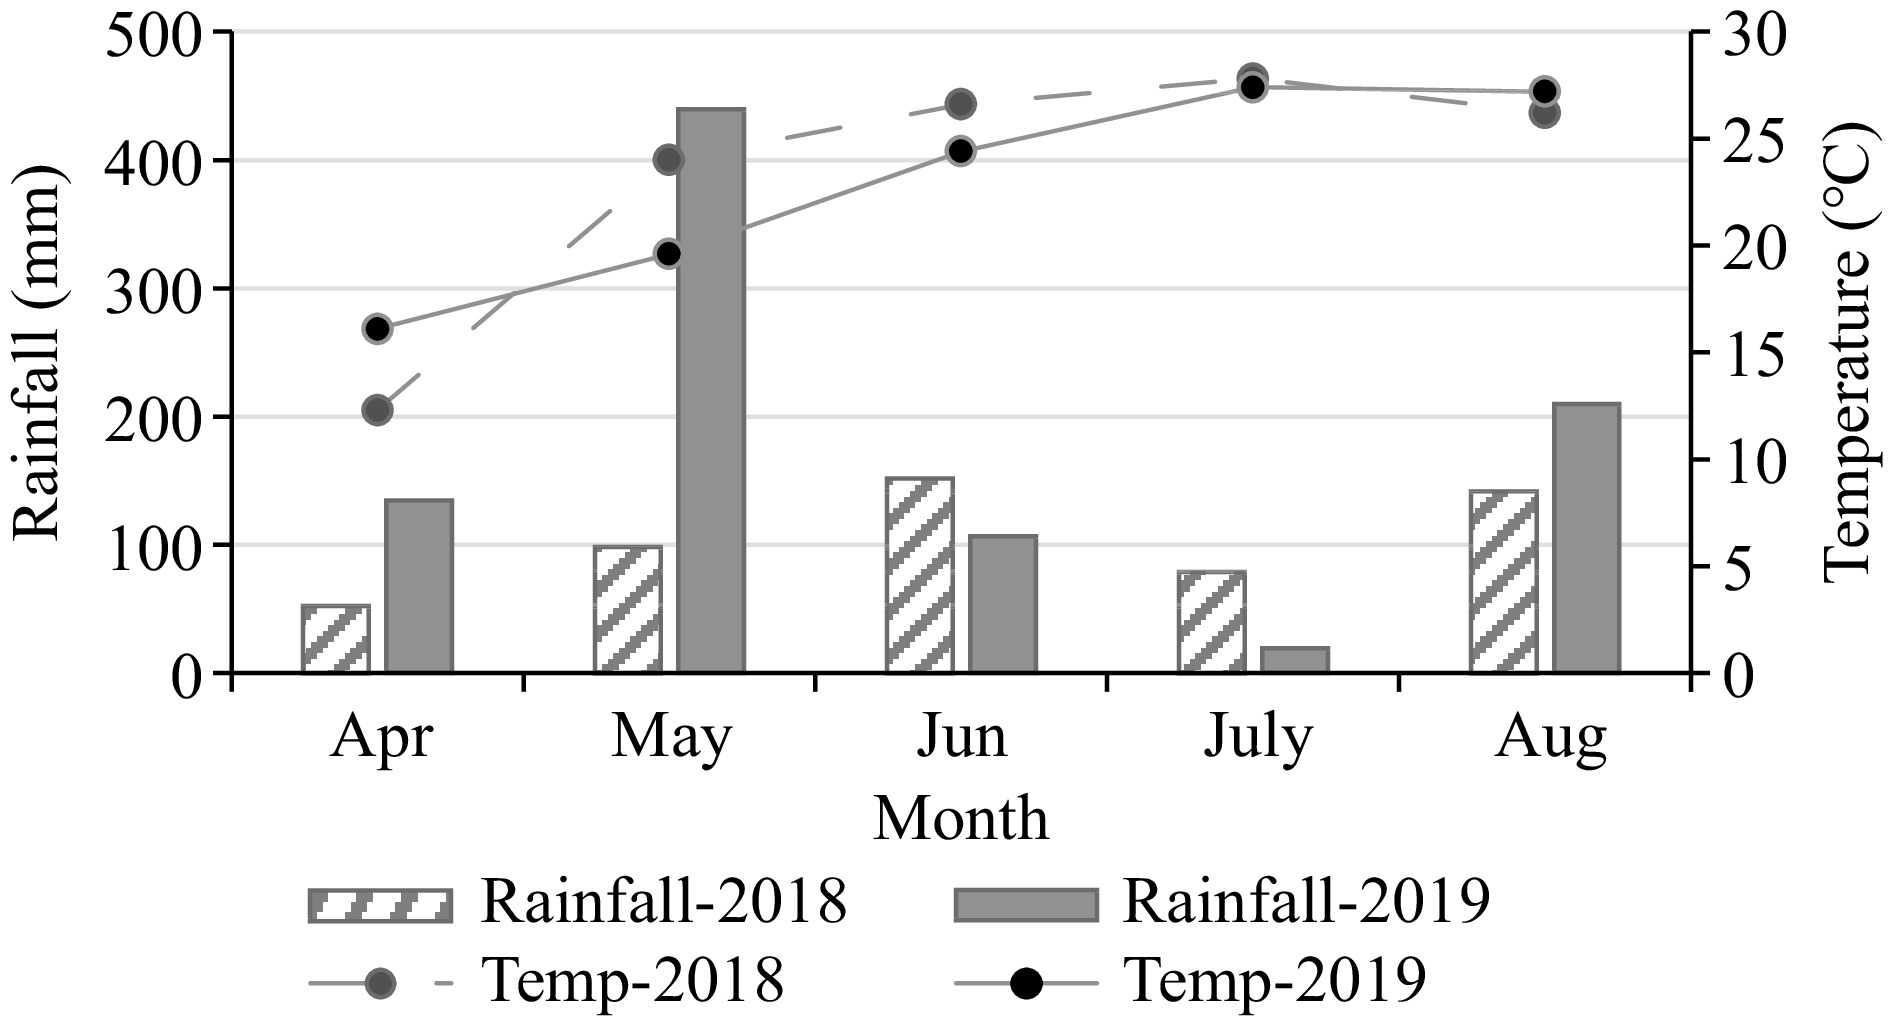
Figure 2.
Average daily air temperature and total monthly rainfall (April, May, June, July, and August) in 2018 and 2019 at Efaw Research station OK, USA.
Data collection and analysis
-
After maize grain harvest, soil samples (15−20 cores) were taken from a plough layer (0−15 cm) per plot and composited into one sample. Fresh samples were sieved through a 2-mm screen, oven-dried for 48 h at 65 °C, and ground to pass a 1-mm sieve. The soil exchangeable cations (Ca, K, and Mg) were extracted with Mehlich 3 solution[26]. The extracts were filtered with 0.45-μm filters, and the cation levels were determined with an inductively coupled plasma optical emission spectrometers (ICP-OES). The ICP-OES analyzer SPECTRO ARCOS FHS26 (SPECTRO/AMETEK, Kleve, Germany) was used. The soil CEC was estimated using an indirect method by summing up the exchangeable cations as indicated in Eq. 1[27].
$ \begin{aligned}\mathrm{C}\mathrm{E}\mathrm{C}\left(\mathrm{m}\mathrm{e}\mathrm{q}100\mathrm{g}-1\right)=&\;\frac{\mathrm{C}\mathrm{a}\left(\mathrm{m}\mathrm{g}\;\mathrm{k}\mathrm{g}-1\right)}{200}+\frac{\mathrm{M}\mathrm{g}\;(\mathrm{m}\mathrm{g}\mathrm{k}\mathrm{g}-1)}{120}\\+&\;\frac{\mathrm{K}\left(\mathrm{m}\mathrm{g}\;\mathrm{k}\mathrm{g}-1\right)}{390}\end{aligned} $ (1) Using distilled water at a soil to water ratio of 1:2, the EC (µS/cm) and pH were determined concurrently with a Seven Excellence dual EC-pH meter (METTLER TOLEDO, Schwerzenbach, Switzerland).
Statistical analysis
-
The analysis of variance (ANOVA) was completed using the general linear model (GLM) procedure of the SAS statistical package[28]. The GLM model was chosen for its flexibility in combing linear and non-linear response using link function. The assumptions were normality, independence, and randomness of the data. The analyses were done independently for each year and location. Using single-degree-of-freedom orthogonal contrasts, comparisons were made between treatment means from N plus biochar (NB) and N fertilizer (NF)[29]. For each treatment, the standard error (SE) of means were calculated to determine the extent of variation between treatments. Additionally, the coefficient of variation (CV) was used to indicate the extent of variability across treatments.
-
In 2018, the contrast analysis at LCB for all N rate revealed a significant difference (p = 0.0132) between NB and NF (Table 2). Considering each fertilizer rate, no significant difference was seen at 50 kg N ha−1 (p = 0.7253) while differences were significant at 100 kg·N·ha−1 (p = 0.0317) and 150 kg N ha−1 (p = 0.0446). The CEC was higher with NB than NF by 4%, 24%, and 23% at 50, 100, and 150 kg·N·ha−1, respectively. Highest CEC (8.2 meq/100 g soil) was at 150 kg·N·ha−1 with NB and lowest (6.2 meq/100 g soil) at 100 kg·N·ha−1 with NF. In 2019, contrast between NB and NF for all N rate revealed a significant difference (p = 0.0091) in soil CEC (Table 2). At 50 kg·N·ha−1, no significant difference (p = 0.6641) was seen while differences were significant at 100 kg·N·ha−1 (p = 0.0372) and 150 kg·N·ha−1 (p = 0.0237). The soil CEC were higher with NB than NF by 4%, 20%, and 22% at 50, 100, and 150 kg·N·ha−1, respectively. The observed CEC was highest (10.2 meq/100 g soil) with NB at 100 and 150 kg·N·ha−1 and lowest (7.9 meq/100 g soil) with NF at 100 and 150 kg·N·ha−1.
Table 2. Treatment means for cation exchange capacity (CEC) and contrasts between fertilizer N (NF) and biochar plus fertilizer N (NB) at Efaw and Lake Carl Blackwell (LCB), OK, USA, 2018 and 2019.
Exp. Trt. N rate
(kg·ha−1)Biochar
(t·ha−1)CEC (meq/100 g ) at Efaw CEC (meq/100 g ) at LCB 2018 2019 2018 2019 Mean ± S.E. Mean ± S.E. Mean ± S.E. Mean ± S.E. 1 0 0 11.08 0.4 11.52 0.51 6.7 0.76 8.47 0.61 2 50 0 10.3 0.35 11.17 0.59 6.71 0.91 8.66 1.09 3 100 0 11.18 0.51 12.3 0.44 6.21 0.37 7.87 0.27 4 150 0 10.64 0.21 11.31 0.33 6.27 0.52 7.93 0.64 5 0 5 11.27 0.35 11.94 0.51 7.46 0.54 9.68 0.53 6 0 10 10.99 0.34 11.96 0.66 6.99 1.56 9.66 2.16 7 0 15 11.54 0.98 11.01 0.42 7.07 0.45 9.33 0.74 8 50 5 10.95 0.42 11.38 0.24 7.01 0.86 8.55 0.55 9 100 10 11.45 0.62 12.38 0.36 8.2 0.23 10.23 0.18 10 150 15 11.49 0.25 12.28 0.4 7.78 0.36 10.16 0.5 Pr > F 0.7552 0.3372 0.7021 0.5131 C.V., % 7.7 6.8 18.5 17.2 Contrasts F Pr > F F Pr > F F Pr > F F Pr > F 2 vs 8 1.17 0.3014 0.14 0.7138 0.13 0.7253 0.2 0.6641 3 vs 9 0.21 0.6579 0.02 0.8813 5.91 0.0317 5.49 0.0372 4 vs 10 2.04 0.1782 2.77 0.1222 5.03 0.0446 6.7 0.0237 2, 3 and 4 vs 8, 9 and 10 2.93 0.1127 1.6 0.2299 8.44 0.0132 9.64 0.0091 Exp. Trt., Experimental treatment; C.V., Coefficient of variation; S.E., standard error (± S.E., n = 3); Urea ammonium N (28:0:0) was used as N source. Biochar was applied after urea ammonium N and mixed within a 15 cm soil layer. In 2018, the ANOVA at Efaw site did not reveal any significant difference (p = 0.7552) in soil CEC between the treatments (Table 2). At each application rate, CEC was greater with NB than NF by 6%, 2%, and 7% at 50, 100, and 150 kg·N·ha−1, respectively. The soil CEC was highest (11.5 meq/100 g soil) with NB at 100 and 150 kg·N·ha−1 and lowest (10.3 meq/100 g soil) with NF at 50 kg·N·ha−1. The ANOVA in 2019 yielded similar observation to that of 2018 with no overall significant difference (p = 0.3372) among treatments (Table 2). Results showed higher CEC with NB than NF by 2%, 1%, and 8% at 50, 100, and 150 kg·N·ha−1, respectively. The CEC was highest (12.4 meq/100 g soil) with NB at 100 kg·N·ha−1 lowest (11.0 meq/100 g soil) with NF at 15 t·ha−1 of biochar. Generally, the CEC in 2019 was higher than that of 2018, perhaps because of the cumulative beneficial effect of adding biochar in the second year.
pH
-
The contrast analysis at LCB in 2018 indicates a significant difference between NB and NF at 150 kg·N·ha−1 (p = 0.0003). The observed pH was higher under NB than NF by 3%, 1%, and 7% at 50, 100, and 150 kg·N·ha−1, respectively. The highest pH (6.2) was observed with NB at 150 kg·N·ha−1 while the lowest soil pH (5.7) was observed with NF at 150 kg·N·ha−1. The ANOVA in 2019 showed an overall significant (p = 0.0498) treatment difference (Table 3). Contrast analysis combing all N rates showed significant difference (p = 0.0035) between NB and NF. Significant differences were seen at 100 kg·N·ha−1 (p = 0.0383) and 150 kg·N·ha−1 (p = 0.0122). Compared to NF, soil pH was higher with NB by 3 and 4% at 100 and 150 kg·N·ha−1, respectively. The pH was highest (6.0) at 150 kg·N·ha−1 with NB and lowest (5.7) with NF.
Table 3. Treatment means for pH and contrasts between fertilizer N (NF) and biochar plus fertilizer N (NB) at Efaw and Lake Carl Blackwell (LCB), OK, USA, 2018 and 2019.
N rate
(kg·ha−1)Biochar
(t ha−1)pH at Efaw pH at LCB 2018 2019 2018 2019 Mean ± S.E. Mean ± S.E. Mean ± S.E. Mean ± S.E. 0 0 5.74 0.06 5.65 0.22 5.82 0.08 5.79 0.03 50 0 5.7 0.02 5.75 0.11 5.76 0.06 5.83 0.09 100 0 5.87 0.06 5.76 0.1 5.88 0.08 5.75 0.06 150 0 5.64 0.03 5.6 0.01 5.72 0.04 5.7 0.03 0 5 5.83 0.02 5.8 0.11 5.85 0.07 5.89 0.01 0 10 5.93 0.07 5.97 0.17 5.92 0.15 5.85 0.05 0 15 5.98 0.12 5.83 0.1 5.87 0.11 5.95 0.05 50 5 5.8 0.1 5.83 0.03 5.93 0.11 5.91 0.07 100 10 5.98 0.09 5.99 0.05 5.91 0.02 5.95 0.08 150 15 6.1 0.07 5.95 0.13 6.18 0.02 5.96 0.02 0.0063 0.0641 0.0761 0.0498 2.2 2.5 2.5 1.8 F Pr > F F Pr > F F Pr > F F Pr > F 1.04 0.329 0.45 0.5134 3.54 0.0842 1.02 0.3332 1.3 0.2756 3.75 0.0768 0.09 0.765 5.41 0.0383 21.81 0.0005 8.52 0.0129 25.66 0.0003 8.69 0.0122 2, 3 & 4 vs 8, 9 & 10 15.55 0.002 10.19 0.0078 17.54 0.0013 13.15 0.0035 Exp. Trt., Experimental treatment; C.V., Coefficient of variation; S.E., standard error (± SE, n = 3); Urea ammonium N (28:0:0) was used as N source. Biochar was applied after urea ammonium N and mixed within a 15 cm layer. In 2018, the ANOVA at Efaw revealed an overall significant difference in pH (p = 0.0063) between treatments (Table 3). Similarly, contrast for all N rates showed a significant difference between NB and NF (p = 0.002). Considering each fertilizer rate, no significant differences was seen at 50 kg·N·ha−1 (p = 0.329) and 100 kg·N·ha−1 (p = 0.2756) while significant difference was seen at 150 kg·N·ha−1 (p = 0.0005). Soil pH was higher with NB than NF by 2%, 2%, and 8% at 50, 100, and 150 kg·N·ha−1, respectively. Soil pH was highest (6.1) with NB at 150 kg·N·ha−1 and lowest (5.6) with NF at 150 kg·N·ha−1. In 2019, the contrast analysis revealed an overall significant difference (p = 0.0078) between NB and NF (Table 3). Contrasts between NB and NF did not indicate significant differences at 50 kg·N·ha−1 (p = 0.5134) and 100 kg·N·ha−1 (p = 0.0768) while significant difference was observed at 150 kg·N·ha−1 (p = 0.0129). Higher soil pH was seen with NB than NF by 1%, 4%, and 6% at 50, 100, and 150 kg·N·ha−1, respectively. The highest pH (6.0) was observed at 100 kg·N·ha−1 with NB and the lowest (5.6) was seen at 150 kg·N·ha−1 with NF
Electrical conductivity
-
In 2018, ANOVA at Efaw did not reveal any significant difference (p = 0.6668) in soil EC between treatments (Table 4). Soil EC was slightly higher with NB than NF by 2%, 1%, and 2% at 50, 100, and 150 kg·N·ha−1, respectively. Soil EC was highest (224 µS·cm−1) with NB at 150 kg·N·ha−1 and lowest (184 µS·cm−1) under the control treatment. The ANOVA in 2019 was similar to that of 2018 with no significant difference (p = 0.1856) among treatments (Table 4). Soil EC was lower with NB than NF by 5%, 2%, and 25% at 50, 100, and 150 kg·N·ha−1, respectively. The highest EC (126 µS·cm−1) was registered at 100 kg·N·ha−1 with NF and the lowest (83 µS·cm−1) was registered at 150 kg·N·ha−1 with NB.
Table 4. Treatment means for soil electrical conductivity (EC) and contrasts between fertilizer N (NF) and fertilizer N plus biochar (NB) at Efaw and Lake Carl Blackwell (LCB), OK, USA, 2018 and 2019.
Exp. Trt. N rate
(kg·ha−1)Biochar
(t·ha−1)EC (µS·cm−1) at Efaw EC (µS·cm−1) at LCB 2018 2019 2018 2019 Mean ± S.E. Mean ± S.E. Mean ± S.E. Mean ± S.E. 1 0 0 184.37 14.84 161.6 47.32 171.6 21.44 106.4 6.31 2 50 0 196.13 10.2 118.63 10.42 175.73 30.66 105.57 7.95 3 100 0 199.67 21.14 125.63 4.36 170.07 21.93 108.13 9.17 4 150 0 220.67 8.97 103.3 5.06 160.6 11.6 110.07 6.88 5 0 5 213.37 11.79 106.27 7.55 186.3 10.07 128.67 2.38 6 0 10 246.57 54.98 118.73 5.12 186.3 32.66 119.8 5.25 7 0 15 185.23 6.87 109.47 1.38 182.33 16.12 119.73 1.87 8 50 5 200.67 15.37 112.97 12.99 176.03 4.42 108.43 5.64 9 100 10 200.87 18.93 123.37 4.57 196.73 12.94 118.27 5.84 10 150 15 224.47 18.16 82.83 22.53 164.83 7.17 123.53 5.12 Pr > F 0.6668 0.1856 0.9552 0.4464 C.V., % 18.7 18.6 18.8 10.7 Contrasts F Pr > F F Pr > F F Pr > F F Pr > F 2 vs 8 0.04 0.8455 0.11 0.7423 0 0.9904 0.09 0.7743 3 vs 9 0 0.9588 0.02 0.8951 1.19 0.2969 1.07 0.3203 4 vs 10 0.03 0.8702 1.48 0.2475 0.03 0.8654 1.9 0.1934 2, 3 & 4 vs 8, 9 & 10 0.06 0.8131 0.95 0.3494 0.54 0.4755 2.44 0.1439 Exp. Trt., Experimental treatment; C.V., Coefficient of variation; S.E., standard error (± S.E., n = 3); Urea ammonium N (28:0:0) was used as a source of N. Biochar was applied after urea ammonium N and mixed within a 15 cm layer. The ANOVA at LCB in 2018 did not reveal any significant difference (p = 0.9552) in soil EC between treatments (Table 4). Soil EC was higher with NB than NF by 13% and 3% at 100 and 150 kg·N·ha−1, respectively. The highest soil EC of 197 µS·cm−1 was observed with NB while the lowest of 160 µS·cm−1 was observed with NF. The 2019 ANOVA result was similar to that of 2018 with no significant difference among treatments. The observed soil EC was higher with NB than with NF by 3%, 9%, and 11%, at 50, 100, and 150 kg·N·ha−1, respectively. The highest EC of 129 µS·cm−1 was seen under the control treatment while the lowest of 105 µS·cm−1 was seen with NF at 50 kg·N·ha−1.
-
Generally, soil CEC was higher with biochar addition by 10.3%. While the positive impact of biochar was notable, this was not consistently observed in all sites. Several studies on biochar reported comparable findings[8,9,30]. For instance, Xu et al.[31] observed an increase in CEC of soil treated with biochar made from various feedstock between 19% and 83%. The variance in the observations was due to differences in the type of soil and feedstock. With biochar amendment rates of 52, 104, and 156 t·ha−1, Chintala et al.[19] reported that biochar made from maize stover increased CEC by 87%, 120%, and 142% whereas biochar made from switchgrass by 58%, 89%, and 122%, respectively. Cornelissen et al.[32] observed an increase of 60% in CEC of soils treated with maize cob and wood feedstock. In the present study, CEC significantly increased on sites with sandy loam soil compared to silty clay loam. The increase in CEC after biochar amendment is attributed to the oxidation of aromatic carbon and formation of carboxyl groups[9]. This change in the functional properties of biochar increases the adsorption capacity as a result of increased negative charges on biochar surfaces. Further, Lawrinenko & Laird[33] noted that hydroxyl and carbonyl functional groups are believed to contribute to biochar CEC as they carry negative charges that sorbs base cations. Thus, increased CEC with biochar amendment enhances the adsorption of cations compared to soils not treated with biochar. Compared to other findings, our study reports lower CEC under biochar treatment probably because we used pine wood as biochar feedstock produced at a fixed pyrolysis temperature of 500 °C, perhaps our most important limitation. Additionally, the timing of soil sample collection could have had an impact on the leachable base cations that were used to compute the CEC of the studied soils.
pH
-
The pH of the soil was significantly increased with the addition of biochar compared to treatments that only received fertilizer N. The soil pH increased by approximately 0.2 units across experimental locations. This was mostly under treatment with 15 t·ha−1 of biochar. Similar studies emphasize that the effectiveness of biochar in increasing pH depends on feedstock type, pyrolysis parameters (time and temperature). For instance, Chintala et al.[19] reported larger increases in pH of an acidic soil treated with switchgrass biochar compared to that treated with maize stover biochar. Similarly, Yuan & Xu[20] observed greater increase in pH of soil treated with biochar from the legume feedstock compared with that from non‐legume source. The small increase in pH observed in this study is consistent with the pH of the pinewood biochar (7.4) used. The mechanism for the reduction in soil acidity following biochar soil treatment has been previously suggested. Chintala et al.[19] noted that biochar has higher proton consumption capacity that increases soil pH hence decrease in exchangeable acidity. Because of increased negative charges on biochar surfaces, the adsorption capacity will be enhanced. In the current study, CEC was evidently enhanced with biochar addition compared to the untreated soils. In addition to increase in soil pH, Chan et al.[34] noted that biochar releases base cations that potentially replace exchangeable acidity on the soil surface. This implies that use of pinewood biochar produced at pyrolysis temperature of 500 °C below 15 t ha−1 may not cause a significant change in soil pH.
Electrical conductivity
-
The addition of biochar did not significantly affect soil EC in the current study. This contrasts with an observation by Burrell et al.[35] that use of wood biochar increased soil EC. This is probably because the authors applied up 39 t·ha−1 of biochar which is twice the maximum rate of 15 t·ha−1 used in the current study. Several studies document that most crop plants are susceptible to salt stress at EC levels above 4 dS·m−1[36−38]. Nonetheless, it is important to note that maize specifically has lower tolerance level where grain yield starts to decrease at EC greater than 2 dS·m−1[36,39]. Soil EC above plant tolerance level induces ion toxicity, osmotic stress, and plant nutrient deficiency[40]. In the current study, lower soil EC was recorded in the second year compared to the first year of the trial. This is possibly due to the period of soil sample collections. Soil sampling in 2019 was conducted immediately after a high rainfall (200 mm) in August. This might have reduced the levels of soluble salts soil. With the average EC less than 200 µS·cm−1 (2.0 dS·m−1), the observed soil EC was evidently below the limit of 400 µS·cm−1 (4 dS·m−1) to be considered as saline at the highest biochar application rate of 15 t·ha−1. Therefore, it is evident that applying pine wood biochar produced at pyrolysis temperature of 500 °C does not raise soil EC level that can negatively affect crop growth.
-
This study compared the sole application of inorganic fertilizer N (NF) and simultaneous application of inorganic N with biochar (NB) on soil CEC, pH, and EC. Overall, results showed positive and better response of soil CEC, pH, and EC to NB compared to NF. Under both NB and NF, soil CEC, pH and EC increased with application rate. When results were averaged across experimental sites, soil CEC, pH, and EC increased under NB by 10%, 4%, and 1%, respectively compared to NF. Nonetheless, significant responses of CEC to the addition of biochar were mostly observed at LCB location with sandy loam soil while responses at Efaw location with silty clay loam was not significant. This indicates the significance of biochar in improving the retention capacity of coarse textured soils. With the highest biochar rate (15 t·ha−1), average EC was < 2 dS·m−1. This soil EC is less than the 4 dS/m limit to be classified as a saline soil. In addition, soil pH increased by 0.3 units at maximum biochar application rate. This suggests potential use of biochar to ameliorate soil acidity and could be beneficial under long-term nitrogen fertilizer application where soil acidity is known to increase due to the oxidation of ammonium ion.
-
The authors confirm contribution to the paper as follows: Conceptualization, Methodology, Investigation, Writing − original draft, Writing – review and editing: Omara P; Visualization, review & editing: Singh H, Singh K, Sharma L, Otim F, Obia A. All authors reviewed the results and approved the final version of the manuscript.
-
The data used in this study is free from any conflict of interest. The data is available from the corresponding author upon reasonable request.
-
The authors declare that they have no conflict of interest.
- Copyright: © 2023 by the author(s). Published by Maximum Academic Press, Fayetteville, GA. This article is an open access article distributed under Creative Commons Attribution License (CC BY 4.0), visit https://creativecommons.org/licenses/by/4.0/.
-
About this article
Cite this article
Omara P, Singh H, Singh K, Sharma L, Otim F, et al. 2023. Short-term effect of field application of biochar on cation exchange capacity, pH, and electrical conductivity of sandy and clay loam temperate soils. Technology in Agronomy 3:16 doi: 10.48130/TIA-2023-0016 

Short-term effect of field application of biochar on cation exchange capacity, pH, and electrical conductivity of sandy and clay loam temperate soils
- Received: 20 October 2023
- Accepted: 13 November 2023
- Published online: 05 December 2023
Abstract: Biochar soil amendment is known to improve soil chemical properties. Synchronized addition of biochar and mineral fertilizer nitrogen (N) could increase agronomic benefits and remedy the adverse environmental impact of fertilizer N. The objective of this study was to compare the short-term effect of a synchronized addition of biochar and fertilizer N (NB) with sole N fertilizer (NF) on cation exchange capacity (CEC), pH, and electrical conductivity (EC). We hypothesized that mixing biochar with inorganic N would improve the CEC, pH, and EC of sandy soils. Soil samples were taken at the end of the cropping season of 2018 and 2019 from Efaw and Lake Carl Blackwell (LCB), OK, USA following maize (Zea mays L.) grain harvest. The study had ten treatments and used a randomized complete block design with three replications. Biochar and N rates were 5, 10, and 15 t·ha−1, and 50, 100, and 150 kg·N·ha−1, respectively. Overall, results indicated significant improvement in CEC and pH under NB. At Efaw, CEC and pH were greater with NB by 4%, than NF while EC was lower with NB by 5%. At LCB, CEC, pH, and EC values with NB increased by 16%, 3%, and 7%, respectively compared to NF. Averaged across experimental sites, CEC, pH, and EC increased with NB by 10%, 4%, and 1%, respectively compared to NF. Significant responses of CEC to biochar addition were observed on coarse soil texture (p < 0.05). Alongside increasing the retention of nutrient cations, the significant increase in pH (p < 0.05) suggest that synchronized application of biochar and inorganic N could alleviate soil acidity. In the future, the amount of N fertilizer used in sandy soils may reduce under biochar application.
-
Key words:
- Biochar /
- Short-term effect /
- Mineral nitrogen /
- Cation exchange capacity /
- pH /
- Soil electrical conductivity