


-
Light is the main effector in photosynthesis essential for tomato growth, development and metabolite accumulation. The quality of metabolite accumulation largely depends on light intensity[1, 2]; therefore, it is important to study the influence of light intensity on fruit quality. Managing the use of light energy in photosynthesis is a key concept in regulating photosynthesis[3]. Various mechanisms have been developed to protect the light system from the potentially damaging effects of high levels of radiation that occur in the natural environment. Although photoinhibition may not be as common in nature as previously thought, the protective components of non-photochemical quenching (NPQ) provide harmless healing[4], and thus understanding the regulation of NPQ at different leaf levels in the canopy is essential for plant productivity. It has recently been demonstrated that the acceleration of NPQ relaxation can lead to a meaningful increase in crop yields, highlighting the importance of understanding how photosynthetic efficiency is regulated[5].
The description of the light effect on plants needs to characterize its intensity, period, quality and direction. Light is of particular importance for the photosynthesis of plants as light is the main energy source for physiological functions and therefore has a huge impact on plant growth[6]. The reaction of all plants to shade is an increase in stem elongation, increase in single leaf area, a change leaf shape, increase in horizontal leaves, increase in vertical stems, branches or tills, changes in chemical composition, and an increase in root tip[7]. Various mechanisms are proposed for light regulation in plants, including redox-dependent surveillance system and biological clocks[8, 9]. However, the light regulation of metabolite-based fruit quality is rarely investigated.
The biosynthesis of the AsA pathway in plants has approximately ten enzymatic steps[10]. As shown in Fig. 1, steps 1−6 of the pathway of D-mannose/L-galactose are used for synthesizing the nucleotide sugar activation, which are considered precursors of glycoproteins and cell wall polysaccharides. Step 7 shows a specific approach, starting with the GDP-L-galactose phosphorylase encoded by the genes such as VTC2 and VTC5. GDP-L-galactose is converted by this enzyme into L-galactose-1-P. Finally, L-galactose 1-P is converted to L-ascorbic acid by GPP (L-galactose 1-P phosphate), L-GalDH (L-galactose dehydrogenase), and GLDH (L-galactose 1,4-lactone dehydrogenase).
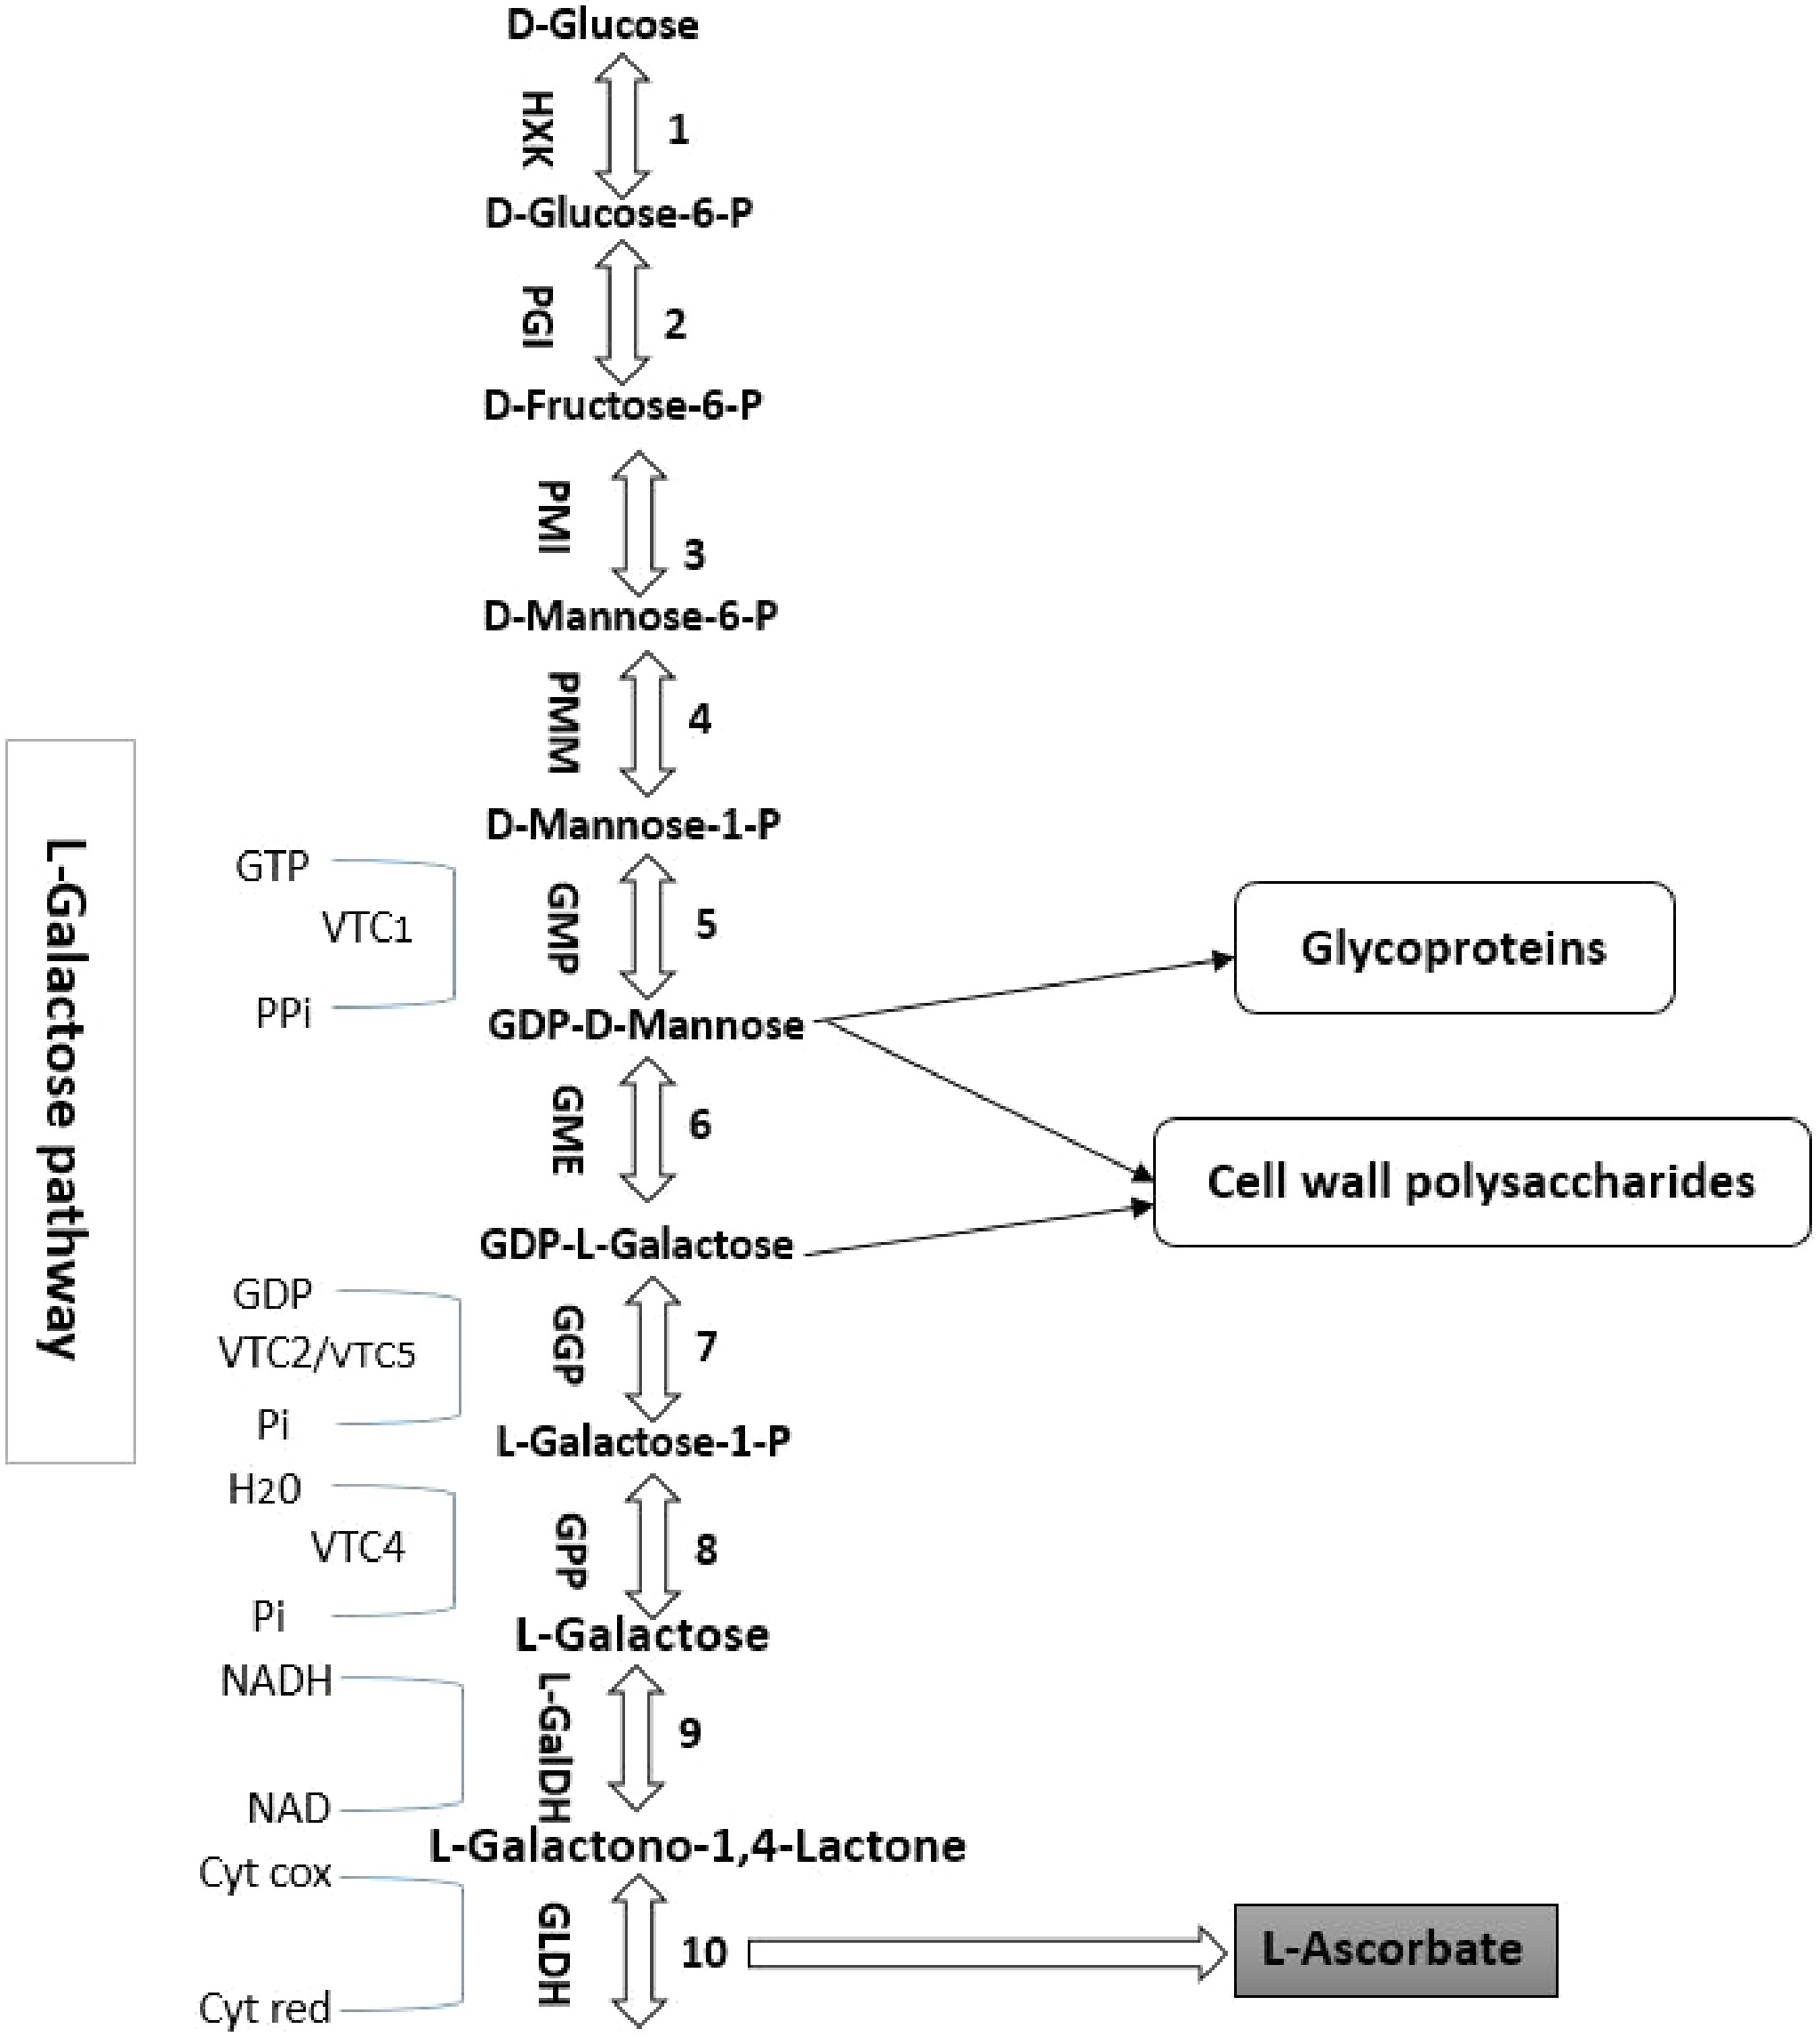
Figure 1.
The biosynthetic pathway of ascorbic acid in higher plants (D-mannose/L-galactose pathway). The reactions catalyzed by the enzymes are numbered as follows: 1. HXK (hexokinase); 2. PGI (phosphoglucose isomerase); 3. PMI (phosphomannose isomerase); 4. PMM (phosphomannomutase); 5. GMP (GDP-D-mannose pyrophosphorylase); 6. GME (GDP-D-mannose 30,50-epimerase); 7. GGP (GDP-L-galactose phosphorylase); 8. GPP (L-galactose-1-P phosphatase); 9. L-GalDH (L-galactose dehydrogenase); 10. GLDH (L-galactono-1,4-lactone dehydrogenase). VTC2 and VTC5 catalyze the first commitment step in the synthesis of GGP from L-ascorbic acid (step 7).
The synthesis of AsA under light regulation in fruits is little understood. The light regulation of AsA synthesis is more complicated with regards to the leaves: the changes in fruit AsA content may be caused by light regulation of AsA biosynthetic gene expression and AsA intake from leaf to fruit[11]. In tomato, leaf covering has already been shown to be significant for fruit AsA synthesis on AsA transport from leaves[12]. However the molecular mechanism or how light intensity in leaves affects the AsA accmulation in fruit is not well understood. The current work illustrates the interaction between different stages of tomato fruits and light intensity in leaf, fruit and both (fruit and leaf), and their impact on the accumulation of AsA content and AsA biosynthetic gene expression in the fruit. Our experiment discovered the effect of leaf shading, fruit shading and both types of shading combined, on the accumulation of AsA content and AsA biosyntheic gene expression at the immature green (IMG), mature green (MG), breaker (BR), and red ripe (RR) stages of fruits.
-
Seeds of Ailsa Craig tomato cultivar were pre-germinated and sowed in trays in a plant growth room of the horticulture department of Huazhong Agricultural University in 2019. The seedlings were transferred to pots with humus soil substrates in the National Vegetable Improvement Center greenhouse. Tomato plants were pruned to one vein. Plant nutrition, pest, and disease control were carried out following local commercial practices. The inflorescences were pruned to ten flowers after anthesis to obtain ten fruits per cluster.
Shading treatment and light intensity measurements
-
A perforated black cover, which reduces the light by 72%, was used for shading of the tomato plants. Four treatments of un-shading (US), leaf shading (LS), fruit shading (FS), and both leaf and fruit shading (BS) were applied to 80 plants with 20 plants per treatment. The shading process started immediately after the formation of the fruits. To better identify the fruit stages, all of the desirable trusses were labeled. Light intensity was measured three times a day (9:00 am, 12:00 pm and 5:00 pm) during the plant's growth (Supplemental Fig. S1).
Sample collection
-
Tomato fruits were harvested at immature green (IMG), mature green (MG), breaker (BR), and red ripe (RR) stages respectively (Supplemental Fig. S2). Due to different ripening process under different shading treatment, fruits were harvested according to their own ripening stages. Fruits were harvested 18, 25, 35 and 45 days after the shading for FS fruits, 17, 24, 34 and 44 days after shading for LS fruits, 19, 26, 36 and 46 days after shading for BS fruits, and 14, 21, 30 and 41 days after shading for US fruits. The samples were immediately frozen in liquid nitrogen and stored at −80˚C until use.
Ascorbic acid determination
-
Assays of AsA were performed following previous works by Rizzolo et al.[13]. The fruit samples were shredded in liquid nitrogen, using 5 mL of ice-cold 0.1% (W/v) HPO3. samples were homogenized into a powder (0.2−1 g). AsA extraction was performed for about half an hour and centrifuged at 12,000 rpm for 10 min at 4 °C. The supernatant was placed on ice after filtration. Then 50 mM DL-Dithiothreitol (DTT) was added to 300 μl of the extract in a 1:1 ratio and then kept for 15 min in the dark at room temperature. High-performance liquid chromatography (HPLC) was used to determine the total AsA content in the extracts. The reduction state of AsA was measured by adding an equal volume of 0.1% (w/v) HPO3 300 µL supernatant. Acetate buffer (0.2 M, pH 4.5) with a flow rate of 1.0 ml/min was used to wash the SB-aq (Agilent) chromatographic column. A wave of 254 nm was used to detect reaction solutions. The standard curve was obtained from 2−40 μg/ml to determine the amount of AsA concentration.
RNA extraction and quantitative real time PCR
-
Total RNA of the samples was extracted using TRIzol® 117 reagent (Invitrogen, USA) and the genomic DNA was denatured using DNase before reverse transcription. Reverse transcription was carried out with 3 µg of total RNA via ReverTra Ace® reverse transcriptase (ToYoBo, Osaka, Japan), conforming to the manufacturer's guidance. Tomato β-actin gene was used as an internal control for quantitative real-time PCR (qPCR) analysis. The expression of genes related to the biosynthesis, oxidation, and recycling of AsA was analyzed by qPCR (Table 1). Gene-specific primers were designed using Primer5 software. qPCR was performed using the Roche Light Cycler 480 tracing system and the SYBR Green I Master Kit (Roche, Switzerland) according to the manufacturer's protocols. PCR amplification includes a pre-incubation step of 5 min at 95 °C, followed by 40 cycles of 95 °C for 10 s, 58 °C for 15 s, and 72 °C for 20 s using the actin gene as an internal control. The relative expression of the gene was calculated using the 2−ΔΔCᴛ method[14].
Table 1. Primers used for qPCR.
Function Gene Full name Accession No. Forward primer (5'-3') Reverse primer (5'-3') synthesis GPI glucose-6-phosphate isomerase Solyc04g076090 TGCTCTTCAAAAGCGTGTCC CGGCAATAAGTGCTCTGTCA PMI phosphomannose isomerase Solyc02g086090 TACATTGTGGTGGAACGAGGA ACCCCATTTGGCAAGAACAG PMM phosphomannomutase Solyc05g048760 TTTACCCTCCATTACATTGCTGA TCTTCTTGACTACAGTTTCTCCCA GMP GDP-D-mannose pyrophosphorylase Solyc03g096730 AAACCTGAAATCGTGATGTGAGA TGAAGAAGAGGAGAACTGGAAAC GME1 GDP-Mannose 3′,5′-epimerase1 Solyc01g097340 AATCCGACTTCCGTGAGCC CTGAGTTGCGACCACGGAC GME2 GDP-Mannose 3′,5′-epimerase2 Solyc04g077020 CCATCACATTCCAGGACCAGA CGTAATCCTCAACCCATCCTT GGP1 GDP-L-galactose-1-phosphate phosphorylase1 Solyc06g073320 GAAATCTGGTCTGTTCCTCTGTGA TTCACACACCAACTCCACATTACA GGP2 GDP-L-galactose-1-phosphate phosphorylase2 Solyc02g091510 CTGTTGTCTTGGTTGGAGGTTGT AGCACAGTCAAAACACCAACAAA GP1 L-galactose-1-phosphate phosphatase1 Solyc04g014800 AGCCGCTACAAACCCTCATCT TGTCCGCTTTCCATCTCCTAT GP2 L-galactose-1-phosphate phosphatase2 Solyc11g012410 GGTTAGGTCCCTTCGTATGTG TTTCACAATCACAGCACCACC GalDH L-galactose dehydrogenase Solyc01g106450 CTTCTTACTGAGGCTGGTGGTC AACCTCTTTAACAGACTTCATCCC MIOX myo-inositol oxygenase Solyc12g008650 ACTACTCTTCCTTCTGCTGCTTTA AATGTTGAGCCACTTCATGTTCT recycling DHAR1 dehydroascorbate reductase 1 Solyc05g054760 CCTACCTTCGTCTCATTTCCG TGAACAAACATTCTGCCCATT oxidation cAPX Cytoplasm ascorbate peroxidase Solyc06g005150 TGGAGCCCATTAGGGAGCA GCCAGGGTGAAAGGGAACAT tAPX Thylakoidal ascorbate peroxidase Solyc11g018550 CTTTCTTCAATGGCTTCTCTCACCG CAACCTGGTAGCGAAACACATGGG APX1 ascorbate peroxidase 1 Solyc06g005160 TGGAGCCCATTAGGGAGCA GCCAGGGTGAAAGGGAACAT APX4 ascorbate peroxidase 4 Solyc01g111510 GGAACAGTTCCCAATCCTATCC CATAGGTTCCTGCATCATGCCACC APX5 ascorbate peroxidase 5 Solyc02g083620 AGTAGATGCAGAGTATCTGAAGGA CATAGGTTCCTGCATCATGCCACC APX7 Stromal ascorbate peroxidase 7 Solyc06g060260 CTTTCTTCAATGGCTTCTCTCACCG CAACCTGGTAGCGAAACACATGGG Actin Actin Solyc11g005330 GTCCTCTTCCAGCCATCCA ACCACTGAGCACAATGTTACCG Statistical analysis
-
Each treatment was repeated three times. The results were expressed as mean ± standard deviation. Duncan's mean test was used to calculate significant differences at the level of P < 0.05 and P < 0.01. The significance of the correlation coefficients was calculated using the Graph Pad Prism software (
www.graphpad.com/quickcalcs/ttest1.cfm ). -
The AsA content of tomato fruits under leaf shading, fruit shading, both shading, and non-shading was measured by HPLC. Leaf shading significantly decreased total AsA content by 18.5% at MG, 22.4% at BR, and 26% at RR stage of fruits relative to the control (Fig. 2a). Furthermore, the shading of leaves reduced AsA significantly by 22.2% at MG, 24.7% at BR and 25.2% at RR stages of fruits as compared to un-shaded fruits (Fig. 2b). Moreover, total AsA content in shaded fruits showed a decrease of 25.8%, 28.9%, and 30.6%, respectively at MG, BR, and RR stages of the FS fruits, relative to US fruits (Fig. 2c). The amount of reduced AsA decreased by 23.9% at MG, 26.9% at BR, and 28.2% at RR stages in shaded fruits, relative to the control (Fig. 2d). Similarly, fruits with both leaf and fruit shading exhibited a significant reduction of 26.1%, 29.4%, and 31.5% in total AsA content respectively, at MG, BR, and RR relative to the control (US) (Fig. 2e), and reduction of 25.9%, 27.7%, and 28.4% of AsA at MG, BR, and RR, respectively relative to the control (Fig. 2f).
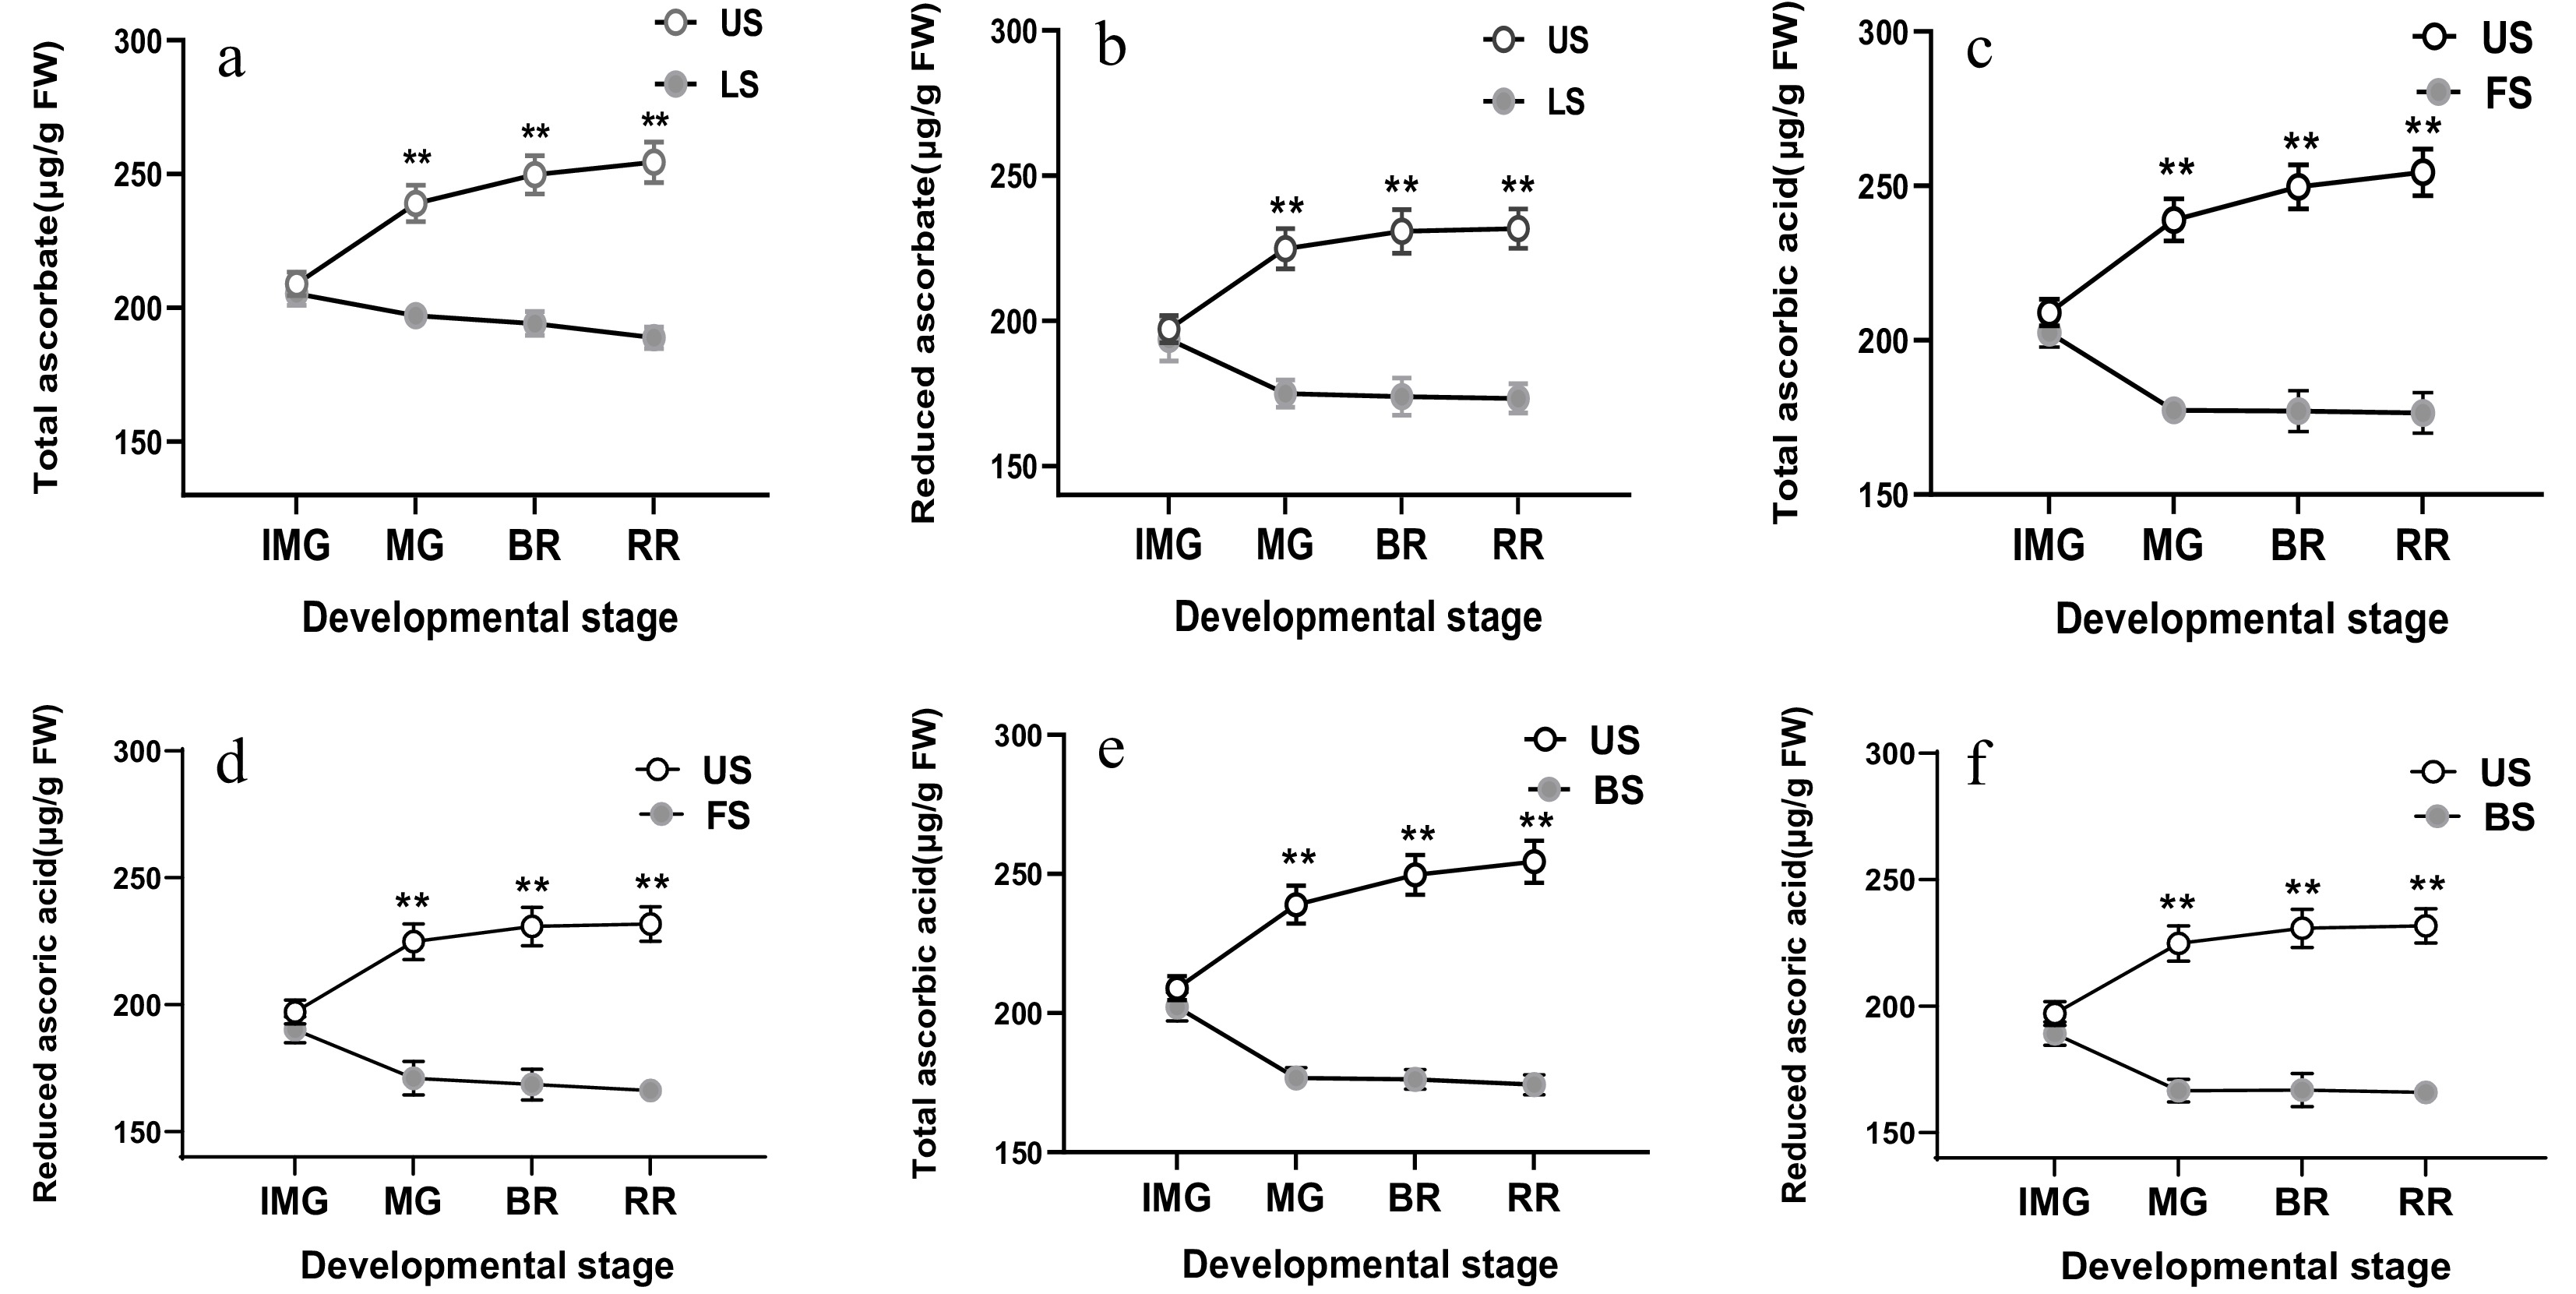
Figure 2.
Effect of leaf shading (a, b), fruit shading (c, d), and both types of shading (e, f) on total ascorbic acid (a, c, e) and reduced ascorbic acid content (b, d, f) in fruits which were harvested at immature green (IMG), mature (MG), breaker (BR) and red ripe (RR) stages of fruits in plants. LS, leaf shading; FS, fruit shading; BS, both shading. Data is presented as mean ± SD. Statistical analysis was enforced using Duncan's test. The indication of * and ** is a significant difference at P ≤ 0.05 and P ≤ 0.01, respectively.
Expression of AsA biosynthetic genes in tomato fruits under shading
-
To ascertain the molecular mechanism of prohibited AsA accumulation under shading treatment, the relative expression of AsA biosynthetic genes under different shading treatment was investigated. Under leaf shading, most of AsA biosynthetic genes showed a decreased expression in one or two developmental stages relative to the control. For example, in fruits with leaf shading, the expression levels of GPI and PMI genes showed a significant reduction in the MG stage relative to control. For the GME1, GME2 and GP1 genes, a significantly lower expression than the control at the MG and RR stages was observed. More importantly, the expression of GalDH and MIOX was observed to be lower than the control at three developmental stages, suggesting these two genes might play a more important role in AsA biosynthesis in tomato fruit. There was one exception that GMP showed upregulation by leaf shading at the RR stage relative to the control (Fig. 3).
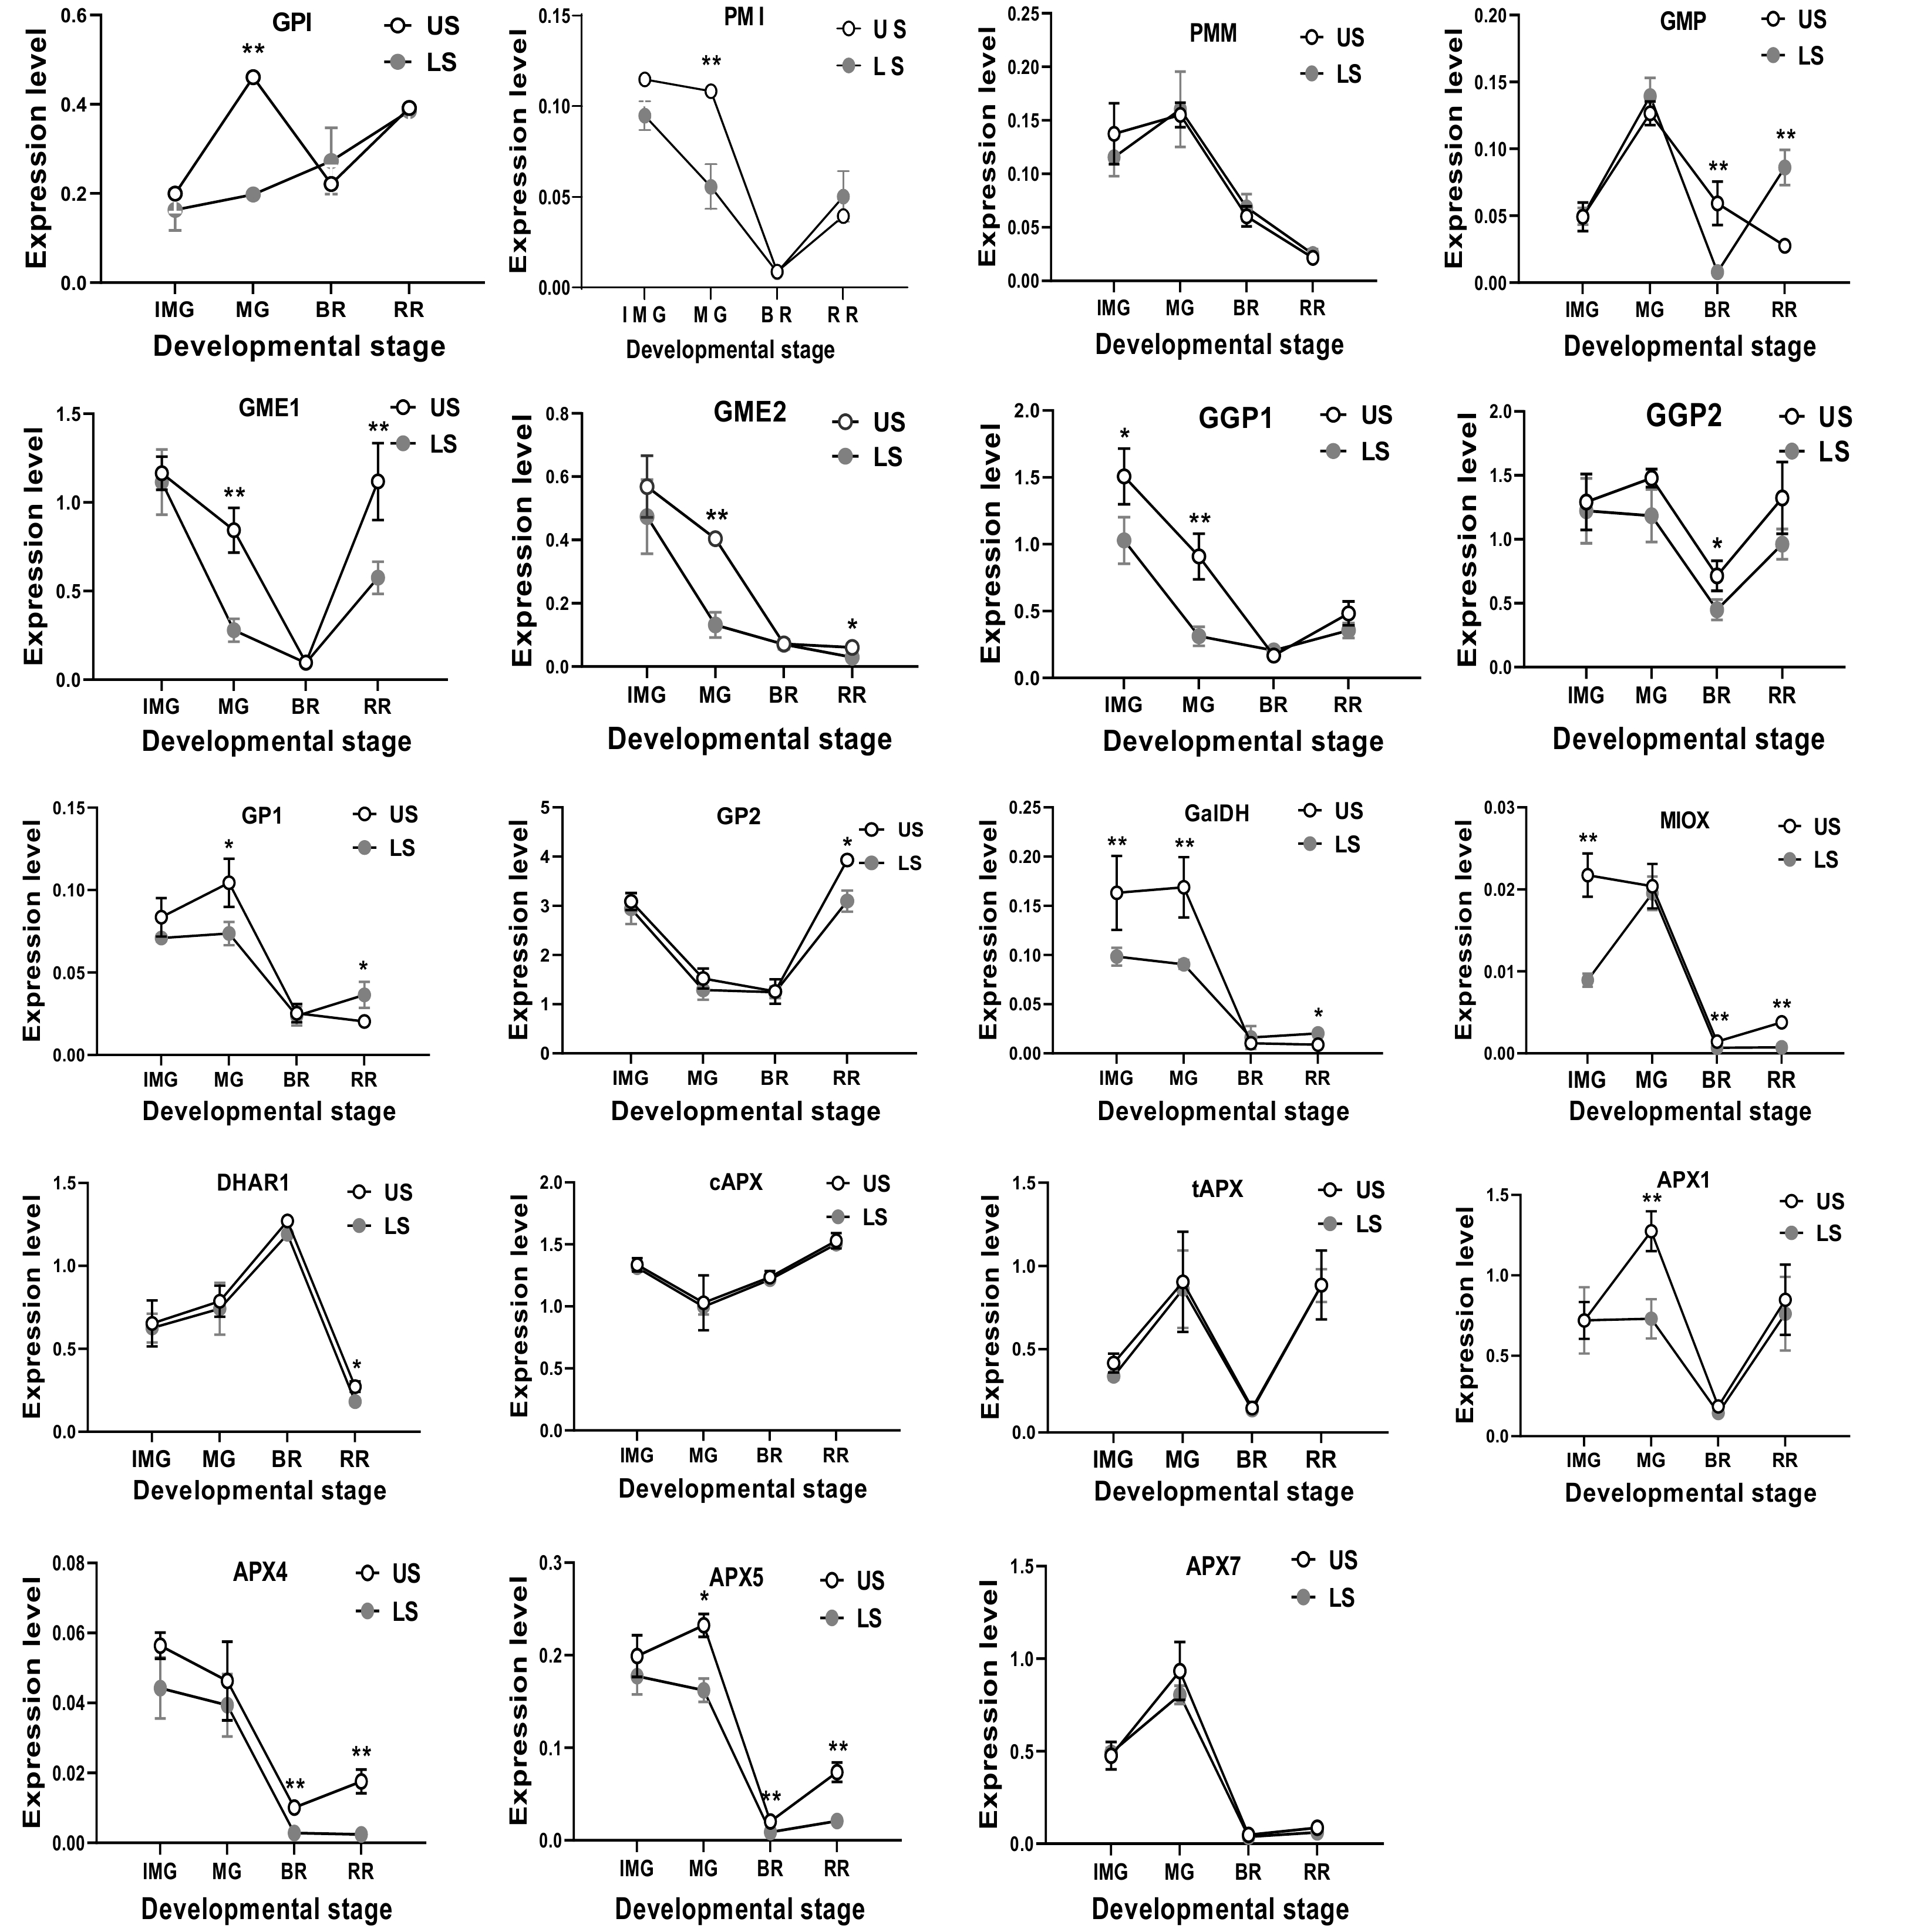
Figure 3.
The mRNA transcription level of AsA biosynthetic genes in S. lycopersicum 'Ailsa Craig' at immature green (IMG), mature green (MG), breaker (BR) and red ripe (RR) stages with or without leaf shading. US, un-shaded; LS, leaf shading. Data is presented as mean values ± SD (n = 3). * and ** illustrate a significant difference at P < 0.05 and P < 0.01 levels, respectively.
When the fruit were shaded, the decreased expression of the AsA biosynthetic gene was also observed. The expression of most of the genes were observed to be lower than the un-shaded control. Upon fruit shading, the expression level of GMP and APX7 was lower at BR or RR, respectively, compared to the control. Five genes of GME2, GGP2, MIOX, APX1 and APX5 were found to possess a lower expression at BR and RR stages than the un-shaded control. Three genes of GME1, DHAR1 and APX4 were expressed at a lower level than the un-shaded control at MG, BR and RR stages, while two genes of GGP1 and GalDH were expressed at lower levels than the control at IMG, MG and RR stages (Fig. 4).
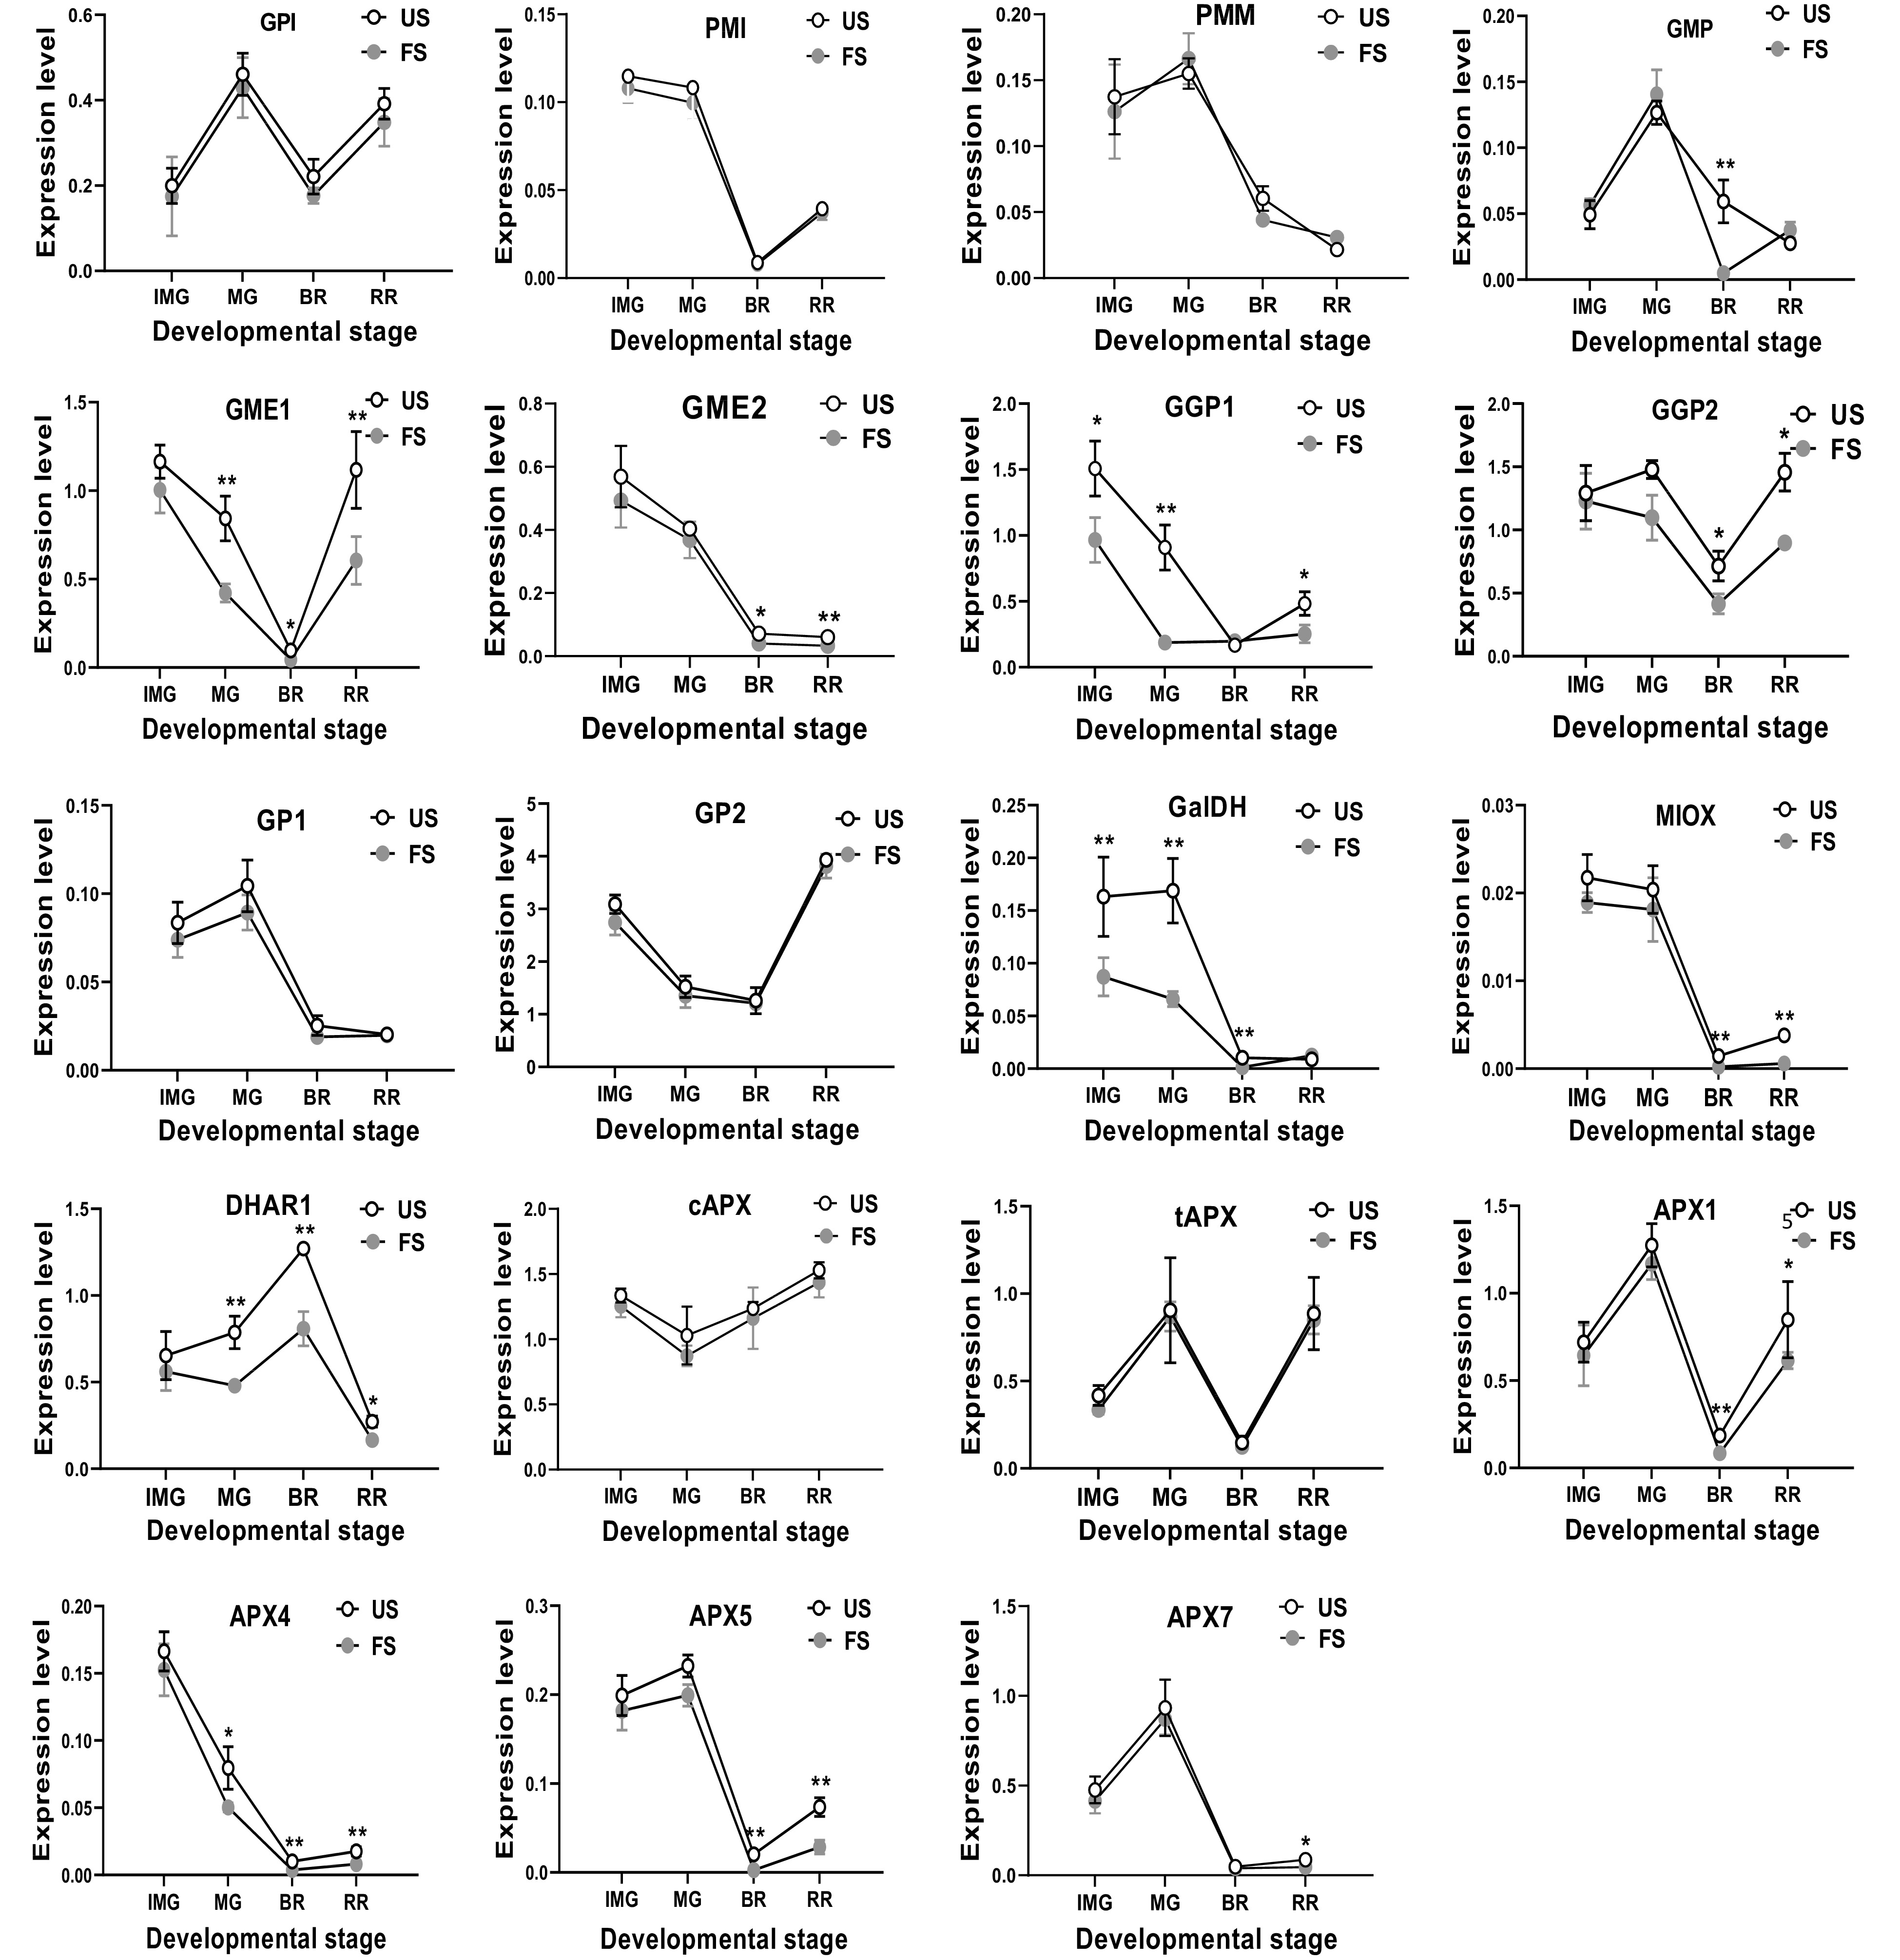
Figure 4.
The relative mRNA transcription of AsA biosynthetic genes in S. lycopersicum 'Ailsa Craig' at immature green (IMG), mature green (MG), breaker (BR) and red ripe (RR) fruits with or without fruit shading. US, un-shaded; FS, fruit shading. Data is presented as mean values ± SD (n = 3). * and ** indicate significant difference at P ≤ 0.05 and P ≤ 0.01 levels, respectively.
When both fruits and leaf were shaded, we found more AsA biosynthetic genes were transcriptionally suppressed with more dramatic changes than the leaf shading or fruit shading (Fig. 5). Notably, the expression of five genes GP1, GME1, GGP1, MIOX and APX5 were found to be significantly decreased among all the developmental stages, which were not observed under leaf shading (Fig. 3) or fruit shading (Fig. 4). There was also one exception that the GMP gene was expressed at a higher level than the un-shaded control at MG, RR stages (Fig. 5).
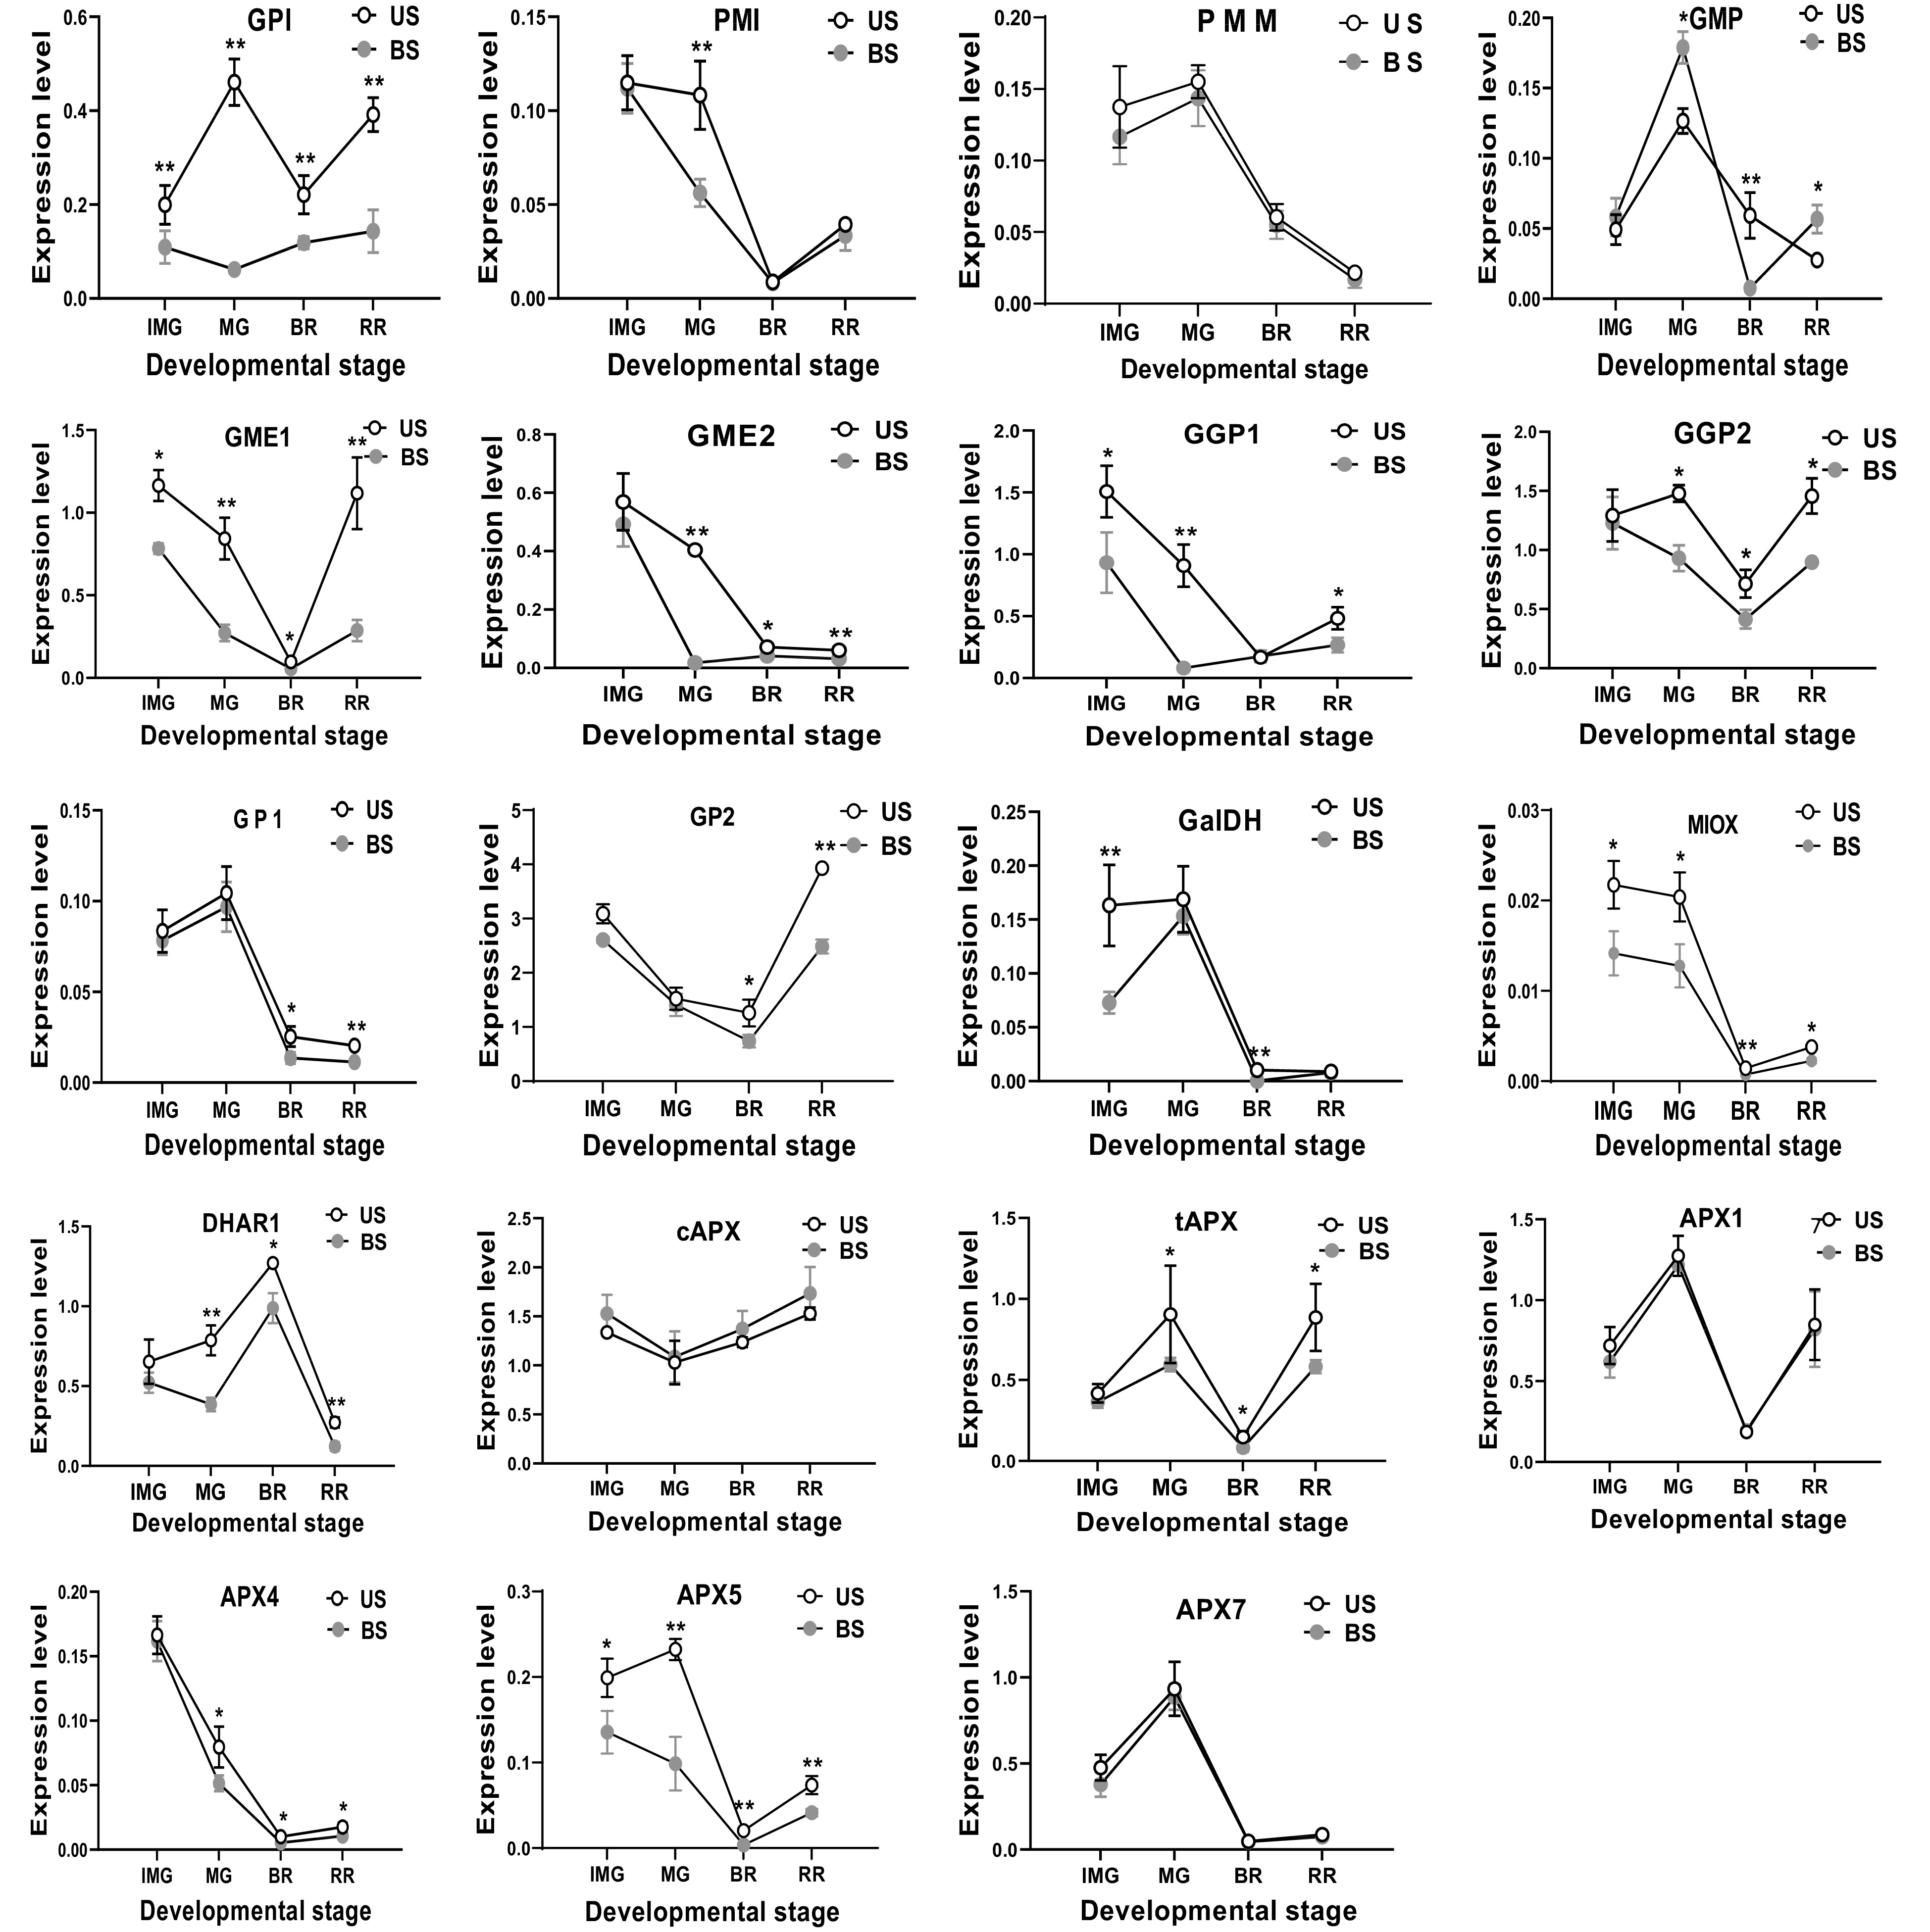
Figure 5.
The effect of leaf and fruit shading on the expression level of AsA biosynthetic genes in S. lycopersicum 'Ailsa Craig' at immature (IMG), mature (MG), breaker (BR) and red ripe (RR) fruits. US, un-shaded; BS, Both shading of leaf and fruits. Data is presented as mean values ± SD (n = 3). The * and ** illustration is a significant difference at P ≤ 0.05 and P ≤ 0.01, respectively.
The correlation between AsA accumulation and biosynthetic gene expression in fruits with shading or un-shaded
-
We compared the gene expression abundance with the AsA accumulation by calculating their correlation coefficient. It was found that expression of most of the genes, e.g. PMI, GME2, GGP1, APX4 and APX5, were negatively correlated with AsA accumulation under un-shaded control, but exhibited a positive correlation under leaf shading, fruit shading or both shading combined. GME2 expression exhibited the lowest negative correlation coefficient (−0.85) with total AsA under un-shaded, and the highest correlation coefficient (0.97) under both shading, suggesting that GME2 may play a pivotal role in AsA biosynthesis. For reduced AsA accumulation, GGP1 expression exhibited the lowest correlation coefficient (−0.78) under un-shaded, while GME2 expression showed the highest correlation coefficient (0.94) with AsA accumulation under both shading (Table 2). There was one exception that GPI expression showed a positive correlation with AsA accumulation under normal growth conditions, and a negative correlation with AsA accumulation under leaf shading.
Table 2. The correlation coefficient between AsA biosynthetic gene expression and AsA accumulation in fruits with shading or un-shaded treatment.
Genes GPI PMI PMM GMP GME1 GME2 GGP1 GGP2 GP1 GP2 GalDH MIOX DHAR1 cAPX tAPX APX1 APX4 APX5 APX7 rT-AsA US 0.5* −0.69* −0.63* −0.01 −0.36 −0.85* −0.82* −0.14 −0.57* −0.08 −0.69* −0.75* 0.08 0.2 0.26 −0.07 −0.75* −0.61* −0.37 rT-AsA LS −0.63* 0.83* 0.66* −0.03 0.58* 0.88* 0.76* 0.55* 0.67* 0.14 0.77* 0.45 0.27 −0.25 −0.25 0.29 0.81* 0.75** 0.53* rT-AsA FS −0.34 0.61* 0.54* 0.01 0.79* 0.73* 0.96** 0.6* 0.51* 0.25 0.71* 0.59* 0.22 0.31 −0.31 0.08 0.9** 0.51* 0.16 rT-AsA BS 0.1 0.90** 0.47 −0.09 0.91** 0.97** 0.94** 0.69* 0.49 0.54* 0.2 0.67* 0.11 0.26 −0.1 −0.08 0.95** 0.75* 0.13 rAsA US 0.55* -0.62* -0.52* 0.14 −0.38 −0.77* −0.78* −0.09 −0.46 −0.18 −0.59* −0.66* 0.16 0.11 0.29 0.32 −0.68* −0.52* −0.26 rAsA LS −0.4 0.83* 0.39 −0.13 0.81* 0.93** 0.91** 0.6* 0.57* 0.5* 0.65* 0.18 0.11 0.13 −0.24 0.4 0.67* 0.63* 0.3 rAsA FS −0.25 0.67* 0.52* 0.13 0.74* 0.8* 0.91** 0.64* 0.56* 0.14 0.78* 0.69* 0.28 0.21 −0.28 0.17 0.91** 0.6* 0.29 rAsA BS 0.17 0.86* 0.43 −0.11 0.88* 0.94** 0.92** 0.68* 0.44 0.56* 0.16 0.62* 0.11 0.34 −0.09 −0.09 0.91** 0.72* 0.09 * and ** indicate a significant correlation at P < 0.05 and P < 0.01, respectively. -
The D-mannose/L-galactose pathway has been well characterized as an essential AsA biosynthetic route in plants[15−19]. Despite the well characterized biosynthetic pathway, AsA concentration is affected by environmental clues. Environmental factors, especially light, have a significant impact on tomato AsA accumulation[20−23]. AsA content gradually decreased after continued darkness in kiwi[24]. According to Yabuta et al.[25], the AsA level in leaves increased by 171% within 72 h in 2-week-old Arabidopsis plants grown under 16 h continuous light, while decreased by 91% under continuous darkness. The light induced photosynthesis capacity and photosynthetic product may lead to AsA accumulation in fruit[26]. On the other hand, the reactive oxygen species generated during photosynthesis may activate the biosynthesis of AsA which acts an antioxidant to scavenge reactive oxygen species[27, 28]. However, light regulation in AsA biosynthesis in fruit is little understood.
In this study, we investigated the effect of leaf shading, fruit shading, and both shading combined on the accumulation of AsA and the expression of AsA biosynthetic genes during fruit development and ripening. We found that leaf shading, fruit shading, and both shading combined significantly decreased the accumulation of total AsA and reduced AsA at different fruit development stages, and also reduced the expression of most AsA biosynthetic genes in the fruits. This work advanced our understanding of the effect of light on the regulation of AsA biosynthesis, which is important for plants. We found that the transcription level of the GPI, PMI, GME1, GME2, GGP1, GGP2, GP1, GP2, GaLDH, MIOX, DHAR1, tAPX, APX4, and APX5 genes in fruits with leaf shading and the transcription level of the GPI, PMI, GME1, GME2, GGP1, GGP2, GP1, GP2, GalDH, MIOX, DHAR1, tAPX, APX4, and APX5 genes in fruits with both leaf and fruit shading showed a significant lower expression under low light conditions. Furthermore, we observed that most genes showed significant positive correlations with AsA accumulation in leaf shading, fruit shading, and both types of shading (Table 2). AsA was increased from IMG to RR stages in fruits under normal conditions and decreased from IMG to RR stages in leaf-shaded, fruit-shaded or both shading combined fruits. Previous studies also showed the effect of light reduction on tomato fruits, and its impact on AsA content and its biosynthesis related genes[12, 29]. Seven days of fruit shading didn't change the expression level of most AsA biosynthetic genes, except GPP1 gene which decreased significantly under shading[29]. In tobacco, the transcript level of GMP, GLDH and cAPX showed a lower expression in covered leaves than that of un-covered leaves[16]. The transcript levels of GMP, GPP, and VTC2 genes was increased in Arabidopsis leaves under light and decreased in the dark[30]. The expression levels of GMP, GME1, GME2, GGP, GPP, GalDH, and GLDH in shaded eggplant fruits were lower relative to non-shaded fruits[31]. In our results we found most of the 19 AsA biosynthetic genes were down-regulated in shaded tomato fruits. The duration of shading may exert different effects of shading on AsA biosynthetic gene expression. In the present work, the shading treatment started after formation of fruits and continued until red ripe stages, for which a long duration of shading treatment produced more significant reduction in the AsA biosynthetic gene expression.
In conclusion, the present work is the first report on the impact of leaf shading, fruit shading and both types of shading combined, on fruit AsA biosynthetic genes at the IMG, MG, BR, and RR stages of fruits. Shaded leaves caused a reduction in the expression of AsA biosynthetic genes. Shaded fruits or both shading of leaf and fruits exerted a more significant influence on AsA accumulation and biosynthetic gene expression, suggesting the potential role of biosynthetic mechanisms in fruits as well as the transfer from leaf to fruit. By reducing photosynthesis activities, plenty of disorders will occur in metabolite biosynthesis including AsA, and increase in lighting intensity transcriptionally regulates the AsA biosynthesis and enhances fruit quality. The effect of shading on AsA accumulation and biosynthetic gene expression will provide guidelines for tomato cultivation in the greenhouse. As the light intensity in the greenhouse is usually insufficient, supplemental illumination will improve fruit quality as well as yield in tomato protected cultivation.
This work was supported by grants from the National Key Research & Development Plan (2021YFD1200201; 2018YFD1000800); National Natural Science Foundation of China (31991182; 31972426); International Cooperation Promotion Plan of Shihezi University (GJHZ202104); Key Project of Hubei Hongshan Laboratory (2021hszd007).
-
The authors declare that they have no conflict of interest.
- Supplemental Fig. S1 Light intensity measured three times/day (9:00 am, 12;00 pm and 5:00 pm) from three types of treatment during the growth of tomato plants. The average light intensity was presented each day. un-shading (US) and shading treatments (SD) were included.
- Supplemental Fig. S2 Photographs indicating the four stages of tomato fruits, including immature green stage (IMG), mature green stage (MG), breaker stage (BR) and red ripe stage (RR).
- Copyright: © 2022 by the author(s). Published by Maximum Academic Press, Fayetteville, GA. This article is an open access article distributed under Creative Commons Attribution License (CC BY 4.0), visit https://creativecommons.org/licenses/by/4.0/.
-
About this article
Cite this article
Tamim SA, Li F, Wang Y, Shang L, Zhang X, et al. 2022. Effect of shading on ascorbic acid accumulation and biosynthetic gene expression during tomato fruit development and ripening. Vegetable Research 2:1 doi: 10.48130/VR-2022-0001 

Effect of shading on ascorbic acid accumulation and biosynthetic gene expression during tomato fruit development and ripening
- Received: 08 October 2021
- Accepted: 23 January 2022
- Published online: 29 January 2022
Abstract: The purpose of the current study was to determine the effect of leaf shading, fruit shading, and a combination of both, on the accumulation of ascorbic acid (AsA) and the expression levels of AsA biosynthetic genes at the immature green, mature green, breaker, and red ripe stages of Ailsa craig tomato during fruit development. Shading (72% reducing of light intensity) imposed on the leaves significantly reduced AsA content and AsA biosynthetic gene expression in the fruits. Leaf shading, fruit shading, and a combination of both significantly decreased the amount of total AsA and reduced AsA to a range of 18.5%−31.5% at mature green, breaker, and red ripe stages of tomato fruits, with no significant change at the immature green stage of fruits. Moreover, reducing the light intensity in tomato leaves, fruits or both resulted in reduced expression of most AsA biosynthetic genes in the fruits, except for PMM, cAPX, tAPX, and APX7 genes under leaf shading, GPI, PMI, PMM, GP1, GP2, cAPX, and tAPX genes under fruit shading, and PMM, cAPX, APX1, and APX7 genes under both shading. The expression level of GMP, GP1, and GalDH showed an up-regulation at the red ripe stage in fruits with leaf shading, and also an up-regulation at the immature green and red ripe stages with both shading. Furthermore, positive correlations between expression of AsA biosynthetic genes and AsA accumulation were recorded under leaf shading, fruit shading, and both types of shading, while a negative correlation was recorded under normal conditions without shading.
-
Key words:
- Solanum lycopersicum /
- Light intensity /
- Ascorbic acid /
- Biosynthesis /
- Gene expression