


-
Biostimulants are natural and/or synthetic compounds that can be applied and augment plant growth and development[1]. The global biostimulant market size was $2.30 billion in 2019 and is projected to be $4.14 billion by 2025 (
www.grandviewresearch.com/industry-analysis/biostimulants-market ). Europe and North America are the largest users of biostimulants. Biostimulants have been shown to improve nutrient uptake and translocation and induce resistance to selected biotic and abiotic factors[2]. Biostimulants also better yield and quality through improving sugar and protein contents, fruit color, seed formation, shelf life, and nutrient use efficiencies[2]. Furthermore, biostimulants also enhance soil microbial activities[3]. Biostimulants improve uptake of nutrients such as Mg, Ca, P, and K. Magnesium and P are essential for the net photosynthetic rate (Pn) as they aid green pigments to hold the light energy for Pn. Additionally, Mg is ir-replacement for chlorophyll and responsible for the leaf greenness and carbohydrate metabolism. Likewise, Ca plays a vital role in biological membranes of organelles and in Pn by regulating the activities of phosphatase enzymes involved in the carbon-reduction-cycle[4]. Similarly, K controls the opening and closing of stomata, hence affects the availability of carbon dioxide, and indirectly controls the Pn[5]. Biostimulants also strengthen the photosynthetic apparatus and promote enzymatic activities. Different from fertilizers providing nutrients, biostimulants mainly foster nutrient uptake and translocation. Du Jardin categorized biostimulants into humic compounds, organic salts and their compounds, inorganic salts, seaweed extracts, chitin-based compounds, nitrogen containing compounds, antitranspirants, and free amino acids[2]. However, the North American biostimulant consortia described five groups of biostimulants: microbial inoculants, humic acids, fulvic acids, protein hydrolysates and amino acids, and seaweed extracts[6]. Biostimulants are defined as substances, other than fertilizers, that improve plant growth and productivity when used in minute amounts[6−8].Biostimulants can be derived from both natural and synthetic compounds. Because some synthetic growth promoters like nitro phenolates are regarded as biostimulants, biostimulants can either be a single compound or a blend of different compounds or a single microbe of specific stain or inoculums of different microbes. There are various plant extracts that are classified as biostimulants but their complete composition is still unknown. The European organization, Registration, Evaluation, Authorization, and Restriction of Chemicals (REAC) has placed these materials in a single group, UVCB (substances of unknown/variable composition). Although regulatory authorities regarding biostimulants have been established in European and North American Biostimulants Consortia[9], there is a need to centralize biostimulant legislation. Biostimulants have at times been subject to fertilizer law and other times to pesticide law. This disparity resulted from the lack of statistical data related to biostimulants. Thus, we received five different biostimulant products from ICL Specialty Fertilizer, OH, USA, to test these materials for efficacy in tomato production.
The USA is among the top tomato producers in the world. In 2020, the area in the USA planted with tomatoes was 113,312 ha producing 109.2 Mg. The value of the tomatoes was $1.66 billion[10]. Fresh tomatoes are commercially produced in 20 states. Among them, California and Florida are the leading states based on area and production. There is a desire to find more cost-effective and environmentally friendly approaches, resulting in better quality and yield. Based on the commercial importance of fresh tomatoes, the objective of this study was to evaluate the effect of applying biostimulants on plant growth, yield, and fruit quality of tomato grown in Florida.
-
Biostimulant application had significant influences on tomato plant height, stem diameter and plant dry biomass (Fig. 1). Among the biostimulants tested, the maximum plant height and stem diameter were recorded in those plants treated with Competitor (Fig. 1). The increase in plant height was statistically significant, so the plants treated with Competitor or a mixture of CP2+BS had significantly higher plant height with respect to the control. There was no significant difference (p < 0.05) between Competitor and CP2+BS. However, those plants sprayed with BS, CP1, and the control also did not show any significant differences in plant height. The maximum stem diameters were recorded in plants receiving Competitor or CP2+BS compared to those treated with water only. Biostimulants were also effective in improving shoot and root dry biomass. Competitor and CP2+BS caused the maximum improvement in shoot and root dry biomass. Since N and P were the main ingredients in the composition of biostimulants, the improved shoot and root biomass were slightly attributed to greater availability of N and P to plants because both have critical roles in promoting shoot and root growth[11]. Halpern et al. also reported that biostimulant-induced improvement in plant growth is associated with higher nutrient uptake[12]. In addition, Mg regulates root growth[13], so high Mg concentration in the leaves and roots of Competitor-treated plants with respect to the control plants suggests improvement in root growth and development because of greater Mg concentration. Since, biostimulant-treated plants had greater height and stem diameter, the shoot and root biomass were greater.

Figure 1.
Effect of biostimulants on (a) plant height, (b) stem diameter, (c) shoot dry weight, and (d) root dry weight. Each of the values is the mean of four independent replicates ± SE (n = 4). Values with different letters differ significantly at p ≤ 0.05. LSD = Least Significant Difference.
Leaf greenness and Pn also showed significant responses to biostimulants, so plants treated with biostimulants had greater Pn and leaf greenness than those without biostimulants (Fig. 2a & b). Among all the tested biostimulants, Competitor gave the maximum augmentation in leaf greenness and Pn at all three studied growth stages. It was observed that all the biostimulant treatments showed significant difference in Pn and leaf greenness at all three stages (Fig. 2a & b). At the flowering stage, plants treated with Competitor exhibited the maximum Pn and leaf greenness as compared to the rest of the treatments. The lowest Pn and leaf greenness were recorded for those treated with BS and water. The BS and water treatments had no significant differences in Pn from each other in the flowering stage. In both early fruiting and late fruiting, the maximum Pn and SPAD readings were again recorded for those sprayed with Competitor while those sprayed with BS or water only (the control) presented the lowest rate of Pn and leaf greenness. A SPAD meter reading is determined by the difference in light attenuation. Those readings are the indication of greenness. The plants treated with BS and water exhibited the lowest Pn and SPAD readings (Fig. 2). Overall, plants treated with Competitor and CP2+BS had higher Pn and SPAD readings in all three growth stages.

Figure 2.
Effect of biostimulants on (a) photosynthetic activity, and (b) leaf greenness (SPAD reading). Each of the values is the mean of four independent replicates ± SE (n = 4). Values with different letters differ significantly at p ≤ 0.05. LSD = Least Significant Difference.
Biostimulant application also improved plant water status by increasing the relative water RWC in leaves (Fig. 3). Among all the biostimulants tested, Competitor-treated plants maintained the highest RWC in leaves with respect to the control. The increased water content in plant tissues is also beneficial for the photosynthetic apparatus.
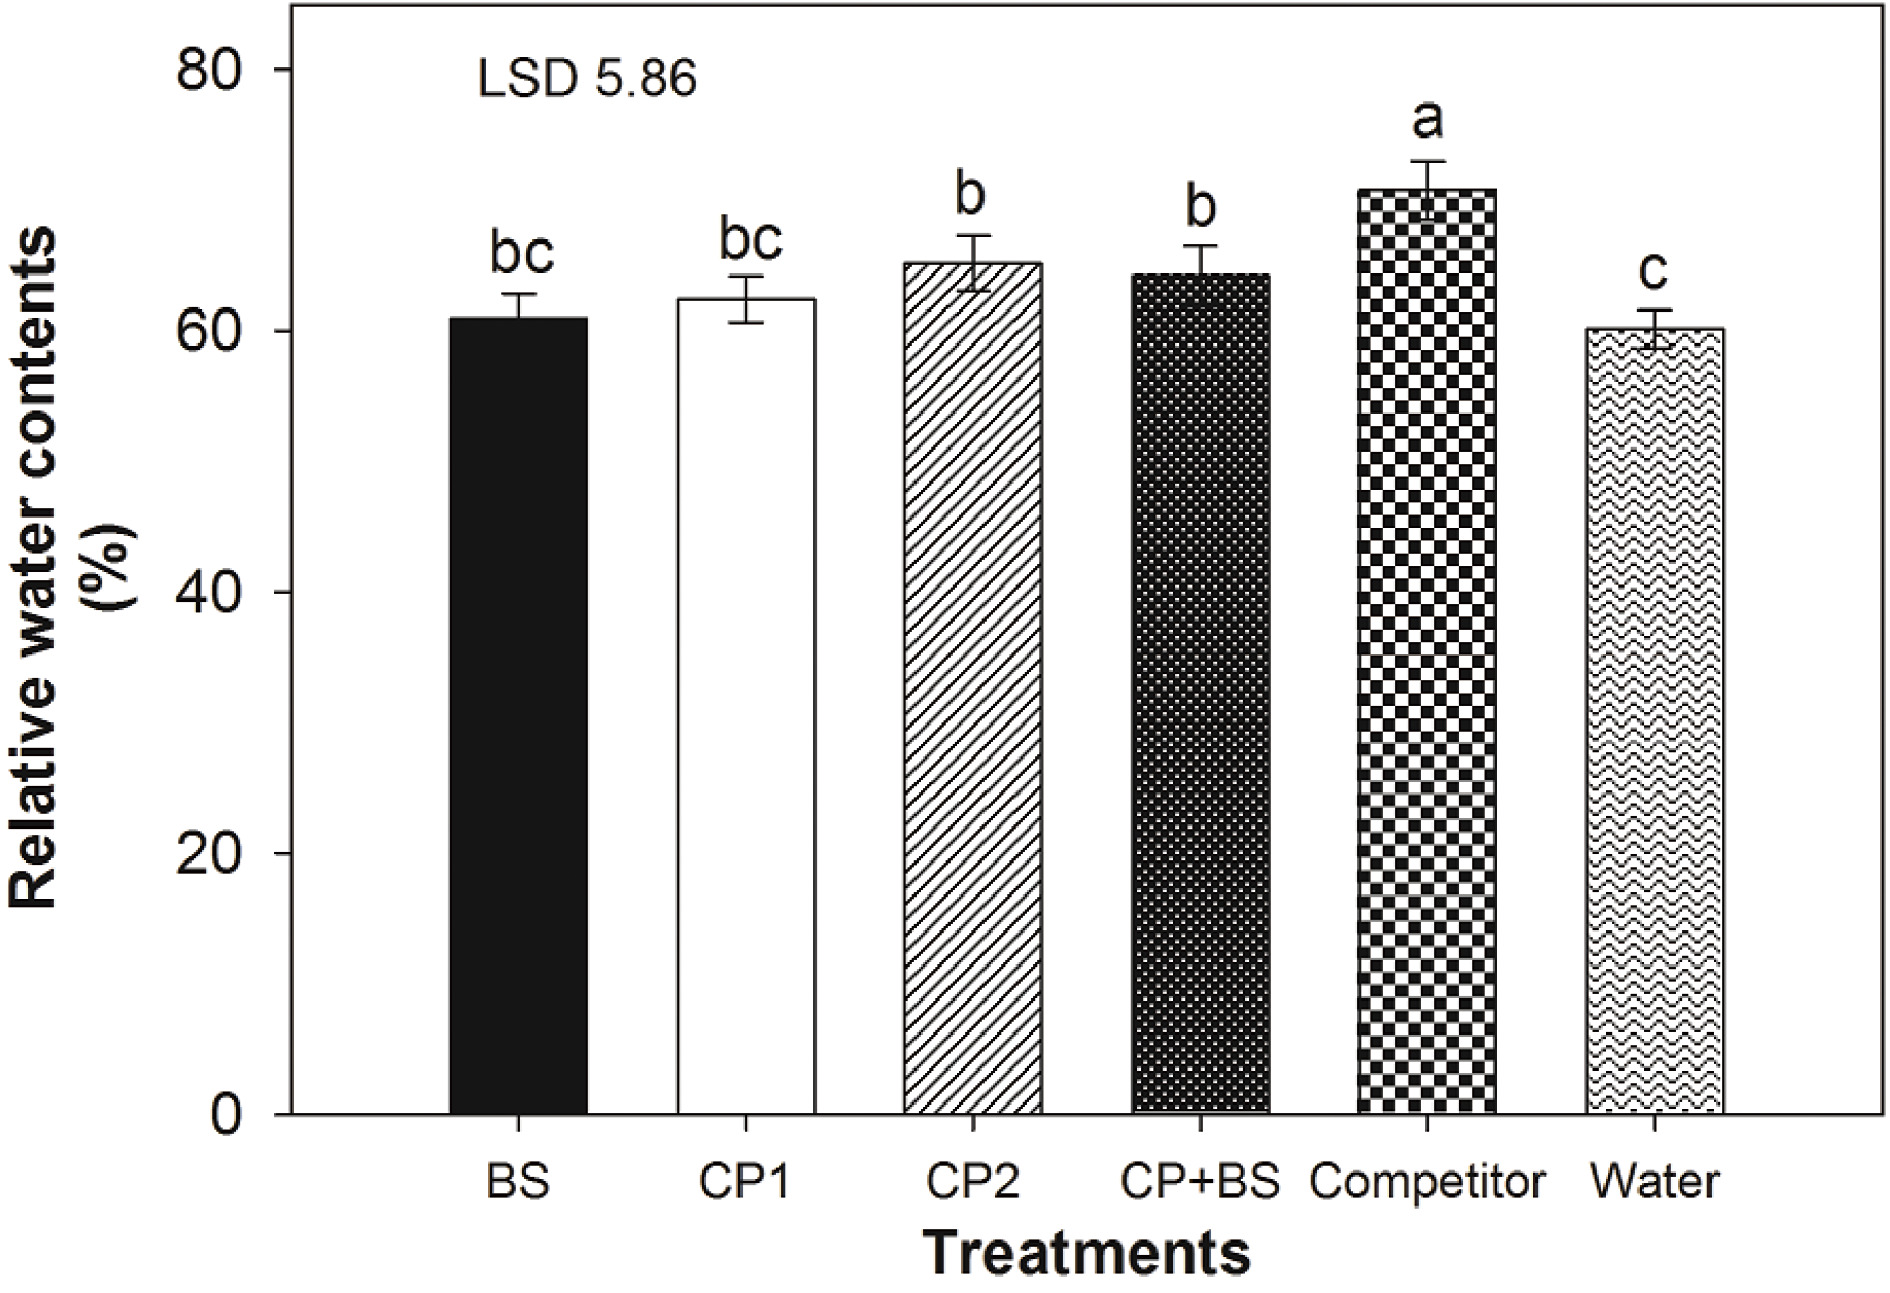
Figure 3.
Effect of biostimulants on relative water content (RWC). Each of the values is the mean of four independent replicates ± SE (n = 4). Values with different letters differ significantly at p ≤ 0.05. LSD = Least Significant Difference.
Plants sprayed with biostimulants showed variations in the concentrations of Ca, K, Mg, and P in leaves and roots (Fig. 4). Phosphorus concentration was the only tested nutrient in the roots that did not show effects of biostimulant application with respect to the control. The plants sprayed with Competitor and CP2+BS had greater concentrations of the above-mentioned nutrients than the other treatments. Nitrogen, P, and K were the main constituents in the biostimulants formulations; therefore, foliar application might have enhanced the N, P, and K contents in leaves and these nutrients were then translocated to the roots. This enhancement of nutrient translocation might associate with better agronomic responses of biostimulant-treated tomato plants. The results suggest that biostimulants improved the plants moisture status (RWC) and nutrient (such as Ca, K, Mg, P) uptake and accumulation (Figs. 3 & 4), resulting in improved chlorophyll contents thereby enhancing Pn. Plants treated with biostimulants showed greater levels of Ca, K, Mg and P and leaf greenness so increased Pn in the Competitor-treated plants could have been attributed to improved levels of these nutrients.

Figure 4.
Effect of biostimulants on the concentration of Ca, K, Mg, and P both in leaves (left side) and roots (right side). Each of the values is the mean of four independent replicates ± SE (n = 4). Values with different letters differ significantly at p ≤ 0.05. LSD = Least Significant Difference.
Vegetables require relatively high levels of N, but it should be applied according to the individual requirement of plants as excessive N can have serious environmental impacts. The petiole sap nitrate test is a rapid tool to estimate the N status of the crop and aids in N management in selected horticultural crops[14]. Plants treated with biostimulants showed significant differences in nitrate content compared with control plants (treated with water). Biostimulants also exhibited variations from each other in nitrate level in the petioles. In nitrate measurement in flowering, leaves from plants treated with Competitor showed the highest levels of nitrate followed by CP2+BS and CP2 (Fig. 5). The lowest nitrate contents were observed in the control plants treated with water. In the early fruiting stage, all plants showed lower nitrate concentrations than those measured in the flowering stage because N might have been translocated to fruits[15]. The plants sprayed with Competitor had higher nitrate concentration than with the rest of the treatments. Nitrate concentration measured in late fruiting was lower than in both flowering and early fruiting stages because N may have been moved to fruits[15]. Once again, the plants treated with Competitor exhibited the maximum nitrate concentration, closely followed by CP2+BS. The plants sprayed with BS and water had the lowest nitrate concentration in comparison to the other treatments.

Figure 5.
Effect of biostimulants on nitrate concentration in leaf petioles. Each of the values is the mean of four independent replicates ± SE (n = 4). Values with different letters differ significantly at p ≤ 0.05. LSD = Least Significant Difference
Overall, the plants treated with Competitor and CP2+BS showed the highest concentration of nitrate compared to the other treatments across all three growth stages. Greater nitrate concentrations in the biostimulant-treated plants indicate higher N uptake ability and more N availability. The rate of Pn is highly associated with N concentration in the leaf tissue because it is a major component of the proteins involved in the Calvin cycle and in the thylakoid membrane[16]. Since biostimulants increased concentrations of leaf N, biostimulants enhanced the photosynthetic machinery and associated attributes that ultimately led to better growth and productivity. Biostimulants accelerated NR and NiR activities, and maximum activities were measured in Competitor-treated plants (Fig. 6). Nitrate reductase is responsible for N assimilation in the form of nitrate, the most available form of N for plants. NR activity is a useful indicator of N concentrations in plant tissues and is highly associated with tomato plant growth and productivity[17]. However, NiR catalyzes reduction of nitrate and regulates N assimilation within plant tissues. Since, biostimulants enhanced both NR and NiR activities (Fig. 5), higher N in petiole sap of the biostimulant-treated plants might have been linked with greater NR and NiR activities in leaves[18].

Figure 6.
Effect of biostimulants on (a) nitrate reductase activity, and (b) nitrite reductase activity. Each of the values is the mean of four independent replicates ± SE (n = 4). Values with different letters differ significantly at p ≤ 0.05. LSD = Least Significant Difference.
Fruit quality and compositional attributes including citric acid, malic acid, titratable acidity, soluble solids concentration, and fruit firmness showed marked variations in response to the biostimulants (Fig. 7). Fruits from plants treated with Competitor and CP2+BS showed higher citric acid, malic acid, titratable acidity, soluble solids concentration, and firmness (Fig. 7). However, plants treated with BS and water had the minimum values for the above-mentioned fruit compositional attributes. Overall, the plants sprayed with Competitor and CP2+BS maintained higher values of the indicated compositional characteristics while plants treated with BS and water had lower values (Fig. 7). The results are in agreement with those of Pankovic et al.[18] Abubaker et al., and Kose & Guleryuz reported the beneficial effects of different biostimulants on fruit quality[19,20]. The higher levels of Ca, K, Mg, P, and N coupled with improved plant water status in response to application of Competitor and CP2+BS could have contributed to the improved fruit quality characteristics.
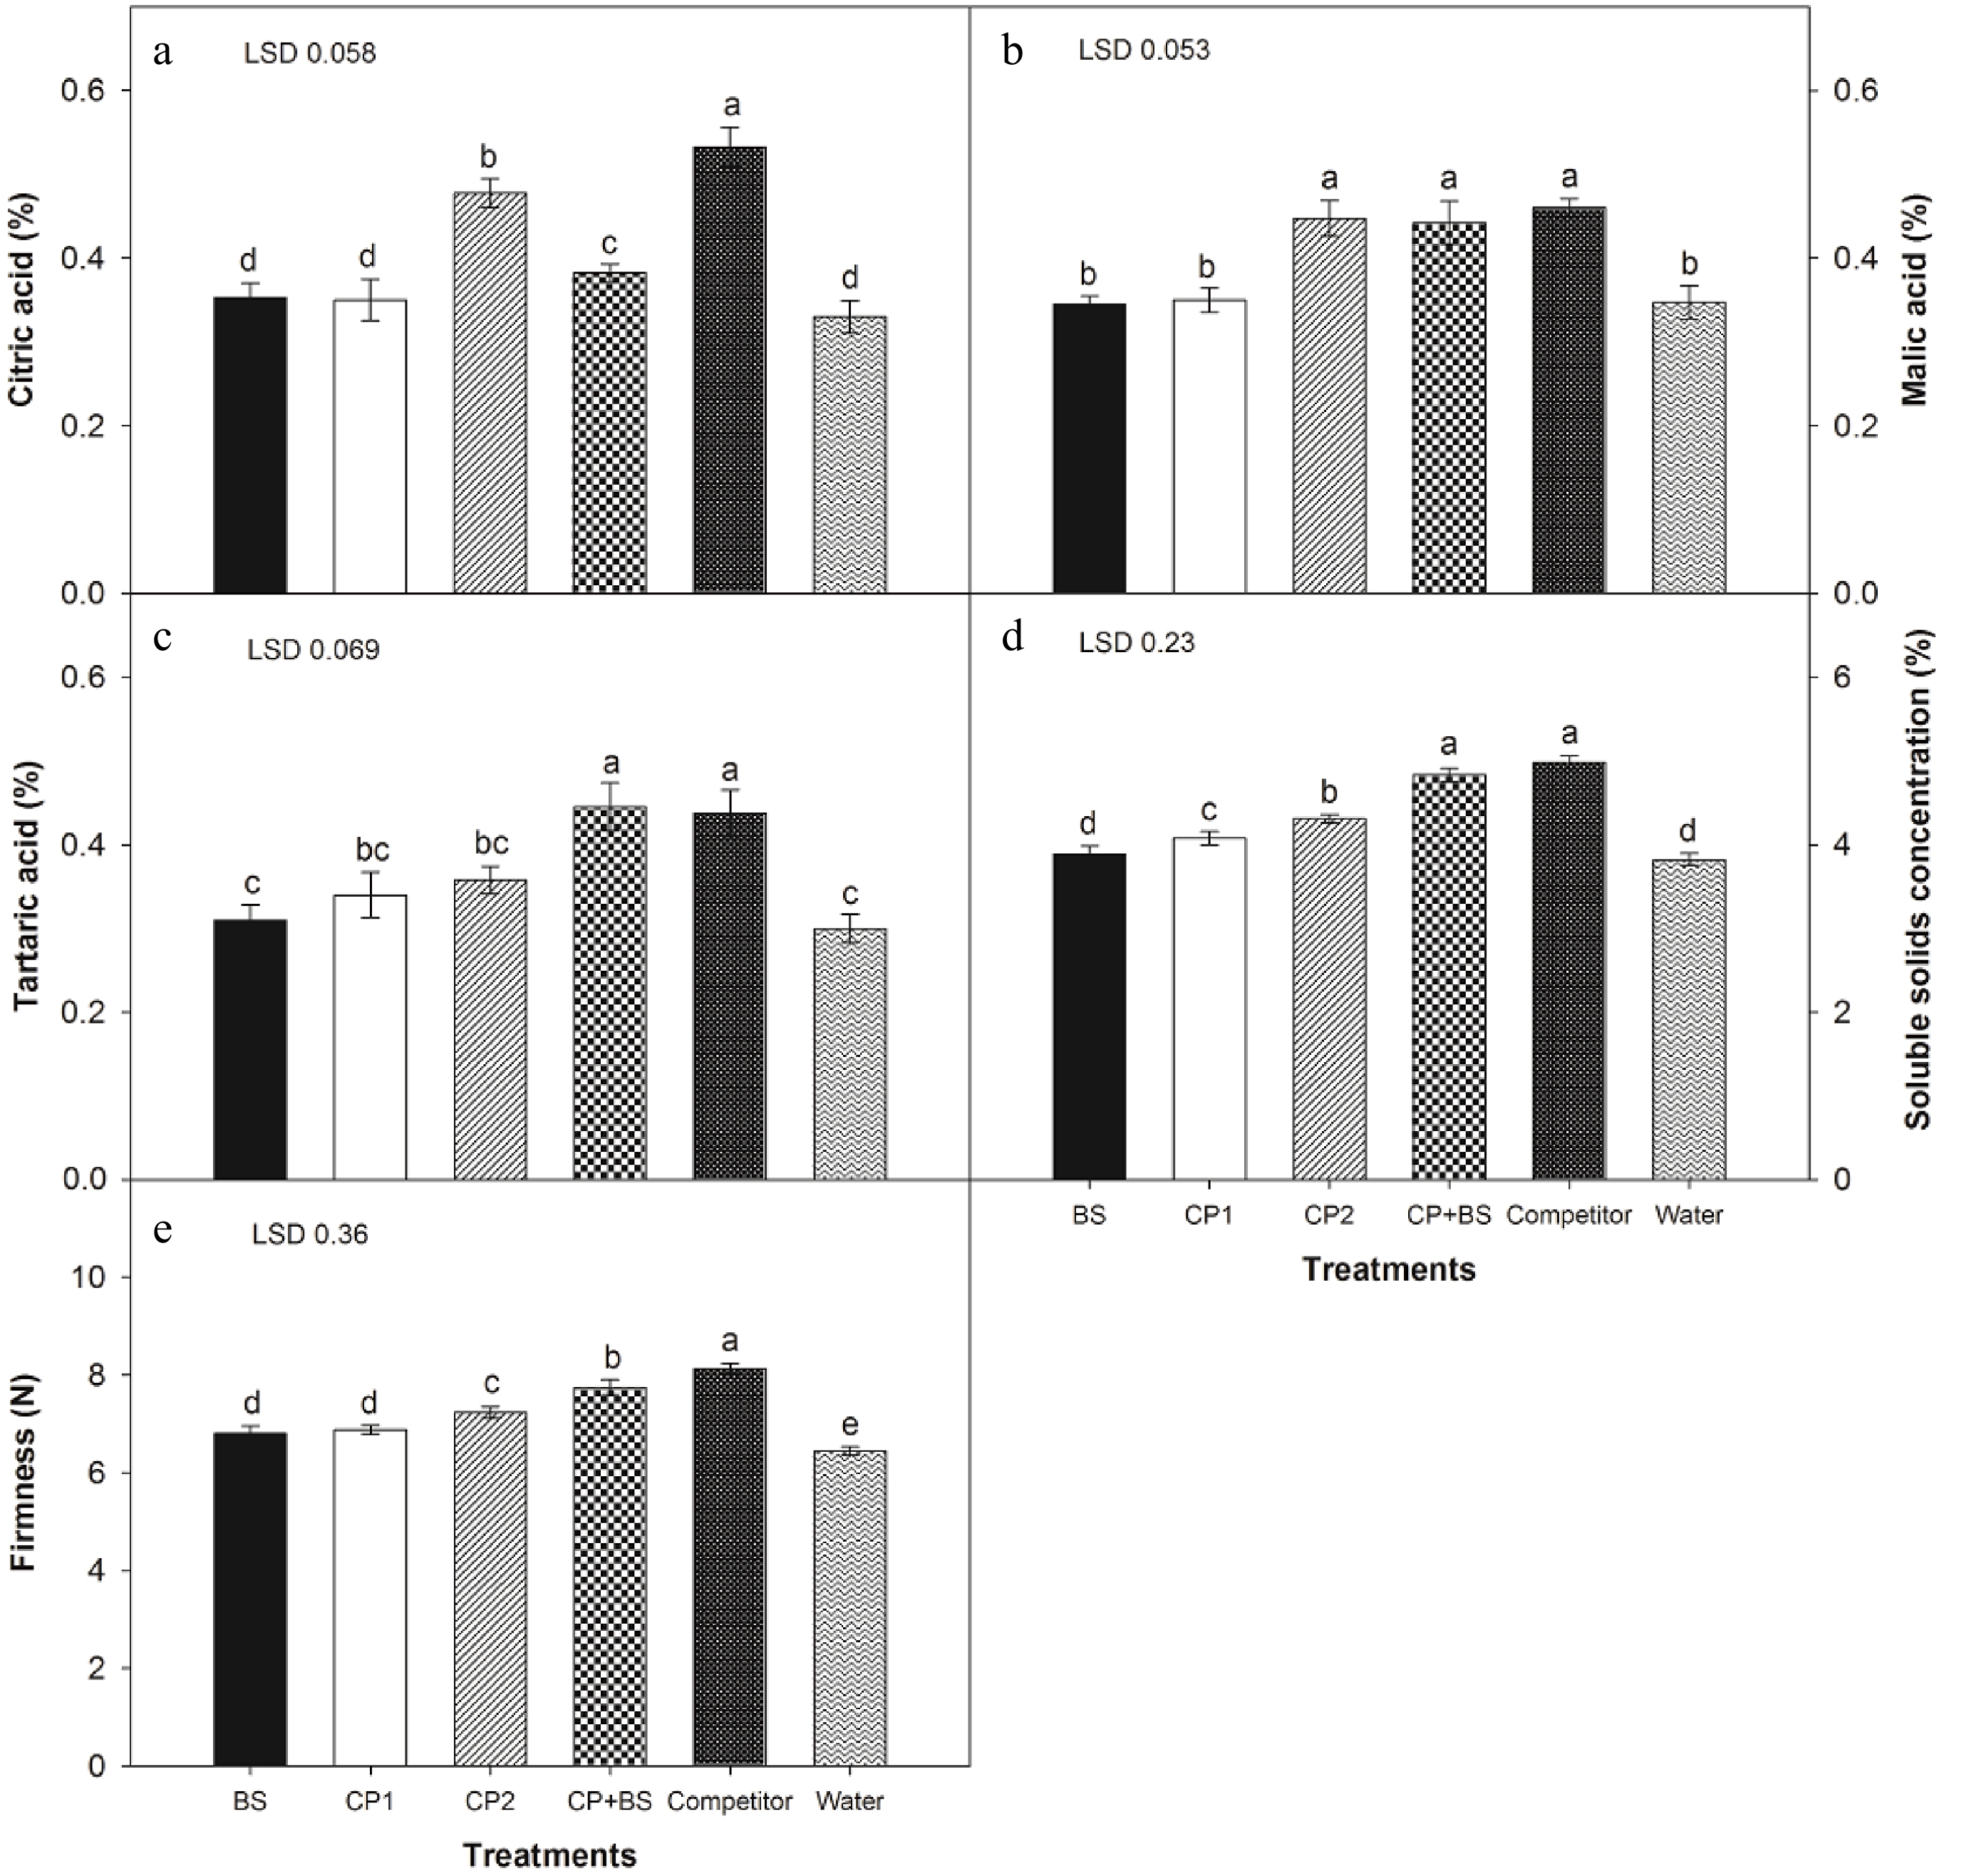
Figure 7.
Effect of biostimulants on (a) citric acid, (b) malic acid, (c) tartaric acid, (d) soluble solid concentration, and (e) fruit firmness. Each of the values is the mean of four independent replicates ± SE (n = 4). Values with different letters differ significantly at p ≤ 0.05. LSD = Least Significant Difference.
Based on fruit weight, it was observed that yields were significantly different in response to foliar applications of biostimulants (Fig. 8). The highest yield was recorded from plants treated with Competitor followed by plants sprayed with CP2+BS. The lowest yield was recorded in plants treated with water (Fig. 8). It was also observed that yield of cull fruits was lower in plants sprayed with Competitor and CP2+BS compared to the other treatments. In addition, the weight of the large and extra-large fruits was higher in plants treated with Competitor and CP2+BS. Weight of medium sized fruits was higher in plants treated with CP2 compared with the other treatments. Our results confirmed the findings of other scientists who reported yield improvement in okra, wheat, and tomato in response to exogenous biostimulants[21,22].
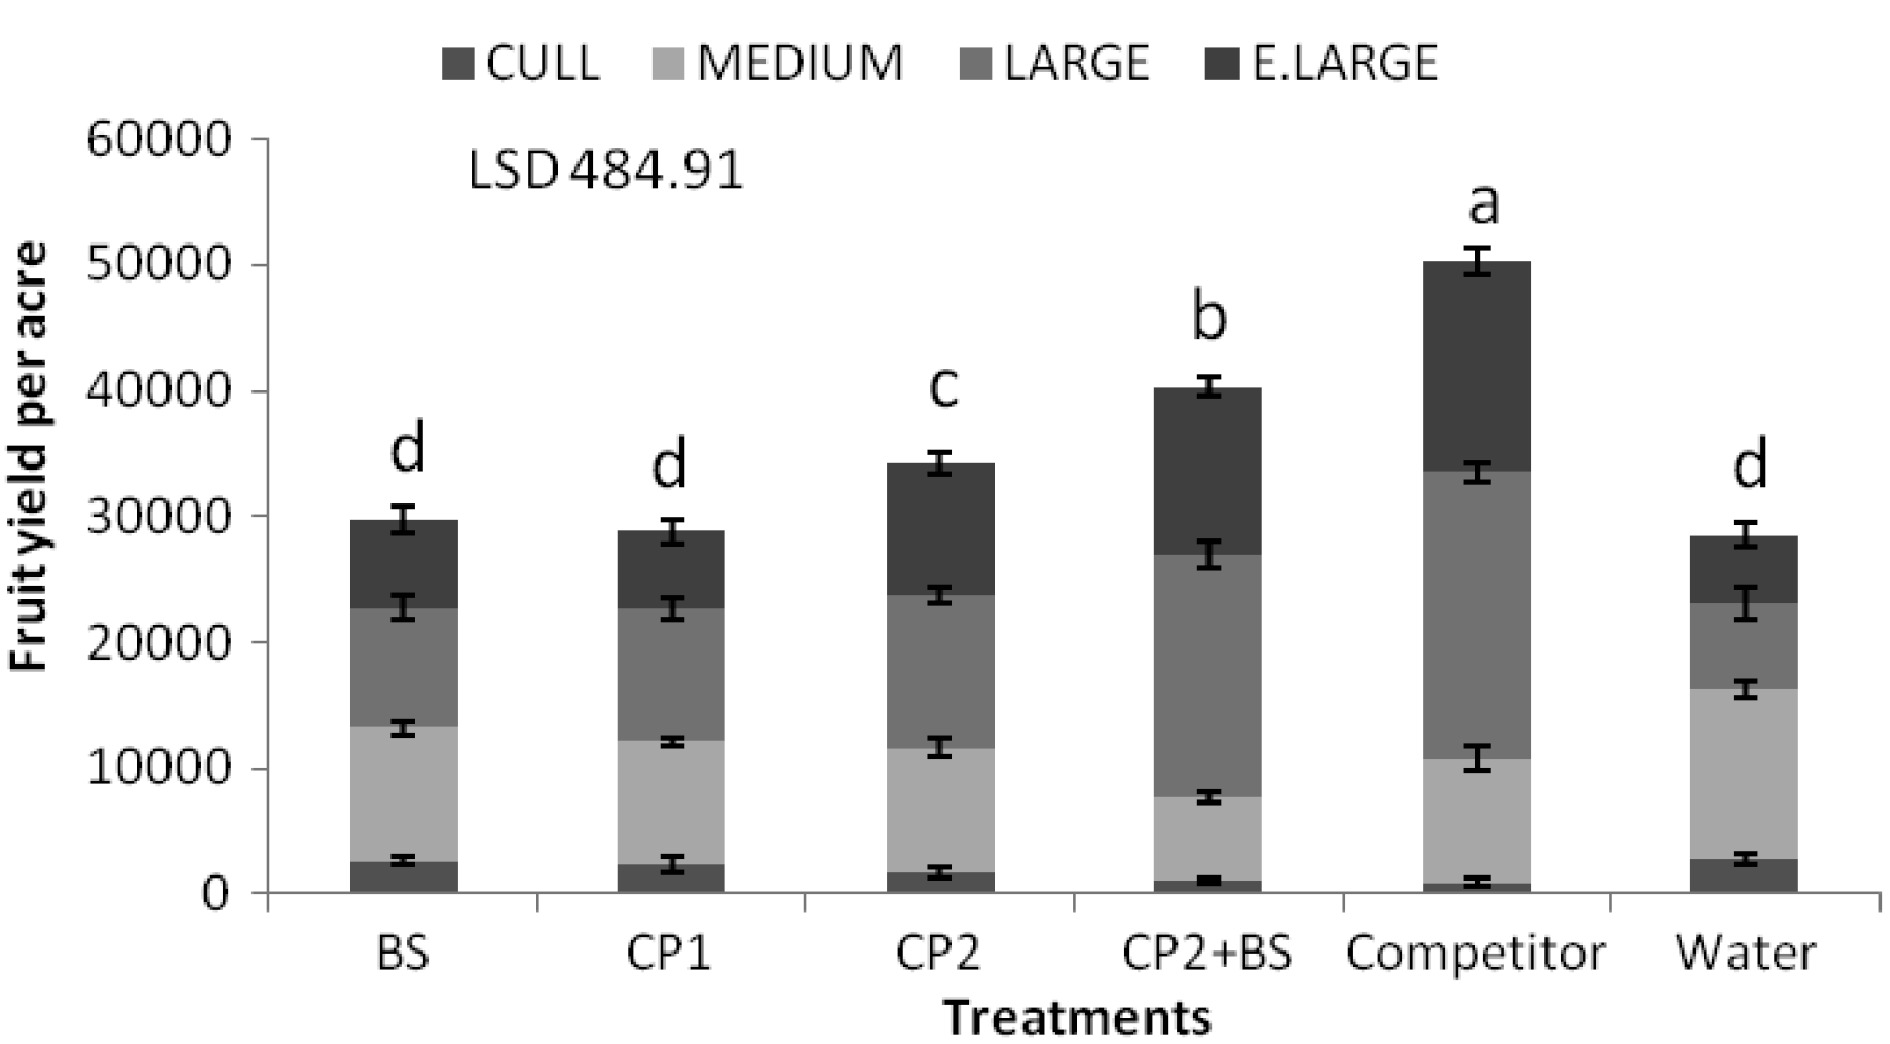
Figure 8.
Effect of biostimulants on fruit yield. Each of the values is the mean of four independent replicates ± SE (n=4). Values with different letters differ significantly at p ≤ 0.05. LSD = Least Significant Difference.
-
Five biostimulants were foliar applied with four replications to tomato plants in three growth stages in the field experiment. Among the five, two including Competitor and CP2+BS worked well on tomato production. Based on the results, the two biostimulants were significantly effective in augmenting tomato fruit yield and fruit quality in Florida. Physiologically, petiole sap testing was a reliable approach to monitor plant N status and provided a useful tool for nitrogen management for tomato production. The data also depicted that biostimulants significantly improved Pn, enzyme (NR and NiR) activities of N assimilation, relative water content, and nutrient uptake; consequently, greater fruit yield and quality. Further studies are needed to understand the plant physiological and biochemical backup mechanisms for the efficacy of biostimulants. Dose optimization of available biostimulants should also be examined for commercial tomato production.
-
This study was conducted in the University of Florida/IFAS Plant Science Research and Education Unit in Citra, FL, USA with five different biostimulants for tomato (Solanum lycopersicum L., 'Phoenix') production. The biostimulant treatments were comprised of CP1, CP2, CP2+BS, BS, Competitor, and water as the control. The application rates of the biostimulants were 450 ml ha-1, 900 ml ha−1, 900 ml ha−1 + 1 kg ha−1, 1 kg ha−1, and 1,169 ml ha−1, for CP1, CP2, CP2+BS, BS, Competitor, respectively. The main active ingredients in these biostimulants were N (0−7%), P (0−3%), K (0−7%), EDTA-chelated Mn (0−0.10%), and EDTA-chelated Zn (0−0.10%) (ICL Specialty Fertilizers, Dublin, OH, USA). The plot size was 5.58 m2 (3.05 m × 1.83 m). The spacing was 1.83 m between rows and 0.61 m between plants. There were five seedlings planted in each of the plots. The Randomized Complete Block Design (RCBD) was used with four replications. The pre-mixed fertilizer (224 kg ha−1 N, 196 kg ha−1 P, 224 kg ha−1 K) was provided by ICL Specialty Fertilizers, OH, USA. The biostimulants were foliar applied at three growth stages: pre-bloom, fruit set, and fruit color change. Hand-held sprayers were used for the application. The plants were irrigated with drip irrigation. Cultural practices including pest, disease, and weed management and irrigation were done timely to ensure the growing conditions appropriate for the tomato growth[23,24]. Plant height and stem diameter were measured using a ruler and Haglof Aluminum Tree Calipers (Ben Meadows, Jacksonville, WI, USA), respectively, 56 days after planting.
Leaf greenness was determined by using a SPAD meter (SPAD-502, Konica Minolta Sensing, Inc. Japan). For SPAD measurement, 30 leaves per replicate were used. Photosynthetic activity was measured using the Li-Cor (LI-6400, LI-COR, Lincoln, Nebraska, USA) from three fully developed leaves from the upper, middle, and lower portions of the plant one week after biostimulant application on 3/9/2017, 3/30/2017 and 4/13/2017 in fruiting, flowering, and fruit color change stage between 8 am to 10 am, respectively. Nitrate concentration in the plants was monitored by the petiole sap testing method and petioles were collected on the same day when SPAD reading was taken as mentioned above. Thirty leaf samples were taken from each plot and put in 15 by 20 cm zip lock bags. Petioles were separated from the leaves, cut into small pieces (2 mm) in length and manually mixed. A lemon squeezer was used to squeeze the sap from the petiole pieces. Nitrate concentration in the sap was measured using LAQUA Twin Nitrate Meter (Spectrum, Inc. USA) on the next day after SPAD readings i.e., 3/10/2017, 3/31/2017 and 4/14/2017. The nitrate meter was calibrated with standard solutions (300 and 2,000 mg l−1), and then samples were used for nitrate measurements.
Nitrate reductase activity (NRA) was determined following the protocol of Sym[25] while nitrite reductase activity (NiRA) was calculated from leaf samples harvested on the day of SPAD reading mentioned above stored at −80 oC and NRA activity was carried out after 4 days i.e., 3/14/2017, 4/6/2017 and 4/20/2017 following the method of Waterer[14]. For the determination of Ca, K, Mg, and P, dried plant material (0.5 g) from leaves and roots was ground and digested with concentrated sulfuric acid (H2SO4, 5 ml) and hydrogen peroxide H2O2 (35%, 0.5 ml per digestion tube) as described by Wolf[15]. The digested samples were then analyzed for P and K by a flame photometer (Jenway PFP-7; Keison Products, Chelmsford, UK). A graded series of standards (ranging from 10 to 100 mg l−1) of P and K were prepared, and standard curves were calculated. The values of P and K from the flame photometer were compared with the standard curves, and sample concentrations were computed. Calcium and Mg were determined titrimetrically using an EDTA solution (0.01 N) as a standard solution and Eriochrome Black T and Calcon as indicators as described by Bower & Hatcher[26].
Fruit quality attributes were evaluated at the Postharvest Physiology and Technology Lab, Horticultural Sciences Department, University of Florida, FL, USA. Fruit quality parameters tested were firmness, soluble solids concentration (SSC), total titratable acidity (TTA), and citric acid, malic acid, and tartaric acid content. Selected fruit samples were homogenized and centrifuged at 12,000 rpm for 20 min at 4 °C. The supernatant was filtered through cheesecloth and the juice was used to assess SSC and TTA. Soluble solids concentration was determined by placing two drops of juice on the prism of a digital handheld refractometer (model AR200, Reichert Analytical Instruments, Depew, NY, USA) and reported as Brix. Citric acid, malic acid, and total titratable acidity were determined with an automatic titrator (model 719 S Titrino; Metrohm, Herisau, Switzerland). The TTA was determined by diluting 6 g of tomato juice with 50 ml deionized water, and then titrating with 0.1 N sodium hydroxide (NaOH) to an endpoint of pH 8.2 and expressed as percent citric acid. The fruit firmness was measured by a fruit texture analyzer (TA HD Plus, Texture Technologies Corp, NY, USA).
There were three harvests in total. The three- harvests took place 60, 75, and 85 days after planting, respectively. Fruits were handpicked, put in plastic trays, graded through a tomato grader, and weighed with a digital scale. The number of fruits and total fruit weight were recorded for each plant.
The results of each of the variables were all statistically analyzed using STATISTICA 9.0 (Stat-Soft, Inc., Tulsa, OK, USA) by employing one-way ANOVA method. SigmaPlot 11 (Systat Software, Inc. CA, USA) was used to make the graphics.
We appreciate ICL Specialty Fertilizers for financially supporting and providing the biostimulants used for this study. Edward Hanlon, Dan Huber, and Mary Dixon at the University of Florida helped improve the manuscript. Merce Santana at UF helped measurements of tomato fruit quality. Muhammad Tahir at the University of Minnesota helped determined tomato leaf mineral nutrients and enzyme (NR and NiR.) activities. Merce Santana in the Sargent Lab at UF helped measurements of tomato fruit quality. Muhammad Tahir at the University of Minnesota helped determined tomato leaf mineral nutrients and enzyme (NR and NiR.) activities.
-
The authors declare that they have no conflict of interest.
- Copyright: © 2022 by the author(s). Published by Maximum Academic Press, Fayetteville, GA. This article is an open access article distributed under Creative Commons Attribution License (CC BY 4.0), visit https://creativecommons.org/licenses/by/4.0/.
-
About this article
Cite this article
Shahid MA, Liu G. 2022. Application of biostimulants to improve tomato yield in Florida. Vegetable Research 2:6 doi: 10.48130/VR-2022-0006 

Application of biostimulants to improve tomato yield in Florida
- Received: 06 January 2022
- Accepted: 19 April 2022
- Published online: 25 May 2022
Abstract: Biostimulants are shown to increase crop production. This study was conducted to investigate the effects of individual biostimulants on tomato ('Phoenix') growth and yield. Five biostimulants: CP1, CP2, BS, CP2+BS, Competitor, and Water (control) were foliar applied at three different stages: pre-blooming, fruit setting, and color changing. The concentration of calcium (Ca), potassium (K), magnesium (Mg), and phosphorus (P) in leaves and roots were also determined. The results showed that plants treated with biostimulants had greater concentrations of Ca, K, Mg, and P compared to those treated with water only. Competitor and CP2+BS significantly increased yield, plant height, and stem diameter by 76% and 41%, 42% and 34%, and 29% and 24%. Likewise, leaf greenness, net photosynthetic rate (Pn), relative water content (RWC), nitrate level in petiole sap, and fruit quality (citric acid, malic acid, tartaric acid, soluble solid concentration, and fruit firmness) were also improved by Competitor. In addition, enzymatic activities of nitrate reductase (NR) and nitrite reductase (NiR) were significantly increased by biostimulants compared to the control. Statistically, Competitor and CP2+BS showed the greatest augmentation in plant height, stem diameter, leaf greenness, PN, RWC, nitrate level in petiole sap, and fruit yield and quality. Similarly, Competitor-treated plants also increased NR, NiR, leaf Ca, leaf K, leaf Mg, and leaf P by 34%, 70%, 22%, 26%, 27%, and 45%, respectively. Based on the findings of this study, application of Competitor or CP2+BS showed promising results and may be used as a BMP tool for tomato production in Florida.
-
Key words:
- Biostimulants /
- Photosynthesis /
- Relative water contents /
- Nutrient contents