












-
Understanding the complexity and stability of soil microbial communities is crucial to elucidating their ecosystem functions and responses to global climate change[1−3]. Many investigations have classified soil microbial communities into separate subcommunities to investigate the complicated biogeographic patterns of these groups and their ecological roles within the community[4,5]. Core taxa are widely distributed across diverse environments, occupy relatively stable ecological niches, and play an important role in enhancing the ability of soil microbial communities to adapt to environmental changes[6]. Abundant taxa make up a considerable proportion of the microbial community and are critical for sustaining essential ecosystem functions. In contrast, rare taxa have lower abundance in the community but are important for genetic diversity and community function, contributing to the regulation and maintenance of ecosystem functions[7−9]. Although previous studies have shown that these subcommunities exhibit distinct biogeographic patterns[10−12], the assembly mechanisms shaping these patterns and their consequences for community stability remain poorly understood[13].
A substantial body of literature has documented soil biodiversity and community assembly across various ecosystems, including farmlands, restored grasslands, karst ecosystems, and polluted areas[14−17]. Typically, both stochastic and deterministic processes play a role in shaping a community[18], which shape biological diversity not only through environmental adaptation and interactions, but also by influencing species co-occurrence patterns, thereby altering community structure and stability[19,20]. However, an unresolved issue is how the assembly processes of subcommunities with varying abundance shape biota diversity and stability. Despite the coexistence of different microbial subcommunities in the same habitat, many studies have indicated that different taxa do not assemble in the same way[21,22]. Core taxa typically exhibit stronger phylogenetic signals, and their assembly may be mainly driven by dispersal limitation[23]. Abundant taxa are primarily shaped by stochastic processes, with dispersal limitation and neutral processes playing crucial roles. By contrast, rare taxa are more strongly influenced by homogenizing selection, where similar environmental conditions tend to select for rare species with similar ecological traits, leading to increased phylogenetic clustering within the community[24−26]. This suggests that environmental disturbances may be more likely to reduce the species diversity of rare taxa, thus simplifying ecological networks and lowering community stability. However, a field soil reciprocal transplantation experiment has shown that rare microbial communities exhibit greater stability under changing climatic conditions, with minimal temporal fluctuations and more consistent and stable diversity[27]. Consequently, investigating the assembly processes of groups with varying abundances and their correlation with community complexity and stability is crucial for elucidating the mechanisms underlying the formation of underground biological communities.
Evidence suggests that community complexity, through mechanisms such as diversity, biological interactions, and niche differentiation, influences ecosystem stability[28−30]. Nevertheless, little research has been done on how microbial subcommunities with different abundances affect community stability, despite these taxa being key contributors to community complexity. Network analysis serves as a crucial tool for elucidating species interactions and complex ecological relationships[31]. The ecological roles and functional contributions of different subcommunities within their community networks vary. Abundant and core taxa typically exhibit higher average degree, eigenvector centrality, and clustering coefficients in community co-occurrence networks, acting as 'hubs' or 'bridges' that promote species interactions[32]. These taxa not only enhance the resistance of the community but also contribute to network complexity, thereby influencing community stability and ecosystem functioning[33]. Rare taxa typically inhabit unique ecological niches and provide functional redundancy under varying environmental conditions, enhancing ecosystem adaptability and resilience[34]. Moreover, rare taxa may further enhance the overall community function by boosting the functionality of abundant taxa[35]. Previous studies have predominantly explored the impact of environmental changes on ecosystem network stability, but empirical evidence on the contributions of taxa of different abundances to community stability, especially across broad environmental gradients, remains insufficient. Therefore, revealing how environmental factors influence community complexity and stability by shaping subcommunity assembly trajectories is critical to understanding how ecosystem dynamics respond to global environmental change[36].
Precipitation across the Loess Plateau exhibits a marked decrease from southeast to northwest, creating a water-heat gradient transitioning from semi-humid to arid conditions[37]. The interplay of climate variation, complex topography, and long-term vegetation has contributed to the formation of diverse ecological types in the region[38−40]. Such climatic and geographical conditions offer a favorable context for investigating soil biogeographic patterns and community characteristics under environmental gradients. Previous studies have mainly focused on whole bacterial communities or diversity patterns, leaving it unclear how core, abundant, and rare subcommunities differentially assemble and contribute to bacterial network complexity and stability. To address this gap, we conducted extensive sampling on the Loess Plateau, collecting 117 soil samples across broad environmental gradients. We applied high-throughput sequencing techniques to quantify the assembly of soil bacterial subcommunities of varying abundance and their association with ecological network characteristics. A series of physicochemical properties of vegetation and soil were measured in order to elucidate the underlying environmental factors. Given that core, abundant, and rare taxa differ in their distribution breadth, niche specialization, and potential ecological roles, they are expected to show distinct phylogenetic patterns, assembly processes, and contributions to community network properties. We hypothesize that, within a complex environmental gradient: (i) core and abundant taxa have significantly shorter phylogenetic distances than rare taxa; (ii) deterministic processes will principally govern the community assembly of rare taxa, whereas stochastic processes dominate both abundant and core taxa; and (iii) community complexity will be primarily driven by core and abundant taxa, while rare taxa will be crucial in regulating community stability.
-
In July 2016, soil sampling was conducted along four regions of the Loess Plateau, stretching from north to south (34°24'–38°16' N, 107°54'–109°43' E), with a total of 117 soil samples collected (Supplementary Fig. S1). The mean annual temperature of the sampling areas ranged from 7.4 to 11.4 °C, and the mean annual precipitation varied between 365 and 910.6 mm. The soil samples were acquired from a variety of ecosystems, including primary forests, secondary forests, plantations, artificial shrublands, natural grasslands, and artificial grasslands, which comprehensively represent the ecological diversity along the latitudinal gradient of the Loess Plateau.
A 25 m × 25 m plot was established at each sampling location, and 10 soil cores were randomly collected from each plot. Each core had a depth of 10 cm and a diameter of 5 cm. All collected cores in an individual plot were then mixed as a soil sample. After sampling, all samples were sieved through a 2.0 mm sieve, and visible roots and stones were manually removed from the soil in the process. The samples were transported under cold chain conditions and stored at −80 °C to maintain biochemical stability. Moreover, at each sampling locale, five 5 m × 5 m plots for shrubs or trees and ten 1 m × 1 m plots for herbaceous plants were established for the purpose of vegetation surveys. Specifically, the plant species within the quadrats were identified and counted, and the canopy coverage and height of each species were estimated visually and with a ruler. Vegetation community assessments were based on the following indices: the Gleason richness index[41], the Shannon–Wiener diversity index[42], and the Pielou evenness index[43]. These indices were calculated using the formulas below:
$ G=\left(S-1\right)/\ln(N) $ (1) $ H'=-\sum_{i=1}^{S}({p}_{i}\ln{p}_{i}) $ (2) $ J'=H'/\log (S) $ (3) In the equations, G represents the vegetation richness index; S is the total number of species in the quadrat; N is the total number of individuals of all species within the quadrat; H′ is the Shannon–Wiener diversity index; Pi refers to the relative abundance of the kth species (i.e., the proportion of individuals of the kth species relative to the total number of individuals); and J′ is the Pielou evenness index.
Soil physicochemical analysis
-
The soil samples, after air-drying and sieving, were thoroughly dispersed and then analyzed using a laser diffraction particle size analyzer to measure the soil particle size distribution, obtaining the contents of sand (2,000–50 μm), silt (50–2 μm), and clay (< 2 μm). Soil moisture content was determined by oven-drying fresh soil samples until constant weight and calculating the weight loss relative to the dry mass. The pH of the soil was determined using a glass electrode in a suspension with a 1:2.5 ratio of soil to deionized water[44]. A 100 cm3 soil sample was first dried, and then the ratio of its dry mass to volume was calculated to determine the soil bulk density. The SOC content was measured by the modified Walkley–Black redox titration method[44]. The total nitrogen content was determined using the Kjeldahl method. Soil samples were treated with sulfuric acid and perchloric acid, after which total phosphorus content was analyzed colorimetrically. Nitrate nitrogen and ammonium nitrogen contents were extracted with 2 M KCl solution and subsequently measured using a continuous flow analyzer[45]. The determination of soil microbial biomass carbon, nitrogen, and phosphorus was performed using chloroform fumigation. After filtering the extracted solution, the contents were analyzed by a continuous flow analyzer. The conversion factor for microbial biomass carbon and nitrogen was 0.45[46], while the conversion factor for microbial biomass phosphorus was 0.4[47].
Illumina sequencing and bioinformatics
-
DNA was extracted from 0.5 g of fresh soil samples using the FastDNA Spin Kit according to the manufacturer's instructions. This process was performed in triplicate. Agarose gel electrophoresis (1%) was used to evaluate the quality of the DNA samples[48]. Subsequent quantification of the DNA samples was carried out using a NanoDrop ND-2000 UV-Vis spectrophotometer. In order to amplify the V4 region of the bacterial 16S rRNA gene, the specific primer 515F was selected for the amplification reaction. The PCR reaction was conducted within a 20-μL system, including an initial denaturation at 95 °C for 2 min, followed by denaturation at 95 °C for 30 s, annealing at 58 °C for 30 s, extension at 72 °C for 30 s, and finally extension at 72 °C for 5 min. The amplified DNA was evaluated for quality control using a 2% agarose gel. Following this, the DNA was purified using a gel extraction kit, and the samples were prepared in equal molar ratios. The purified PCR products were sequenced using paired-end 2 × 300 bp sequencing on the Illumina MiSeq platform. Sequence data were quality-controlled using the DADA2 package, with paired-end sequences filtered and merged to generate amplicon sequence variants (ASVs)[49]. Sequence alignment and chimeric sequence removal were performed with the RDP classifier from the SILVA database, release 138, and the valid sequences were classified accordingly.
Identification of different subcommunities
-
The raw sequencing data were subjected to quality control, and ASVs containing fewer than two reads across all samples were filtered out to reduce the impact of spurious low-abundance ASVs. To reduce the potential effect of uneven sequencing depth, 31,000 sequences, the minimum sample size, were randomly selected from each sample as a subset for sequencing normalization. The classification of distinct bacterial subcommunities was based on the relative abundance of ASVs. Taxa were classified into three categories: abundant (> 0.1%), rare (< 0.001%), and those falling between these values were classified as intermediate. Additionally, ASVs present in a minimum of 80% of the samples were designated as core taxa[32]. Core taxa were identified independently of the abundance-based classification and could therefore overlap with any of the three categories.
Assembly process and co-occurrence network construction
-
MST, the Modified Stochasticity Ratio, was employed to assess the stochasticity of ecological processes across different taxonomic groups[50]. MST evaluates whether community assembly is dominated by stochastic processes (MST > 0.5) or deterministic processes (MST < 0.5) by comparing the observed species abundance data with expected data from a null model[20]. Furthermore, the relationship between the modified stochasticity ratio and the diversity, stability, and complexity of species was examined using Pearson correlation analysis.
A co-occurrence network was constructed to identify correlations between different bacterial subcommunities based on Spearman correlation. The presence of a statistically significant co-occurrence relationship was determined by the condition that the absolute value of the correlation between two ASVs was > 0.6 and the p-value was < 0.05[51]. The process of co-occurrence network construction included only ASVs that were present in a minimum of two samples. The network topological features were calculated. Degree reflects the number of direct connections a node has with other nodes; betweenness centrality characterizes the frequency of a node occurring on the shortest paths between other nodes, indicating its control and influence in the network; and closeness centrality measures the average distance from a node to all other nodes in the network and reflects the efficiency of the node in connecting different parts of the network. To investigate the association between soil bacterial taxa and community network characteristics, we extracted subnetworks for each sample and calculated the topological features. The complexity of subnetworks was quantified using standardized subnetwork topological features, including the number of nodes, edges, average degree, clustering coefficient, density, and the reciprocal of average path length and network diameter. These metrics respectively reflect different aspects of network structure. To integrate these related metrics into a single comprehensive metric, we applied non-metric multidimensional scaling. The first NMDS axis captures the largest proportion of variation among multiple complexity-related metrics and was therefore used as a comprehensive metric for subnetwork complexity[52]. The stability of community networks was assessed using a measure based on cohesion, which characterizes the connectivity between groups in co-occurrence networks and reflects the positive and negative co-occurrence relationships between species[53]. Specifically, stability was quantified as the absolute value of the ratio of negative to positive cohesion. Higher stability indicates a stronger balance between competitive and cooperative interactions, which is believed to enhance the network's resistance to disturbances. Co-occurrence network visualization was completed using the Gephi 0.10.1 platform[54].
Data analysis
-
The mean nearest taxon distance (MNTD) was calculated using the function named 'ses.mntd' from the 'picante' package. Additionally, we calculated βMNTD to assess the phylogenetic similarity among samples using the 'comdistnt' function from the same package. To investigate how phylogenetic similarity changes with geographic or environmental distances, we constructed distance decay models and used linear regression analysis to evaluate the rate of similarity decay across different subcommunities. Using the 'plspm' package, Partial Least Squares Path Modeling (PLS-PM) was used to analyze the effects of environmental factors on microbial subcommunities and their influence on community complexity and stability. In the prior model, climate factors determine soil and plant characteristics, which in turn influence plant traits. Together, these three factors affect different microbial subcommunities, thereby indirectly influencing the bacterial community traits. Moreover, community network complexity directly impacts network stability. Given the interrelations among these factors, PCA was conducted on the correlated variables of soil, vegetation, and climate. Different environmental groups were represented by their PC1 scores[55,56], which explained 62.63%, 73.29%, and 81.04% of the variance, respectively. The composition of subcommunities was represented by the first component from NMDS. To evaluate potential spatial effects, Mantel and partial Mantel tests were conducted using Bray–Curtis dissimilarities, geographic distance, and environmental distance matrices. Moran's I tests were further used to assess residual spatial autocorrelation after accounting for environmental gradients, ecosystem type, and vegetation type. All statistical analyses were executed in R 4.2.1[57].
-
We analyzed the abundance distribution of bacterial subcommunities and observed the following patterns: nearly half (50.02%) of all sequenced ASVs belonged to rare subcommunities with a relative abundance of less than 0.001%. However, these rare subcommunities collectively accounted for only 4.24% of the total abundance in the samples. In contrast, although abundant subcommunities represented less than 1% of the total ASVs, they contributed 31.48% of the overall abundance. Moreover, only 0.34% of ASVs were found to occur in over 80% of the samples. These ASVs, classified as core subcommunities, exhibited a relatively high mean abundance (21.19%) across samples. Further analysis of taxonomic composition revealed significant differences among rare, abundant, and core subcommunities at the phylum level. Within the core and abundant subcommunities, the predominant phyla included Actinobacteria, Proteobacteria, and Acidobacteria, which collectively accounted for over 80% of the total abundance. By contrast, rare subcommunities were more taxonomically diverse, with Proteobacteria and Acidobacteria being the most prevalent members (Fig. 1a).
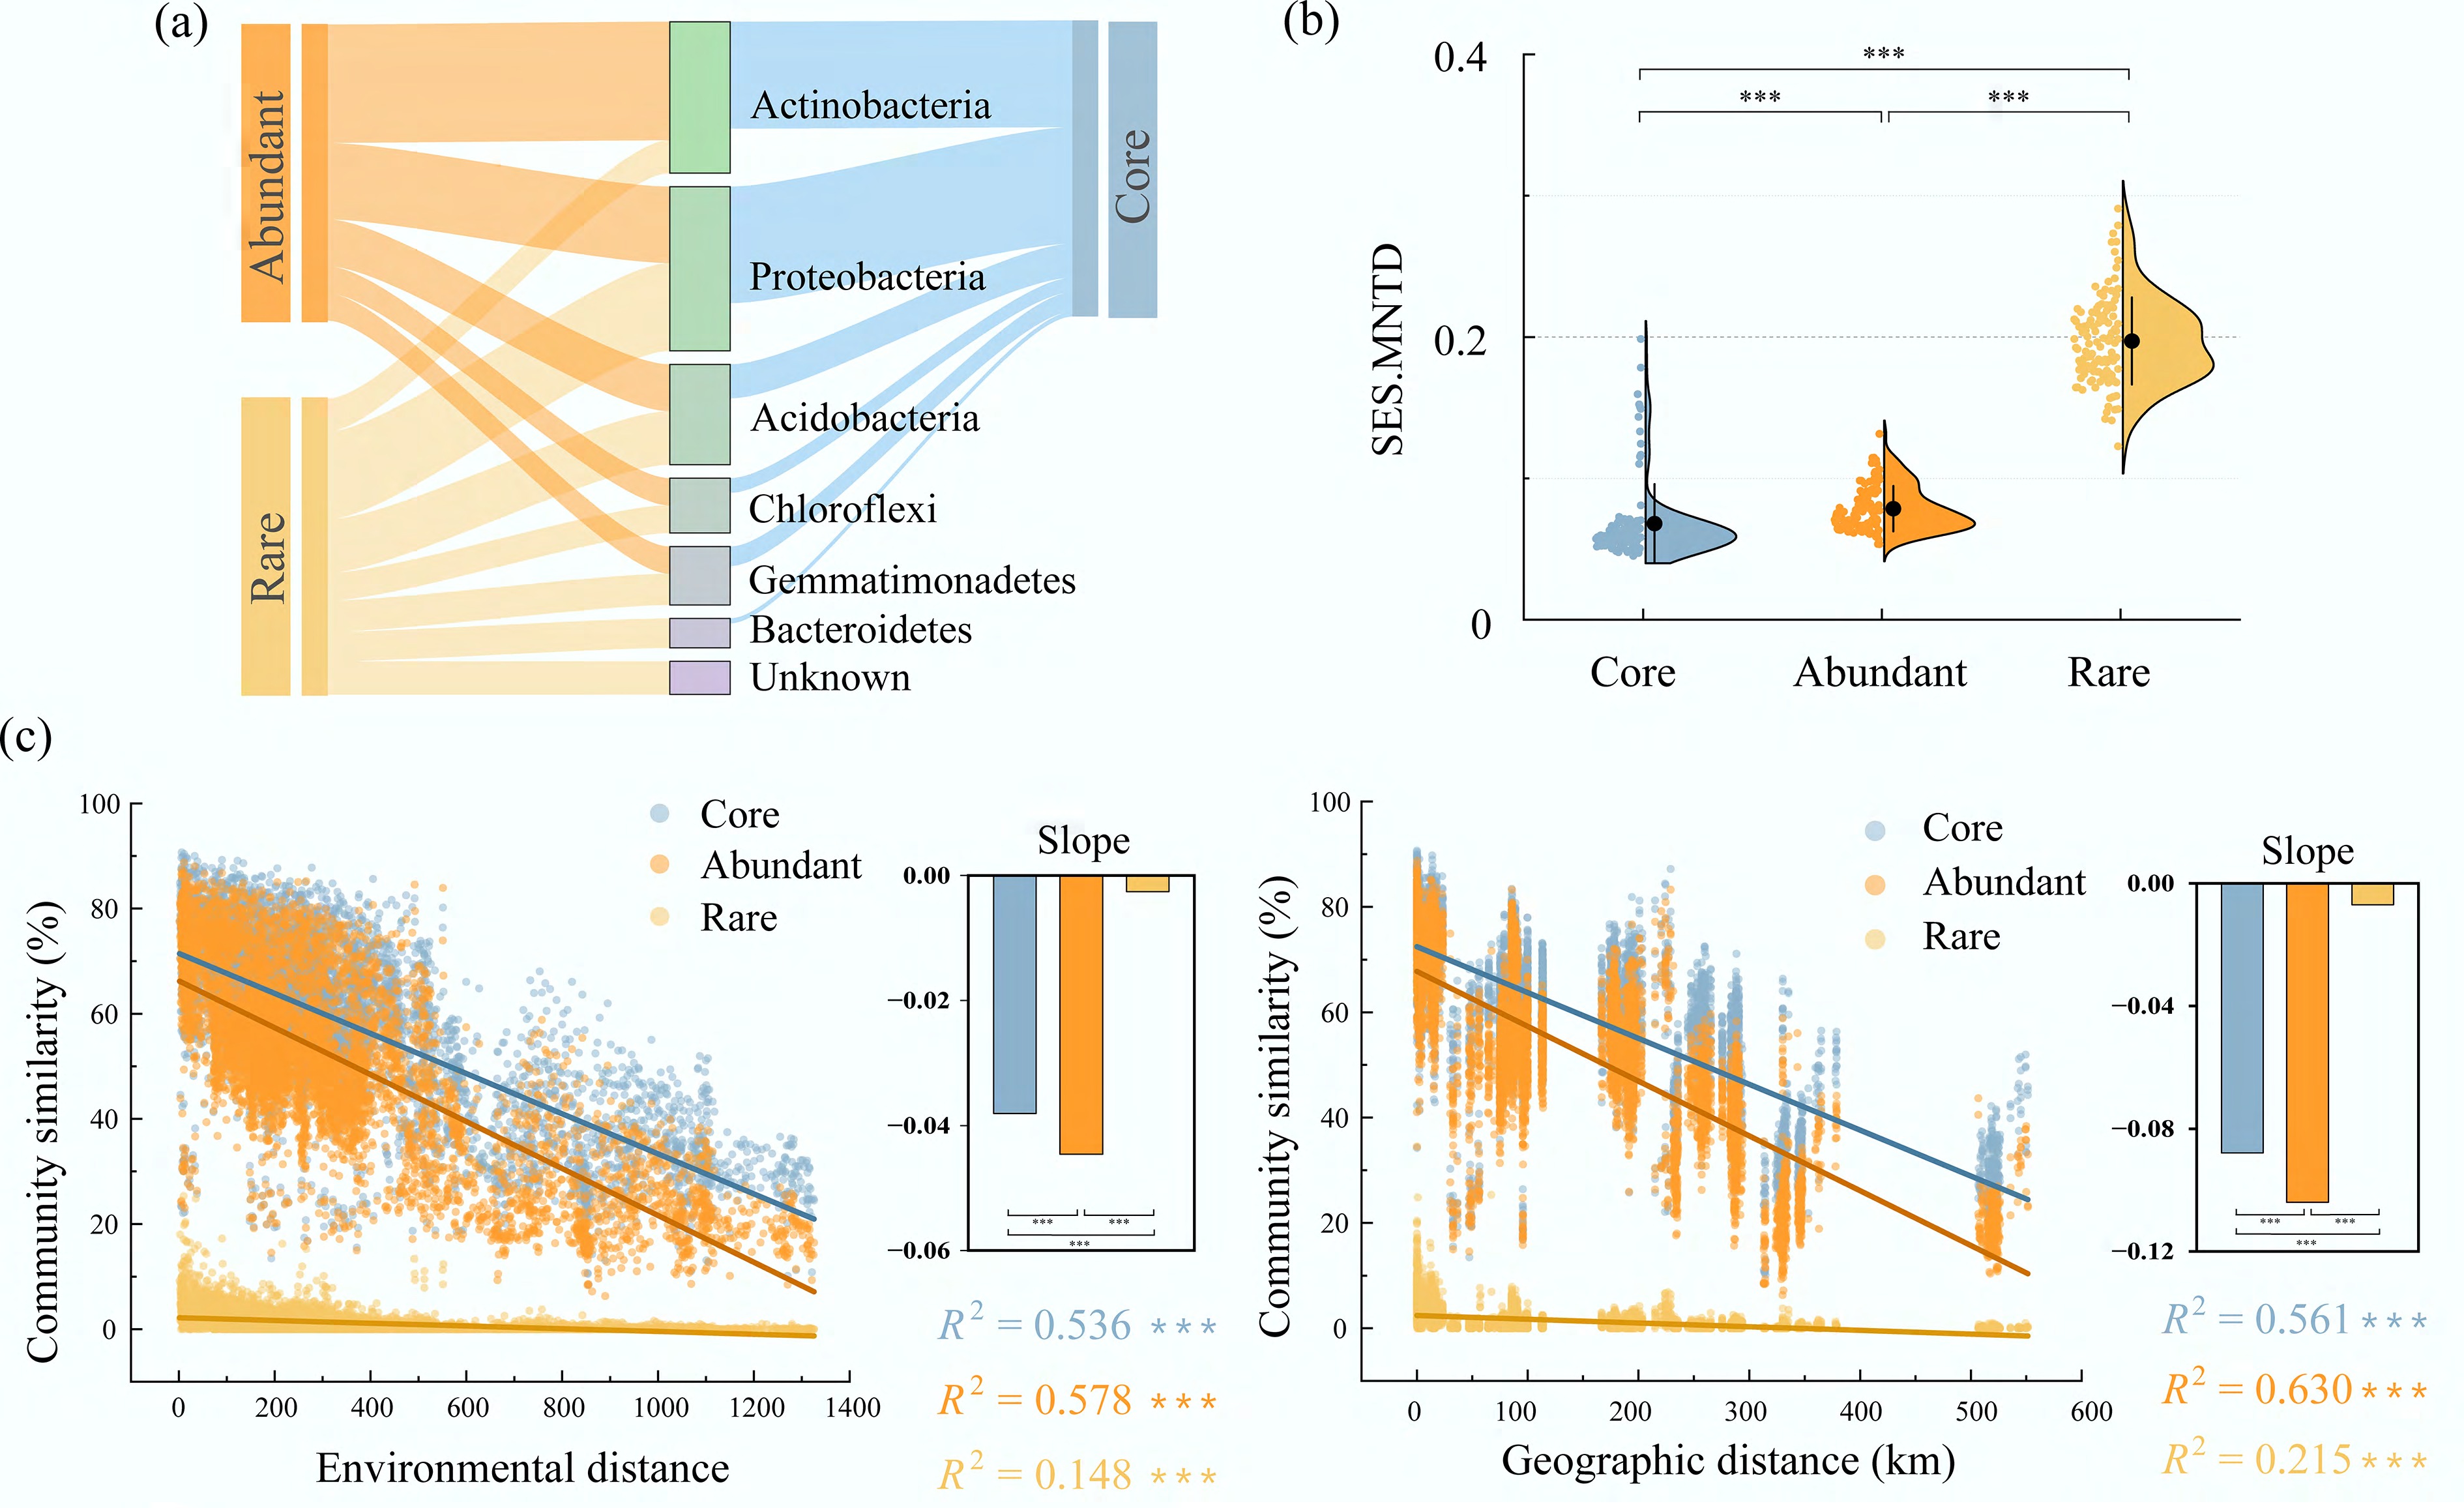
Figure 1.
Taxonomic composition and phylogenetic patterns of core, abundant, and rare subcommunities. (a) Distribution of different subcommunities (core, abundant, rare) at the phylum level, with band thickness representing the number of subcommunities assigned to each phylum. (b) Boxplots showing the distribution of SES.MNTD values for different subcommunities. (c) Phylogenetic distance-decay curves illustrating changes in community similarity (1–βMNTD) of different subcommunities with increasing geographical and environmental distances. Asterisks denote significance levels (*** p < 0.001; Wilcoxon rank-sum test).
SES.MNTD indicated significant differences in phylogenetic relatedness among different groups (Fig. 1b). Results from the distance-decay model showed that phylogenetic similarity, calculated as one minus beta mean nearest taxon distance (1−βMNTD), significantly decreased with increasing geographic or environmental distance. Notably, core and abundant subcommunities experienced a significantly higher rate of phylogenetic similarity decay than rare subcommunities (Fig. 1c).
Community assembly processes
-
Deterministic processes principally govern the community assembly of core subcommunities, whereas stochastic processes dominate both rare and abundant subcommunities. Furthermore, the MST of core subcommunities differed substantially from those of rare and abundant subcommunities (Fig. 2a). We further examined the trends of MST values in relation to environmental and geographic distances. With increasing environmental distance, MST values for core and abundant subcommunities showed a significant decline, while no significant change was observed for rare subcommunities (Fig. 2b). In contrast, MST values for abundant and rare subcommunities exhibited an increase with geographic distance (Fig. 2c).
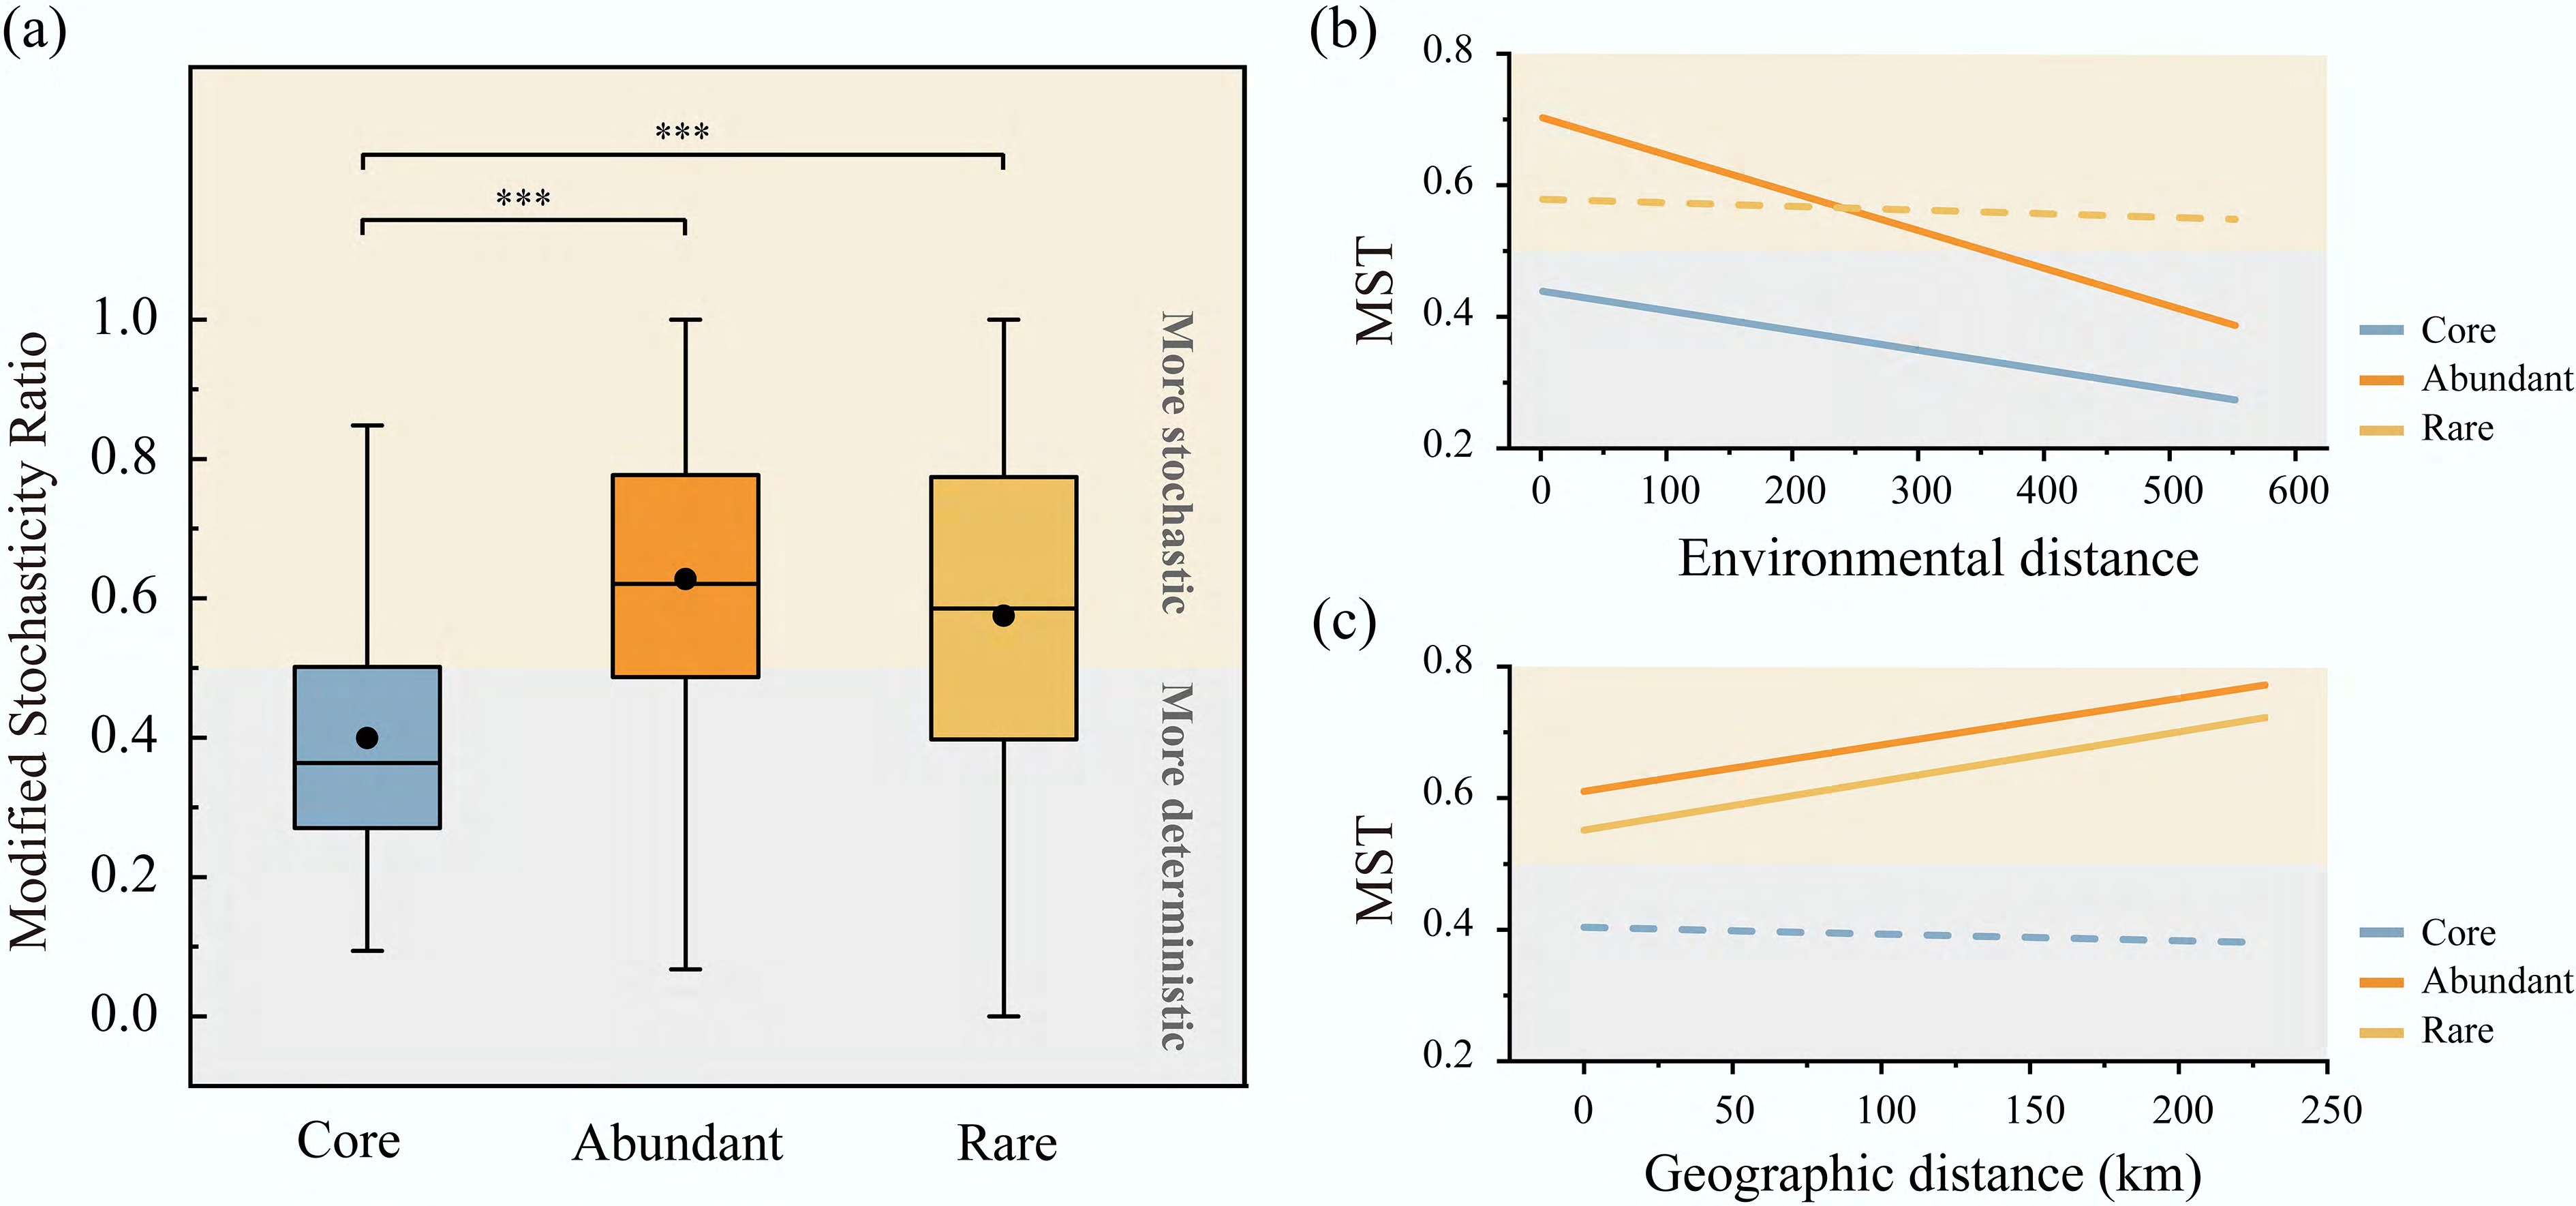
Figure 2.
MST ratios and their relationships with environmental and geographical distances for core, abundant, and rare subcommunities. (a) Modified stochasticity ratio (MST) of different bacterial subcommunities is presented, with black dots representing the mean values. The MST index has a threshold of 50%, distinguishing between more deterministic (< 50%) and more stochastic (> 50%) assembly processes. *** p < 0.001 (Wilcoxon rank-sum test). (b), (c) Trends in MST ratios with environmental and geographical distances. Solid lines indicate significant relationships (p < 0.05), whereas dashed lines represent non-significant relationships (p ≥ 0.05).
Co-occurrence networks and topological features
-
In the network constructed, 9,990 ASVs and 194,063 edges were identified. Among these ASVs, 6,318 were classified as intermediate subcommunities, 3,560 as rare subcommunities, and 112 as abundant subcommunities (Fig. 3a). Additionally, 52 ASVs were identified as core subcommunities, occupying crucial positions within the network structure (Fig. 3b). The core and abundant subcommunities exhibited higher closeness centrality and node degree in comparison to the rare subcommunities (Fig. 3c−e). The internal connections within each taxonomic group were highly clustered, Within-group connectivity comprised 94 edges among core ASVs, 765 among abundant ASVs, and 12,970 among rare ASVs. Regarding inter-group connections, abundant and rare subcommunities showed fewer associations, with only 15 edges connecting them. In contrast, both groups exhibited more frequent external connections with intermediate subcommunities. Furthermore, correlation analysis revealed that core and abundant subcommunities significantly influence the topological characteristics of the subnetworks (Supplementary Fig. S2).
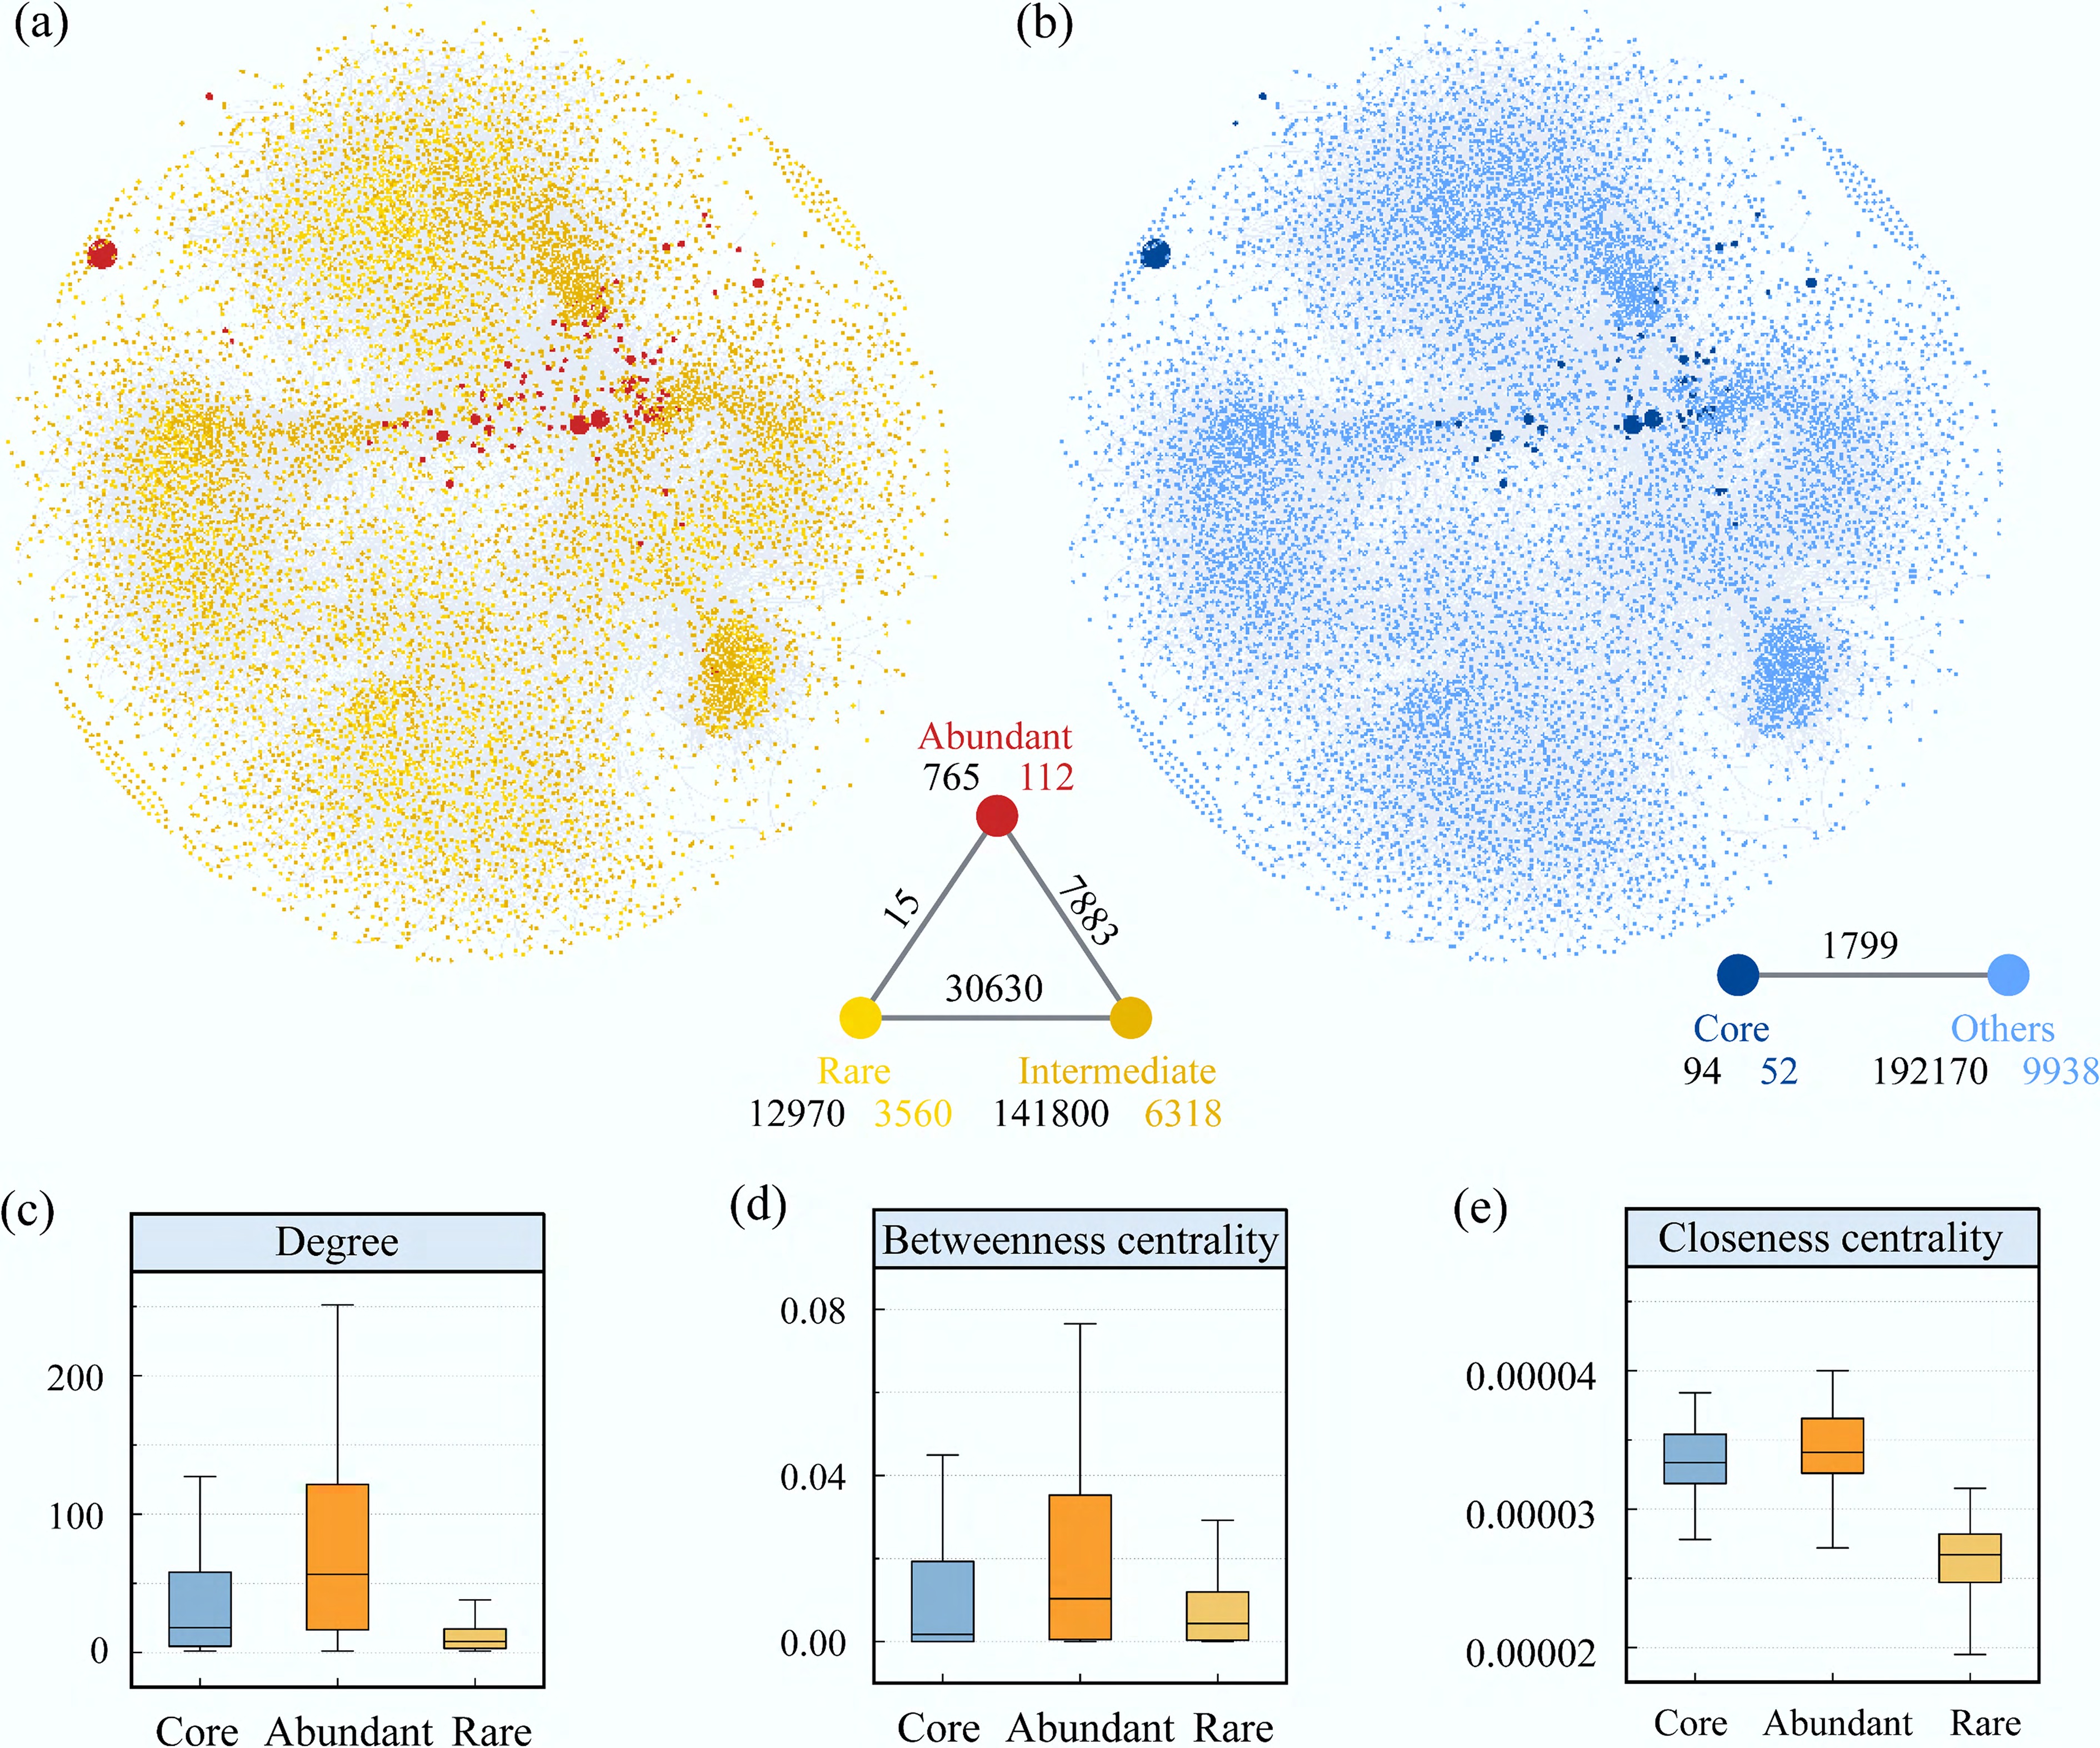
Figure 3.
Co-occurrence patterns and ecological niche properties of different bacterial subcommunities based on correlation analysis. (a) Co-occurrence network of abundant (red nodes), intermediate (yellow nodes), and rare (light yellow nodes) subcommunities. Node size represents taxon abundance, and lines indicate co-occurrence relationships between subcommunities. The triangular plot below shows the number and strength of connections among different subcommunity groups. (b) Co-occurrence network of core and other subcommunities. Node size represents taxon abundance. The lines below indicate the number and strength of connections between core and other subcommunities. (c)–(e) Distributions of degree, betweenness centrality, and closeness centrality for core, abundant, and rare subcommunities.
Relationship between assembly and community diversity, complexity, and stability
-
Linear regression analysis indicated a strong positive association between community complexity and community stability (R2 = 0.543, p < 0.001; Supplementary Fig. S3). Consistent with the variation characteristics of different taxonomic groups, differences in geographic and environmental distances among plots significantly influenced community complexity and stability (Supplementary Fig. S4). For both abundant and rare subcommunities, there was a substantial negative association between MST and species diversity and community stability. However, for core subcommunities, MST exhibited only a weak positive correlation with community stability (Fig. 4; Supplementary Tables S1–S3).
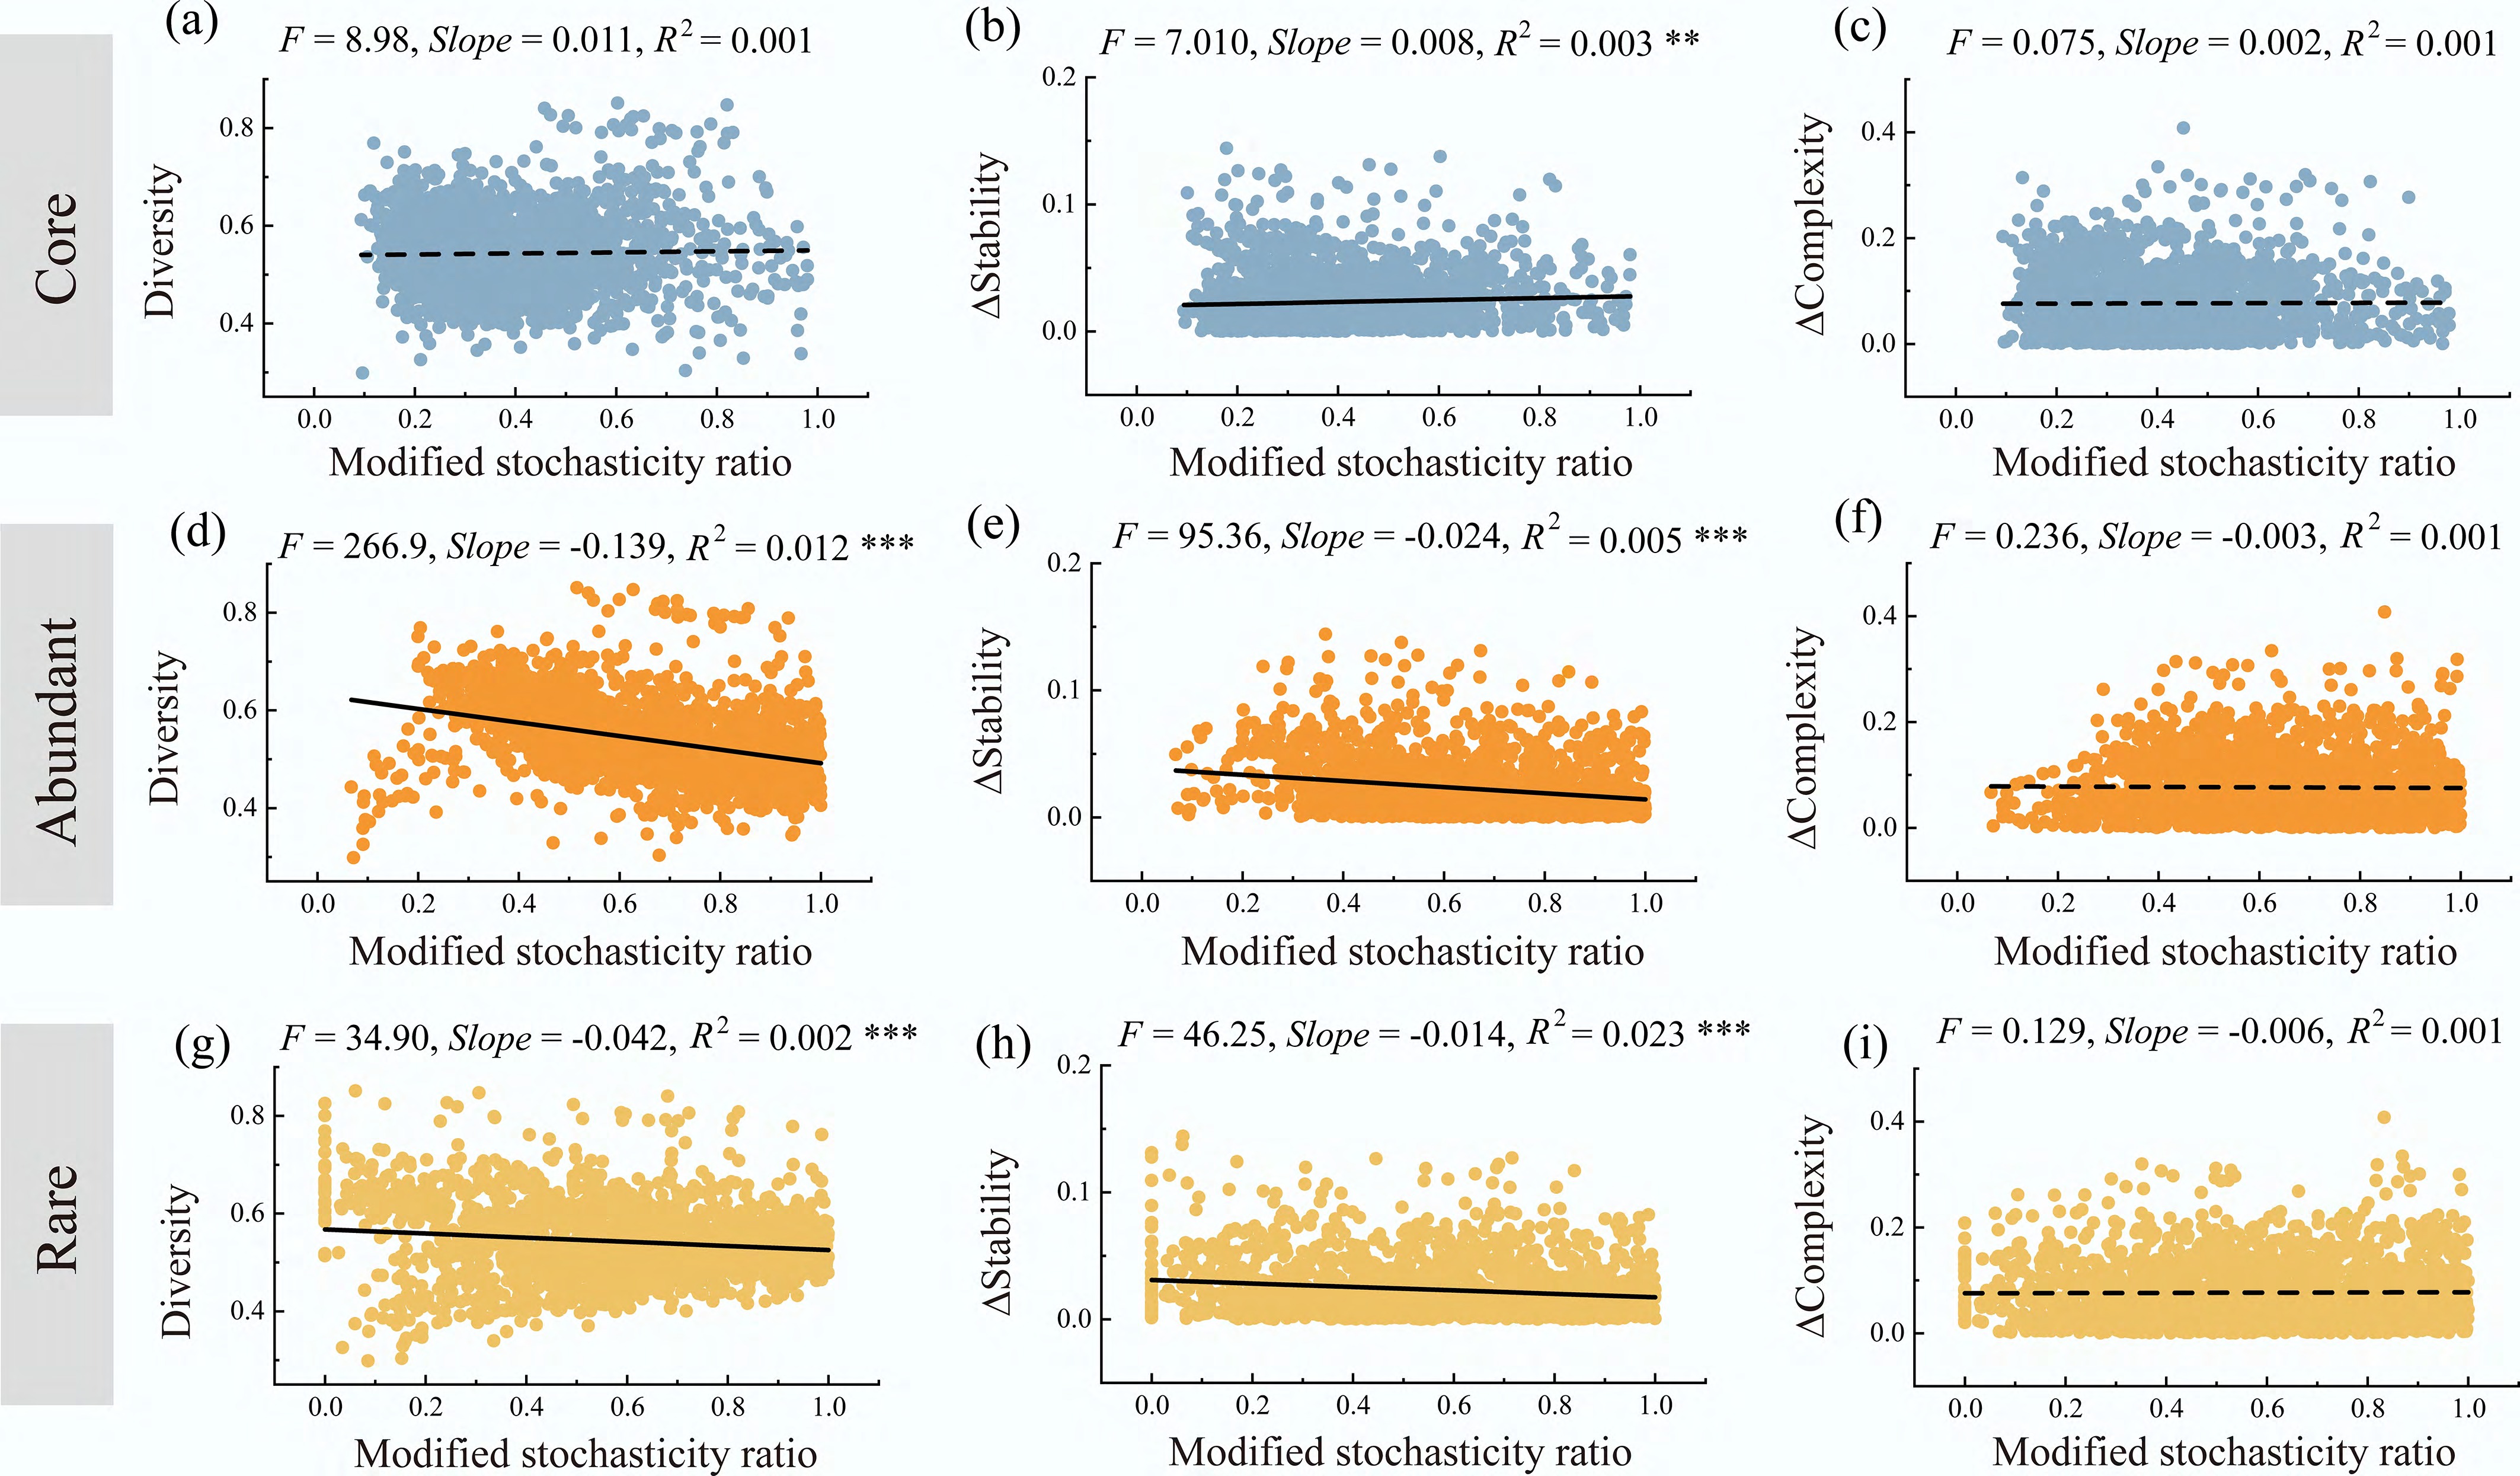
Figure 4.
Relationships between the assembly processes of different bacterial subcommunities and community diversity, stability, and complexity. Relationships between the assembly processes of core subcommunities and (a) community β-diversity, (b) community stability, and (c) community complexity. Relationships between the assembly processes of abundant subcommunities and (d) community β-diversity, (e) community stability, and (f) community complexity. Relationships between the assembly processes of rare subcommunities and (g) community β-diversity, (h) community stability, and (i) community complexity. Each panel displays the linear regression model (black line) and the corresponding correlation coefficient. ** p < 0.01; *** p < 0.001.
Effects of environment and subcommunities on subnetwork properties
-
Climate factors, soil characteristics, and vegetation collectively drive the environmental variations among the samples (Supplementary Fig. S5; Supplementary Table S4). To further explore the associations among environmental factors, characteristics of different bacterial subcommunities, and the complexity and stability of the community, we constructed an a priori model (Supplementary Fig. S6). Our analysis using PLS-PM revealed that climatic conditions, soil attributes, and plant traits had different impacts on the diversity and composition of different subcommunities. Specifically, climatic factors were the primary drivers affecting core and abundant subcommunities, whereas rare subcommunities were mainly influenced by soil properties. Furthermore, the strongest relationship observed in the PLS-PM analysis was between core subcommunities and the network complexity of bacterial communities. Rare subcommunities are vital to maintaining community network stability, while core and abundant subcommunities indirectly influenced network stability by modulating network complexity (Fig. 5a, b). Consistently, boosted regression tree (BRT) analysis further supported these patterns, highlighting that community complexity was mainly associated with soil and climatic factors, whereas community stability was primarily driven by microbial composition, particularly rare taxa (Fig. 5c). Finally, Moran's I analyses further confirmed the robustness of these relationships after accounting for spatially structured environmental gradients, ecosystem type, and vegetation type (Supplementary Table S5).
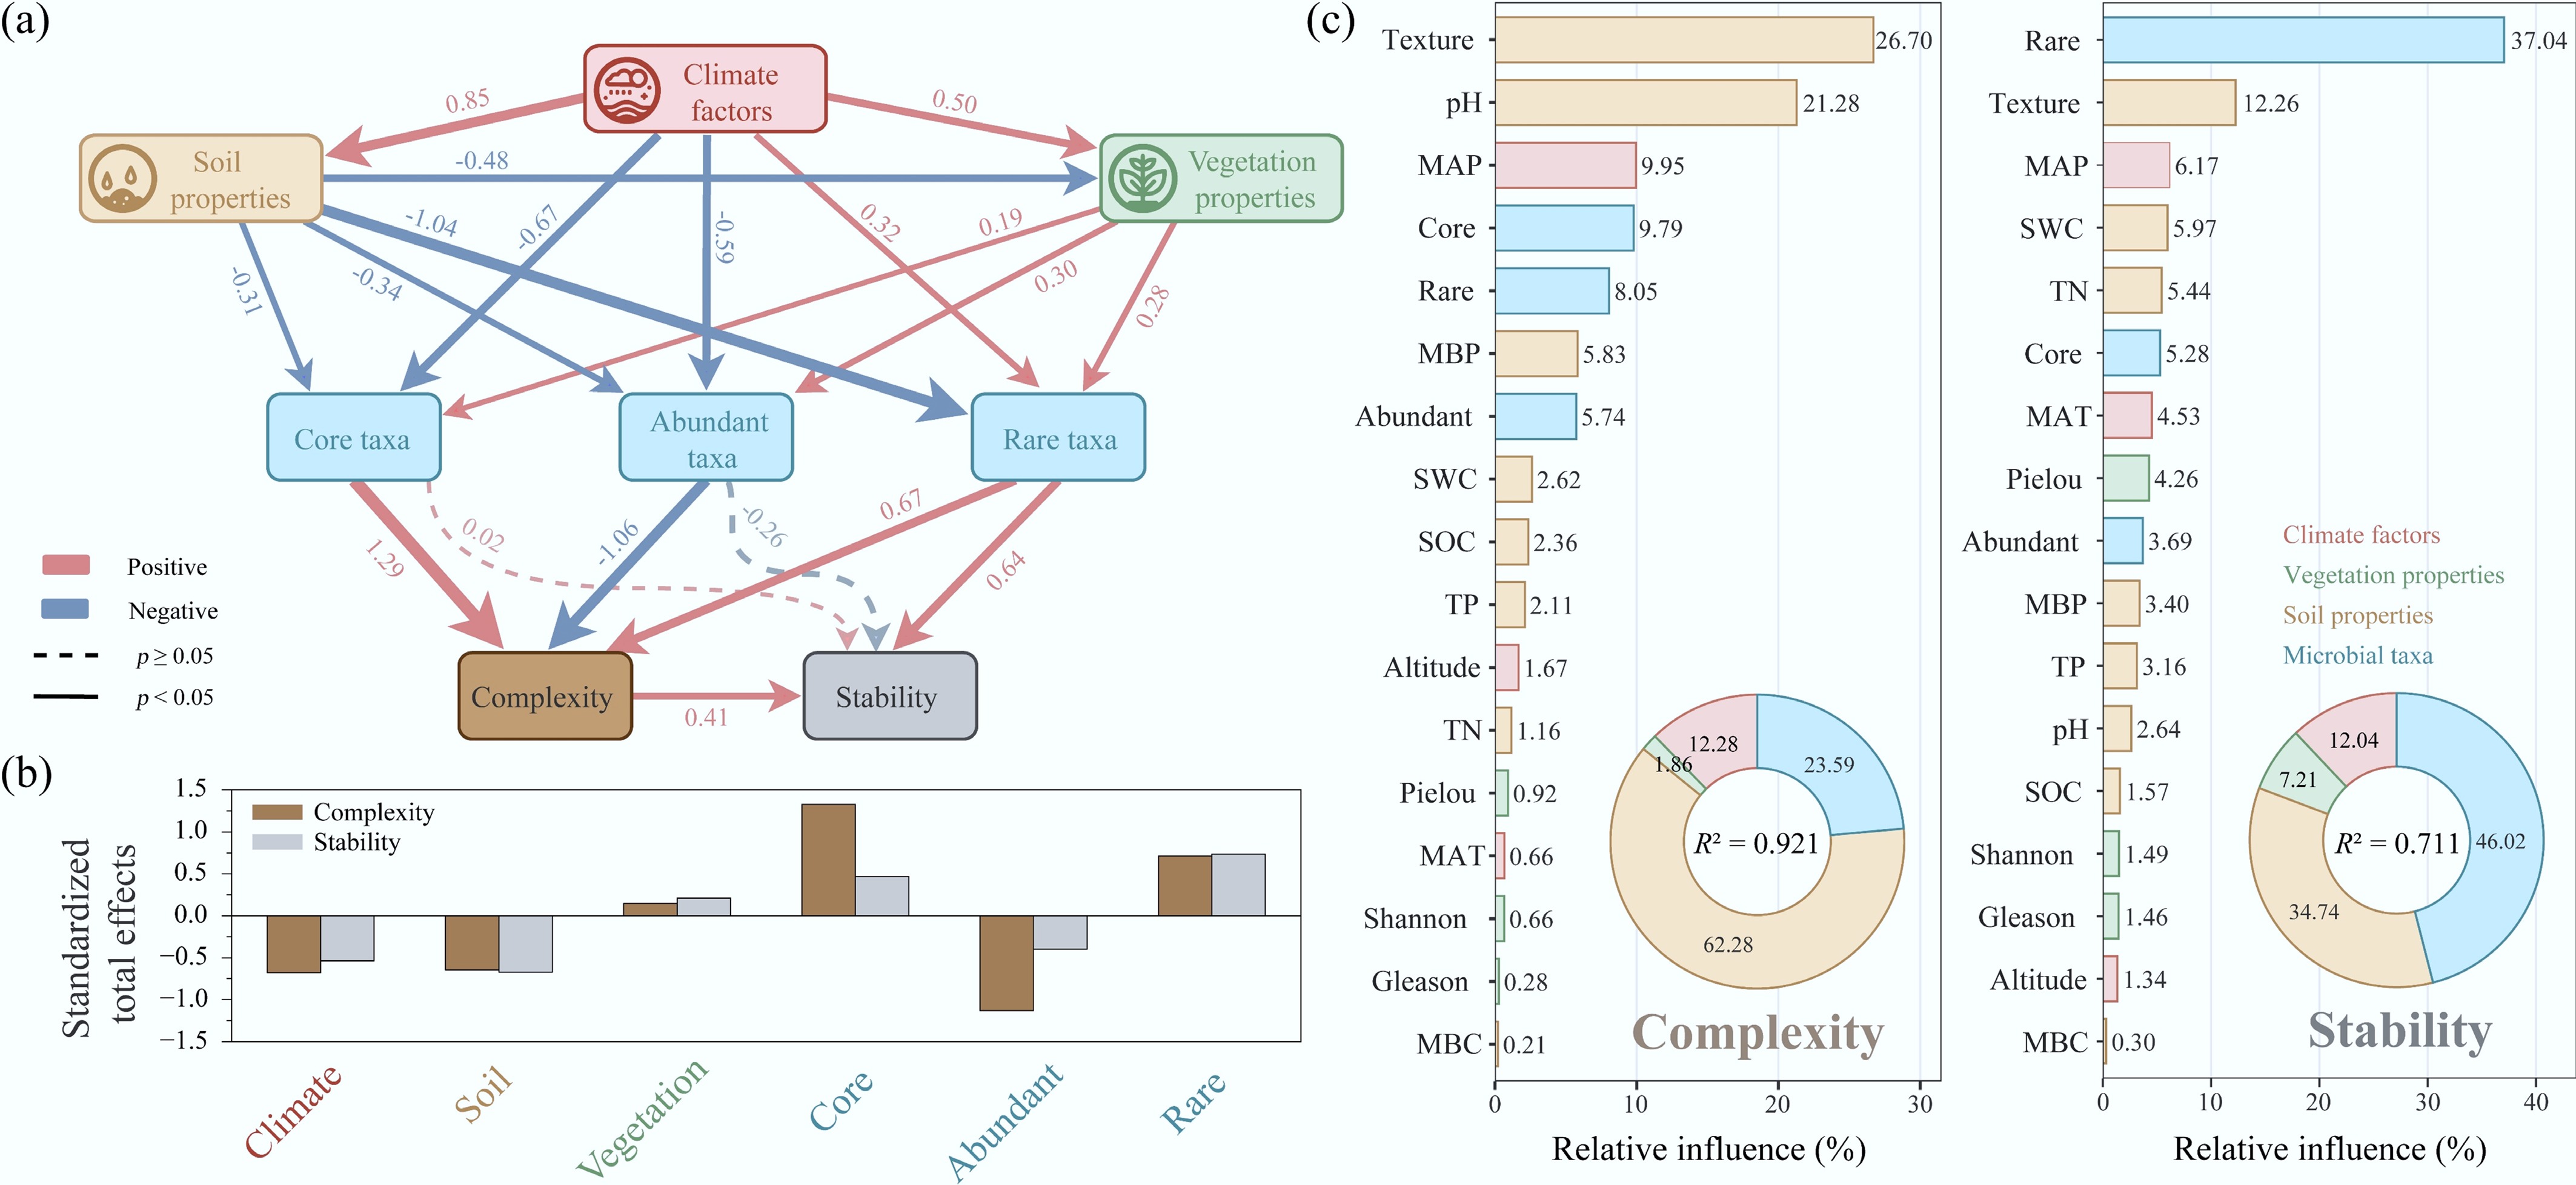
Figure 5.
Relative importance and pathway relationships of environmental factors and microbial taxa in shaping bacterial community complexity and stability. (a) Partial least squares path model showing the direct and indirect effects of climate factors, soil properties, and vegetation properties on core, abundant, and rare taxa, as well as their subsequent effects on community complexity and stability. Red arrows indicate positive correlations, while blue arrows indicate negative correlations. Solid lines represent significant relationships (p < 0.05), and dashed lines represent non-significant relationships (p ≥ 0.05). Numbers on the arrows are standardized path coefficients, reflecting the relative influence of each factor on the response variables. (b) Standardized total effects of major environmental factors and taxonomic characteristics on community complexity and stability. Dark green bars represent effects on complexity, and light green bars represent effects on stability, indicating the relative impact of environmental factors and taxonomic characteristics on community complexity and stability. (c) Boosted regression tree analysis showing the relative influence of individual predictors on community complexity and stability. The inset donut charts show the grouped contribution of four predictor types, and the values in the center indicate model explanatory power (R2).
-
By integrating bacterial subcommunity classification with phylogenetic structure, environmental gradients, and network properties, this study provides a more comprehensive understanding of how core, abundant, and rare taxa differentially contribute to bacterial community complexity and stability across regional ecosystem gradients. Our results align with the initial hypothesis and are consistent with prior research findings[25]. Specifically, abundant and core subcommunities displayed stronger phylogenetic clustering in comparison to rare subcommunities. The steeper environmental distance-decay pattern observed for abundant subcommunities suggests that they were more strongly linked to environmental gradients, whereas rare subcommunities maintained lower phylogenetic similarity overall. This may be due to the higher α-diversity and lower environmental thresholds of rare subcommunities[58,59]. Moreover, as geographical and environmental distances increased, the decay rate of phylogenetic similarity of core subcommunities was significantly slower than that of abundant subcommunities, which further supports the idea that core subcommunities have higher environmental thresholds, allowing them to better adapt to different environments[60,61]. It is worth noting that our analysis of the MST variation patterns for different taxonomic groups, across both environmental and geographical distances, revealed that their community assembly processes exhibited diverse responses to the two distance gradients (Fig. 2; Supplementary Table S5). This finding indicates that changes in phylogenetic similarity with distance are unlikely to be driven by a single mechanism, but are likely influenced by both ecological and evolutionary processes[62].
At the phylum level, this study identified Acidobacteria, Actinobacteria, and Proteobacteria as the predominant bacterial phyla in soil microbial communities, which aligns with prior investigations conducted in arid ecosystems[1]. Their dominance may reflect key ecological processes in dryland soils, including resource acquisition under nutrient limitation, tolerance to water stress, and organic matter decomposition and nutrient cycling. For example, Proteobacteria include metabolically versatile taxa, which may explain their high proportion in rare subcommunities and dominance in core subcommunities[63]. Actinobacteria were the dominant group in abundant subcommunities and are often characterized by relatively large genomes, which may support drought tolerance, decomposition of complex organic compounds, and diverse ecological functions[64,65]. Furthermore, previous studies have demonstrated that Acidobacteria play a pivotal role in maintaining microbial diversity and may contribute to ecological balance and nutrient cycling[66].
Core subcommunities exhibit stronger deterministic influences in community assembly
-
Investigating the relative importance of stochastic and deterministic processes in the assembly of different subcommunities can help explain community changes and succession patterns, thus clarifying the effects of different subcommunities on ecosystem functions and stability. Contrary to hypothesis (ii), this study found that stochastic processes dominated both rare and abundant subcommunities. This discrepancy may be attributed to the broad spatial scale and strong environmental gradients of this study, which amplify the role of environmental selection on core taxa while allowing stochastic drift to dominate rare and abundant taxa (Fig. 2b, c). A recent study on secondary succession also reported that rare subcommunities showed stage-dependent assembly patterns under conditions of small species pools and high resource availability. Rare subcommunities usually contain many low-abundance taxa with narrow ecological niches and high sensitivity to environmental changes. Their high richness and diverse ecological strategies may weaken the dominance of any single deterministic filter and consequently shift assembly toward more stochastic dynamics.
Interestingly, under the complex environmental gradient in this study, we found that core subcommunities, whose phylogenetic distances were similar to those of abundant subcommunities, were primarily governed by deterministic processes (Fig. 2a). The traditional view suggests that core subcommunities, with their larger genomes and more functional genes, occupy a wider ecological niche and are therefore less influenced by environmental factors[67]. However, in this study, the assembly process of these 'generalists' was primarily dominated by environmental selection, with the strength of this filtering increasing with greater environmental differences (Fig. 2b). This phenomenon may be related to the unique survival strategies of core subcommunities, such as coping with changing resources and physical environments through diversified metabolic pathways[68,69], which allows them to be widely distributed in different environments and less influenced by stochastic processes during community assembly. The lack of a significant relationship between the assembly process of core subcommunities and geographic distance also partially explains this pattern (Fig. 2c). Overall, our results suggest that the assembly of different subcommunities varies significantly under complex environmental gradients. Since different subcommunities exhibit distinct dynamic processes and functions in the community, exploring their ecological roles and spatiotemporal configurations will be key to enhancing ecosystem function and stability.
Linking different bacterial subcommunities to community complexity and stability
-
Linking different bacterial subcommunities to community complexity and stability helps improve our understanding of how soil microbial communities react to environmental changes. This study discovered that the stochastic processes of rare and abundant subcommunities were markedly positively correlated with the β-diversity and stability of communities. These results further validate the idea that bacterial communities primarily shaped by stochastic processes are more capable of maintaining network stability in response to environmental disturbances. This may be because, when the randomness of bacterial communities increases, the community enhances its network stability through diversified species interactions and stronger ecological redundancy[20]. In comparison, the assembly processes of core subcommunities had no marked effect on either community β-diversity or the structural complexity and stability of the network. Therefore, investigating the stochastic processes underlying microbial community assembly is imperative for conserving and restoring soil community structure and stability.
Considering the role of different subcommunities in communities helps deepen the understanding of the mechanisms driving changes in bacterial communities along complex environmental gradients. Our study indicates that climate factors played a dominant role in core and abundant subcommunities, while rare subcommunities were mainly influenced by soil characteristics. This may be because core and abundant subcommunities, with their broader ecological ranges, are capable of surviving in a variety of environments. In contrast, the functional redundancy of rare subcommunities is generally believed to arise from species diversity[27], rather than from the genome size or the number of functional genes of individual species. This makes them more dependent on soil microenvironments under changes in environmental gradients, such as soil pH, nutrient availability and accessibility[59]. We also found that abundant subcommunities had a negative effect on community complexity and stability, which may be related to stronger interspecific competition, greater sensitivity to external disturbances, and functional over-redundancy[70]. Although core and abundant subcommunities share similar positions within the community network, core subcommunities often form the foundation of community structure, maintaining essential ecological functions such as material cycling and energy transformation[71] and providing greater stability to the community in the face of environmental changes. In line with several studies, rare subcommunities enhance the community's ability to cope with environmental changes by providing rich genetic and functional diversity, thereby promoting ecosystem stability and functional maintenance[72]. Importantly, our additional spatial and sensitivity analyses showed that these relationships remained generally robust after accounting for spatially structured environmental variation, ecosystem type, and vegetation type, suggesting that the observed links among environmental gradients, bacterial subcommunities, and network properties were not solely driven by spatial or vegetation-related background effects. In conclusion, these findings provide regional-scale evidence that core, abundant, and rare bacterial subcommunities play distinct but complementary roles in shaping soil microbial community complexity and stability.
While this study provides regional-scale evidence for the distinct roles of core, abundant, and rare bacterial subcommunities in shaping community complexity and stability, it should be noted that our sampling focused on surface soils and represented a single growing-season period. Future work incorporating deeper soil layers and repeated seasonal or interannual sampling would help determine whether the observed subcommunity patterns and their ecological effects persist across soil profiles and temporal scales. Such efforts would further extend our understanding of how bacterial subcommunities contribute to the maintenance of soil microbial communities under changing environmental conditions.
The authors sincerely thank the editor for the valuable comments and the members of the Circular Agriculture Research Group at the College of Agronomy, Northwest A&F University, for their assistance and support.
-
It accompanies this paper at: https://doi.org/10.48130/aee-0026-0020.
-
Not applicable.
-
The authors confirm their contributions to the paper as follows: study conception and design: Xing Wang, Yongzhong Feng, Chengjie Ren, Gaihe Yang, Fengxia Li, Xinhui Han; field sampling and laboratory experiments: Zhengchen Wang, Zijie Zhou, Ruoxi Hu, Siyu Lu, Qi Zhang, Fang Chen, Xiaojiao Wang; data analysis and interpretation of results: Zhengchen Wang, Xing Wang; manuscript preparation: Zhengchen Wang; supervision and manuscript revision: Xing Wang, Yongzhong Feng, Chengjie Ren, Gaihe Yang, Fengxia Li, Xinhui Han. All authors reviewed the manuscript and approved the final version.
-
Raw sequence reads generated during this study have been deposited in the NCBI Sequence Read Archive (SRA) under BioProject accession number PRJNA1226375. Other datasets generated and/or analyzed during the current study are available from the corresponding author upon reasonable request.
-
The authors declare that they have no conflict of interest.
-
Full list of author information is available at the end of the article.
- The supplementary files can be downloaded from here.
- Copyright: © 2026 by the author(s). Published by Maximum Academic Press, Fayetteville, GA. This article is an open access article distributed under Creative Commons Attribution License (CC BY 4.0), visit https://creativecommons.org/licenses/by/4.0/.
-
About this article
Cite this article
Wang Z, Zhou Z, Hu R, Lu S, Zhang Q, et al. 2026. Core and rare microbiota enhance bacterial community complexity and stability along environmental gradients on the Loess Plateau. Agricultural Ecology and Environment 2: e022 doi: 10.48130/aee-0026-0020 

Core and rare microbiota enhance bacterial community complexity and stability along environmental gradients on the Loess Plateau
- Received: 07 May 2026
- Revised: 14 July 2026
- Accepted: 05 August 2026
- Published online: 28 August 2026
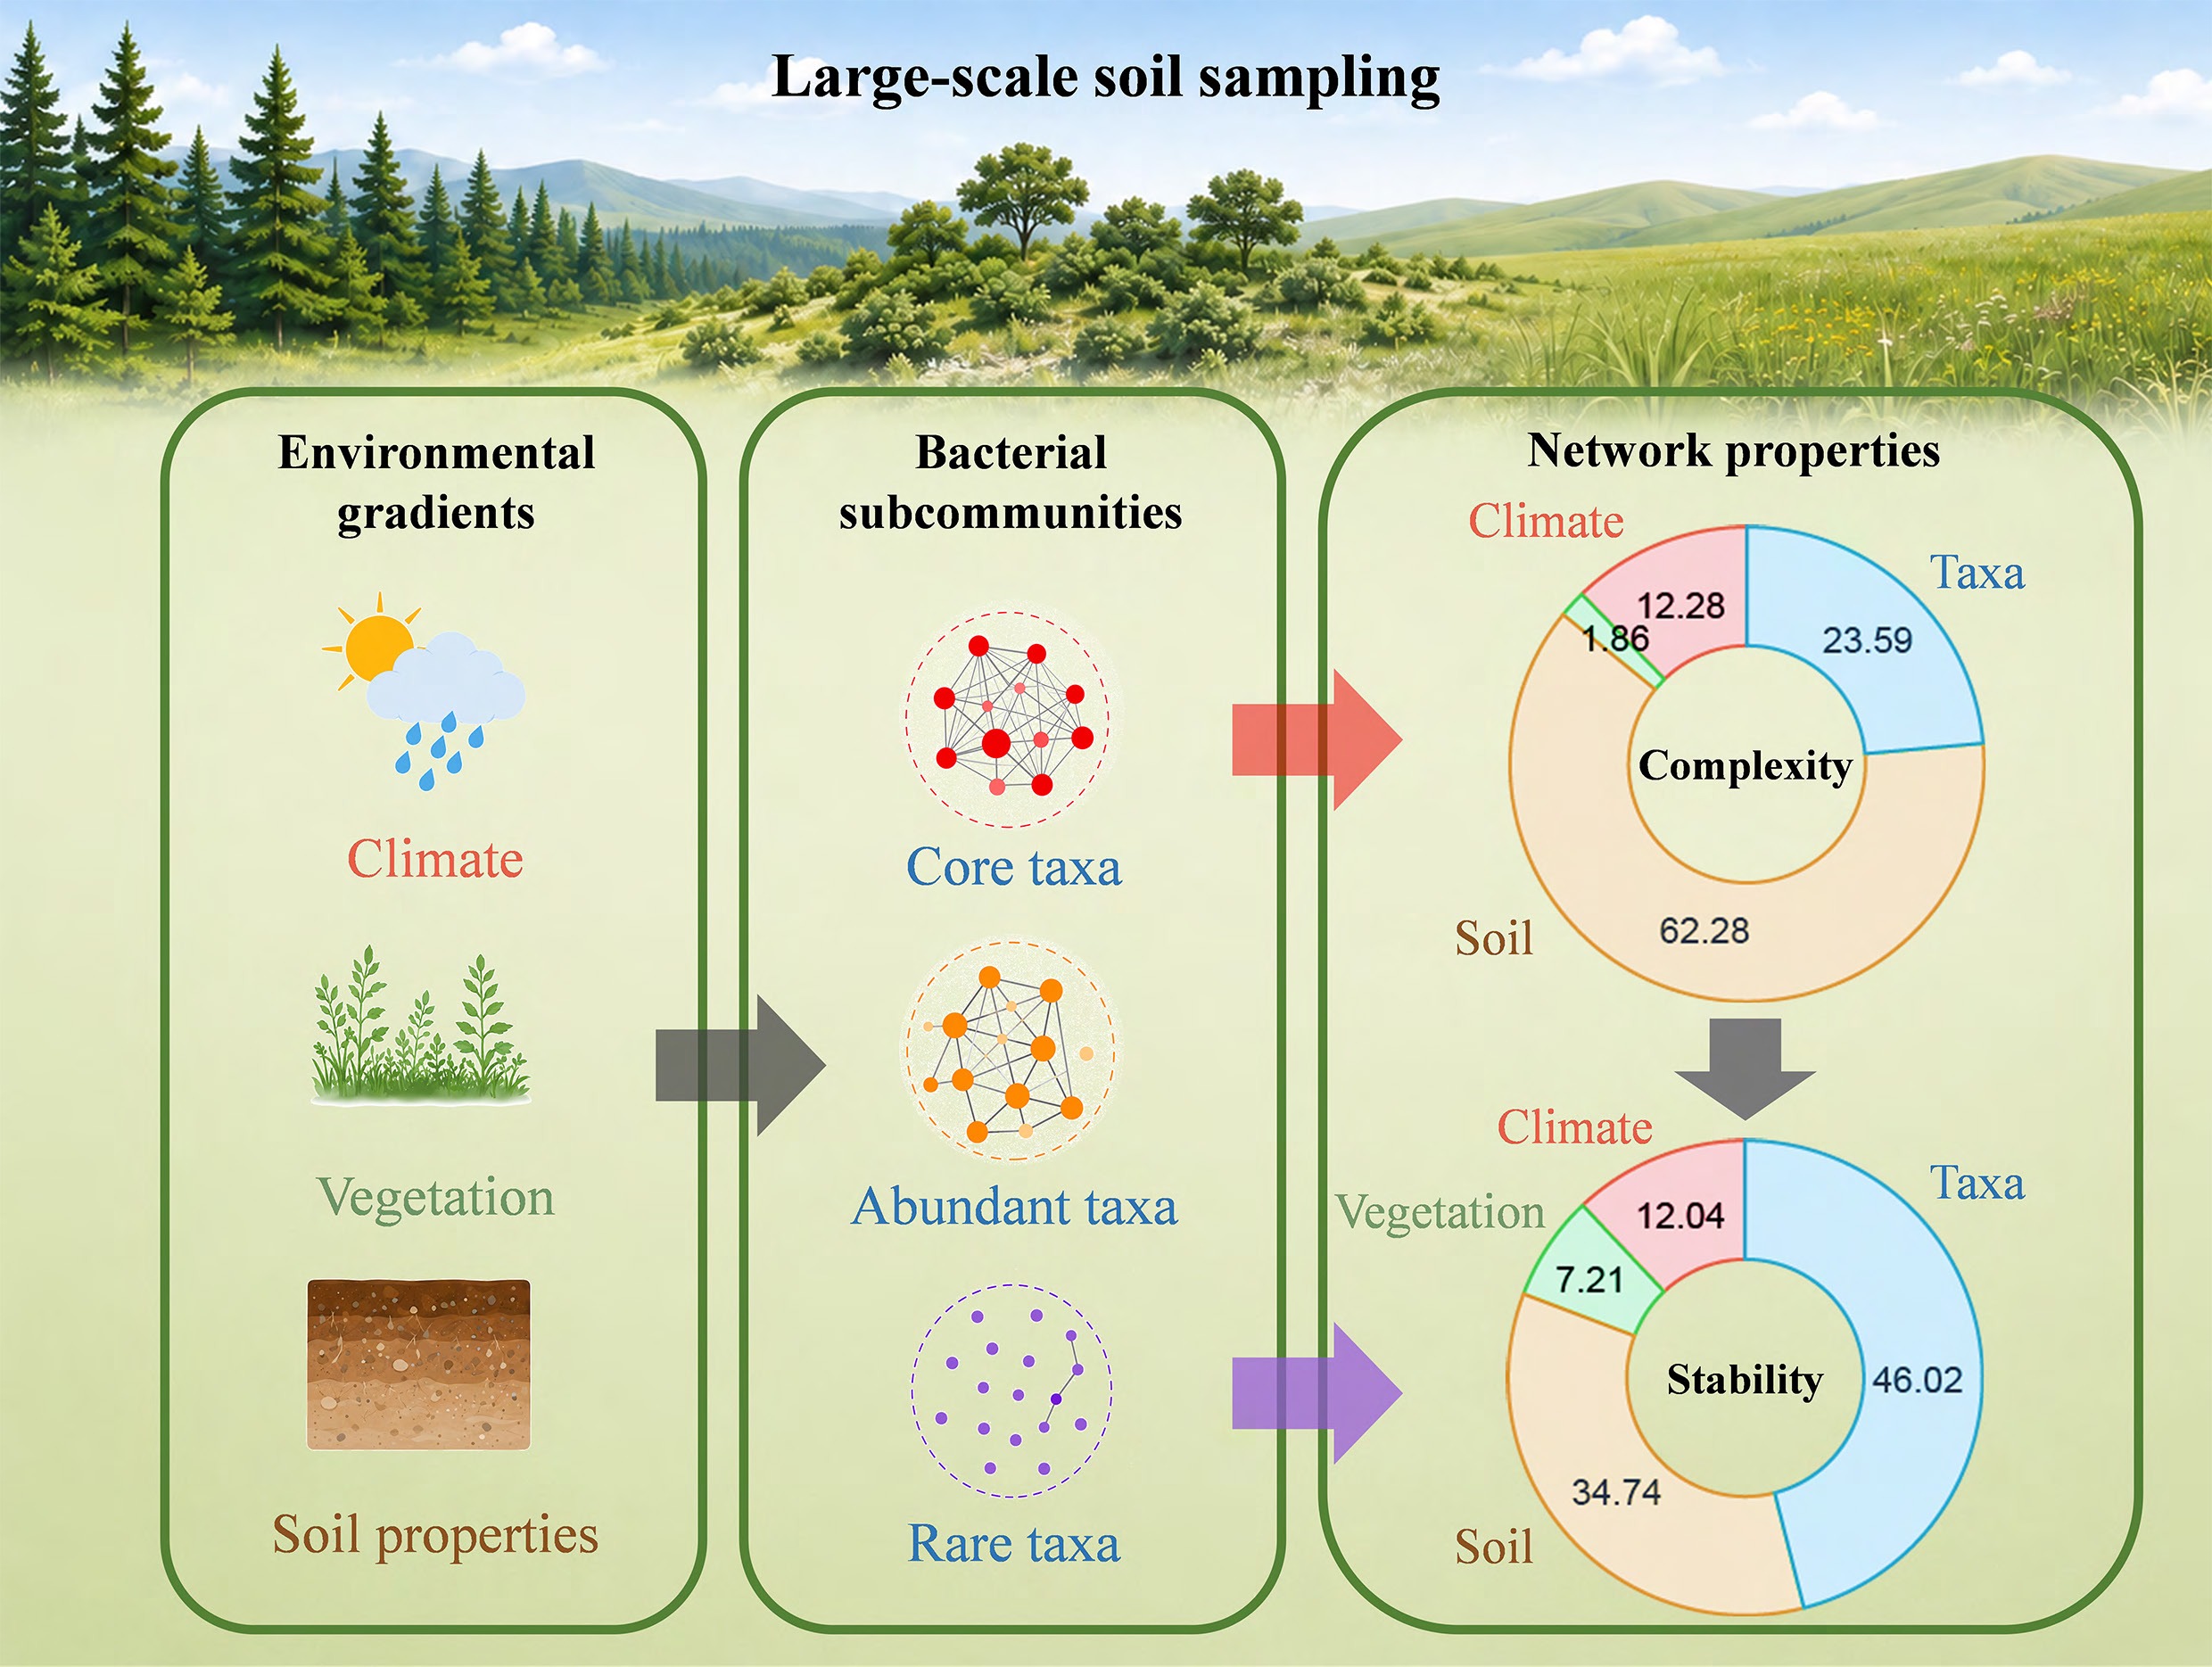
Abstract: Revealing the roles of microbiota with varying abundances in shaping community structure and stability is essential for a deeper understanding of ecosystem function. However, the regulation of community complexity and stability by the assembly process of subcommunities is still poorly understood. Based on extensive surveys of various ecological types across the Loess Plateau, we explored the assembly mechanisms of bacterial subcommunities with different abundances (rare, abundant, and core taxa) and their impacts on community complexity and stability. Our results indicate that core and abundant taxa have significantly shorter phylogenetic distances than rare taxa. Deterministic processes principally govern the community assembly of core taxa, whereas stochastic processes dominate both abundant and rare taxa. Additionally, our findings highlight the significant influence of environmental differences on subcommunities, thereby impacting the network properties of the community. Specifically, climatic factors are the primary environmental factors determining the distribution of abundant and core taxa, playing a crucial role in modulating the complexity of bacterial communities. In contrast, the distribution of rare taxa is more influenced by soil characteristics, and these rare taxa are essential for maintaining network stability.
-
Key words:
- Loess Plateau /
- Biogeographic pattern /
- Community assembly /
- Microbial network /
- Subcommunities