












-
Green manures (GMs), also termed cover crops, refer to soil-improving crops grown on seasonally or spatially idle cropland[1]. Over the past few decades, they have provided solutions for improving China's arable land quality[2,3], reducing chemical fertilizers[4], and preventing non-point-source pollution[5]. GMs primarily include legumes, grasses, and cruciferous plants. Among these, legumes fix atmosphere N2 into bio-nitrogen through biological nitrogen fixation, providing a nitrogen source for subsequent crops after incorporation[6]. Extensive research indicates that GMs can reduce soil and water loss through ground cover[7], improve the soil's pore structure through root-mediated biological tillage, and enhance water-holding capacity in the plow layer[8], while significantly increasing soil organic matter content[3] and enhancing soil microbial activity[9−12]. The multifunctionality of GMs in crop production systems has made it a research hotspot in modern sustainable agriculture.
China is the world's largest rice (Oryza sativa) producer[13], with southern China accounting for over 80% of the national rice cultivation area. Winter fallow rice fields constitute approximately 25% of the total rice area in this region (about 249,000 ha)[14], providing the fundamental conditions for developing GM–rice rotation systems. Chinese milk vetch (Astragalus sinicus L.) is an herbaceous plant belonging to the genus Astragalus in the Fabaceae family and serves as the primary winter GM crop in southern China's paddy field systems. In this rotation system, milk vetch is sown after the rice harvest and incorporated into the soil by plowing during peak flowering (prior to transplanting the rice), thereby achieving soil fertilization and partially replacing chemical fertilizers[9]. Studies have shown that compared with fields without GM, the milk vetch–rice rotation can reduce nitrogen fertilizer use by 40% while maintaining stable rice yields, reducing environmental impact, and improving grain quality[14]. Long-term rotation also improves the soil's physicochemical properties and reduces greenhouse gas emissions[15], serving as a key pathway to harmonize stable rice production with green agricultural development.
Biomass is the most direct indicator for measuring GM's nitrogen supply capacity, soil improvement effects, and C and N footprint mitigation potential. Larger GM biomass can offset more chemical nitrogen fertilizer and strengthen carbon sequestration capacity[1,16]. However, it may also increase the risk of greenhouse gas (e.g., CH4) emissions[17,18]. Therefore, accurately quantifying milk vetch biomass and its spatial distribution carries practical value. It supports scientific evaluation of GM's ecological services, optimization of regional GM deployment, and formulation of differentiated management strategies[19,20]. The spatial variation in GM biomass is influenced by a combination of factors, including climatic conditions, soil properties, sowing dates and amounts, and field management, resulting in significant regional differences in its agronomic and ecological effects[21]. Existing studies have primarily focused on field sampling at the plot scale[22,23]. The driving mechanisms and distribution patterns of biomass at the regional scale remain poorly understood, making it difficult to support practical applications.
Machine learning (ML) algorithms have provided new technical approaches for estimating and analyzing the spatiotemporal variability patterns of ecosystems. Compared with traditional statistical models, ML models such as Random Forest (RF), XGBoost, and CatBoost can effectively capture nonlinear interactions among environmental factors[24,25]. When combined with SHapley Additive exPlanations (SHAP) analysis, these algorithms can identify and interpret such interactions[26,27], further revealing the underlying mechanisms driving the distribution of crop biomass[28,29], which confers a unique advantage for spatial crop estimation. The combined ML–SHAP method has been successfully applied to large-scale crop biomass estimation, quantifying the contribution of environmental variables and achieving higher prediction accuracy[30], providing an effective tool for understanding the ecological control mechanisms underlying the formation of crop biomass.
On the other hand, as a leguminous crop, Chinese milk vetch is highly susceptible to climate change. Changes in temperature and precipitation patterns will affect its ecological effects by influencing its biomass accumulation[31]. For instance, high temperatures accelerate the growth process of legumes, shortening the grain-filling period and affecting their biomass accumulation dynamics[32]. Drought induces stomatal closure, impairs photosynthesis and nodule-associated nitrogen fixation, and ultimately reduces biomass and weakens its nitrogen substitution function[33]. Gaining a deeper understanding of the complex nonlinear relationship between climate change and biomass, and predicting the future biomass trends under various scenarios, will not only help assess the impact of climate change on GM production potential but also provide a scientific basis for formulating adaptation strategies and ensuring the stable development of the regional GM industry.
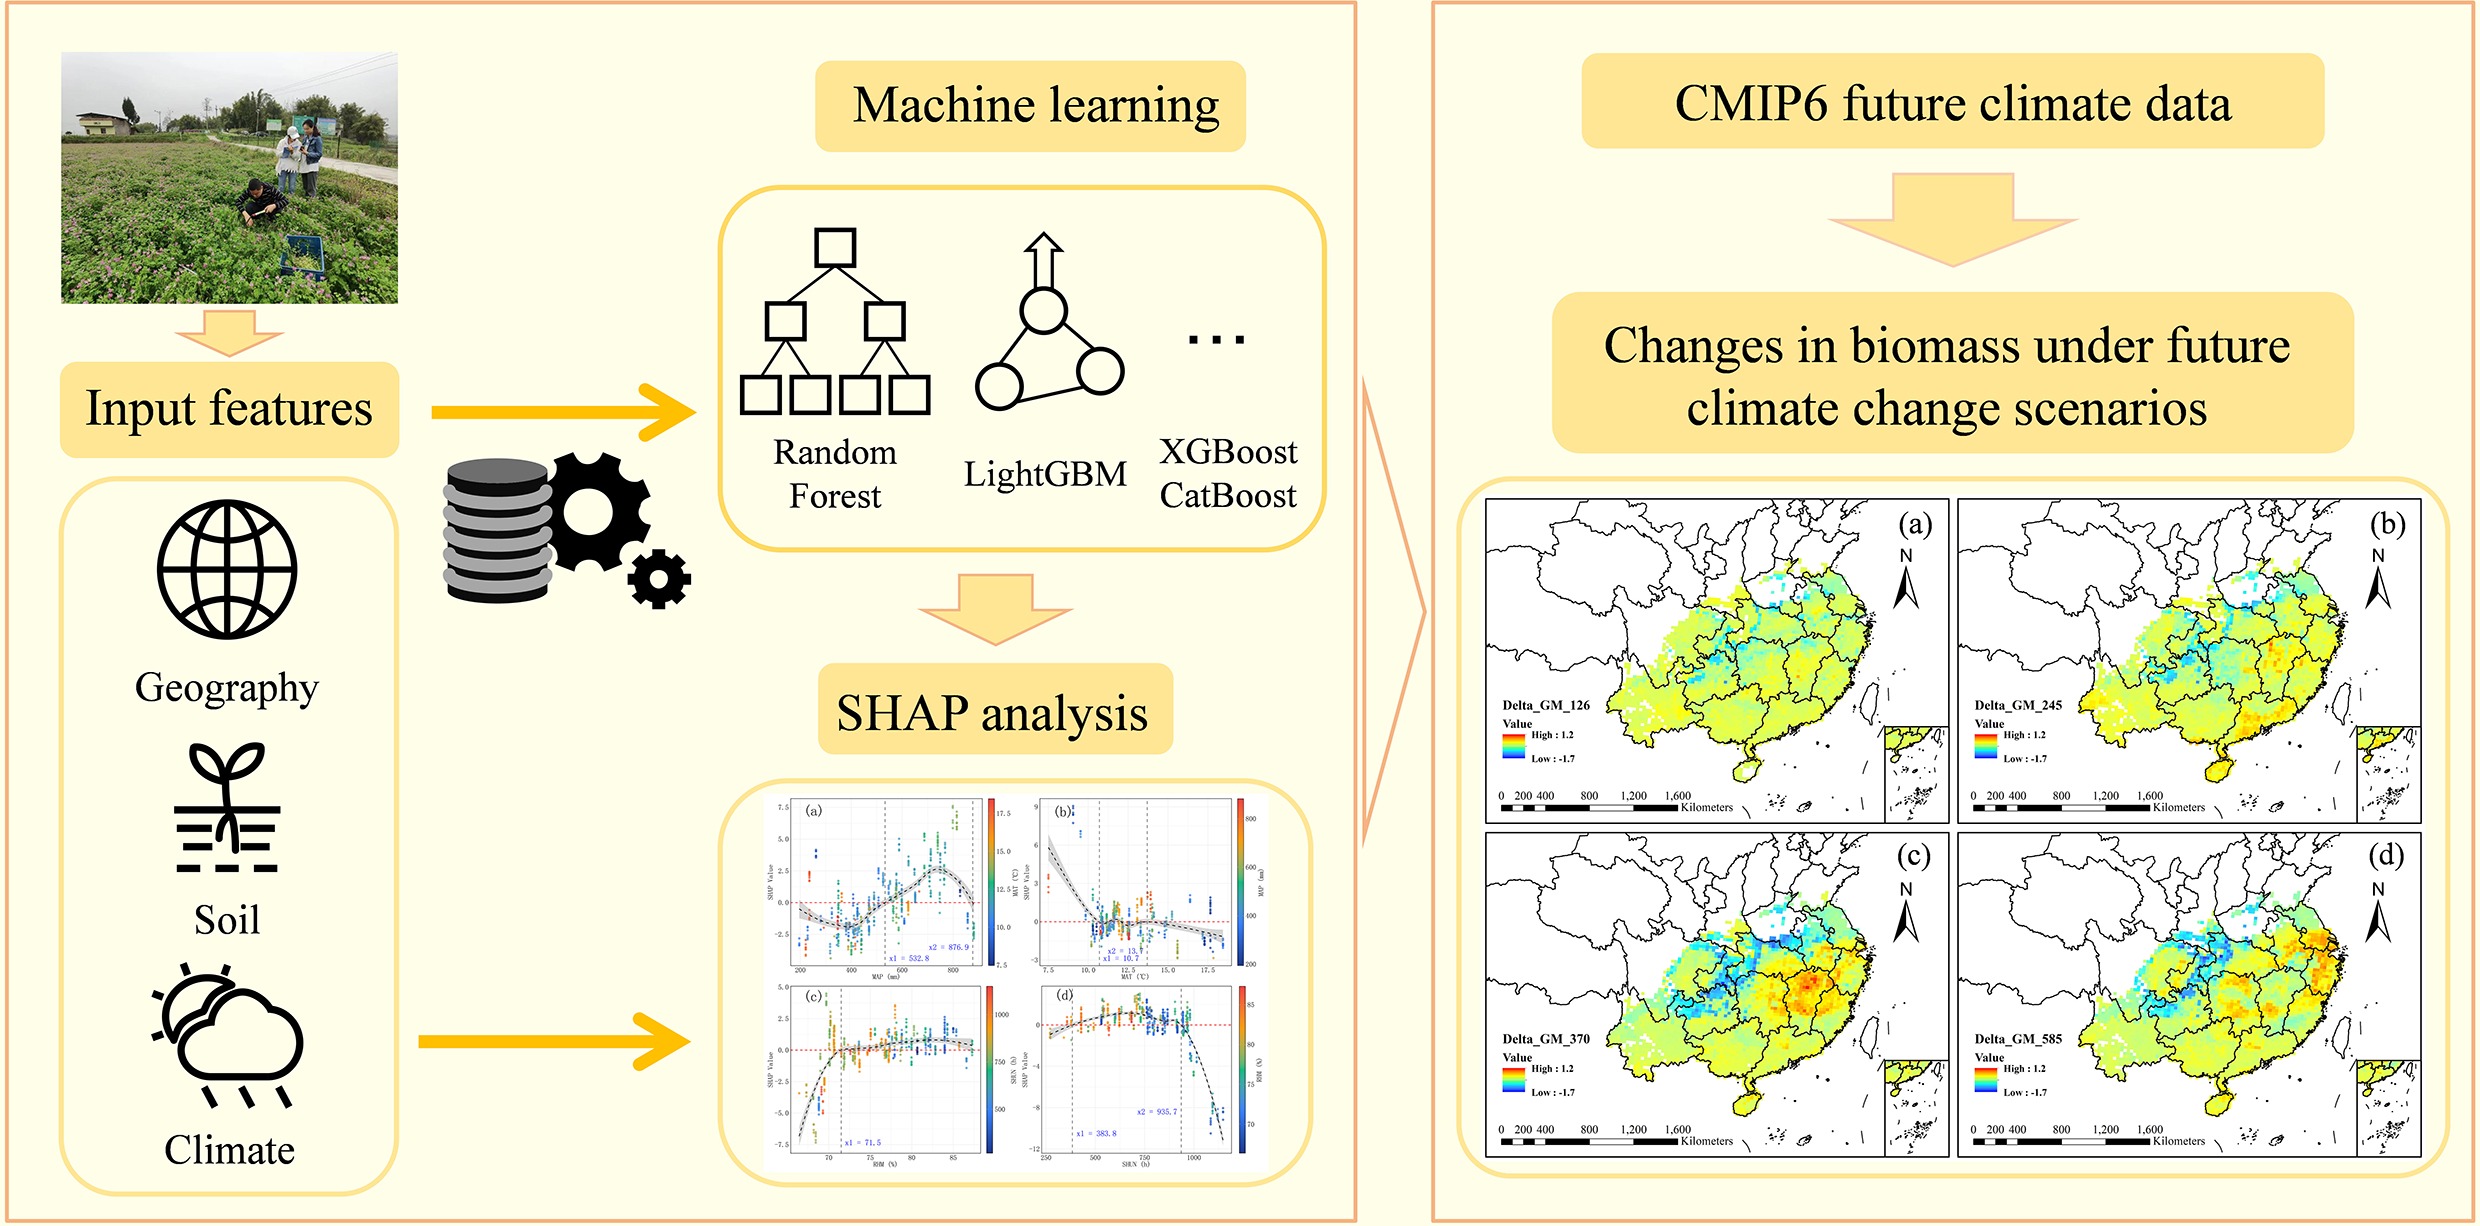
Accordingly, this study focuses on Chinese milk vetch in paddy fields across 13 provinces in southern China. Based on 572 sets of field data from 111 monitoring stations, and utilizing machine learning combined with the SHAP method, the study aims to (i) reveal the spatial distribution patterns of milk vetch biomass and quantify carbon and nitrogen inputs via GM biomass in southern China's rice-growing regions; (ii) identify the key geographical, soil, and climatic factors driving variation in biomass and quantify their contribution; and (iii) assess the spatiotemporal dynamics of biomass and the underlying drivers under different future climate scenarios. The research findings can provide a theoretical basis for the scientific planning and precise management of GMs in southern rice-growing regions, and can serve as a decision-making reference for formulating targeted GM development strategies to address the challenges of climate change.
-
The study area is located in the tropical and subtropical monsoon climate zones of southern China, spanning latitudes 19°–35° N (Fig. 1a). It covers 13 provinces and features typical humid and subhumid climates, with a mean annual temperature of 15.2–21.6 °C and annual precipitation of 1,200–1,900 mm[34]. Rice is the primary crop, and the region can be divided into five rice-growing zones according to the ecological conditions and cropping systems[35]. Favorable hydrothermal conditions and extensive winter fallow land support rice–rice–milk vetch or rice–milk vetch rotations[36]. Chinese milk vetch is typically sown after the rice harvest (late September to early October) and incorporated into the soil by plowing before transplanting the rice (late April to early May). This practice serves to partially replace chemical fertilizers, with a nitrogen replacement rate of 20%–40%, leading to its widespread cultivation in the region. In 2022, it accounted for approximately 10% of the rice-growing area in southern China[14].
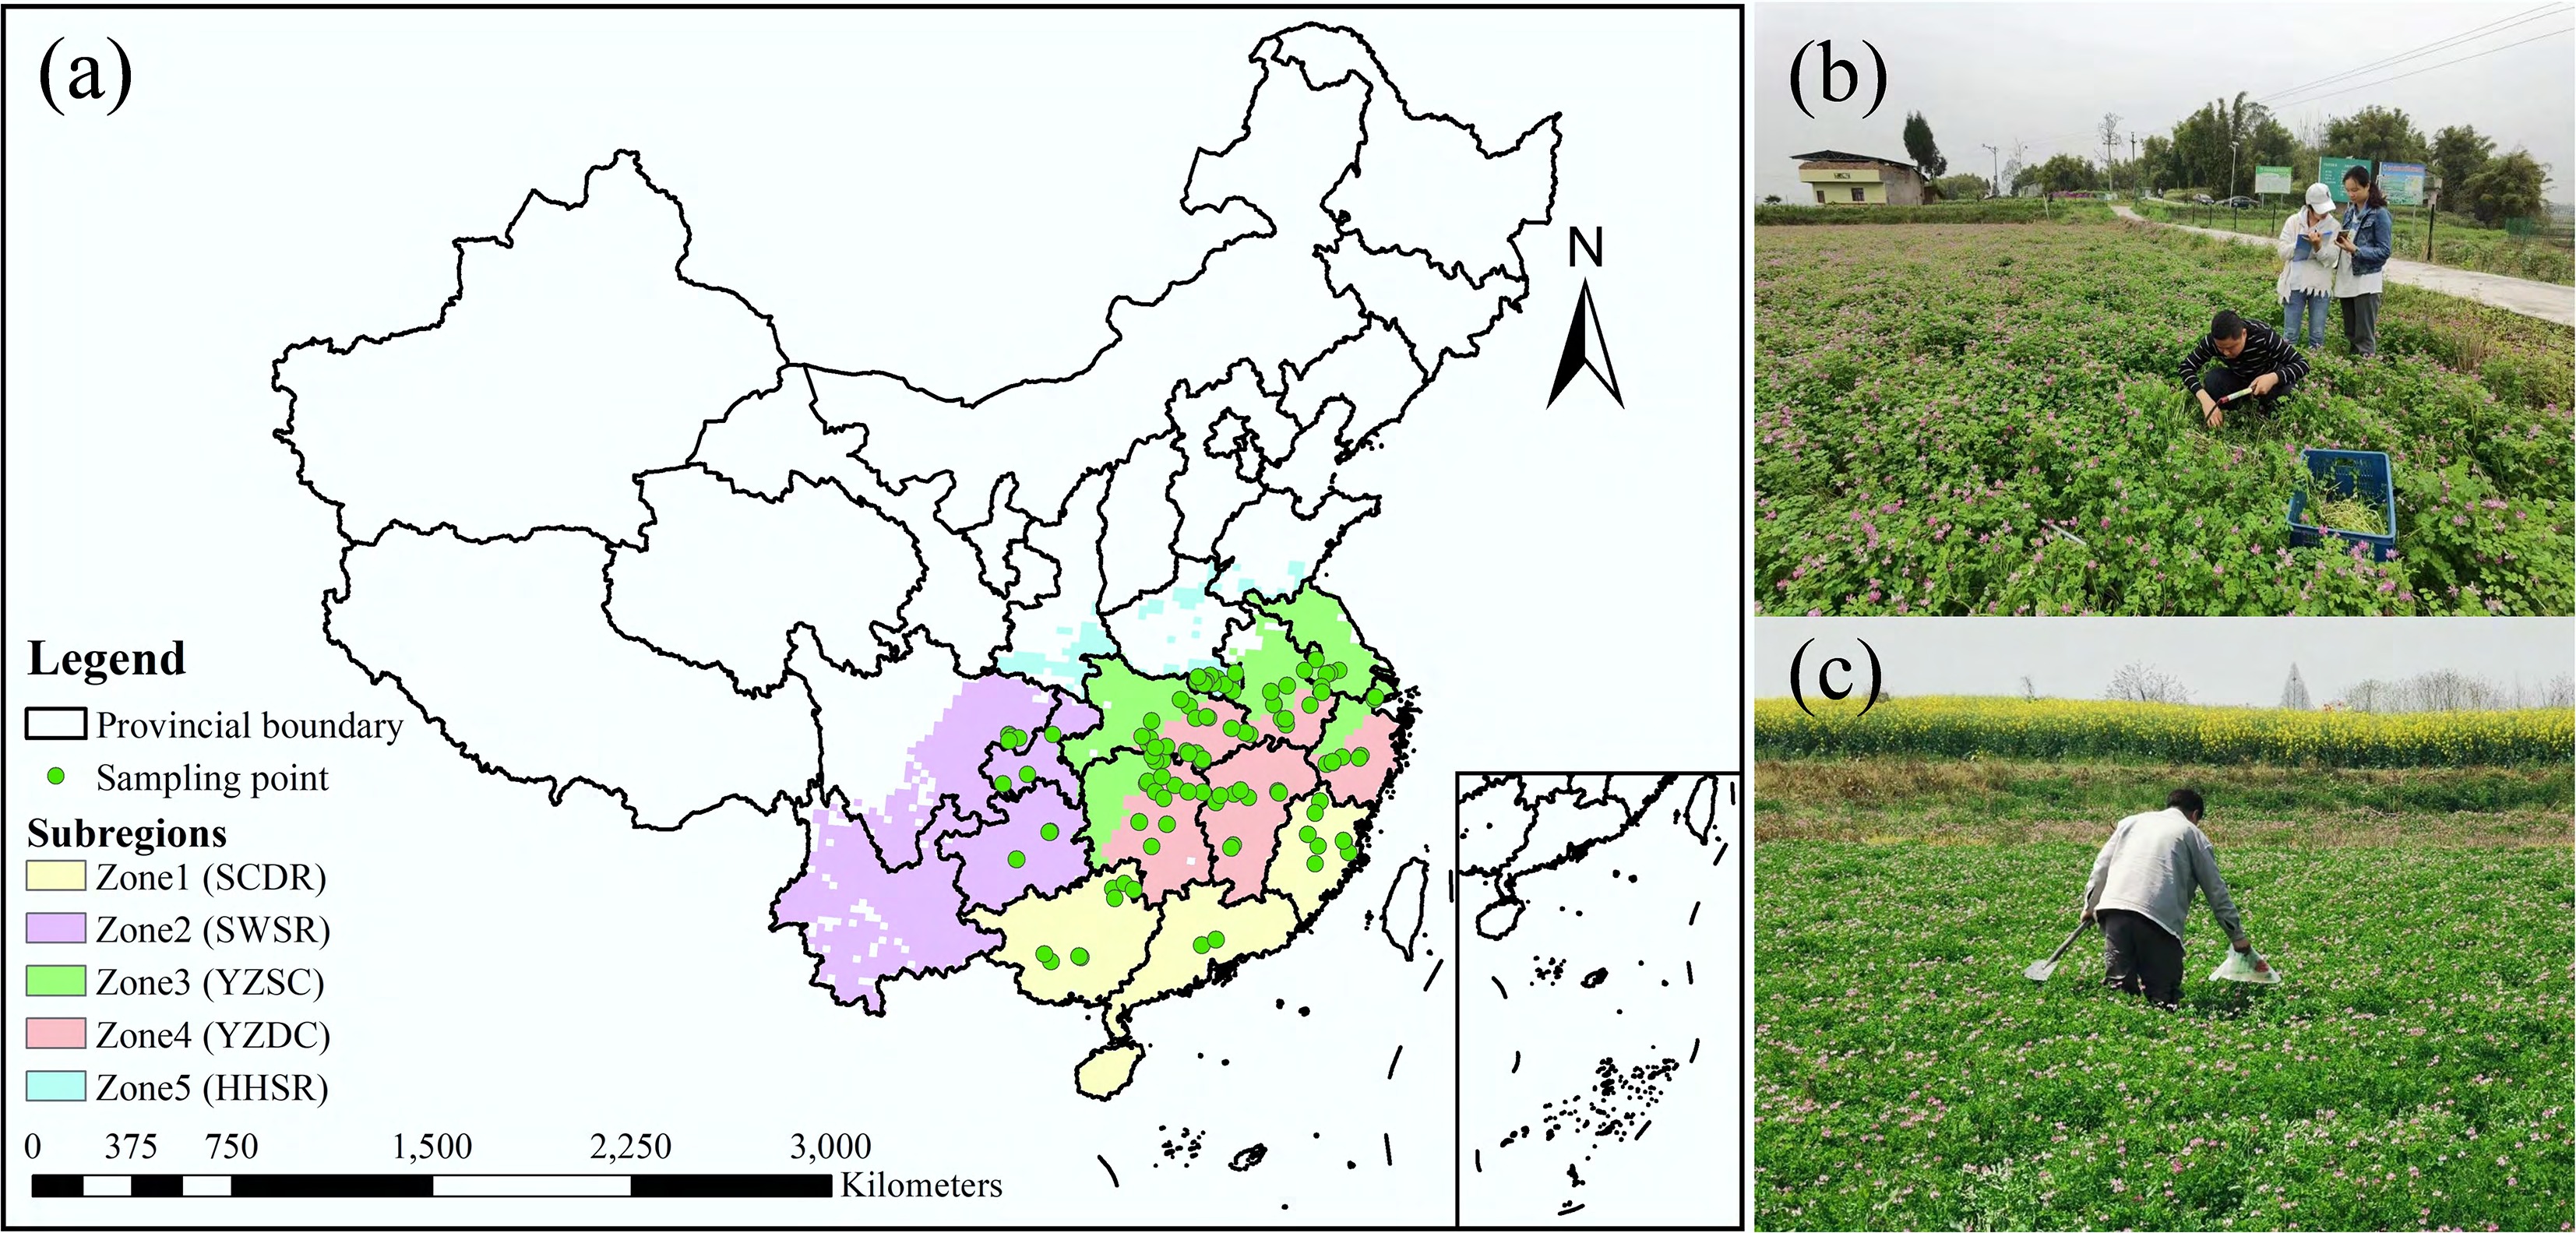
Figure 1.
(a) Base map of the study area (review number: GS(2024)0650) is sourced from the China National Geospatial Information Public Service Platform:
https://cloudcenter.tianditu.gov.cn/administrativeDivision . (b,c) Sampling process. SCDR, South China double-cropping rice region; SWSR, Southwest single-cropping rice region; YZSC, Yangtze River (middle and lower reaches) single-cropping rice region; YZDC, Yangtze River (middle and lower reaches) double-cropping rice region; HHSR, the Huang–Huai–Hai single-cropping rice region.Plant and soil sampling
-
Field sampling was mainly conducted in 2021 to obtain data on Chinese milk vetch biomass and associated soil environmental variables. In total, 572 paired plant–soil samples were collected from 111 sites, with 1–5 samples per site (Fig. 1a). At each site, plant and soil samples were collected at the full-bloom stage, prior to incorporation of GM. Five 1 × 1 m quadrats (Fig. 1b) were randomly established at each site. Fresh biomass was measured using the quadrat method, followed by deactivation and oven-drying to determine the dry biomass. A fresh-to-dry conversion coefficient of 0.10 was adopted, based on field measurements and published literature[37]. Carbon and nitrogen contents were analyzed using an elemental analyzer (vario MACRO cube, Elementar, Germany). Meanwhile, surface soil samples (0–20 cm) were collected with a soil core sampler to measure bulk density. Air-dried, ground, and sieved soil samples were analyzed for soil texture (sand, silt, clay), soil organic carbon (SOC), and pH. The analytical methods for determining these soil properties were based on Lu[38].
Machine learning algorithm
-
Machine learning was used to identify the drivers and predict the spatial distribution of Chinese milk vetch biomass. Among several tested algorithms, including RF, LightGBM, CatBoost, and XGBoost (Supplementary Figs A1–A4), the RF algorithm was selected for modeling. The input variables comprised geographic factors (latitude, LAT; longitude, LON; elevation, ELE), soil factors (SOC; bulk density, BD; sand content; silt content; clay content), and climatic factors (cumulative precipitation, PREC; mean temperature, TEMP; sunshine hours, SHUN; relative humidity, RHM, all referring to the growing season). The target variable was Chinese milk vetch biomass. The RF model was implemented in MATLAB R2024a using the 572 paired datasets. In total, 50 random hyperparameter combinations were tested. The optimal number of trees (Nt = 150) was determined by minimizing the mean squared error, with a minimum leaf size of 2 and four features sampled per split. The dataset was split into 80% for model training and 20% for validation. Model performance was evaluated using fivefold cross-validation, with the coefficient of determination (R2) and root mean square error (RMSE) as the evaluation metrics.
Future climate data
-
The HiCPC (High-resolution CMIP6 downscaled daily Climate Projections over China) dataset[39] is a China-wide climate projection dataset derived from the Coupled Model Intercomparison Project Phase 6 (CMIP6) through downscaling and error correction. It includes four variables, namely daily precipitation, and daily mean, maximum, and minimum surface temperatures, covering the historical period (1979–2014) and future (2015–2100), and presents downscaled results for four Shared Socioeconomic Pathways (SSPs) climate scenarios: SSP126, SSP245, SSP370, and SSP585. The horizontal spatial resolution is 0.1°, and the temporal resolution is 1 day. The HiCPC dataset covers 22 CMIP6 global models, with variations in seasonal simulation capabilities across different models. The winter GM Chinese milk vetch grows from October to April. We selected data from three models—NorESM2-LM, EC-Earth3-Veg, and MPI-ESM1-2-HR—that demonstrated excellent overall performance in simulating winter temperature and precipitation in China[40]. Monthly precipitation and mean temperature data for these models were downloaded from the National Tibetan Plateau Data Center (TPDC) (
https://cstr.cn/18406.11.Atmos.tpdc.301122 ). The growing season's cumulative precipitation and mean temperature were calculated for each model, and their arithmetic mean was used as the future climate inputs. The RF model trained on observed data was then used to predict the biomass dynamics of the milk vetch under various future climate change scenarios.Spatial prediction and analysis
-
When using the RF to simulate future scenario changes, the multiyear averages of environmental factors in southern China from 2000 to 2019 were used as the input data. The climate data were replaced by the arithmetic mean of future climate data from the three CMIP6 models, thereby predicting the spatiotemporal evolution characteristics of milk vetch biomass under future climate change. The spatial prediction adopted a grid resolution of 28 km, and the data on the spatial distribution of rice were obtained from Luo et al.[41] (1 km resolution). For the gridded dataset of southern regions, grids with rice cultivation were retained, whereas non-rice-growing grids were removed to generate a rice mask, based on which the biomass was estimated for all rice-planted grids.
To quantify the impacts of climate change on the spatial pattern of milk vetch biomass, this study used differential analysis. Using the 2019 level as the reference point, the differences in growing season precipitation (ΔMAP), mean growing season temperature (ΔMAT), and milk vetch biomass (Δbiomass) between the future (2098) and historical (2019) period were calculated. Pearson correlation analysis was further applied to identify correlations between changes in climatic variables and variation in biomass, and a t-test was used to assess statistical significance (p < 0.001).
-
Based on measured data from field trials in 2021, the observed biomass of milk vetch exhibited significant spatial heterogeneity, with dry weight ranging from 0.56 to 7.45 t ha−1 (mean ± standard deviation [SD]: 3.23 ± 1.22 t ha−1, Fig. 2a). The high-value areas for milk vetch were concentrated in the middle and lower reaches of the Yangtze River (Hunan, Hubei, Jiangxi), whereas the lowest values occurred in Chongqing, Guangdong, and Guangxi. Corresponding carbon and nitrogen accumulation varied significantly across provinces, with mean ± SD values of 1,168.06 ± 321.44 kg C ha−1 and 81.29 ± 22.15 kg N ha−1, respectively (Supplementary Table A1). Jiangxi, Sichuan, and Fujian had the highest nitrogen contents, but Hunan, Jiangsu, and Jiangxi had the highest carbon contents; Chongqing, Guangdong, and Guangxi consistently showed the lowest values (Fig. 2b).
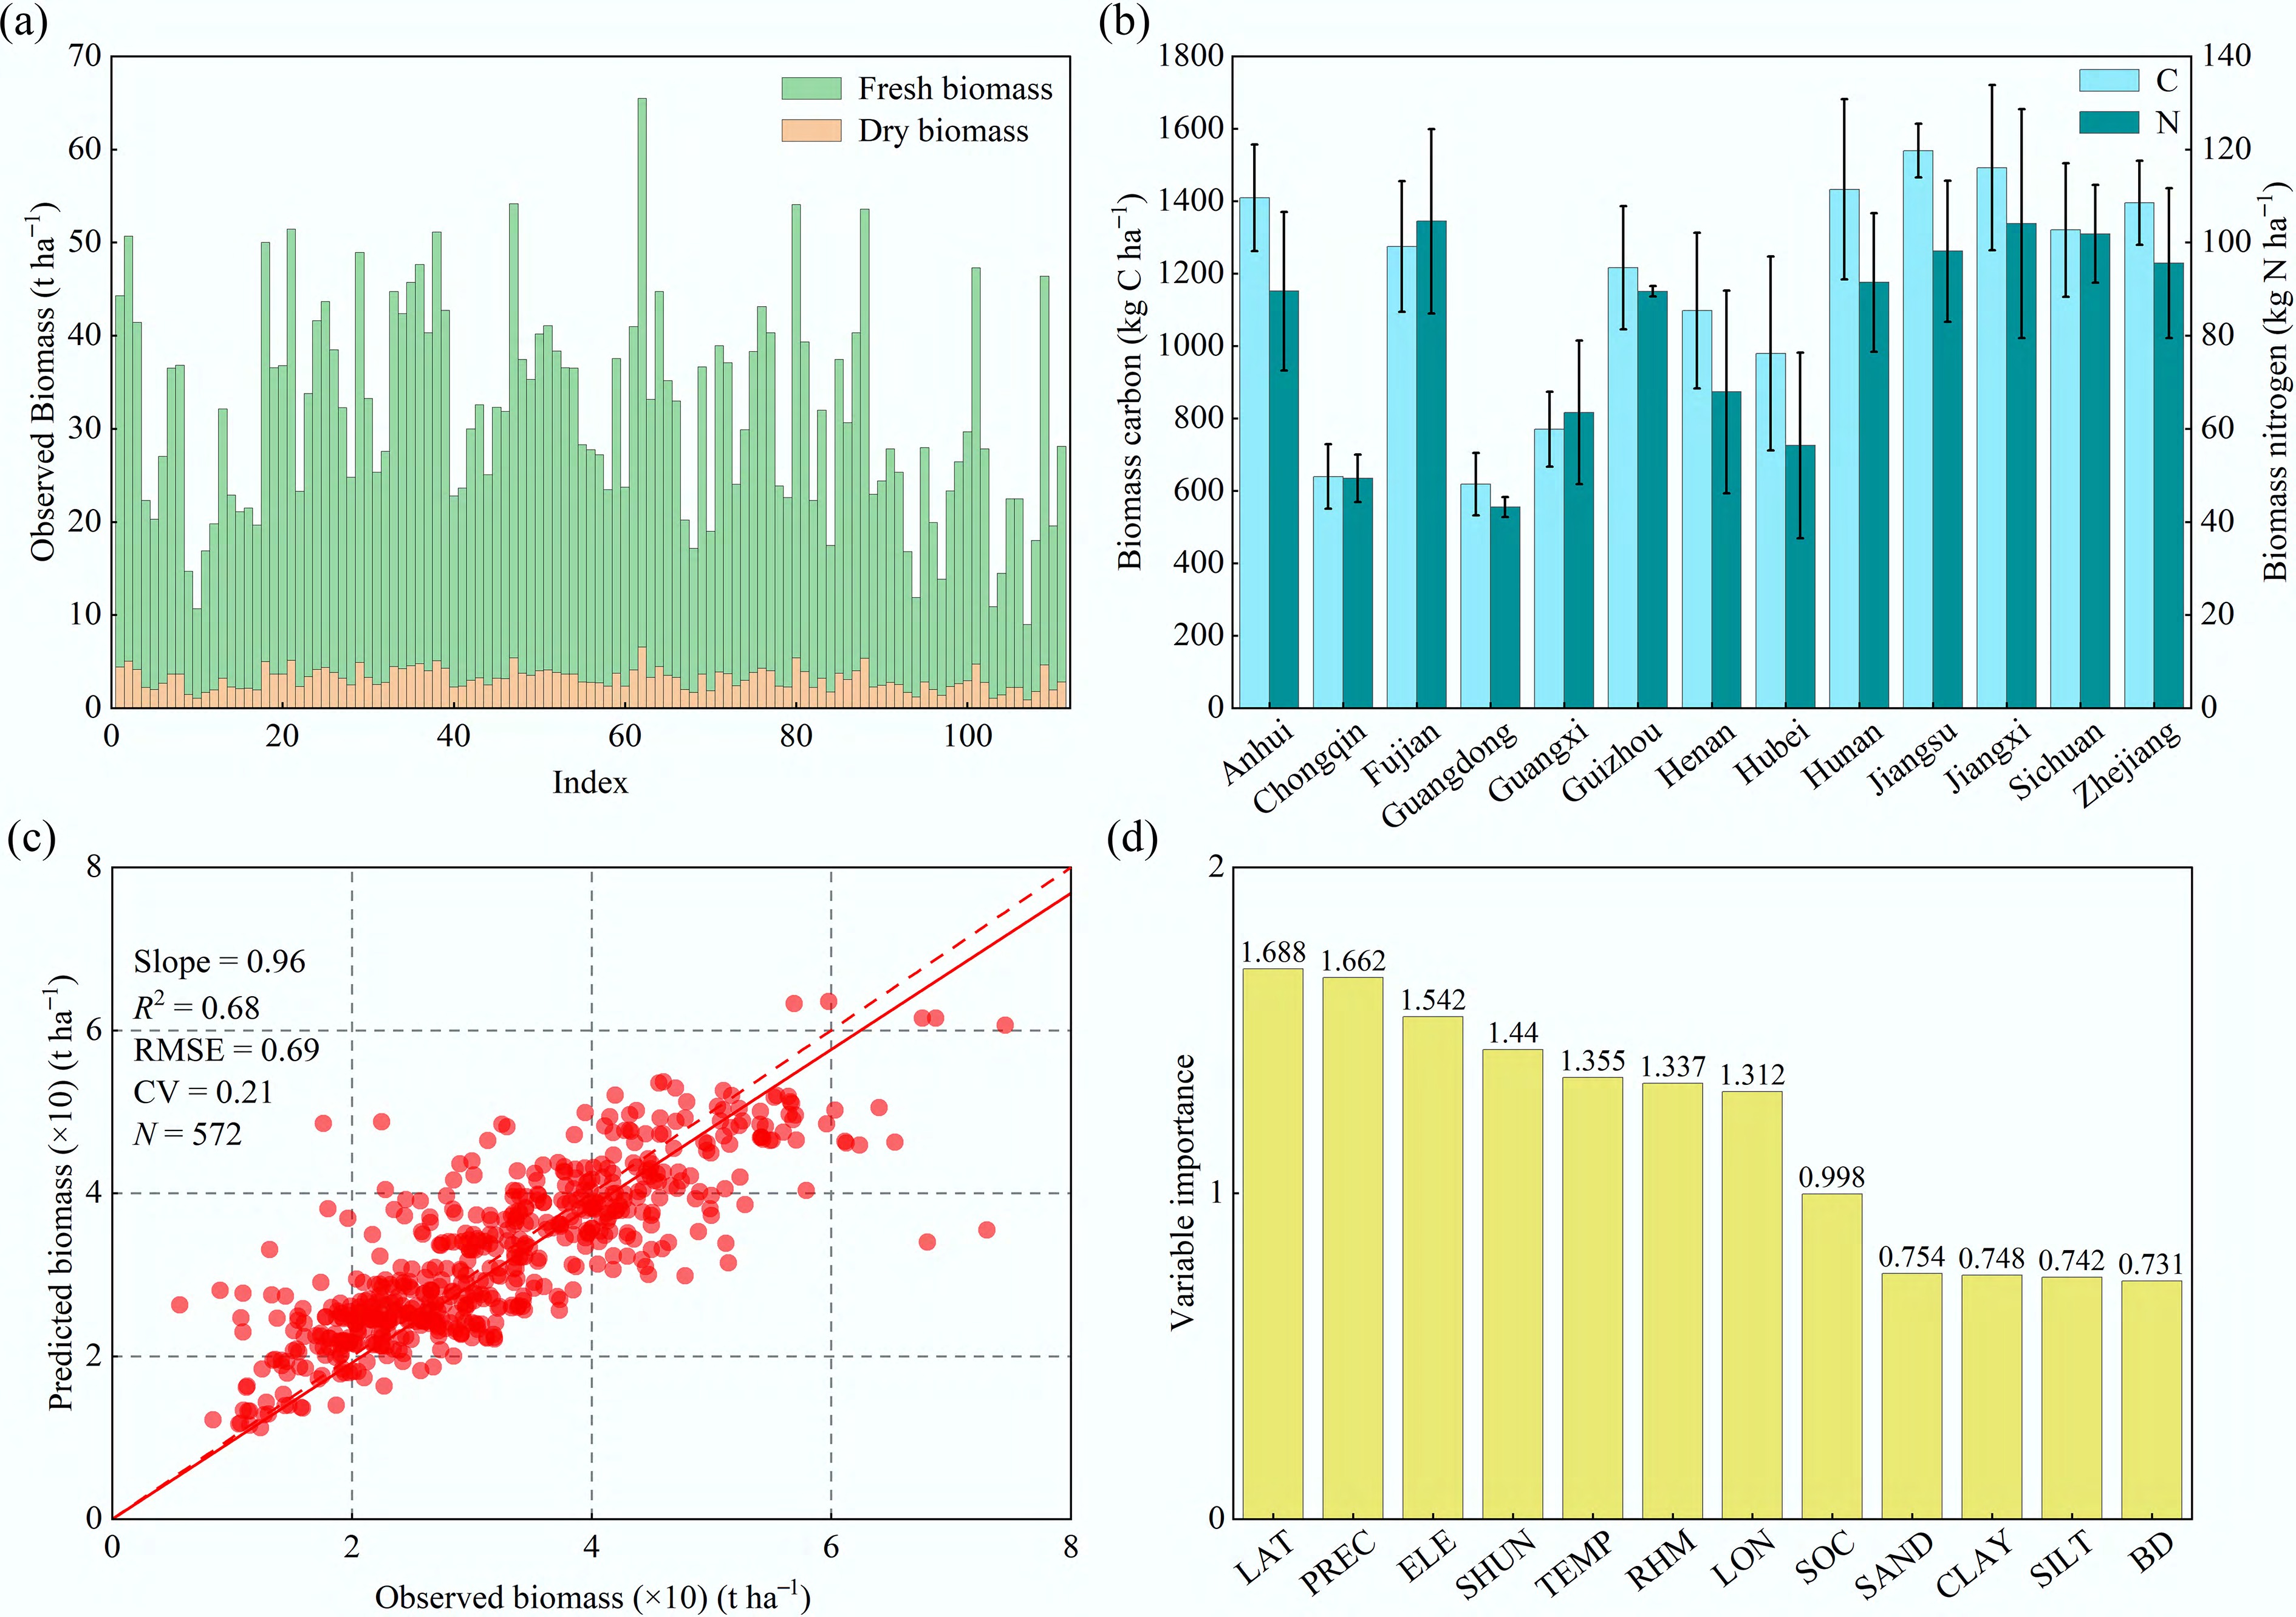
Figure 2.
(a) Field-measured biomass, where x represents the sampling point index and y represents the observed biomass, with a fresh-to-dry conversion factor of 0.1. (b) Provincial carbon and nitrogen accumulation. (c) RF model calibration and validation, both the observed and predicted biomass values were multiplied by 10 for plotting. (d) Key biomass driving factors identified from the RF training datasets.
The RF model effectively explained the spatial distribution of milk vetch (Fig. 2c), with good predictive accuracy (R2 = 0.68, RMSE = 0.69) and a stable error distribution (coefficient of variation = 0.21), confirming its suitability for regional biomass simulation. Among the driving factors influencing the spatial distribution of milk vetch biomass (Fig. 2d), in addition to the geographic factors (LAT, LON, ELE), climatic factors are key determinants of its variation. PREC, SHUN, TEMP, and RHM collectively explain 40.5% of the spatial distribution of biomass. In contrast, soil factors contribute relatively little; among these, SOC has the highest contribution rate, but its overall importance is still lower than that of climatic factors.
The SHAP dependence plots revealed nonlinear threshold responses of biomass to climate variables (Fig. 3). When growing season precipitation (MAP) ranges from 532.8 to 876.9 mm, the SHAP value is positive; moderate precipitation ensures soil moisture supply and has a positive effect on GM biomass. However, when precipitation is too high (exceeding 876.9 mm) or too low (below 532.8 mm), the SHAP value is negative, suggesting that precipitation outside the threshold range causes stress and constrains the growth of milk vetch (Fig. 3a). Furthermore, mean growing season temperature (MAT) exhibits a nonlinear monotonically decreasing pattern. As a winter GM crop, when MAT is below 10.7 °C, the SHAP value remains positive, but this value declines with increasing temperature, implying that warming enhances biomass accumulation, albeit with diminishing positive effects. Between 10.7 °C and 13.7 °C, the SHAP value fluctuates slightly around zero, reflecting a broad thermal buffer where temperature has negligible influence and milk vetch shows strong adaptability. However, when the MAT exceeds the threshold of 13.7 °C, the SHAP value turns negative and decreases further, indicating that heat stress suppresses biomass, but to a lesser extent than in the low-temperature range (Fig. 3b). In addition, RHM and SHUN also exert relatively complex nonlinear effects on GM biomass. Within nonextreme ranges, the SHAP values for both are relatively low and fluctuate gently (Fig. 3c, d), and their impacts are weaker than those of MAP and MAT.
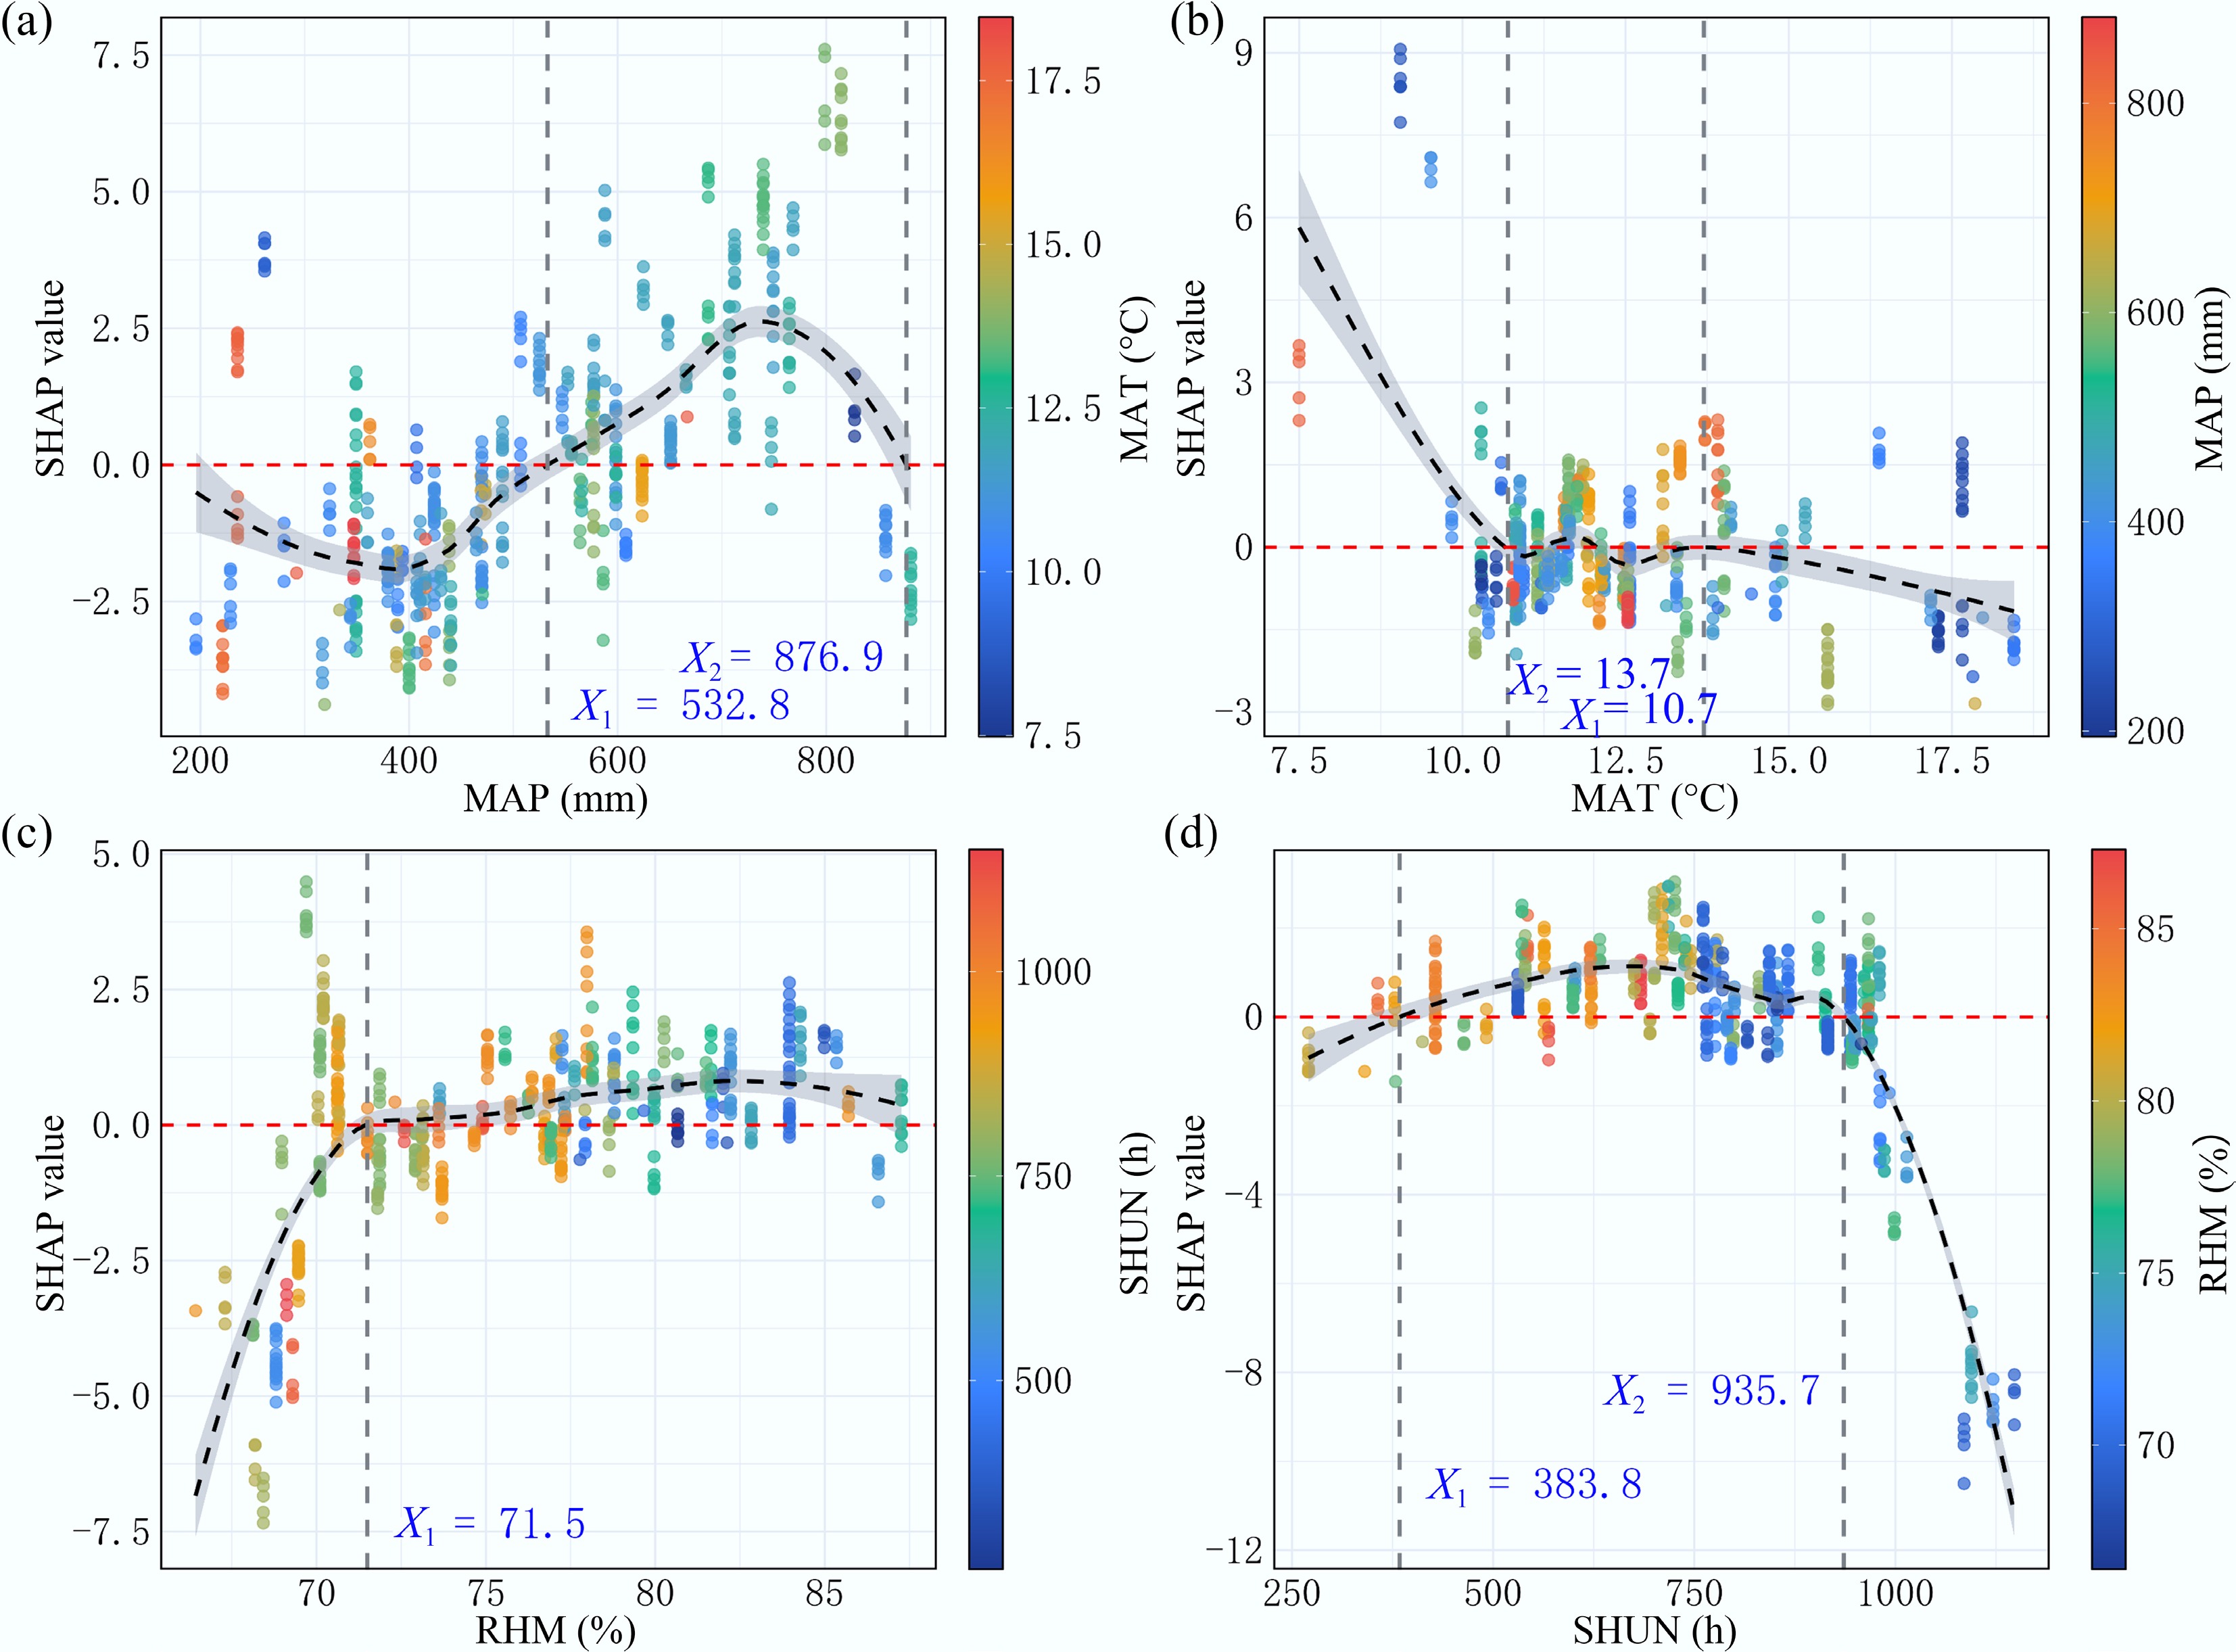
Figure 3.
Climate factor feature dependence plots for (a) growing season precipitation (MAP), (b) growing season mean temperature (MAT), (c) relative humidity (RHM), and (d) sunshine hours (SHUN).
Spatial patterns and temporal dynamics of Chinese milk vetch biomass in response to climate
-
The spatial inversion map of Chinese milk vetch across southern China's rice paddies reveals pronounced spatial heterogeneity, with substantial variations in biomass across various rice-growing regions (Fig. 4a). Consequently, there are also significant differences in the nitrogen-fixing and soil-improving potential of GM across these regions (Fig. 4b–d). Overall, biomass exhibits a latitudinal zonation pattern, with core production areas concentrated in the middle and lower Yangtze River plain, encompassing both single-cropping and double-cropping rice systems, particularly the humid zones of Hunan, Jiangxi, and Zhejiang (where dry biomass exceeds 3.5 t ha−1, equivalent to 95.2 kg N ha−1 and 1,444.45 kg C ha−1). By contrast, low-biomass zones are primarily located in the southern part of the southwest single-cropping rice region and the southern margin of southern China's double-cropping rice region, where dry biomass falls below 1.5 t ha−1 (equivalent to 47.7 kg N ha−1 and 578.4 kg C ha−1). Driven by combined topographic and climatic factors, the southwest single-cropping rice region shows marked local variability, with low biomass prevailing in southern Yunnan but with high-yield patches occurring in northern Sichuan and Guizhou. This spatial pattern aligns with the key drivers identified by the RF model (latitude and precipitation).
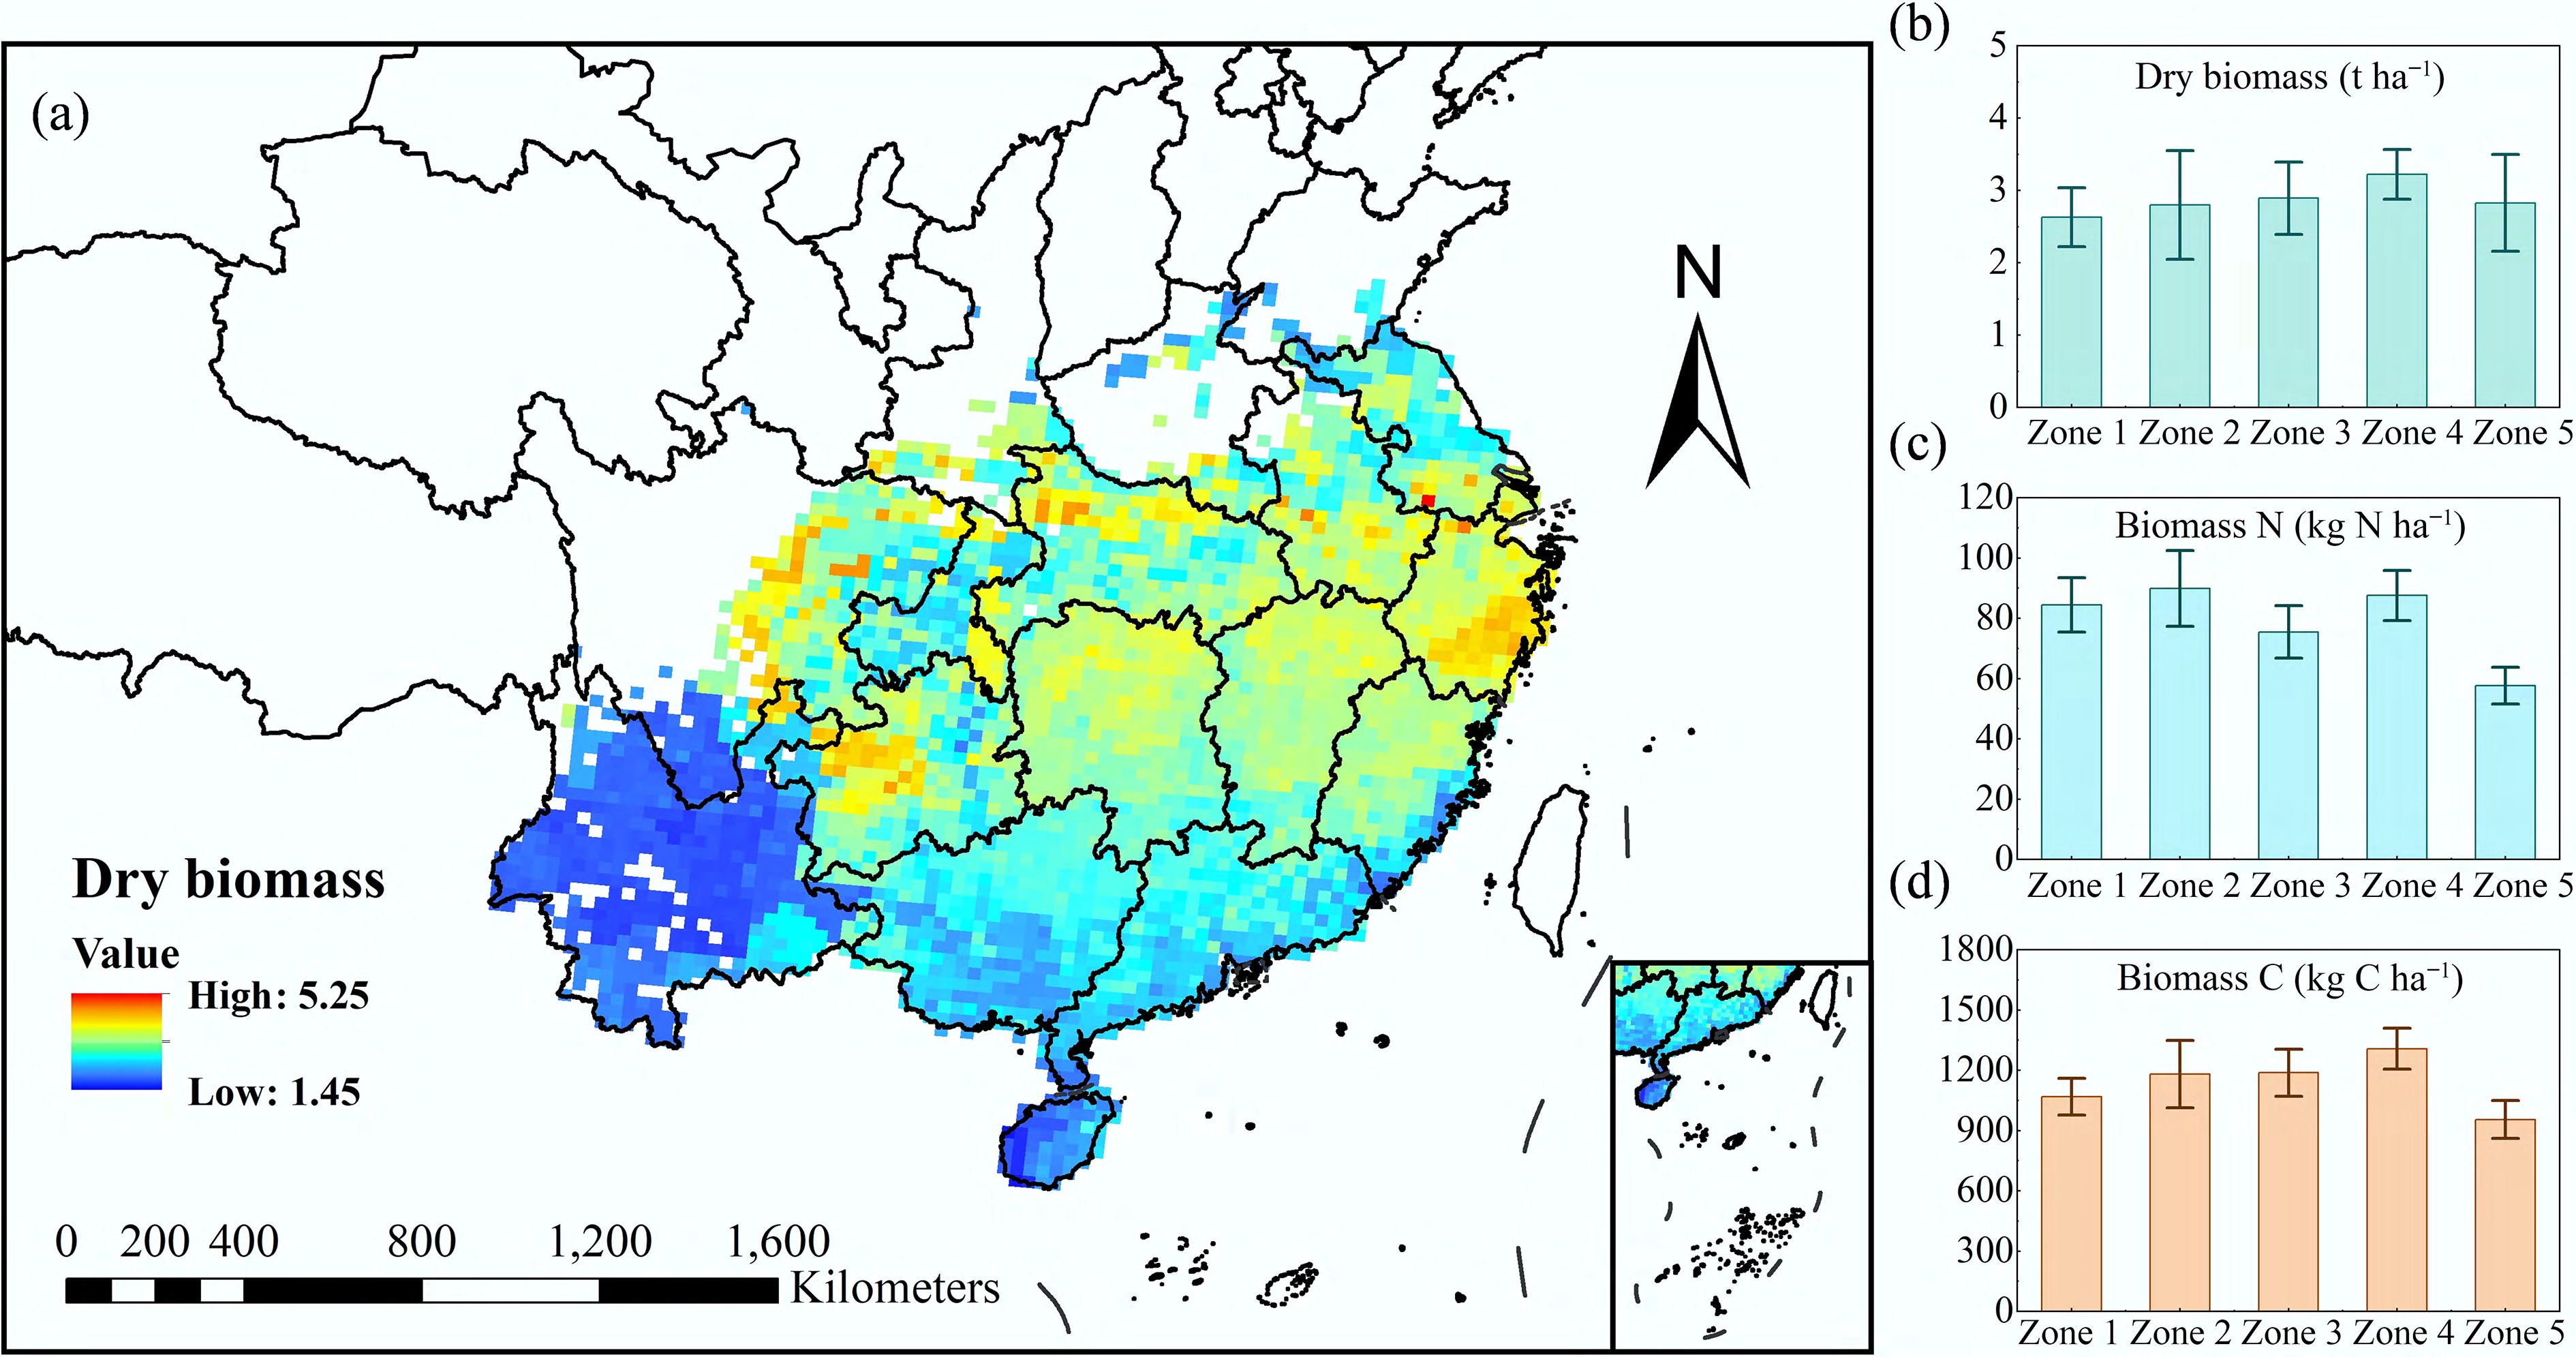
Figure 4.
Spatial pattern inversion of Chinese milk vetch biomass in southern China's paddy fields. (a) Simulated spatial distribution map of milk vetch biomass in southern China in 2019, base map (review number: GS(2024)0650) is sourced from the China National Geospatial Information Public Service Platform:
https://cloudcenter.tianditu.gov.cn/administrativeDivision . (b) Dry biomass of milk vetch in each region. (c) Nitrogen and (d) carbon content of biomass in each region.In terms of long-term dynamics, the average biomass of milk vetch in southern China shows an overall declining trend under all climate scenarios, with an estimated mean reduction of approximately 2%–4% by 2098 (Table 1), accompanied by minor short-term fluctuations (Fig. 5a). In South China's double-cropping rice region (Zone 1), biomass exhibits interannual variability but remains relatively stable (Fig. 5b). As a major GM production area, the middle and lower Yangtze River double-cropping rice region (Zone 4) demonstrates exceptional stability, with boxplots showing minimal median variation and a relatively narrow interquartile range, indicating strong climate resilience (Fig. 5e). Under SSP126 and SSP245, biomass reduction is modest (less than 2.3%), but under SSP370 and SSP585, the synergistic effects of precipitation and temperature even lead to slight biomass increases (1.89–5.87%) (Table 1). By contrast, the middle and lower Yangtze River single-cropping rice region (Zone 3) and the Huang–Huai–Hai single-cropping rice region (Zone 5) experience substantial biomass declines, exceeding 10% under SSP370 (Fig. 5d, f). On a macro-temporal scale, these declines tend to intensify as radiative forcing increases. Under SSP585, the decline in Zone 3 moderates to 3.54%, whereas Zone 5 suffers the most severe regional loss of 14.01% (Table 1). The southwestern single-cropping rice region (Zone 2) also shows an overall declining trend, albeit less pronounced than in the other single-cropping regions (Fig. 5c). Interannual variability analysis indicates that milk vetch biomass is highly sensitive to climate events under moderate–high- and high-emission scenarios, and future climate change may increase the uncertainty in GM production.
Table 1. Changes in biomass, MAP, and MAT from 2019 to 2098
Region Biomass (%) MAP (%) MAT (%) SSP126 SSP245 SSP370 SSP585 SSP126 SSP245 SSP370 SSP585 SSP126 SSP245 SSP370 SSP585 South China −2.82 −2.01 −3.74 −2.97 3.12 10.05 14.70 26.96 8.12 12.09 29.06 36.27 Zone 1 −0.55 2.21 0.97 0.69 9.62 23.70 18.23 16.69 6.39 9.08 22.95 29.25 Zone 2 −2.78 −3.67 −9.09 −7.55 8.82 17.96 −3.55 24.09 7.96 11.09 32.33 40.03 Zone 3 −6.52 −6.50 −10.23 −3.54 −3.65 −5.40 18.24 34.67 10.95 17.17 34.47 40.64 Zone 4 −2.30 −0.24 5.87 1.89 −4.40 −0.63 21.10 32.23 9.23 14.34 29.93 38.84 Zone 5 −3.11 −5.53 −13.17 −14.01 10.74 −0.49 18.37 50.43 11.88 23.12 40.54 46.81 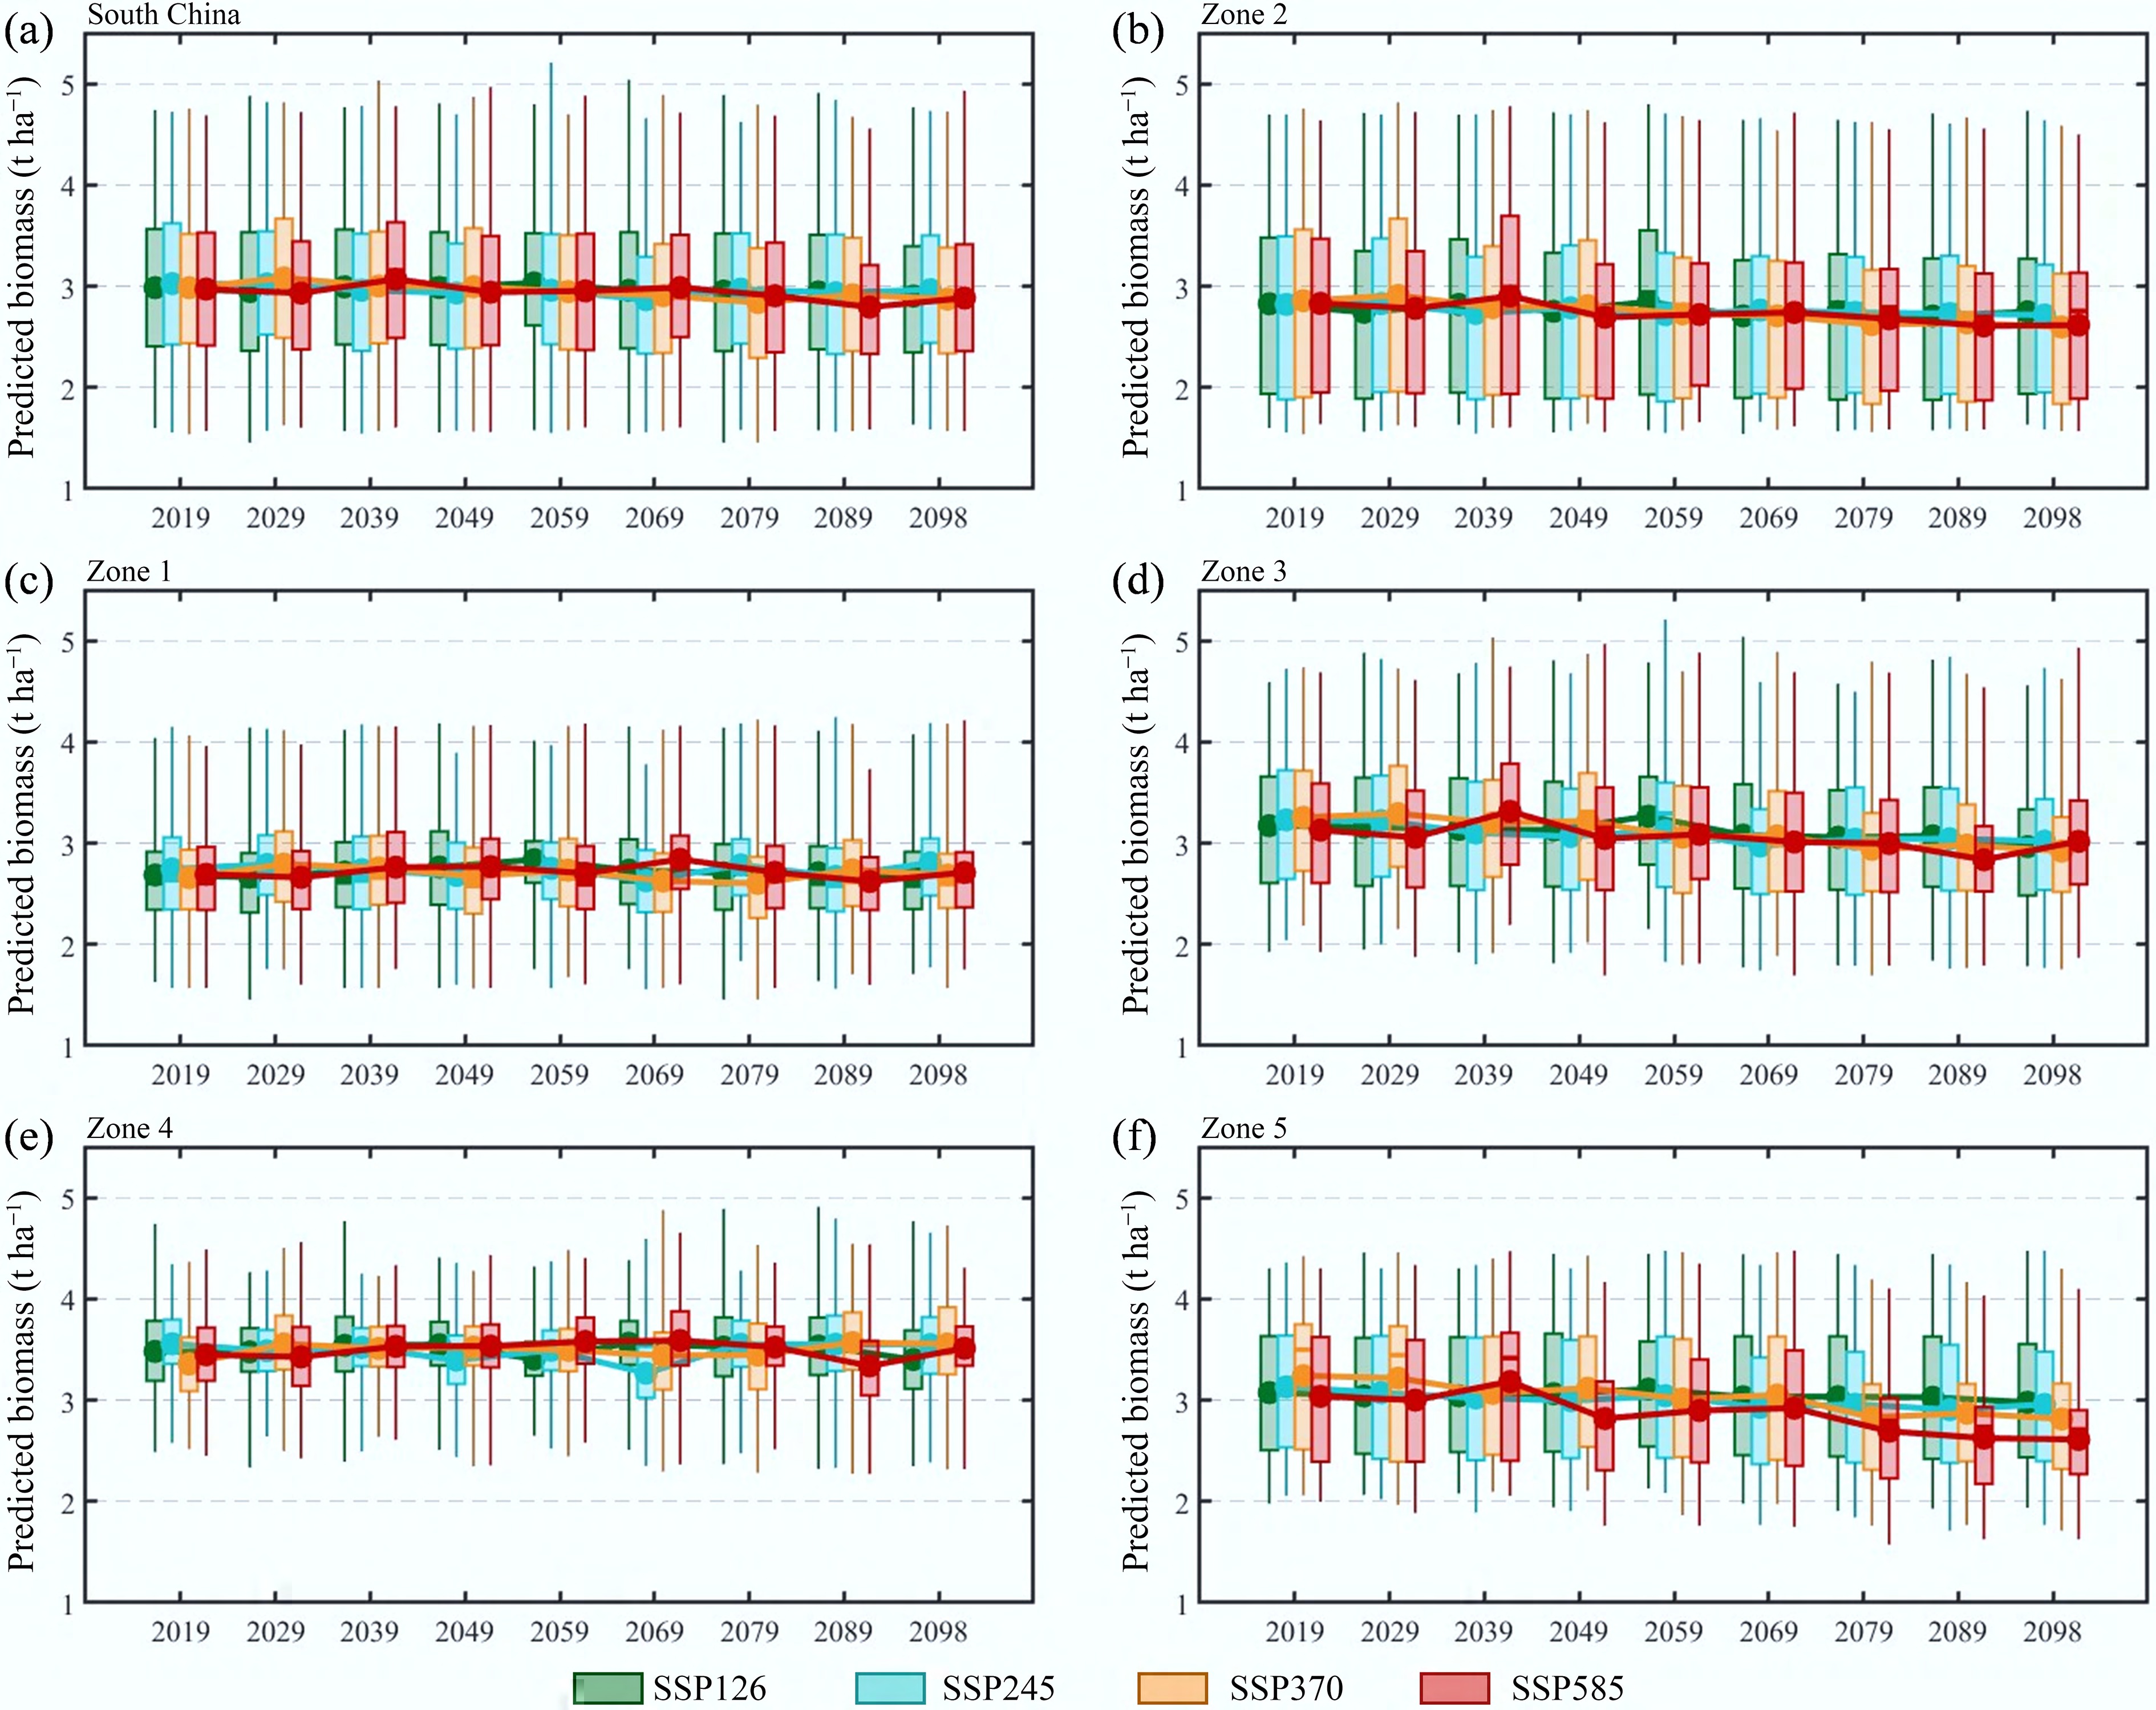
Figure 5.
Time dynamics of Chinese milk vetch biomass in southern China. Temporal dynamics of biomass in (a) southern China and (b–f) Zones 1–5 under the four scenarios (SSP126, SSP245, SSP370, and SSP585).
Drivers of spatial differentiation in biomass under climate change
-
Future climate change will exacerbate the spatial heterogeneity of milk vetch biomass, and this disparity intensifies with increasing radiative forcing (Fig. 6a–d). Under the sustainable development scenario, the decline in dry biomass is relatively moderate, with reductions below 0.5 t ha−1 across most regions. In contrast, the moderate–high- and high-emission scenarios induce substantial biomass variability and amplify regional disparities.
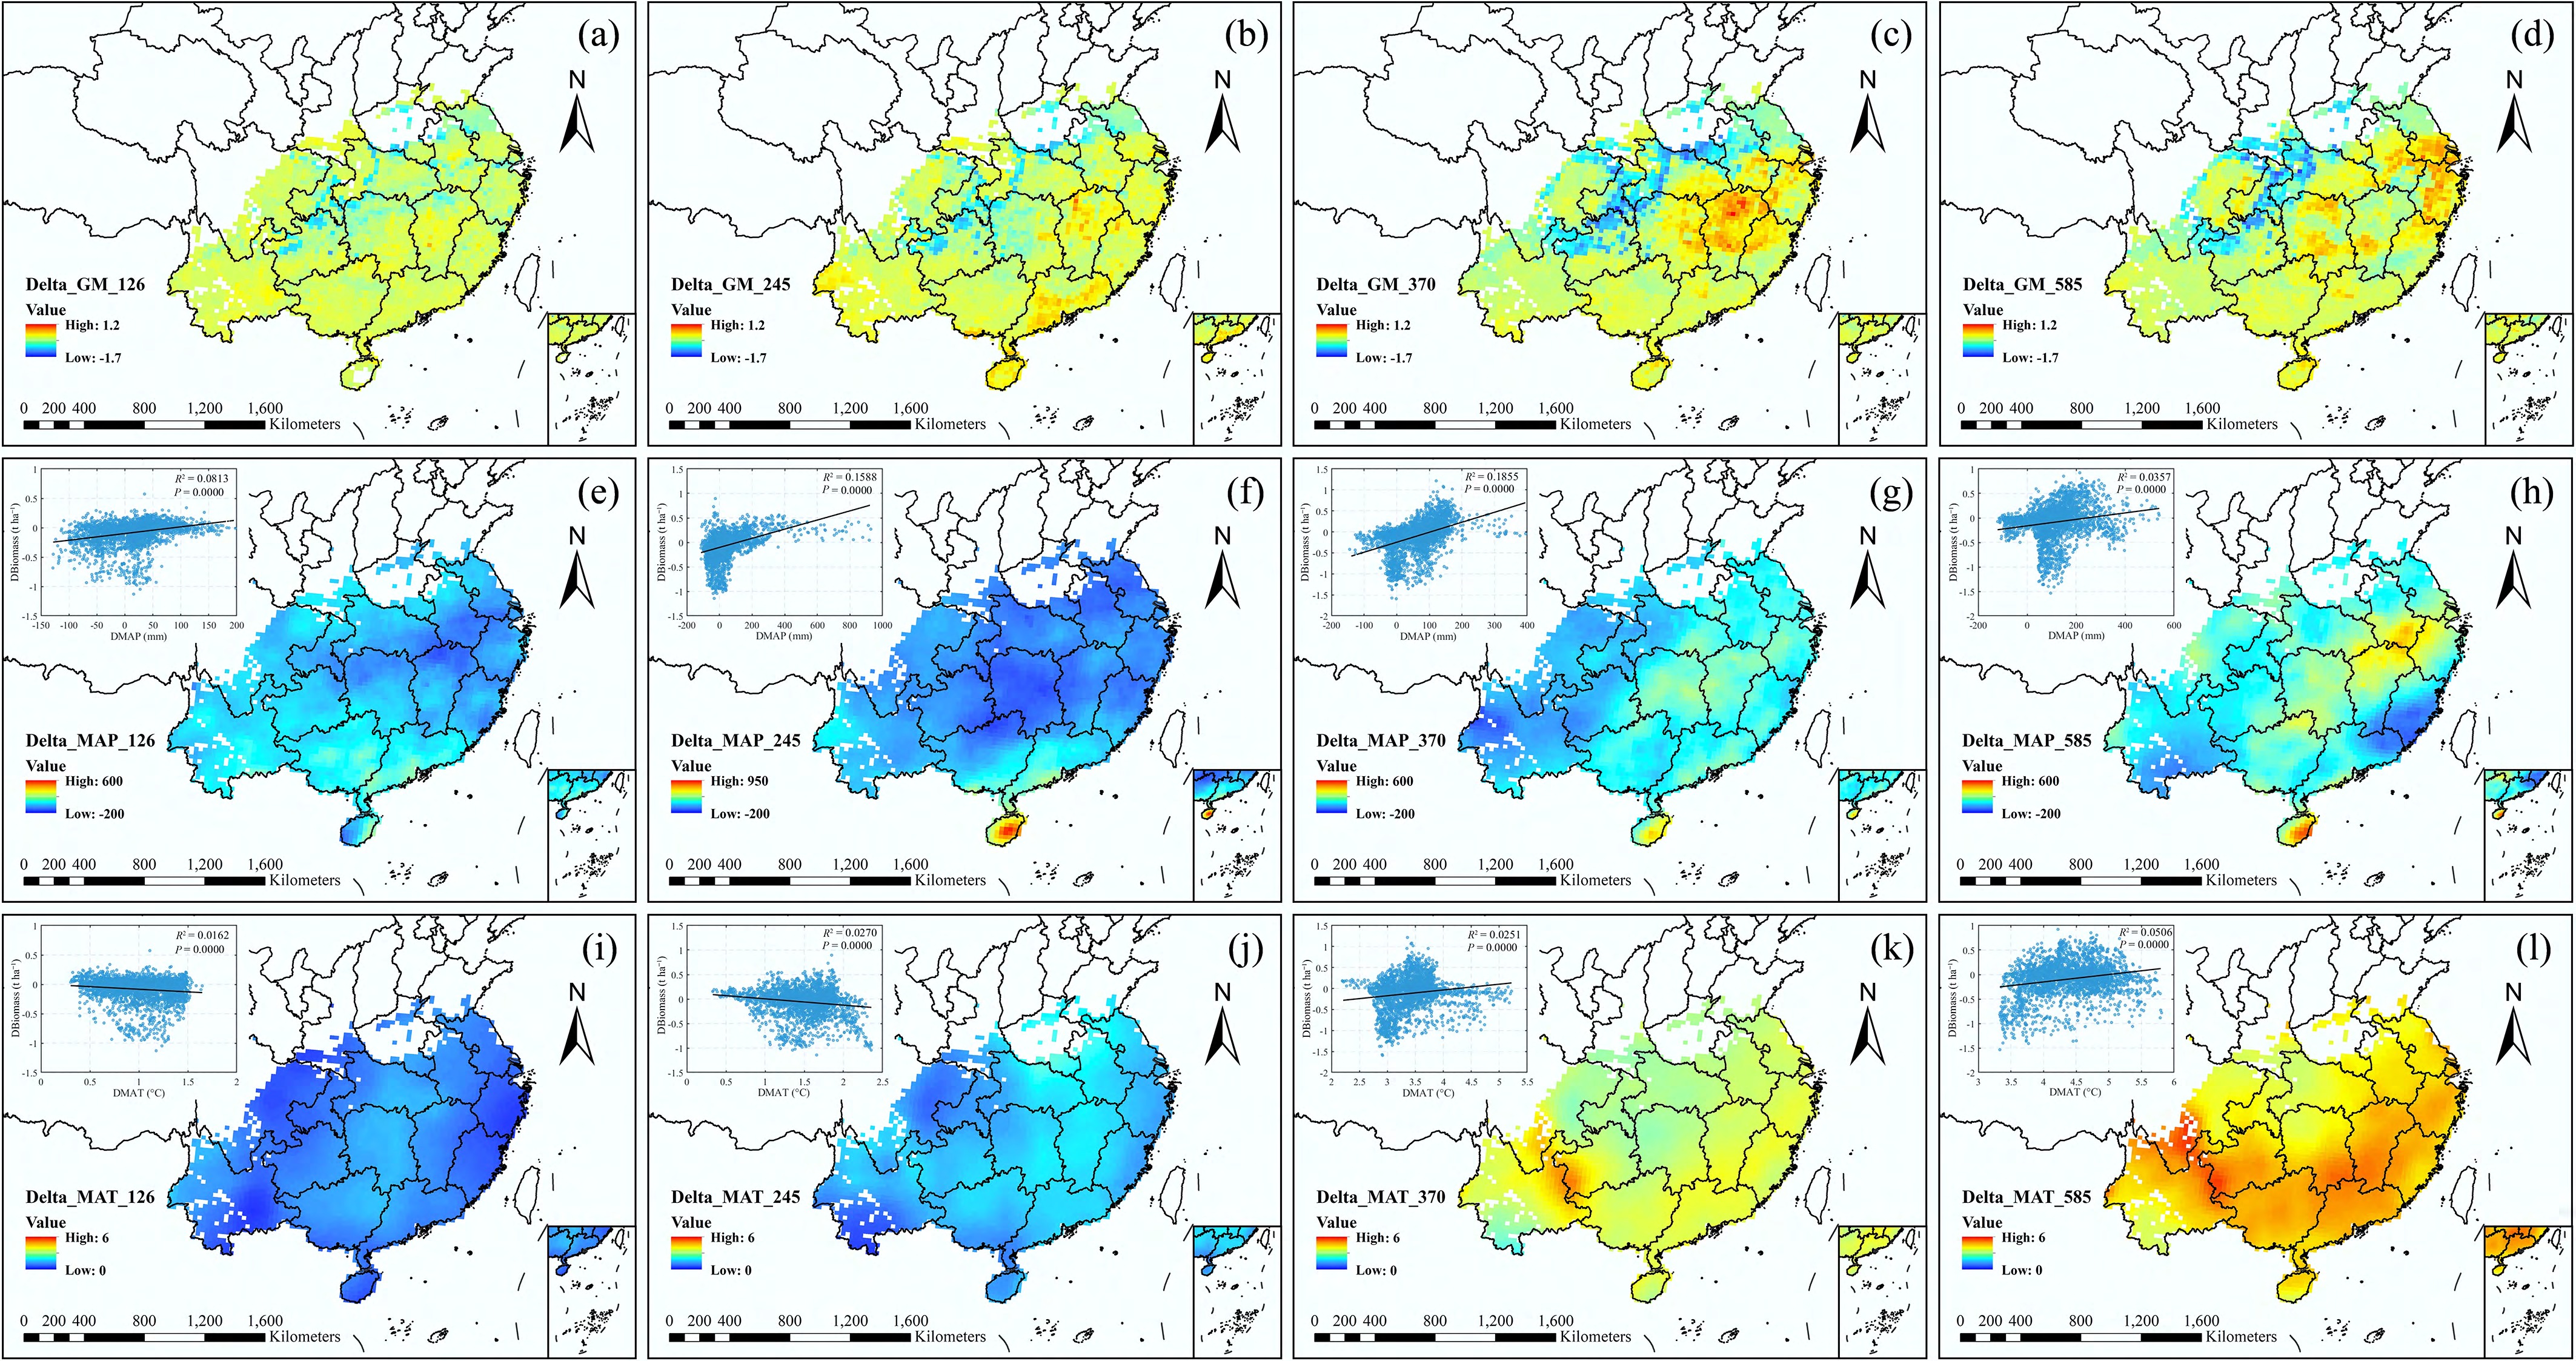
Figure 6.
Spatiotemporal variations of GM biomass, MAP, and MAT in southern China under climate change. The base map (review number: GS(2024)0650) is sourced from the China National Geospatial Information Public Service Platform:
https://cloudcenter.tianditu.gov.cn/administrativeDivision . (a–d) Spatiotemporal variations in GM biomass, (e–h) spatiotemporal variations in MAP and (i–l) spatiotemporal variations in MAT under the four scenarios (SSP126, SSP245, SSP370 and SSP585), respectively.The responses of Chinese milk vetch biomass to climate change vary significantly across rice-growing regions. Under SSP370 and SSP585, the MAT in the middle and lower Yangtze River single-cropping rice region (Zone 3) increases by approximately 34.5%–40.6% (remaining within the thermal buffer zone) (Supplementary Table A2), although the MAP rises by 18.2%–34.7% (still below the critical threshold of 532.8 mm) (Supplementary Table A3). Biomass reduction in this region ranges from 3.54% to 10.23% (Table 1), strongly associated with precipitation change. In contrast, the middle and lower Yangtze River double-cropping rice region (Zone 4) experiences a smaller increase in MAT. Combined with favorable baseline precipitation and substantial future increases in MAP (exceeding 700 mm) (Supplementary Table A3), this region shows a slight biomass increase of 1.89%–5.87%, indicating that the beneficial effect of alleviated water limitation may offset partial heat stress (Table 1). Under SSP585, the Huang–Huai–Hai single-cropping rice region (Zone 5) exhibits marked increases in both MAT and MAP (approximately 50% each). However, precipitation remains far below the drought threshold, leading to a severe biomass decline of 14.01% (Table 1). The southwestern rice region (Zone 2) shows substantial spatial variability because of its wide latitudinal range and complex terrain. Biomass in southern Yunnan remains nearly unchanged across all scenarios, benefiting from the stable local climate (Fig. 6e–l). Similarly, the South China double-cropping rice region (Zone 1) demonstrates strong climate resilience, with biomass changes ranging only from −0.55% to +2.21%, likely attributed to the region's current environmental baseline and the synergistic offsetting of future temperature and precipitation (Table 1).
Correlation analysis further revealed complex relationships between climate variables and biomass changes. Overall, biomass variation was positively correlated with changes in precipitation. Under SSP126, SSP245, and SSP370, the correlation coefficients between changes in biomass and in precipitation (r = 0.2852–0.4307, p < 0.001) (Table 2) were stronger than those of changes in temperature, supporting a precipitation-dominated mechanism under the current climate conditions. Because of the thermal buffer for the growth of milk vetch and synergistic effects of regional precipitation patterns, future warming does not necessarily lead to a decline in biomass. Under SSP585, precipitation increases in parts of the Yangtze River Delta exceeded 800 mm, potentially surpassing the optimal threshold of 876.9 mm in certain regions, which weakened the correlation between precipitation and biomass change (r = 0.1889, p < 0.001) (Table 2). Meanwhile, the correlation between changes in temperature and in biomass shifted from negative to positive, reaching 0.1584 (p < 0.001) and 0.2250 (p < 0.001) under SSP370 and SSP585 (Table 2), which may be related to synergistic compensation or increased extreme climate events causing localized droughts and floods.
Table 2. Relevant analytical performance indicators
Scenario r r2 p-value Biomass–MAP SSP126 0.2852 0.0813 <0.0001*** SSP245 0.3985 0.1588 <0.0001*** SSP370 0.4307 0.1855 <0.0001*** SSP585 0.1889 0.0357 <0.0001*** Biomass–MAT SSP126 −0.1271 0.0162 <0.0001*** SSP245 −0.1643 0.0270 <0.0001*** SSP370 0.1584 0.0251 <0.0001*** SSP585 0.2250 0.0506 <0.0001*** Note: *** indicates significant differences. -
This study used the RF–SHAP framework to reveal the spatial patterns and driving mechanisms of Chinese milk vetch biomass in southern China. The model's explanatory power (R2 = 0.68) is comparable with existing research[42,43]. The results indicated that climatic factors contributed the most (40.5%) to the spatial variation in biomass, exceeding the geographic and soil factors (Fig. 2d). SHAP analysis further uncovered pronounced nonlinear threshold effects of climatic factors, with neither precipitation nor temperature exerting simple positive or negative impacts. Precipitation outside the 532.8–876.9 mm range suppresses biomass via drought or waterlogging stress. Additionally, the seed vigor of milk vetch exhibits stage-specific responses to water stress[44]. Although moderate deficit may trigger compensatory growth, severe stress causes irreversible damage[45]. The thermal buffer of 10.7–13.7 °C indicates substantial resilience to future temperature changes. Warming above the upper threshold induces heat stress, whereas warming below this threshold remains beneficial, potentially enhancing overwinter survival and early spring growth. Temperature shifts can alter phenological development[31]. As a winter GM, Chinese milk vetch is more temperature-sensitive during the late reproductive stage (budding to full bloom), whereas the seedling and overwintering stages tolerate cold stress. Temperature and precipitation interact significantly[46]. SHAP values generally decline with rising temperature, yet moderate warming can be beneficial when precipitation is optimal. Conversely, water conditions become the primary limiting factor when precipitation falls outside the critical range. This complex coupling mechanism explains the heterogeneous biomass responses to climate change across future scenarios.
Predicted results based on multimodel CMIP6 climate data indicate that milk vetch biomass in southern China's rice regions will generally decline under all future scenarios, with an average reduction of approximately 2%–4% (Table 1). Importantly, spatial heterogeneity will intensify, implying that climate adaptation strategies should vary across rice-growing regions. Regional disparities are mainly driven by complex interactions between precipitation and temperature. The middle and lower Yangtze River basin, as the core production area, currently provides relatively favorable conditions for milk vetch and exhibits a strong buffering capacity against climate change. In contrast, the Huang–Huai–Hai single-cropping rice region, located in a climate transition zone, will experience severe biomass losses exceeding 13% under both SSP370 and SSP585 (Table 1). Such regional differences are closely linked to the baseline environmental conditions and the magnitude of future climate change, with transition zones facing greater adaptation challenges. With ongoing warming, the frequency and intensity of extreme heat, droughts, and cold surges may increase, altering overwintering processes and reshaping the spatial distribution of GM biomass. For Chinese milk vetch, extreme low temperatures during winter can cause frost damage, whereas drought during the flowering and pod-setting stages impairs seed production and biomass accumulation[47].
From an agronomic management perspective, region-specific strategies are critical for addressing future climate change. In the traditional high-yield regions of the middle and lower Yangtze River with high nitrogen-fixing potential, GM cultivation can be moderately expanded, and the optimized "milk vetch–rice straw incorporation plus nitrogen reduction" system can be further developed[15]. Sowing dates should be adjusted in response to climate change. Meanwhile, the combined incorporation of milk vetch and rice straw may increase potential CH4 emissions[18], requiring targeted mitigation measures such as delayed flooding to narrow the methanogenesis windows[22] or alternate wetting and drying irrigation to balance CH4 and N2O emissions[19]. For vulnerable high-latitude regions (e.g., Zone 5), efforts can be intensified to breed stress-tolerant varieties suited to the local conditions and implement cultural practices, combined with straw mulching for moisture conservation, to alleviate drought stress.
Although this study has yielded valuable insights into the spatial simulation of Chinese milk vetch biomass and projections of climate impacts, several limitations remain to be addressed in future research. This study's analysis based on multiyear average data fails to fully capture the effects of extreme events. Furthermore, GM biomass accumulation is strongly and complexly regulated by seasonal temperature dynamics, and the spatiotemporal heterogeneity of precipitation (e.g., alternating drought and waterlogging during growth) is often more ecologically significant than total precipitation, suggesting that future research should focus on climate variability rather than merely on long-term trends. Furthermore, the RF model is trained on historical data and does not account for the direct CO2 fertilization effect on photosynthesis under high-emission scenarios[32,48]. Elevated CO2 may partially offset the negative impacts of heat stress, an effect requiring further investigation in future assessments. This study focuses solely on climatic factors, excluding socioeconomic drivers such as cropping systems, farmers' practices, and policy incentives[49], which may exert substantial interactive effects across ecological zones. Lastly, despite using multimodel ensembles from three CMIP6 datasets to reduce uncertainty, inherent discrepancies among models persist in simulating precipitation and temperature, which cannot be fully eliminated[50].
Future research could integrate multisource remote sensing data[51], combined with controlled experiments and crop growth models[52], to elucidate the mechanistic responses of Chinese milk vetch to climate change at the process level. Incorporating interannual climate variability and extreme events will further improve the capacity to support the optimized allocation of GM in southern China's rice regions under climate change.
-
This study integrated ML and interpretable analysis to reveal the spatial patterns and driving mechanisms of Chinese milk vetch biomass at the regional scale, and projected its spatiotemporal dynamics under future climate scenarios. The results showed that climatic factors were the dominant drivers, contributing 40.5% to biomass variation. The critical thresholds of growing season precipitation (532.8–876.9 mm) and mean temperature (10.7–13.7 °C) identified in this research may provide reference ranges and testable hypotheses for future studies on adaptation strategies, including breeding programs and field management under climate change. Biomass exhibited substantial spatial heterogeneity, with high values concentrated in the middle and lower Yangtze River region and low values in southwestern China and the southern margin of southern China's rice areas. Under future scenarios, shifts in temperature and precipitation patterns will exacerbate regional disparities, with an overall biomass decline of approximately 2%–4%. The Huang–Huai–Hai single-cropping rice region may face increasing constraints on milk vetch biomass production. In contrast, the middle and lower Yangtze River double-cropping rice region remains stable or even shows slight growth, supporting the sustainable development of rice–milk vetch rotations. These findings provide a scientific basis for optimizing GM's spatial allocation across southern China's rice paddies. The compiled field dataset and gridded biomass products can support meta-analyses, serve as benchmark data for calibrating process-based crop models (e.g., DSSAT, WHCNS), and provide training and validation samples for upscaled remote sensing research.
We thank the researchers at the provincial academies of agricultural sciences in Anhui, Yunnan, Hunan, Hubei, and Guangxi for their cooperation and assistance during the GM sampling process.
-
It accompanies this paper at https://doi.org/10.48130/aee-0026-0022.
-
Not applicable.
-
The authors confirm their contributions to the paper as follows. writing – original draft, data curation, visualization: Wu X; writing – review and editing: Wu X, Liang H; conceptualization, methodology: Liang H, Gao S; resources, supervision: Liang H, Gao S, Chen R; funding acquisition: Chen R; investigation: Gao S. All authors reviewed the results and approved the final version of the manuscript.
-
The rasterized biomass product generated by this study is publicly available on Figshare at https://doi.org/10.6084/m9.figshare.33028331.
-
The authors declare that they have no known competing financial interests or personal relationships that could have appeared to influence the work reported in this paper.
-
Full list of author information is available at the end of the article.
- The supplementary files can be downloaded from here.
- Copyright: © 2026 by the author(s). Published by Maximum Academic Press, Fayetteville, GA. This article is an open access article distributed under Creative Commons Attribution License (CC BY 4.0), visit https://creativecommons.org/licenses/by/4.0/.
-
About this article
Cite this article
Wu X, Liang H, Chen R, Gao S. 2026. Spatial patterns and climate-driven factors of Chinese milk vetch biomass in southern China's rice paddies. Agricultural Ecology and Environment 2: e024 doi: 10.48130/aee-0026-0022 

Spatial patterns and climate-driven factors of Chinese milk vetch biomass in southern China's rice paddies
- Received: 14 June 2026
- Revised: 25 July 2026
- Accepted: 07 September 2026
- Published online: 28 September 2026
Abstract: Chinese milk vetch (Astragalus sinicus L.) is the primary winter leguminous green manure (GM) in rice (Oryza sativa) paddies in southern China. Its biomass determines the soil nitrogen supply, organic carbon sequestration, and ecosystem service function. However, the regional patterns of milk vetch biomass and its responses to climate change remain unclear, hindering the precise management of GM–rice rotation systems. Based on 572 field measurements across 13 provinces in southern China, this study combined the Random Forest (RF) algorithm and SHAP (SHapley Additive exPlanations) analysis to project the dynamics of milk vetch biomass under future scenarios and quantify the key drivers' threshold effects. The results showed that RF reliably simulated biomass's spatial patterns (R2 = 0.68, p < 0.01). The multiyear mean dry biomass was 3.23 t ha−1, equivalent to 87.85 kg N ha−1 and 1,252.05 kg C ha−1. Biomass exhibited strong spatial heterogeneity, with geographic, soil, and climatic factors explaining 31.7%, 27.8%, and 40.5% of its variation, respectively. Specifically, high-value areas were concentrated in the middle and lower Yangtze River, whereas low-value areas were distributed in the southern and southwestern rice regions. SHAP analysis revealed threshold effects where growing season precipitation of 532.8–876.9 mm and a mean temperature of 10.7–13.7 °C are critical for biomass accumulation, with complex interactions. Under future climate change, biomass will generally decline, with large regional variability (−14.0% to +5.9%). Under SSP370 and SSP585, the Huang–Huai–Hai single-cropping rice regions will experience severe declines (−13.2% to −14.0%), while double-cropping rice region remains stable and the middle and lower Yangtze River double-cropping rice region shows slight increases (1.9% to 5.9%). This study clarifies spatial patterns and drivers of milk vetch biomass and projects climate impacts, providing data support for rational green manure management in southern China's rice paddies.
-
Key words:
- Chinese milk vetch /
- Biomass /
- RF-SHAP /
- Spatial distribution /
- Climate change