


-
Coastal zones, particularly estuaries, serve as the intersection points between marine and terrestrial ecosystems, possessing rich biodiversity and complex biogeochemical cycles, and are closely related to public health[1]. Coasts are also potential hubs for biological hazard factors such as pathogenic microorganisms and the antibiotic resistance genes (ARGs) and virulence factor (VF) genes that they encode, posing serious threats to human health and ecosystem safety[2]. Domestic sewage and livestock farming wastewater discharges are among the main sources of pathogens in nearshore waters. Although most existing sewage treatment plants perform disinfection before discharge, some disinfectant-resistant pathogens may still be released into natural water bodies[3]. At the same time, nearshore aquaculture can also release pathogens into seawater. Common pathogenic bacteria (PB) reported in coastal waters include Escherichia coli, Salmonella, Shigella, Campylobacter, Vibrio cholerae, Yersinia enterocolitica, Listeria monocytogenes, and Aeromonas veronii; while Channel Catfish Virus, Infectious Hematopoietic Necrosis Virus, and Viral Hemorrhagic Septicemia Virus are among the common viruses[4,5].
The urgency for surveillance of these biological hazards is amplified by the dual pressures of rapid urbanization and global climate change. Nearly 40% of the world's population resides within 100 km of a coastline, leading to unprecedented levels of wastewater production and environmental degradation[6]. Climate change exacerbates these risks through rising sea surface temperatures, which favor the proliferation of thermophilic pathogens such as Vibrio species, and altered precipitation patterns that increase the frequency of sewer overflows and the mobilization of soil-borne pathogens into recreational and aquaculture waters[7,8].
Currently, databases on pathogenic microorganisms in coastal environmental waters remain scarce. Dong et al. constructed the Database of Pathogenic Bacteria Involved in Water Environment (DPiWE), which has collected 9,070 pathogenic bacterial strains along with their corresponding 16S rRNA gene sequences, host information, and infection types[9]. Lo et al. constructed the Aquaculture Bacterial Pathogen Database (ABPD), which systematically catalogs over 210 bacterial pathogen species in aquaculture[10]. Emmenegger et al. constructed the AquaPathogen X database, which documents individual isolates of aquatic pathogens and supports the tracking and management of emerging fish viruses in North America[11]. However, these databases lack information on the geographical and temporal distribution and abundance of pathogens, making it impossible to conduct research on pollution tracing, environmental tracking, and risk assessment. At the same time, there is still a lack of database construction for animal and human pathogenic viruses (PV) in coastal waters.
In this study, we introduce the Coastal Water Pathogen Database (CWPD), which is an online resource platform dedicated to the survey of microbial pathogens in coastal environments. It aims to provide data support for in-depth analysis of the distribution characteristics, potential biological risks, and ecological impacts of nearshore biological hazards. By integrating metagenomic data from coastal environments across public databases, the platform systematically extracts genomic fragment information of PB and PV, along with key biological risk factors (BRFs) such as ARGs and VFs. CWPD integrates multidimensional analytical capabilities: supporting composition and abundance statistics for pathogens and ARGs, interactive spatial distribution visualization based on major global estuaries, precise information retrieval tools, and annotation analysis services for user-defined metagenomic data. By integrating publicly available metagenomic data with geographic context, the platform aims to elucidate the spatiotemporal dynamics and biological risk levels of pathogens in coastal ecosystems and provide scientific evidence and technical support for estuarine ecological research, public health management, and environmental policy formulation.
-
We collected information on 383 bacterial, viral, and eukaryotic pathogens from the following resources: the National Center for Biotechnology Information (NCBI) (
www.ncbi.nlm.nih.gov ), the Centers for Disease Control and Prevention (CDC) (www.cdc.gov ), China CDC (www.chinacdc.cn ), the International Committee on Taxonomy of Viruses (ICTV) (https://ictv.global ), and the Pathogen-Host Interaction Database (PHI-base,www.phi-base.org ). To resolve synonyms, across the above pathogen data sources, the same microorganism often appears under different naming conventions—for example: SARS-CoV-2, 2019-nCoV, and COVID-19 virus. We utilized a proprietary 'Synonym Mapping Table' with the NCBI Taxonomy ID (NCBI_ID) serving as the unique identifier. Following manual verification, names, abbreviations, or legacy terms from external databases are mapped to the standard scientific name. All pathogen names are then mapped to the NCBI Taxonomy database, using the NCBI Taxonomy ID as the sole standard identifier. This establishes a unified taxonomic framework from kingdom to strain, effectively resolving inconsistencies caused by differing naming systems across various databases. Pathogen inclusion is based on explicit evidence of pathogenicity from authoritative organizations and databases. This includes: (1) official reports of human infection or pathogenicity from national CDC (such as the US CDC and China CDC), ICTV, NCBI, and the WHO; (2) verified host-pathogen interaction data from PHI-base; and (3) a focus on pathogens with clear evidence of human infection and zoonotic pathogens. Pathogens that exclusively infect animals or plants (particularly aquatic species) are included in the underlying database but are explicitly labeled with their corresponding potential host categories. To ensure high-fidelity data, pathogens were required to meet at least one of the following hierarchical thresholds: (1) statutory priority: Inclusion in the WHO or national CDC lists of statutory infectious diseases or priority surveillance programs; (2) verified pathogenicity: documented evidence of pathogenic mechanisms within the PHI-base repository; and (3) genomic integrity: possession of a verified, complete reference genome curated within the NCBI RefSeq or GenBank databases.Information on ARGs and ARG categories was sourced from the Comprehensive Antibiotic Resistance Database (CARD)[12]. VF information was sourced from the Virulence Factor Database (VFDB)[13]. All these elements constituted the CWPD's BRF knowledge dictionary.
Metagenomic data collection
-
We searched for studies with metagenomic sequencing data related to coastal environments. The screening criteria for the project data were as follows: (1) sequencing method: shotgun high-throughput sequencing based on the Illumina platform with a minimum sequencing depth of 10 GB; (2) sampling period: 2010–2024 and released before Feb 2, 2024; and (3) water samples from estuarine, coastal, and inland sea environments. Data from 16S rRNA gene sequencing were excluded. We selected shotgun metagenomic data generated exclusively on the Illumina platform to minimize errors associated with platform-specific sequencing biases. A minimum sequencing depth of 10 GB per sample was mandated, as lower depths frequently failed to capture rare but clinically significant pathogens and ARGs in complex environmental matrices. We retrieved sequence read archives for these samples from the NCBI database. Associated metadata, including the dates of sample collection and the geographic coordinates (i.e., latitude and longitude) of the sampling sites, were obtained.
Metagenomic data analysis
-
Raw reads were trimmed and quality-filtered using flexbar (v3.5.0)[14] and skewer (v0.2.2)[15]. Reads of average Q-scores greater than 30 and lengths greater than 75 nucleotides (nt) were kept. Community composition was classified using MetaPhlAn (v3.0) with default settings[16]. The composition of pathogenic microorganisms was analyzed using MegaPath (v2.0)[17] with the default parameters. MegaPath includes several built-in steps intended to reduce spurious calls: it removes reads that align to the human reference genome and to a database of broadly homologous/repetitive regions prior to pathogen alignment (the paper describes these as 'confidently aligned' reads). MegaPath then applies 'spike polishing,' in which genomic regions with abnormally high read depth (depth > mean + α·sd) are treated as likely repetitive/homologous; alignments in these regions are removed, with default α = 30. Finally, MegaPath performs a two-stage assignment and reassignment procedure that explicitly leverages uniquely assigned reads (UCount) vs multi-assigned reads (MCount), using default thresholds r = e = 0.05 in its 'explains' logic before final LCA-based taxon assignment; this global reassignment is described as reducing false-positive assignments. Information on pathogenic microorganisms was generated from the MegaPath results via matching species names against our knowledge dictionary.
To annotate ARGs and VFs, clean reads were assembled using MEGAHIT[18] with k-mer parameters set to 21, 29, 39, 59, 79, 99, 119, and 141. Sequences longer than 2 kb were retained for further analysis. Potential coding sequences were predicted using Prodigal (v2.6.3, -meta)[19]. The setting of a 2 kb threshold allowed for the prediction of complete or near-complete open reading frames, providing the genomic context necessary for accurate functional assignment. We annotated predicted protein sequences for ARGs using DeepARG (probability threshold 0.8, which is the recommended default to balance sensitivity and precision in the classification of ARGs)[20]. VFs were annotated using Diamond BlastP[21] against the VFDB database (e-value threshold 1e-5, ensuring that the alignments are statistically significant). These settings were consistent with established benchmarks for metagenomic profiling in complex environmental matrices, where the signal-to-noise ratio can be compromised by the high abundance of non-target genetic material. To estimate ARG and VF abundance, clean reads were mapped to ARG- and VF-containing contigs using BWA-MEM (v2.3.2)[22]. Reads with mapping coverage below 90% of the read length or with less than 99% identity were removed using Bamm (
https://github.com/Ecogenomics/BamM ). The number of mapped reads was counted using BBMap[23]. We calculated the copy number per 1,000 genomes of ARGs and VFs in each sample by normalizing to the average copy numbers of conserved single-copy genes, including COG0048, COG0049, COG0087, COG0088, COG0091, COG0093, COG0094, COG0096, COG0097, COG0099, COG0100, COG0102, COG0184, COG0186, COG0256, and COG0522.Clinical case cross-reference
-
To cross-reference our environmental findings with clinical surveillance reports, we leveraged several large language models—including Gemini 3 Thinking (
https://gemini.google.com/app ), ChatGPT 5.4 Thinking (https://chatgpt.com/ ), and DeepSeek 671B (www.deepseek.com/ )—to identify public health events or outbreaks associated with the dominant bacterial and viral pathogens detected in specific coastal regions during corresponding time periods. All AI-generated results and information sources were subsequently subjected to rigorous manual verification to ensure data integrity and accuracy (Supplementary Table S1).Database reconstruction and network implementation
-
In CWPD, we used a PostgreSQL database to store knowledge dictionary data and annotation results for pathogenic microorganisms, ARGs, and VFs in samples. PostGIS, a PostgreSQL plugin, was used to store geographical information. Axios (
www.axios-js.com/docs/react-axios.html ) was used for the search function using exact and regular expression matching. The website's backend was implemented using Python (www.python.org/ ). The web interface was built using VS Code with Vue.js (https://cn.vuejs.org/ ), CSS, HTML, JavaScript, and Element (https://element.eleme.cn/#/en-US ). Echarts (https://echarts.apache.org/en/ ) was used for heatmap and scatter plot visualizations. A fragment upload method was used in the annotation module for segmentation and to record the number of slices to enable resume-from-breakpoint functionality. Submitting a task triggers a file transfer to the OpenGMS model and initiates an asynchronous computation task in the allocation queue, reflecting the task status. Upon completion of the computation, the results are stored in the PostgreSQL database. -
The built-in BRF knowledge dictionary of CWPD contains 1,904 entries of pathogenic microorganisms, including 991 bacteria, 514 viruses, and 399 fungi, 2,373 ARGs belonging to 47 ARG categories, and 541 VFs (Table 1). In the current version of CWPD, information on 158 coastal samples was recruited from six coastal regions, including the Pearl River estuary[24,25], the Cochin estuary[26], the Columbia River estuary[27], the Chesapeake Bay[28], the Delaware Bay[28], and the Baltic Sea[29−32] (Supplementary Table S2). The salinity and temperature of these samples range from 0.06 to 35.08‰ and from 1.64 to 31.50 °C, respectively. In these samples, 361 PB and 42 PV, 287 ARG subtypes of 30 ARG classes, and 10 VFs were detected. To facilitate follow-up scientific analyses by users based on our database, we submitted the raw abundance data of all the detected BRFs alongside the environmental factors as supplementary documents (Supplementary Tables S3–S7).
Table 1. Summary of CWPD data
Factors Numbers Samples 158 Coastal regions 6 Salinity 0.06‰–35.08‰ Temperature 1.64–31.50 °C Pathogens 403 (1,904) Bacteria 361 (991) Viruses 42 (514) Fungi 0 (399) ARGs ARG classes 30 (47) ARG subtypes 287 (2,373) VFs 10 (541) The number in parentheses indicates the total number of entries in the database knowledge dictionary. The evaluation of CWPD against extant resources reveals its role as a cross-disciplinary synthesizer (Table 2). Previous efforts, such as the DPiWE, were groundbreaking in their focus on bacterial pathogens in water but were limited by the resolution of the 16S rRNA marker gene, which cannot resolve many pathogens to the species level or provide any functional information[9]. Similarly, the ABPD has provided valuable data for the aquaculture sector, but its focus is primarily on bacterial species that impact specific host animals[10]. CWPD's inclusion of viral and fungal pathogens, alongside its comprehensive profiling of the 'resistome' and 'virulome,' offers a more holistic picture of the environmental health risks in coastal waters. This multi-taxon approach is particularly relevant for tracking PV in wastewater-impacted coastal zones, a recent application that highlights the versatility of the database[11]. By providing an integrated, GIS-based platform, CWPD enables researchers to move beyond single-species or single-discipline studies, fostering a truly interdisciplinary approach to biocontaminant research.
Table 2. CWPD's advantages and limitations relative to existing resources
Feature CWPD DPiWE[9] ABPD[10] AquaPathogen X[11] Pathogen diversity Bacteria, viruses, fungi Bacteria Bacteria (aquaculture) Multi-taxa (isolates) Functional factors ARGs and VFs NA NA Epidemiological traits Data source type Shotgun metagenomics 16S rRNA/isolates eDNA metabarcoding Individual isolates Spatial visualization Interactive webGIS Static/result-based Regional profiles Template-based Analysis utility Online mNGS pipeline Sequence alignment Monitoring support Surveillance tool Temporal range 2010–2024 (global) Not specified One year (regional) Isolate history Visualization of the distribution of pathogens
-
The CWPD platform uses an interactive model and an integrated visualization framework to display the global distribution of pathogens. The homepage features two WebGIS-based world maps and two word clouds showing the data during the periods of 2010–2015 and 2016–2024, respectively (Fig. 1). A word cloud dynamically displays the top ten PB, PV, ARGs, and VFs, which are ranked by their average abundance during the specified time period. For PB and PV, relative abundance (percentage) is applied, and for ARGs and VFs, copy number per 1,000 genomes is applied as abundance. In total, 40 words are shown in each cloud. Term size represents the pathogen's relative abundance value. Transforming complex microbial data into intuitive visualizations helps users quickly identify high-risk pathogens. This approach overcomes the limitations of static charts in traditional microbiological research by revealing spatial-abundance correlations. Users can click on terms to display the corresponding distribution regions of the BRFs on the map (e.g., Pseudomonas mendocina in Fig. 1). Heat maps use color gradients to show relative abundance levels in a global distribution (e.g., at Pearl River Estuary during 2016–2024 and the Delaware Bay during 2010–2015 in Fig. 1).
Figure 1.
A screenshot showing the website's homepage maps and word clouds. Upon clicking a specific BRF entry, the map on the left displays its abundance distribution across six coastal regions worldwide within the specified year range, represented by different colors.
The purpose of illustrating two timeframes on the home page is to show the average of pathogen distributions in recent (timeframe 2016–2024) and longer past (timeframe 2010–2015) years. However, because of the scarcity of data in the current version of CWPD, users should not conduct a temporal comparison between heatmaps or word clouds of these two timeframes. In future releases, the periods of these two timeframes will be updated as data grow, and such an illustration will eventually be valuable to show temporal shifts.
Users can click 'Enter' on the map to access the page of a specific coastal region. This page shows abundance maps of PB, PV, ARGs, and VFs in the coastal region with stacked bar charts (Fig. 2). Users can explore the geographic distribution of pathogens within this area in a given year by hovering over the heat map or clicking to activate the bar chart (e.g. the relative abundance 1.636% of Pseudomonas oleovorans at the Pearl River Estuary in 2016 as shown in Fig. 2).
Figure 2.
BRF distribution bar chart. When the user hovers the mouse over the bar representing a specific pathogen, the annual average abundance of top pathogens is shown as the size of dots with their geographic distribution on the map of a specific coastal region.
Data search
-
Upon entering the 'Search' interface of the system, users can locate pathogen information using one of two methods. The first method involves selecting either 'Location' (Fig. 3a) or 'Pathogen' (Fig. 3b), and then choosing the corresponding category for that species. Pressing the Enter key will retrieve relevant information. The second method requires selecting a type, entering the specific name in the input field, and clicking the Search button.
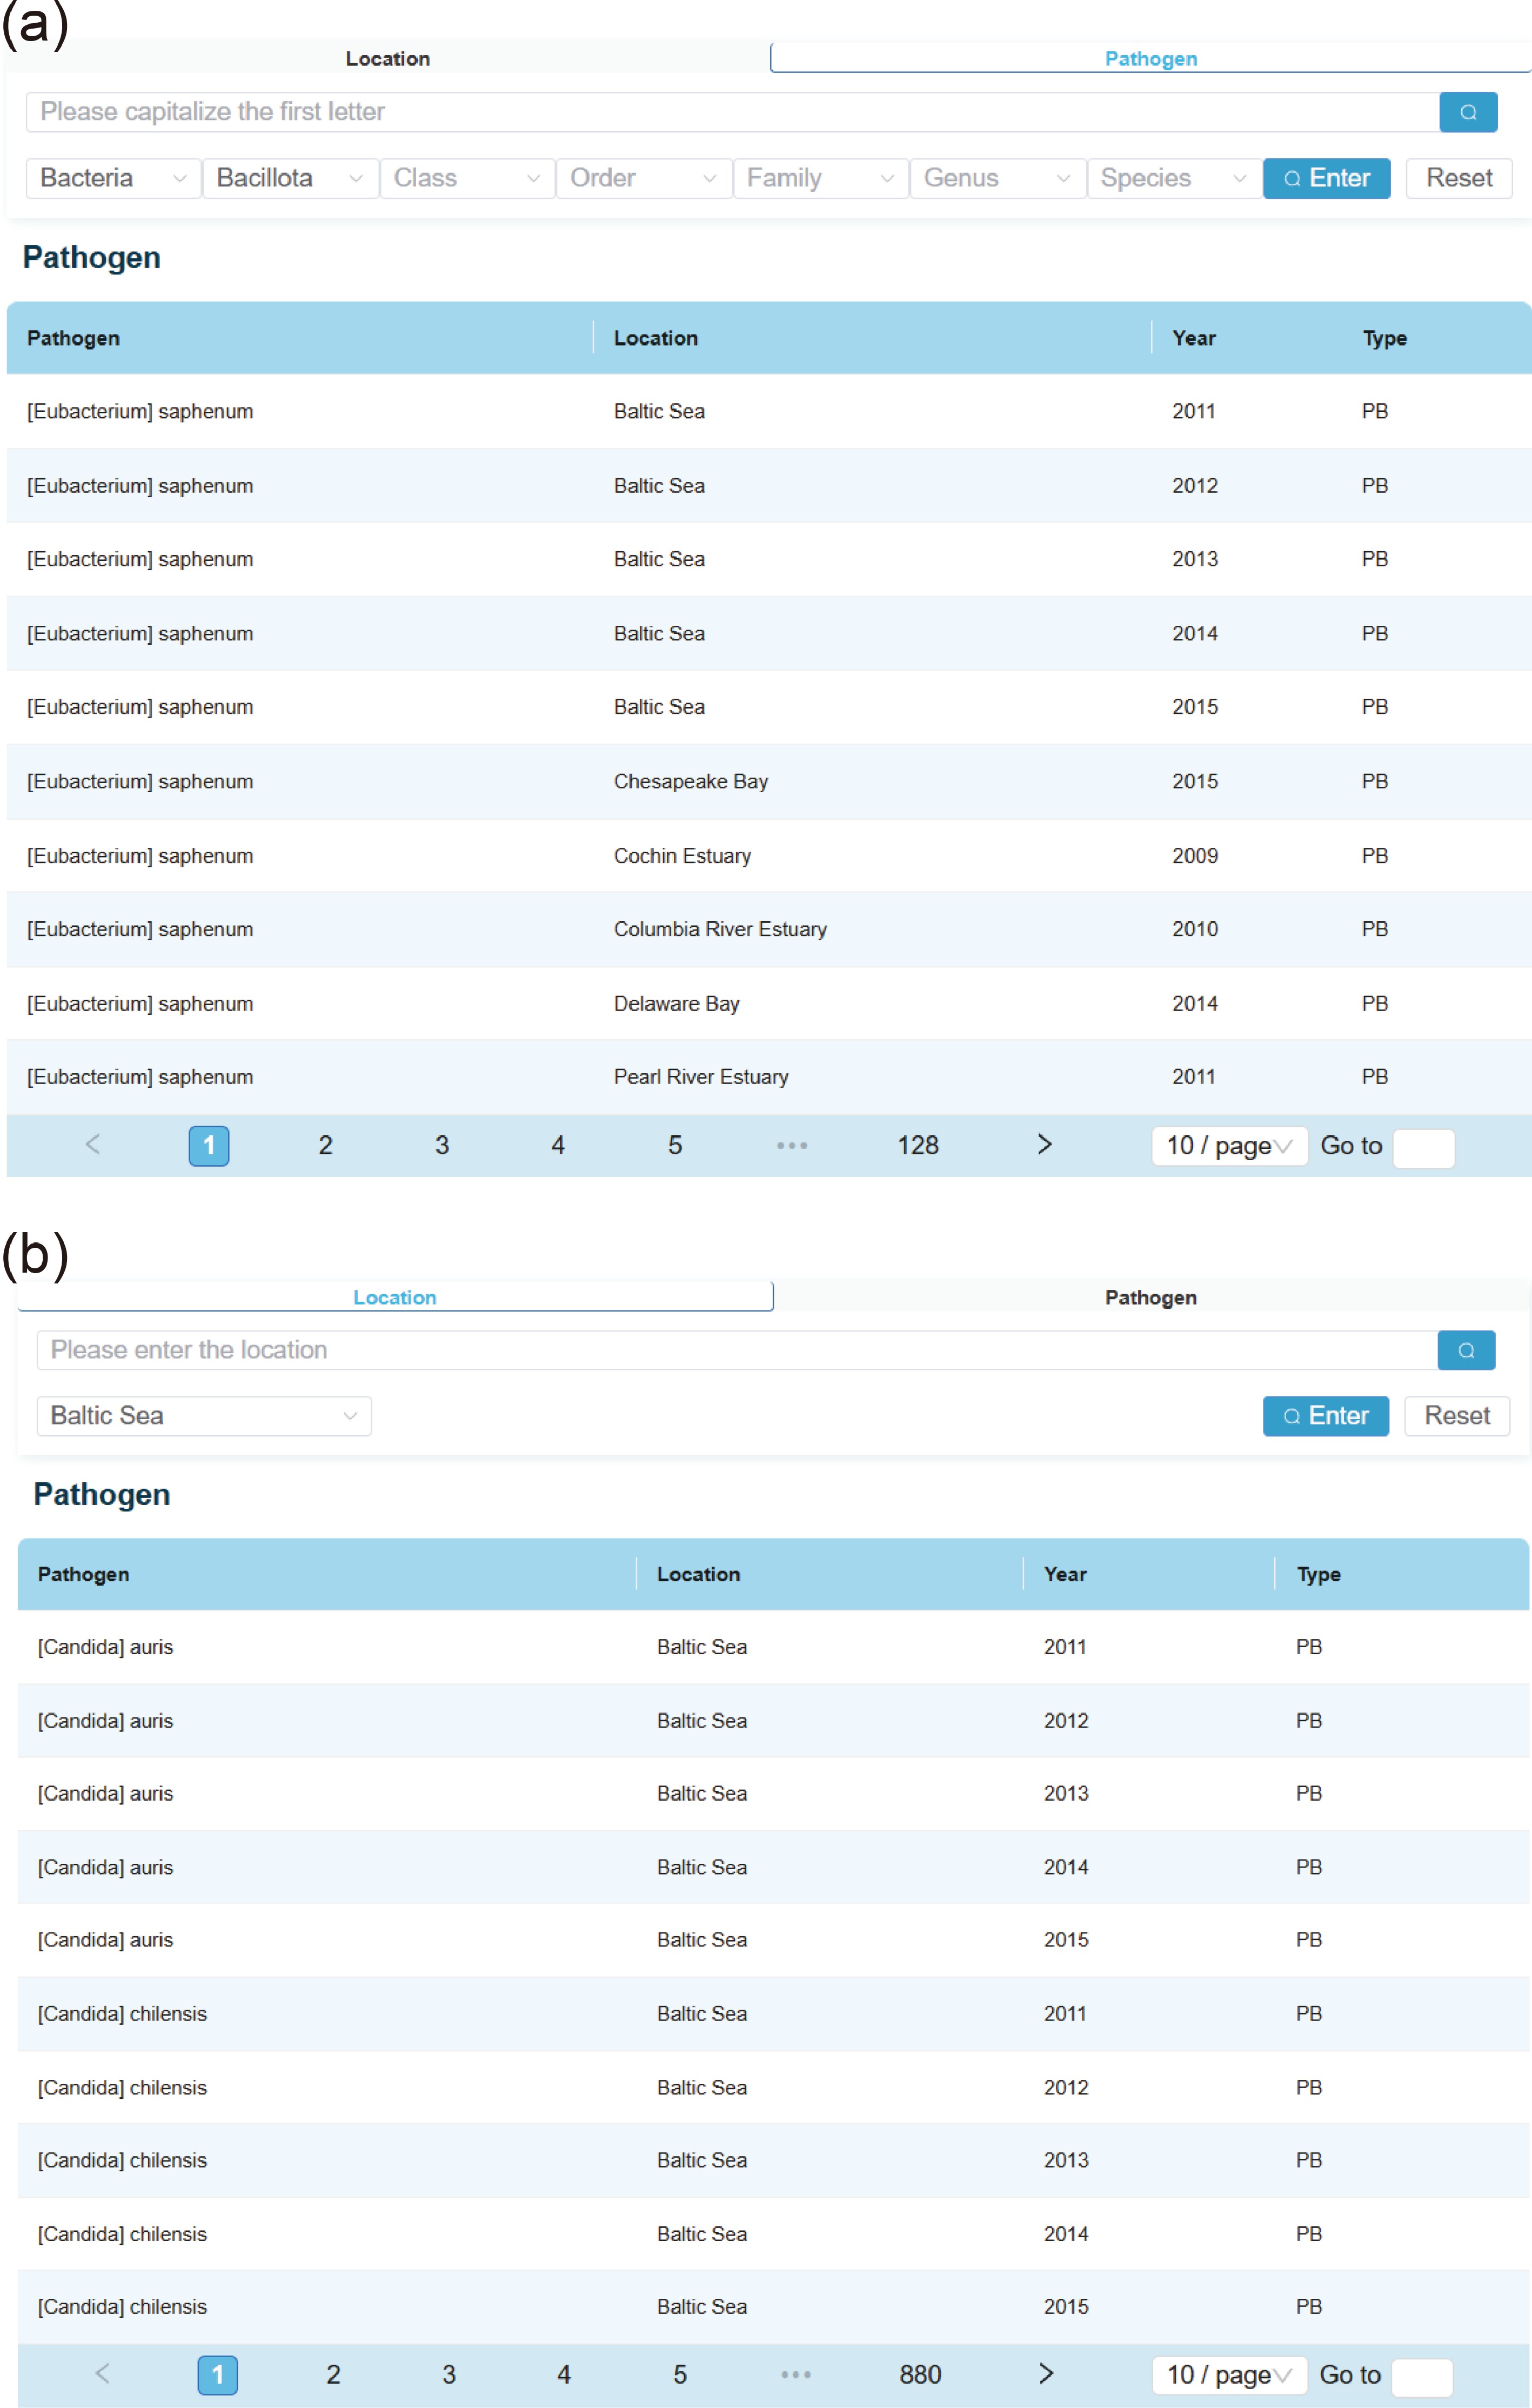
Figure 3.
Example of search results by (a) pathogens or (b) coastal regions. The names, locations, years, and types of certain pathogens are shown in the listed table.
Online annotation for metagenomic samples uploaded by users
-
The primary design philosophy of the CWPD online annotation service is to bridge the gap between complex raw metagenomic data and interpretable biological insights for researchers who may lack advanced bioinformatics expertise or computational resources. Unlike standalone tools that require manual environment configuration, CWPD offers a 'One-stop Solution' from raw Illumina paired-end reads to visualization and structured reports with the integration of the full analysis chain. Currently, we have dedicated over 700 CPUs to the analysis server, with 32 CPUs allocated per individual task to ensure fast processing. The server system supports up to 24 tasks simultaneously. For a common environmental metagenomic sample (approximately 10 GB of raw sequencing data), the average turnaround time from upload to result delivery is approximately 12 h. This timeframe includes quality control, assembly, and BRF annotation (i.e., pathogens, ARGs, and VFs).
After registering and logging in, users can upload metagenomic raw data in FastQ format for analysis (Fig. 4a). Once the data has been successfully uploaded, the platform server will perform bioinformatic analyses and output the composition of microorganisms, PB, PV, ARGs, and VFs. Users receive email notifications when the analyses are complete. Results can be viewed by logging into the website (Fig. 4b).
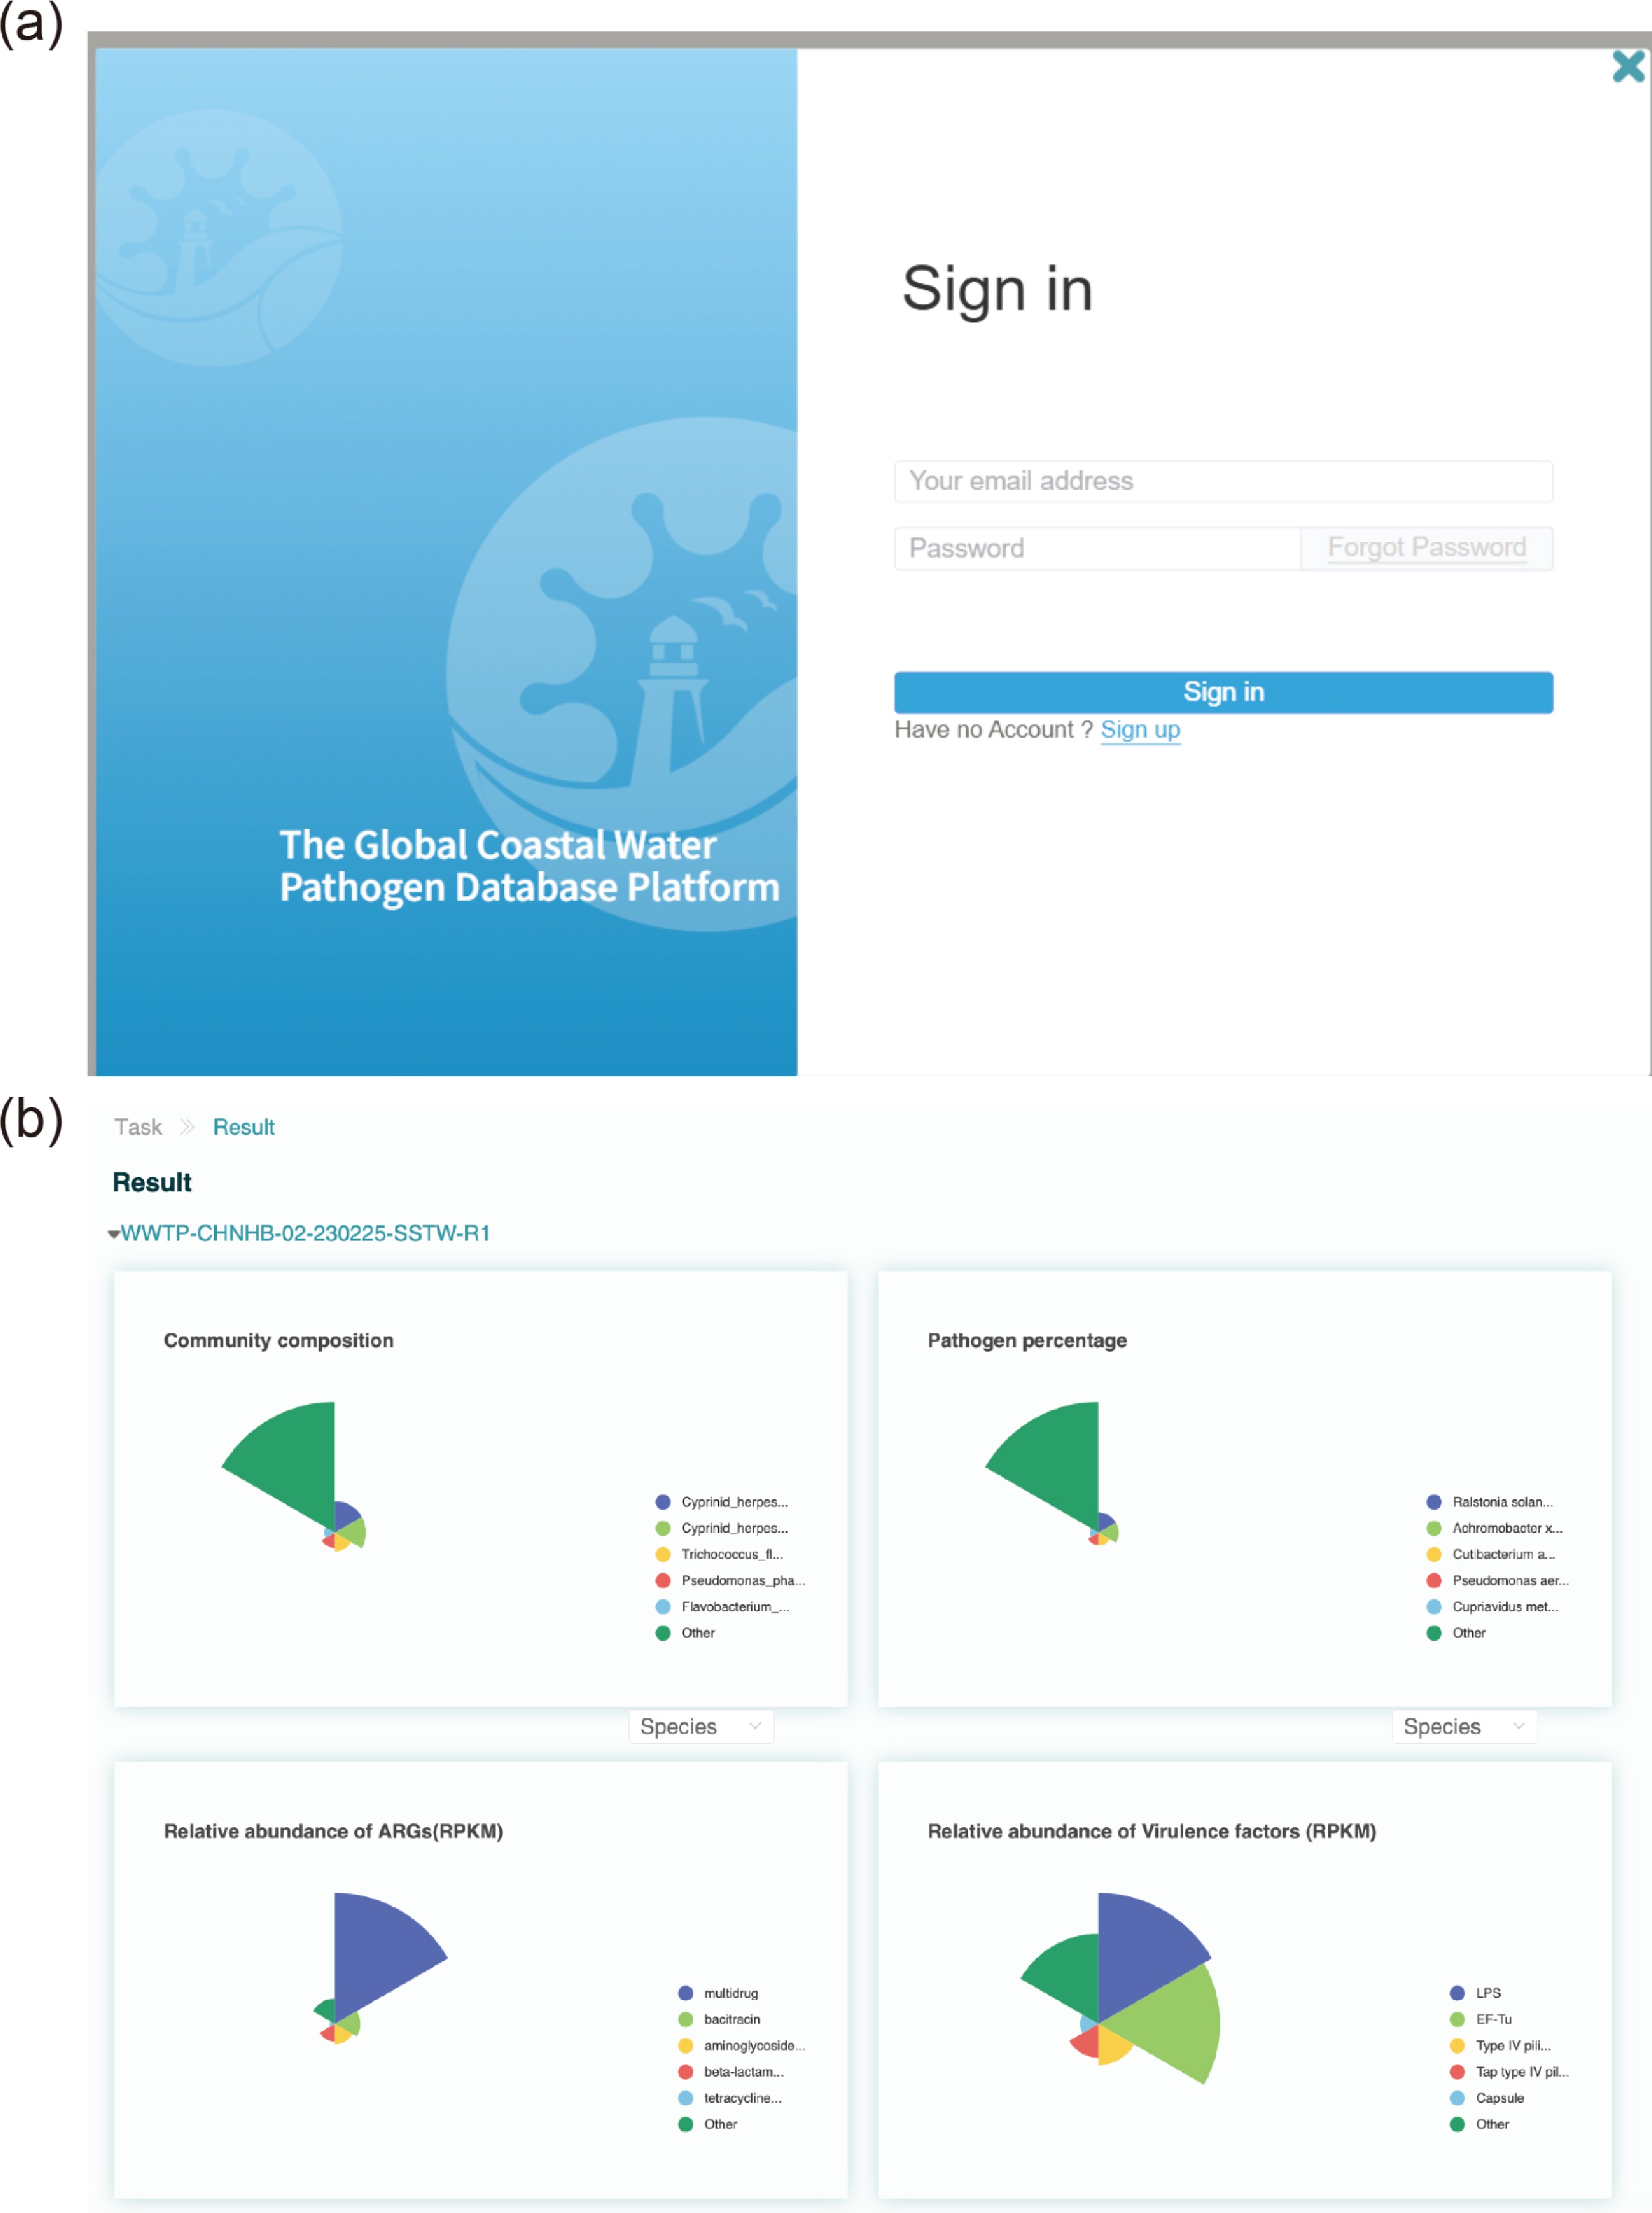
Figure 4.
User login interface and an example of analysis results of the online annotation pipeline. (a) In the login interface, new users can sign up using their email addresses. (b) The community composition, pathogen composition, ARG composition, and VF composition of the analyzed metagenomic sample are shown in the report.
Help page introduction
-
Detailed documentation and tutorials help new users quickly learn how to use the platform's features. A statement on data usage policy, confidentiality, and compliance with ethical guidelines is also provided in the guidance. The comment system allows users to provide feedback, which will drive the continuous optimization of the platform.
Scalability of the platform architecture
-
The system provides comprehensive metadata management capabilities and supports the renaming and re-editing of uploaded samples. These features effectively enhance the flexibility and manageability of data resources. In terms of system integration, the platform has a modular design. It can integrate partner information modules through API interfaces and supports OpenID authentication. This enables seamless connectivity and interaction with external systems. However, no specific external systems or third-party data sources are currently tuned for native support at this initial stage of development. We have prioritized maintaining a flexible framework to ensure the platform can eventually interface with diverse ecological and clinical databases without being restricted by early-stage hard-coding for specific external platforms. The system also incorporates a dynamic rendering engine that refreshes visualization components, such as word clouds, based on real-time data sources. This ensures the intuitive display of the latest data status. These functionalities demonstrate the system's technical advantages in scalability, compatibility, and real-time responsiveness. Finally, the database is designed to be updated continuously as new high-depth shotgun metagenomic data become available in public repositories.
-
The CWPD addresses the lack of databases on the temporal and spatial distribution of pathogenic microorganisms in coastal waters. It is a valuable resource for exploring potential biological risks in aquatic ecosystems. Compared to other similar databases, the CWPD stands out for its comprehensive data integration and unique design (Table 2). While previous databases have focused on specific disciplines, such as aquaculture pathogens or clinical bacterial isolates, CWPD is the first to integrate bacteria, viruses, and fungi with functional risk factors (ARGs and VFs) in a GIS-based temporal framework. This multidimensional approach is essential for understanding coastal environments within the 'One Health' framework, where pathogens of diverse taxonomic origins often co-occur and interact. The target users of CWPD include environmental scientists and public health policymakers involved in coastal management. For example, researchers can use the website's annotation tools to analyze samples alongside geographic and hydrological information. This allows them to track specific pathogen transmission patterns[3,33]. Similarly, a regional government agency could use a multi-year dynamic visualization to review changes in the composition and spatial distribution of ARGs in densely populated estuaries, such as the Pearl River Estuary, and assess the potential impact of adjusting policies that restrict antibiotic use in aquaculture.
In clinical metagenomic next-generation sequencing, pathogen detection is routinely scrutinized for specificity because spurious classifications can hinder diagnosis[34]. False-positive signals can stem from imperfect alignment specificity and multi-mapping; conserved/repetitive regions; low-complexity sequences and low-complexity/short reads; index-hopping/cross-talk; reagent and laboratory contamination; database contamination/misannotation; sample cross-contamination; PCR/sequencing errors; and downstream bioinformatic misclassification. Although clinical laboratories are moving toward validation frameworks, broadly accepted, portable standards for declaring a pathogen 'present' (especially in environmental metagenomes) are still limited. In this study, we used MegaPath's default, specificity-oriented filtration—yet explicit per-taxon 'positivity' cutoffs (e.g., minimum uniquely assigned reads, or minimum genome breadth/depth) are unspecified. Future work will therefore add conservative, control- and genome-distribution-aware filters, etc., to further ensure the detection specificity.
Currently, the CWPD has limited data coverage. As the current iteration of CWPD prioritizes high-depth metagenomic datasets (minimum 10 GB) to ensure the reliability of pathogen detection and functional annotation, the included 158 samples, at the time of our data collection on Feb 2, 2024, represent only a fraction of global diversity, leading to potential geographic biases. Nevertheless, this work represents 'Version 1.0' of CWPD, focusing on major, well-studied estuarine systems (e.g., Pearl River, Columbia River) as a proof-of-concept for our GIS-integrated framework. We note the recent growth in coastal metagenomic data, especially in region-specific databases such as MASH-Ocean[35]. To ensure the relevance of our findings, the database will implement a semi-annual update cycle (every 6 months) to incorporate the latest high-depth metagenomic datasets from global repositories. Our primary expansion priority focuses on coastal regions with high population densities, such as the Pearl River Delta, the Ganges-Brahmaputra Delta, and industrialized European coastlines, where the intersection of human activity and environmental change creates significant biosafety risks, but also on underrepresented regions in Africa and South America to strengthen the global relevance of CWPD.
Moreover, future releases of CWPD will include more coastal environments and integrate upstream rivers, lakes, and downstream coastal data. These areas are often influenced by human activities and become hotspots for pathogen transmission and the accumulation of ARGs. This approach will enable a more comprehensive understanding of BRF distribution[1]. Sampling should also be conducted in typical nearshore environments, such as wetland mangroves, aquaculture farms, and discharge points for domestic and industrial wastewater, as well as in ports and coral reefs. During sampling, it is essential to record environmental parameters, including water temperature, pH, dissolved oxygen, salinity, pollutant concentrations, and flow characteristics. Supplementing these data helps researchers uncover the spatiotemporal distribution patterns of BRFs and enables further analysis of their relationships with environmental factors. Such comprehensive approaches will provide deeper insights into transmission patterns and potential ecological impacts of coastal pathogens.
The temporal dimension of CWPD records is essential for analyzing long-term trends in pathogen transmission. However, a robust quantitative comparison between environmental pathogen abundance and clinical infection rates is currently constrained by the lack of high-frequency temporal sampling. With more datasets included in future versions, the database may allow for the prediction of pathogen migration and evolutionary pathways in aquatic environments and the assessment of disease outbreak risks. Integrating temporal dynamics and spatial distribution analysis will foster a more comprehensive understanding of pathogen transmission patterns across diverse aquatic ecosystems. This understanding will provide the scientific foundation for regional and global disease control policies[36].
The long-term success of the CWPD depends on its ability to interoperate with other databases and monitoring networks. We are currently developing standardized APIs to enable real-time connectivity with public health surveillance systems and livestock epidemiological data. This will allow researchers to more accurately predict pathogen transmission pathways and support the calculation of composite health indicators, such as the Human Health Outcome Index and the Aquatic Animal Health Risk Index. Through these integrated efforts, CWPD aims to become a foundational resource for the 'One Health' mission, promoting sustainable water resource management and global pandemic preparedness[24].
Computation in this study was supported by the Centre for Computational Science and Engineering at the Southern University of Science and Technology. Development of the CWPD System was supported by Shenzhen Zhishu Environmental Technology Co.
-
During the preparation of this work, the authors used Gemini Thinking (version 3, https://gemini.google.com/app), ChatGPT Thinking (version 5.4, https://chatgpt.com/), and DeepSeek (version 671B, www.deepseek.com/) for literature study, and DeepL Writing (version 25.8, www.deepl.com/en) for language refinement. The authors reviewed and edited all content produced with the assistance of this tool, verified its accuracy, and take full responsibility for the integrity and originality of the final manuscript. This work represents the authors' own intellectual contribution, and no AI tool is credited as an author.
-
The authors confirm their contributions to the paper as follows: Shangheng Song: methodology, validation, formal analysis, investigation, data curation, writing – original draft. Zelin Lei: methodology, formal analysis, investigation, data curation, writing – original draft. Yuan Feng: methodology, investigation. Wenxiu Wang: methodology, software. Fang Huang: resources. Yanmei Zhao: resources. Jiping Jiang: software, visualization. Mengqi Sun: resources, data curation, funding acquisition. Ai-Jie Wang: funding acquisition, supervision. Shu-Hong Gao: conceptualization, writing – review and editing, funding acquisition. Marwan Majzoub: writing – review and editing, funding acquisition. Lu Fan: conceptualization, methodology, writing – review and editing, supervision, project administration, funding acquisition. All authors reviewed the results and approved the final version of the manuscript.
-
The data that support the findings of this study are available at https://gcwpd.sustech.edu.cn.
-
This work was supported by the National Natural Science Foundation of China (Grant Nos 42376113 LF, 52321005 AJW, 42206122 MS, and 52293441 SHG), the Shenzhen Key Laboratory of Marine Archaea Geo-Omics, Southern University of Science and Technology (Grant No. SYSPG20241211173725010 LF), the Basic and Applied Basic Research Foundation of Guangdong Province (Grant Nos 2021B1515120080 LF and 2024A1515010085 SHG), Shenzhen Science and Technology Program (Grant Nos GXWD20231127195344001 AJW and JCYJ20241202123735045 SHG), and the Open Project of Key Laboratory of Environmental Biotechnology, CAS (Grant No. KF2021006 AJW and LF).
-
The authors declare that they have no known competing financial interests or personal relationships that could have appeared to influence the work reported in this paper.
-
# Authors contributed equally: Shangheng Song, Zelin Lei, Yuan Feng, Wenxiu Wang
Full list of author information is available at the end of the article. - The supplementary files can be downloaded from here.
- Copyright: © 2026 by the author(s). Published by Maximum Academic Press, Fayetteville, GA. This article is an open access article distributed under Creative Commons Attribution License (CC BY 4.0), visit https://creativecommons.org/licenses/by/4.0/.
-
About this article
Cite this article
Song S, Lei Z, Feng Y, Wang W, Huang F, et al. 2026. Coastal Water Pathogen Database profiles pathogenic microorganisms in coastal environments. Biocontaminant 2: e009 doi: 10.48130/biocontam-0026-0006 

Coastal Water Pathogen Database profiles pathogenic microorganisms in coastal environments
- Received: 21 January 2026
- Revised: 30 March 2026
- Accepted: 21 April 2026
- Published online: 01 May 2026
Abstract: Pathogenic microorganisms in coastal environments pose significant risks to public health and global biosafety, yet their distribution patterns remain insufficiently characterized on a global scale. We developed the Coastal Water Pathogen Database (CWPD), a comprehensive, open-access platform that integrates metagenomic sequences from diverse coastal environments to profile pathogenic bacteria, viruses, and fungi alongside antibiotic resistance genes (ARGs) and virulence factors (VFs). CWPD contains pathogen information from 158 samples from six coastal environments on three continents from 2010 to 2019. A map-based home page interface provides a quick overview of the global distribution of the most abundant pathogens, and region-specific maps can be navigated for detailed visualization. The website of CWPD includes an online analysis module for user-uploaded metagenomic data, facilitating rapid biological risk assessment. Finally, the database structure is designed with standard protocols for easy interfacing with other databases. CWPD serves as a vital resource for interdisciplinary studies in environmental microbiology, public health, and the One Health framework, providing technical support for pandemic preparedness and coastal ecosystem management.
-
Key words:
- Pathogen /
- Coastal environment /
- Antibiotic resistance genes /
- Biological risk factors /
- Metagenome