


-
As a vital economic crop cultivated worldwide, the tea plant (Camellia sinensis) undergoes leaf harvesting for subsequent manufacturing of tea products, forming a solid industrial foundation[1,2]. Tea is a healthy beverage because its leaves are rich in secondary metabolites like caffeine and theanine[3,4]. The Baojing Huangjincha (BJHJC) is a rare tea plant variety and a key industry for rural revitalization in Hunan Province. It is characterized by its high amino acid content, the emerald green color of its dry tea leaves, sweet aftertaste, and a theanine content that is 1.5–3 times higher than that of common tea plants[5]. Theanine, the dominant amino acid in tea plants, accounts for over 50% of the total free amino acid content in immature tea leaf tissues[6]. It offers numerous health benefits, including neuroprotection, immune system enhancement, and cardiovascular disease prevention[5]. However, the optimal harvesting period of tea is limited to a short duration from early spring to late spring. During this period, theanine content significantly declines, resulting in compromised tea quality and substantial economic losses for tea plantations[6]. Therefore, keeping a high theanine content in BJHJC is an important means to improve the economic benefits of spring tea.
Theanine is biosynthesized from glutamic acid (Glu) and ethylamine in the roots, catalyzed by the enzyme theanine synthetase (CsTSI). Subsequently, it is translocated from the stem to the leaves for storage and degradation[7,8]. Environmental factors, including light and temperature, exert an influence on its synthesis and decomposition and regulate key genes involved in its biosynthesis including CsTSI, glutamate dehydrogenase (CsGDHs), glutamine synthetase (CsGSs), arginine decarboxylating oxidase (CsADC), and alanine decarboxylase (CsAlaDC)[9,10].
Light serves as a crucial environmental cue that regulates the synthesis of plant metabolites[11]. Red and blue light constitute plants' primary effective spectrum for photosynthesis and photomorphogenesis, making it the predominant light source for light-emitting diodes (LEDs)[12,13]. Photomorphic responses are initiated by three chromoprotein groups: UV-A, UV-A–blue-activated cryptochrome (CRY)–phototropin (PHOT) systems regulating phototropism, and R/FR-sensing phytochromes (PHYs) modulating shade avoidance through phytochrome-interacting factor (PIF)-mediated signaling cascades[14,15]. The activation of these photoreceptors can affect the stability of key transcription factors, such as elongation hypocotyl 5 (HY5), a key factor promoting photomorphogenesis[16]. The constitutive photomorphogenic 1 (COP1)–suppressor of phytochrome a 1 (SPA1) heteromeric complex in the darkness functions as a negative regulatory node in photomorphogenic signaling cascades, mediating ubiquitin-dependent inactivation of positive regulators such as the HY5 transcription factor[17]. Plant growth factors regulate downstream genes, either positively or negatively, impacting different facets of plant growth and development.
Light is a crucial environmental factor regulating the growth and development of tea plants and the accumulation of secondary metabolites[18]. Research indicates that blue light promotes the expression of photomorphogenesis-related genes (e.g., HY5, R2R3-MYBs) by activating photoreceptors such as CRY2/3 and PHOT2, thereby regulating the synthesis of flavonoids. UV-B radiation can also upregulate the expression of photoreceptor genes, promoting flavonoid accumulation. Conversely, green light attenuates the inductive effects of blue light by suppressing the expression of PHOT2. Red light treatment downregulates some structural genes involved in flavonoid biosynthesis (e.g., CsPAL, Cs4CL) and upregulates CsMYB4, leading to the suppression of flavonoid accumulation[19−21]. Under red light treatment, the net photosynthetic rate (Pn), stomatal conductance (Gs), intercellular CO2 concentration (Ci), and transpiration rate (Tr) of tea plants are superior to those under other types of light. Additionally, the contents of photosynthetic pigments like chlorophyll a and chlorophyll b are higher in tea leaves. This enhancement is likely achieved by activating genes such as CsPHYB1, thereby strengthening the reception and transmission of light signals and, consequently, improving photosynthetic efficiency[22]. Both blue light and UV-A can influence histone methylation. CsSDG36, a histone H3K4 methyltransferase, increases the expression of the stomatal density-related gene CsEPFL9 when overexpressed under blue light. Under UV-A, overexpression of CsSDG36 promotes the expression of the chlorophyll biosynthesis-related genes CsHEMA2 and CsPORC[23]. Chang et al. demonstrated that compared with dark conditions, light treatment reduces theanine content, because light upregulates CsHY5 expression, which, in turn, promotes CsGGT2 expression, leading to increased theanine degradation and, consequently, lower theanine content[24]. However, other studies have shown that when artificial light reaches a photosynthetic photon flux density (PPFD) of 100 μmol/m2/s with a red-to-blue light ratio of 1:3, the amino acid and theanine content in tea leaves is relatively high[25]. This indicates that light also exerts a significant influence on theanine content, but the underlying mechanisms remain incompletely understood. Different light ratios also affect substance metabolism in tea plants. Zhang et al. demonstrated that the synergistic effect of red light combined with blue light, far-red light, and yellow light significantly enhances photosynthetic efficiency in the 'Zhongcha 108' cultivar, and this improvement is likely achieved by enhancing the efficiency of the Photosystem II (PSII) reaction center, thereby increasing the efficiency of light energy utilization[26]. Prior research has demonstrated the regulatory role of light in the metabolism of tea plants.
Nevertheless, the patterns and mechanisms of light's regulation of theanine metabolism remain unclear. Our study employed various types of light (blue, red, and white) and different red and blue light ratios to treat BJHJC. It aimed to investigate how red and blue light treatments influenced the growth, development, and theanine content of BJHJC, and the mechanism of the light treatments on theanine was analyzed using transcriptome techniques. This analysis provides an effective method to sustain high theanine levels in spring tea, enhancing the economic value of BJHJC to meet the market's needs.
-
The experimental material selected was 1-year-old 'Baojing Huangjincha 1', provided by Huangjin Village, Baojing County, Hunan Province, China (28°26'41.96" N, 109°46'34.87" E). The specimens were maintained under a regimen with a controlled photoperiod (12 h light/dark) for 30 d with white LED illumination delivering 150 μmol/m2/s as part of the acclimation process. The humidity and temperature in the plant optics laboratory were maintained at 70 ± 5% and 20 ± 5 °C, respectively. We maintained a consistent light intensity by keeping the light source 20–30 cm away from the plant. After 30 d, the tea seedlings were transferred to grow under blue light (T1, peak at 430 nm), red light (T2, peak at 630 nm), blue : red = 2:1 (T3, R1B2), and red : blue = 2:1 (T4, R2B1) LEDs for 30 d; white light (CK) was used as the control group (Fig. 1) The LEDs were provided by Dongguan Ledstar Optoelectronic Technology Co., Ltd. (T5-fluorescent tubes, 18 W), the light period was 12 h/d, the intensity was 150 μmol/m2/s, and other environmental factors remained unchanged. Then fresh samples of one bud and two leaves were sampled and stored at −80 °C, and each group was sampled three times.
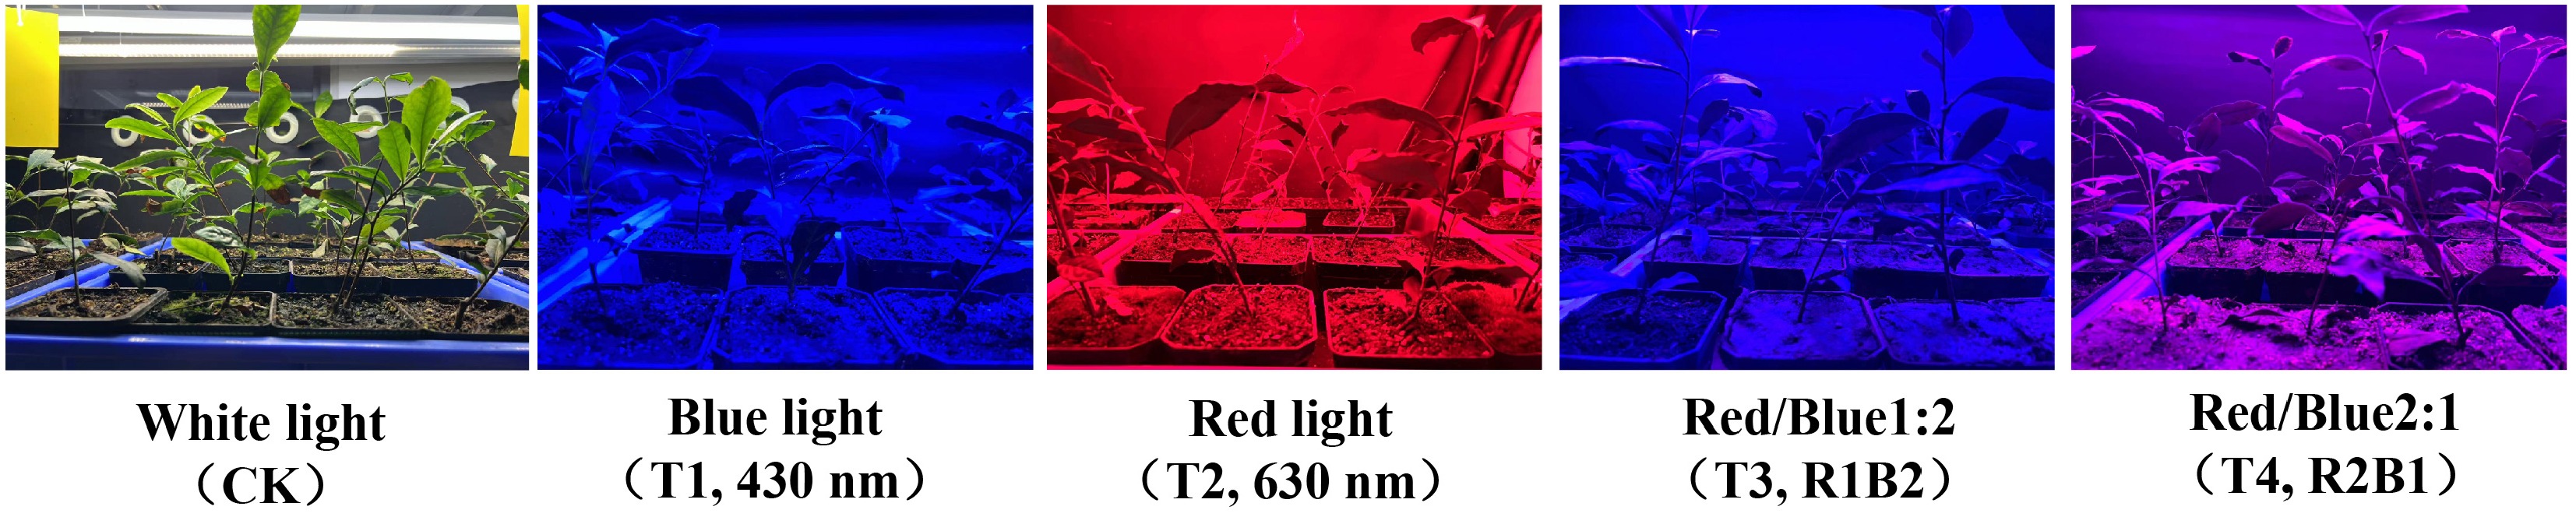
Figure 1.
Tea seedlings illuminated by LED light.
Determination of shoot length
-
After 30 d, the length of new shoots was measured using a metric scale that is accurate to 0.1 cm, spanning from the bud to the second leaf at the base[27].
Determination of photosynthetic pigments
-
Fresh tea leaves were weighed (0.200 g) and placed in an extraction solution (acetone–ethanol mixture). The samples were extracted in the dark at room temperature for 8 hours and then centrifuged. Using the extraction solution as the reference blank, absorbance was measured at 645, 663, and 440 nm using a microplate reader (Infinite® 200 PRO, Tecan). The contents of chlorophyll a, chlorophyll b, total chlorophyll, and carotenoid were calculated according to Arnon's equations[28].
Determination of chlorophyll fluorescence parameters
-
Three tea seedlings were selected from each treatment group as the samples for determining chlorophyll fluorescence parameters, using a portable fluorometer (FluorPen FP 100, Photon System Instruments, Ltd, Czech Republic) to measure the leaves of the seedlings. After 10 minutes of dark adaptation, the chlorophyll fluorescence parameters were determined[29]. Each parameter was measured in triplicate, and the mean value was utilized for analysis.
$ \mathit{\rm{\mathit{F}}v}=\mathit{F_M}-\mathit{F_0} $ $ \mathit{\mathit{\mathit{\mathit{\mathit{\mathit{\rm{\mathit{q}}}}}P}}}=(\mathit{F_M}-\mathit{Fs})/\mathit{Fv} $ $ \rm{\mathit{R}}=\mathit{Fv}/\mathit{F\mathit{_M}} $ where, qP represents photochemical quenching, ф PS II is the actual photosynthetic efficiency, NPQ is nonphotochemical quenching, variable fluorescence (Fv) is variable fluorescence, and R is the maximum photosynthetic efficiency of PS II.
Determination of theanine and free amino acid contents
-
A total of 20 amino acids, including theanine, were extracted as described previously[30]. First, the leaves were freeze-dried at –80 °C and ground into powder. Next, 2.5 g of the powder were accurately weighed before the addition of 4% sulfosalicylic acid to conduct ultrasonic extraction. The supernatant was filtered through a 0.22 μm membrane and analyzed using a high-speed fully automatic amino acid analyzer (Hitachi, LA8080, Japan)[31]. The total free amino acid content was determined by summing the concentration of each individual free amino acid.
Transcriptome sequencing and gene expression profiling
-
Tea seedlings treated with different light conditions for 30 d were selected, and one bud and two leaves were collected, then immediately immersed in liquid nitrogen at −80 °C for flash-freezing for analysis. Total RNA was extracted from each sample using the OmniPlant RNA Kit (DNase I) (KW Biotech, China). Following cDNA library construction, raw data were collected and analyzed via Illumina paired-end sequencing on the Illumina Hi-Seq 4000 platform at MWDB (Met Ware Biological Science and Technology Co., Ltd., Wuhan, China).
Cleaned reads were obtained and aligned to the Camellia sinensis 'Shuchazao' reference genome[32], then sequence alignment was performed using HISAT2[33]. Analysis of differentially expressed genes (DEGs) among the five light treatment groups was performed using DESeq (DEvanced Estimation of sEpression). Gene Ontology (GO) enrichment analysis of the DEGs was conducted using GOseq. Statistical enrichment of differentially expressed genes in Kyoto Encyclopedia of Genes and Genomes (KEGG) pathways was analyzed using KOBAS 2.0 software. The WGCNA package (v1.72.5) in R software (v4.3.2) was used to construct a weighted gene co-expression network. Cytoscape (version 3.10.3) was then employed to visualize the gene networks within the modules. The transcriptomic data are presented in Supplementary Table S1.
Real-time quantitative polymerase chain reaction analysis
-
Eight representative differentially expressed genes were selected for a quantitative real-time polymerase chain reaction (qRT-PCR) assay to validate the expression of DEGs identified by RNA sequencing. CsGAPDH was used as the reference gene. Primers for these eight genes and the reference gene were designed online using primer3.0. Total RNA was extracted using the RNA Isolater Total RNA Extraction Reagent (Vazyme, China) according to the manufacturer's instructions. The synthesis of the first-strand cDNA was performed using HiScript®II Q RT SuperMix for qPCR (+gDNA wiper) (Vazyme, China). The relative transcript levels were then calculated via the 2−ΔΔCᴛ method[34]. Gene-specific primers designed for qRT-PCR amplification are listed in Supplementary Table S2.
Statistical analysis
-
Statistical analyses were performed through analysis of variance (ANOVA) combined with Duncan's post hoc comparative testing implemented in SPSS (v19.0) platform. Transcriptomic data processing was executed with R software (
www.r-project.org ) and with online sharing software (https://cloud.metware.cn )[35]. -
Under various light conditions, the growth patterns and leaf color of BJHJC showed significant differences (Fig. 2a). The study indicates that compared with the CK treatment, all other treatments demonstrated a substantial increase in leaf length, with the T1 and T3 treatments exhibiting the most pronounced effects (Fig. 2b). Regarding changes in leaf width, the T3 and T4 treatments led to increased leaf width, which was not significantly related to the red–blue light ratio but was greater than that under monochromatic light treatments (Fig. 2c). Therefore, blue light treatment enhances the elongation of buds and leaves in tea seedlings, though it may result in a slight reduction in leaf area, whereas red light can significantly boost leaf width. Meanwhile, leaves appeared light green under blue light and dark green under red light, which may be related to the chlorophyll content.
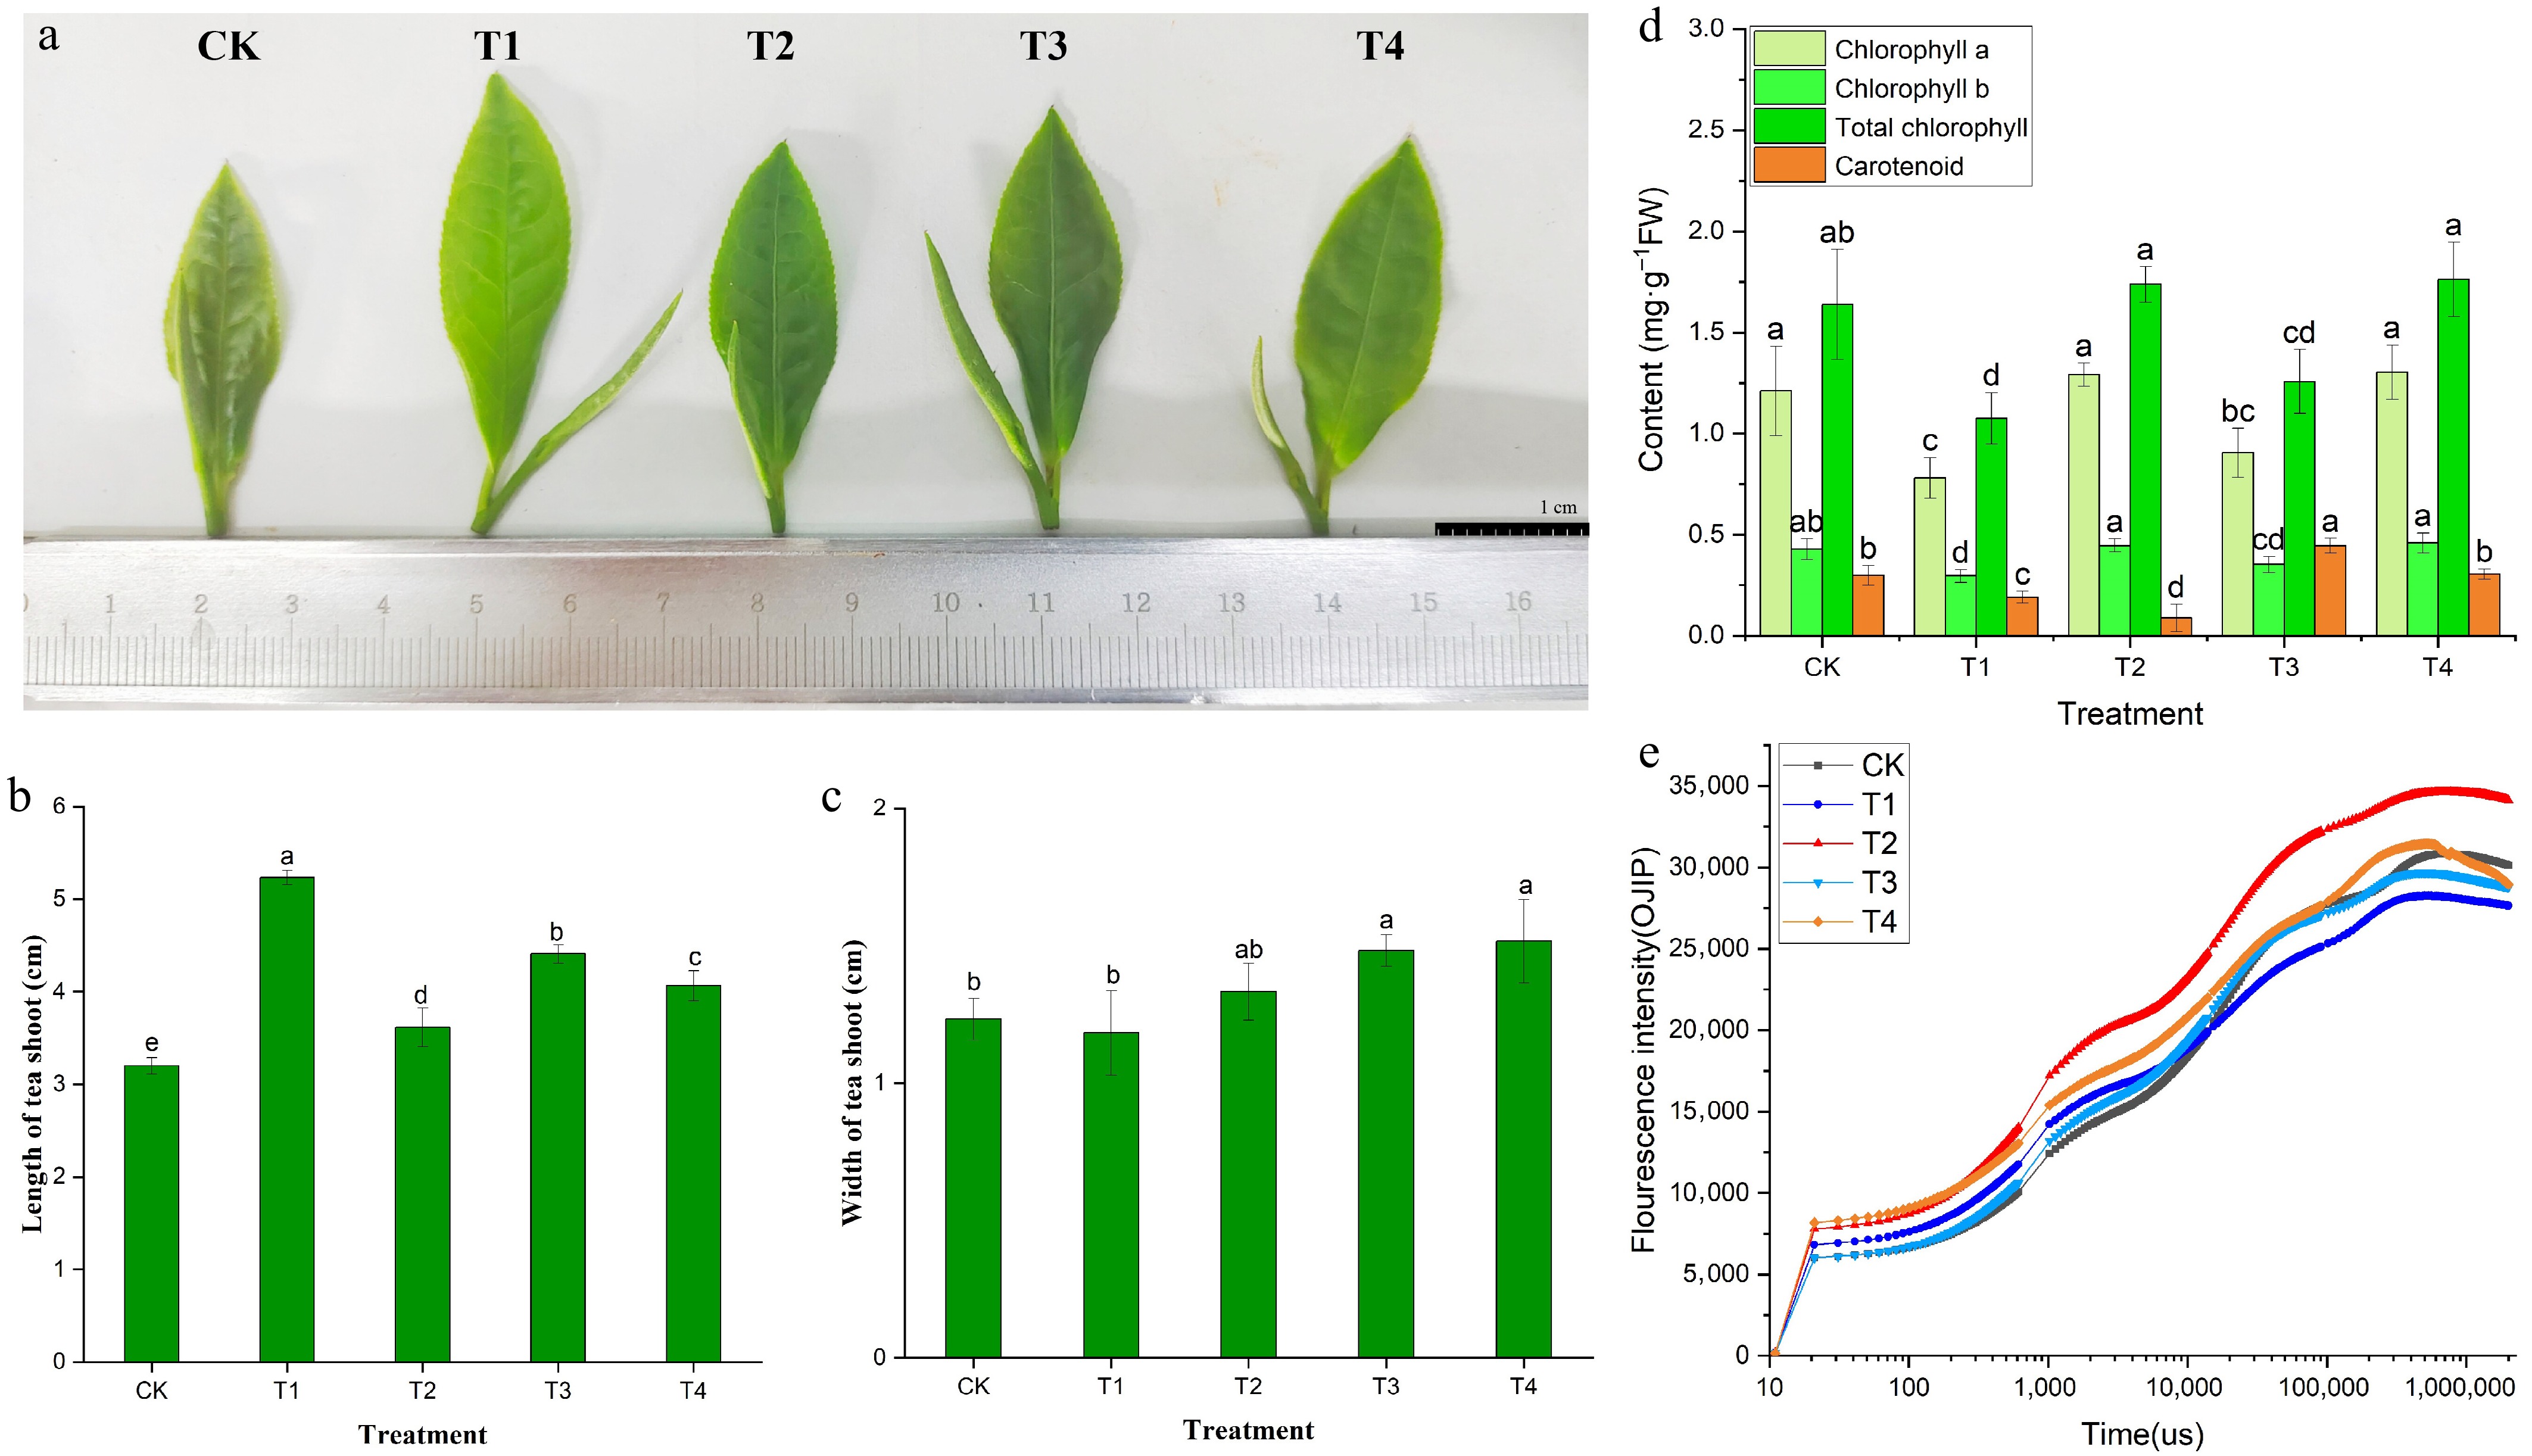
Figure 2.
Leaf color phenotype (a), bud growth (b, c), photosynthetic pigment content (d), and OJIP curve (e) of BJHJC leaves under different light treatments. Different letters represent significant differences between groups (p < 0.05).
Quantification of the photopigments revealed marked increases in total chlorophyll content and its chlorophyll a/b components across red-dominated spectral treatments relative to the CK (p < 0.05), with particularly pronounced enhancement under elevated red light ratios. The T2 and T4 treatments (with a high proportion of red light) exhibited the highest chlorophyll content (Fig. 2d). Conversely, it was observed that the overall content of photosynthetic pigments under the T1 treatment was lower, which was consistent with Fig. 2a and the change in leaf color. Similarly, the OJIP curve was also best in the T2 treatment group (Fig. 2e). The findings indicated that the blue light exerted a certain inhibitory effect, whereas red light exerted a stimulating effect on the photosynthetic activity of BJHJC. According to the results of the chlorophyll fluorescence parameters (Supplementary Table S3), in the CK treatment group, the initial fluorescence intensity (Fo) values were higher compared with the T1–T4 treatments, showing a reduction in light stress-induced damage to leaves. Additionally, the maximum fluorescence intensity (Fm) and Fv/Fm values under the T4 treatment were notably lower than those in the CK, pointing towards adverse impacts on light stress and the inhibition of photosynthesis. Significant differences were observed in the Fv/Fm values among the T1–T3 treatments. NPQ can serve as an indicator of cellular protection against light damage, with higher levels observed in the T2 treatment compared with the other treatments, indicating that red light might mitigate light-induced stress in tea leaves.
Effects of blue and red light on the amino acid content of BJHJC
-
This study measured the theanine content in tea leaves under five different light treatments and found that theanine levels varied under red and blue light treatments (Table 1). The highest theanine content was observed in tea leaves exposed to blue light (T1), reaching 42.82 mg/g, whereas the contents under white light (CK) and red light (T2) were 28.97 and 31.43 mg/g, respectively. The T3 treatment group showed a theanine content of 36.92 mg/g, indicating that blue light or treatments with a high proportion of blue light significantly increased theanine levels, demonstrating that blue light promotes theanine accumulation.
Table 1. The amino acid contents (mg/g DW) in tea samples.
Amino acid CK T1 T2 T3 T4 Theanine 28.97 ± 1.599c 42.82 ± 2.318a 31.43 ± 5.041c 36.92 ± 1.211b 30.44 ± 1.179c P-Ser 4.10 ± 0.429a 3.93 ± 1.109a 4.66 ± 0.809a 3.43 ± 1.588a 3.44 ± 0.579a Asp 4.74 ± 2.906b 11.07 ± 2.527a 7.12 ± 0.587ab 8.07 ± 3.439ab 6.59 ± 0.403ab Thr 2.31 ± 1.755a 1.35 ± 0.409a 1.45 ± 0.122a 1.45 ± 0.571a 1.37 ± 0.207a Ser 3.29 ± 1.317a 3.49 ± 0.848a 3.05 ± 0.219a 4.12 ± 1.751a 3.94 ± 0.563a Glu 1.52 ± 0.066a 1.37 ± 0.462a 1.63 ± 0.056a 1.08 ± 0.494a 0.49 ± 0.195a Sar 1.49 ± 0.351b 2.33 ± 0.520a 1.10 ± 0.332b 1.42 ± 0.040b ND Gly 0.49 ± 0.567a 0.22 ± 0.070a 0.18 ± 0.015a 0.18 ± 0.030a 0.20 ± 0.022a Ala 2.17 ± 1.340a 2.38 ± 0.749a 1.30 ± 0.319a 1.16 ± 0.395a 1.24 ± 0.173a Cit 1.05 ± 0.505a 1.23 ± 0.275a 1.63 ± 0.209a 1.75 ± 0.863a 1.37 ± 0.273a Val 1.09 ± 0.688a 1.69 ± 0.533a 1.29 ± 0.855a 1.67 ± 0.723a 1.43 ± 0.114a Ile 0.85 ± 0.941a 0.43 ± 0.210a 0.94 ± 0.756a 0.37 ± 0.180a 0.30 ± 0.047a Leu 0.48 ± 0.261b 1.02 ± 0.395a 0.56 ± 0.130ab 0.77 ± 0.202ab 0.51 ± 0.187b Tyr 0.56 ± 0.226a 0.56 ± 0.145a 0.56 ± 0.190a 0.45 ± 0.144a 0.37 ± 0.026a β-Ala 4.04 ± 0.200a 3.44 ± 0.416ab 3.59 ± 0.696ab 2.12 ± 0.877c 2.69 ± 0.392bc g-ABA 1.68 ± 0.947a 0.89 ± 0.244ab 0.97 ± 0.361ab 0.51 ± 0.239b 0.95 ± 0.326ab His ND 0.53 ± 0.124b 0.41 ± 0.023b 0.74 ± 0.054a ND Orn ND 0.42 ± 0.158a 0.23 ± 0.053a 0.27 ± 0.122a 0.32 ± 0.112a Lys 1.38 ± 0.325b 2.55 ± 0.657ab 2.07 ± 0.159ab 3.35 ± 1.518a 1.98 ± 0.631ab Arg 2.60 ± 0.511a 3.88 ± 1.144a 3.76 ± 0.302a 3.92 ± 0.415a 1.91 ± 1.840a Total 62.81 ± 5.370b 85.60 ± 9.086a 67.93 ± 0.347b 73.75 ± 13.275ab 59.54 ± 4.710b Data with different letters in the same line denote a significant difference at the 0.05 level according to the least significant difference (LSD) test; ND stands for 'not detected'. Total amino acid composition represents the summation of 19 quantified free amino acid species, with theanine quantification analyzed separately. The full nomenclature of the analytical targets appears in Supplementary Table S4. Meanwhile, the content of free amino acids was also measured. The results indicate that, except for the control group, which lacked histidine (His) and ornithine (Orn), and the T4 treatment group, which lacked sarcosine (Sar) and His, all other treatment groups detected 19 distinct free amino acids (Table 1). None of these amino acids included contained cysteine. Among these, the total free amino acid content was highest under the blue light and high-blue light treatments. Moreover, blue light also contributed to the increase in umami-related amino acids such as alanine (Ala), aspartate (Asp), and glycine (Gly), indicating that blue light promotes the accumulation of amino acid compounds and is more conducive to enhancing the fresh and brisk taste of tea, thereby improving the refreshing flavor of green tea.
The analysis of DEGs and functional annotation
-
First, we extracted RNA from tea seedlings under different light treatments, prepared libraries, and sequenced them before the transcriptomic data analysis. The data quality was high, as the Q30 scores reached 93.91%–94.57%, and the GC content was 43.59%–44.87% (Supplementary Table S5). All unigenes were comprehensively annotated against reference databases. This confirmed the sequencing quality and established robust baseline transcriptional profiles for studying light response mechanisms in tea plants, ensuring suitability for downstream analysis. DEG analysis of tea leaf cDNA libraries under different LED light treatments revealed significant differences in expression (Fig. 3a, b). The CK–T3 comparison showed the most DEGs (3,298). DEG counts were 1,597 for CK–T4, 1,394 for CK–T1, and 318 for CK–T2. CK–T3 and CK–T1 exhibited strong upregulation biases (3.1:1 and 2.9:1 up/down ratios), while CK–T4 had 4.0-fold more downregulated genes. Blue light induced more pronounced transcriptional changes than red light, with tea leaves showing greater sensitivity and responsiveness to blue wavelengths.
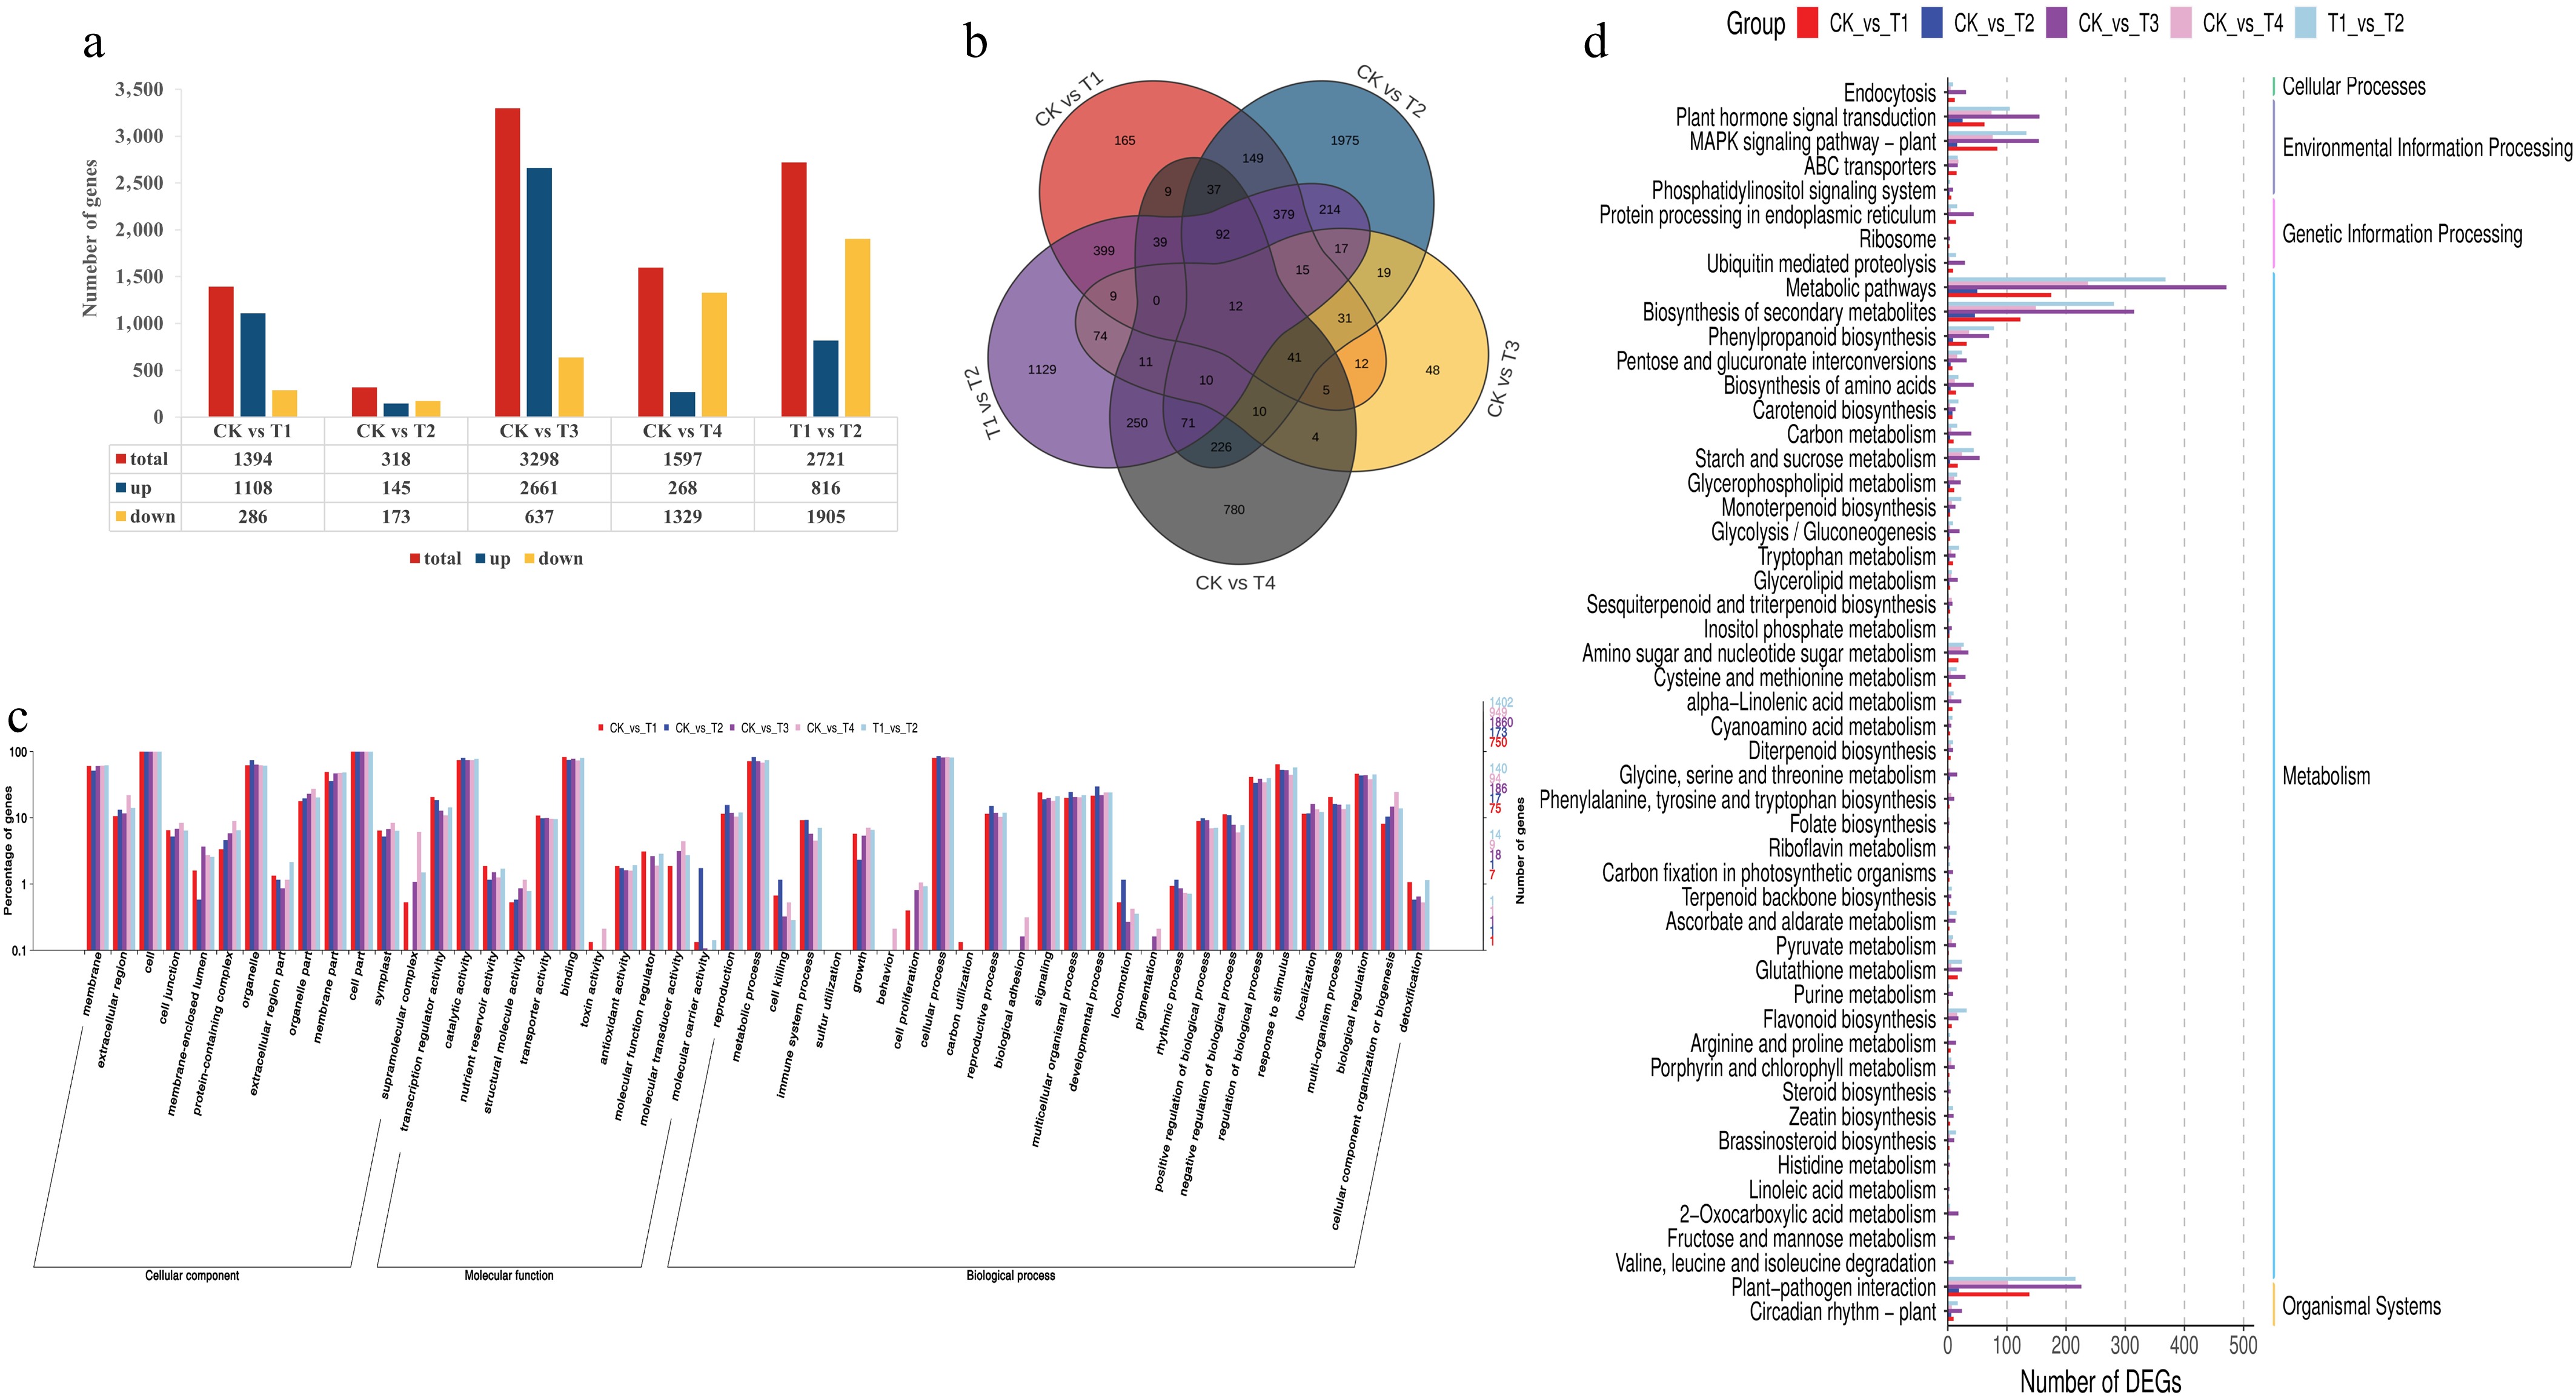
Figure 3.
Functional annotation results of the differentially expressed genes in the blue, red, and red/blue light treatments compared with the control (white). The number of DEGs (a) and a Venn diagram showing the shared and common DEGs (b) for all light treatments. Annotation information obtained from the GO database (c) and functional classification of DEGs according to the KEGG dataset (d).
We then analyzed all DEGs by mapping them to the reference canonical pathways in the KEGG database and performed GO term annotation. In this study, analysis identified the five most enriched pathways for co-DEGs: riboflavin, linoleic acid, sesquiterpenoid/triterpenoid, folate, and histidine metabolism (Fig. 3c). Key biological processes with significant co-DEGs included secondary metabolite biosynthesis (10 co-DEGs), plant–pathogen interactions (9 co-DEGs), and hormone signal transduction (8 co-DEGs), indicating their potential importance. Functional annotation of overlapping DEGs covered 51 GO terms across three domains: cellular components (linked to subcellular architecture), molecular functions (binding, catalysis, regulation), and biological processes (cellular/metabolic activities and stimulus responses). In Fig. 3d, the genes are classified into five primary biological KEGG pathways, dominated by metabolism (42 genes). These include primary metabolism, carotenoid/chlorophyll metabolism, secondary metabolite biosynthesis, and amino acid/glycine–serine–threonine pathways, aligning with the changes observed in chlorophyll and theanine. Other categories were environmental processing (14 genes), organic systems (10 genes), cellular processes (1 gene), and genetic information processing (1 gene). GO and KEGG analyses confirmed that blue and combined light treatments significantly alter the primary metabolic pathways of tea leaves in comparison with the CK treatment, consequently influencing secondary metabolism.
Regulation of transcriptional levels of light signaling factors, theanine, and chlorophyll in tea plants under red and blue light
-
Plants perceive light signals through various photoreceptors, which play a critical role in regulating physiological and metabolic activities in plants[36]. In this study, genes related to photoreceptors and signal transduction components were selected by gene function annotation (Fig. 4a). For example, CsCRY (LOC114283522, LOC114286555) and CsHY5 (LOC114318181) showed higher expression levels under the blue light treatment compared with the other treatment groups, whereas CsPHYB (LOC114264644), CsPIF1 (LOC114268243), and CsPIF3 (LOC114307536) showed the highest expression level compared with the other treatment groups under red light. CsHY5 (LOC114260757, LOC114272424) showed a higher expression level under the T3 treatment than under the other treatments, whereas CsCOP1 (LOC114306547) and CsSPA1 (LOC114360766, LOC114316535, LOC114306024) showed the highest expression levels under the T4 treatment compared with the other treatments. These patterns confirm the significant light-mediated regulation of these genes.
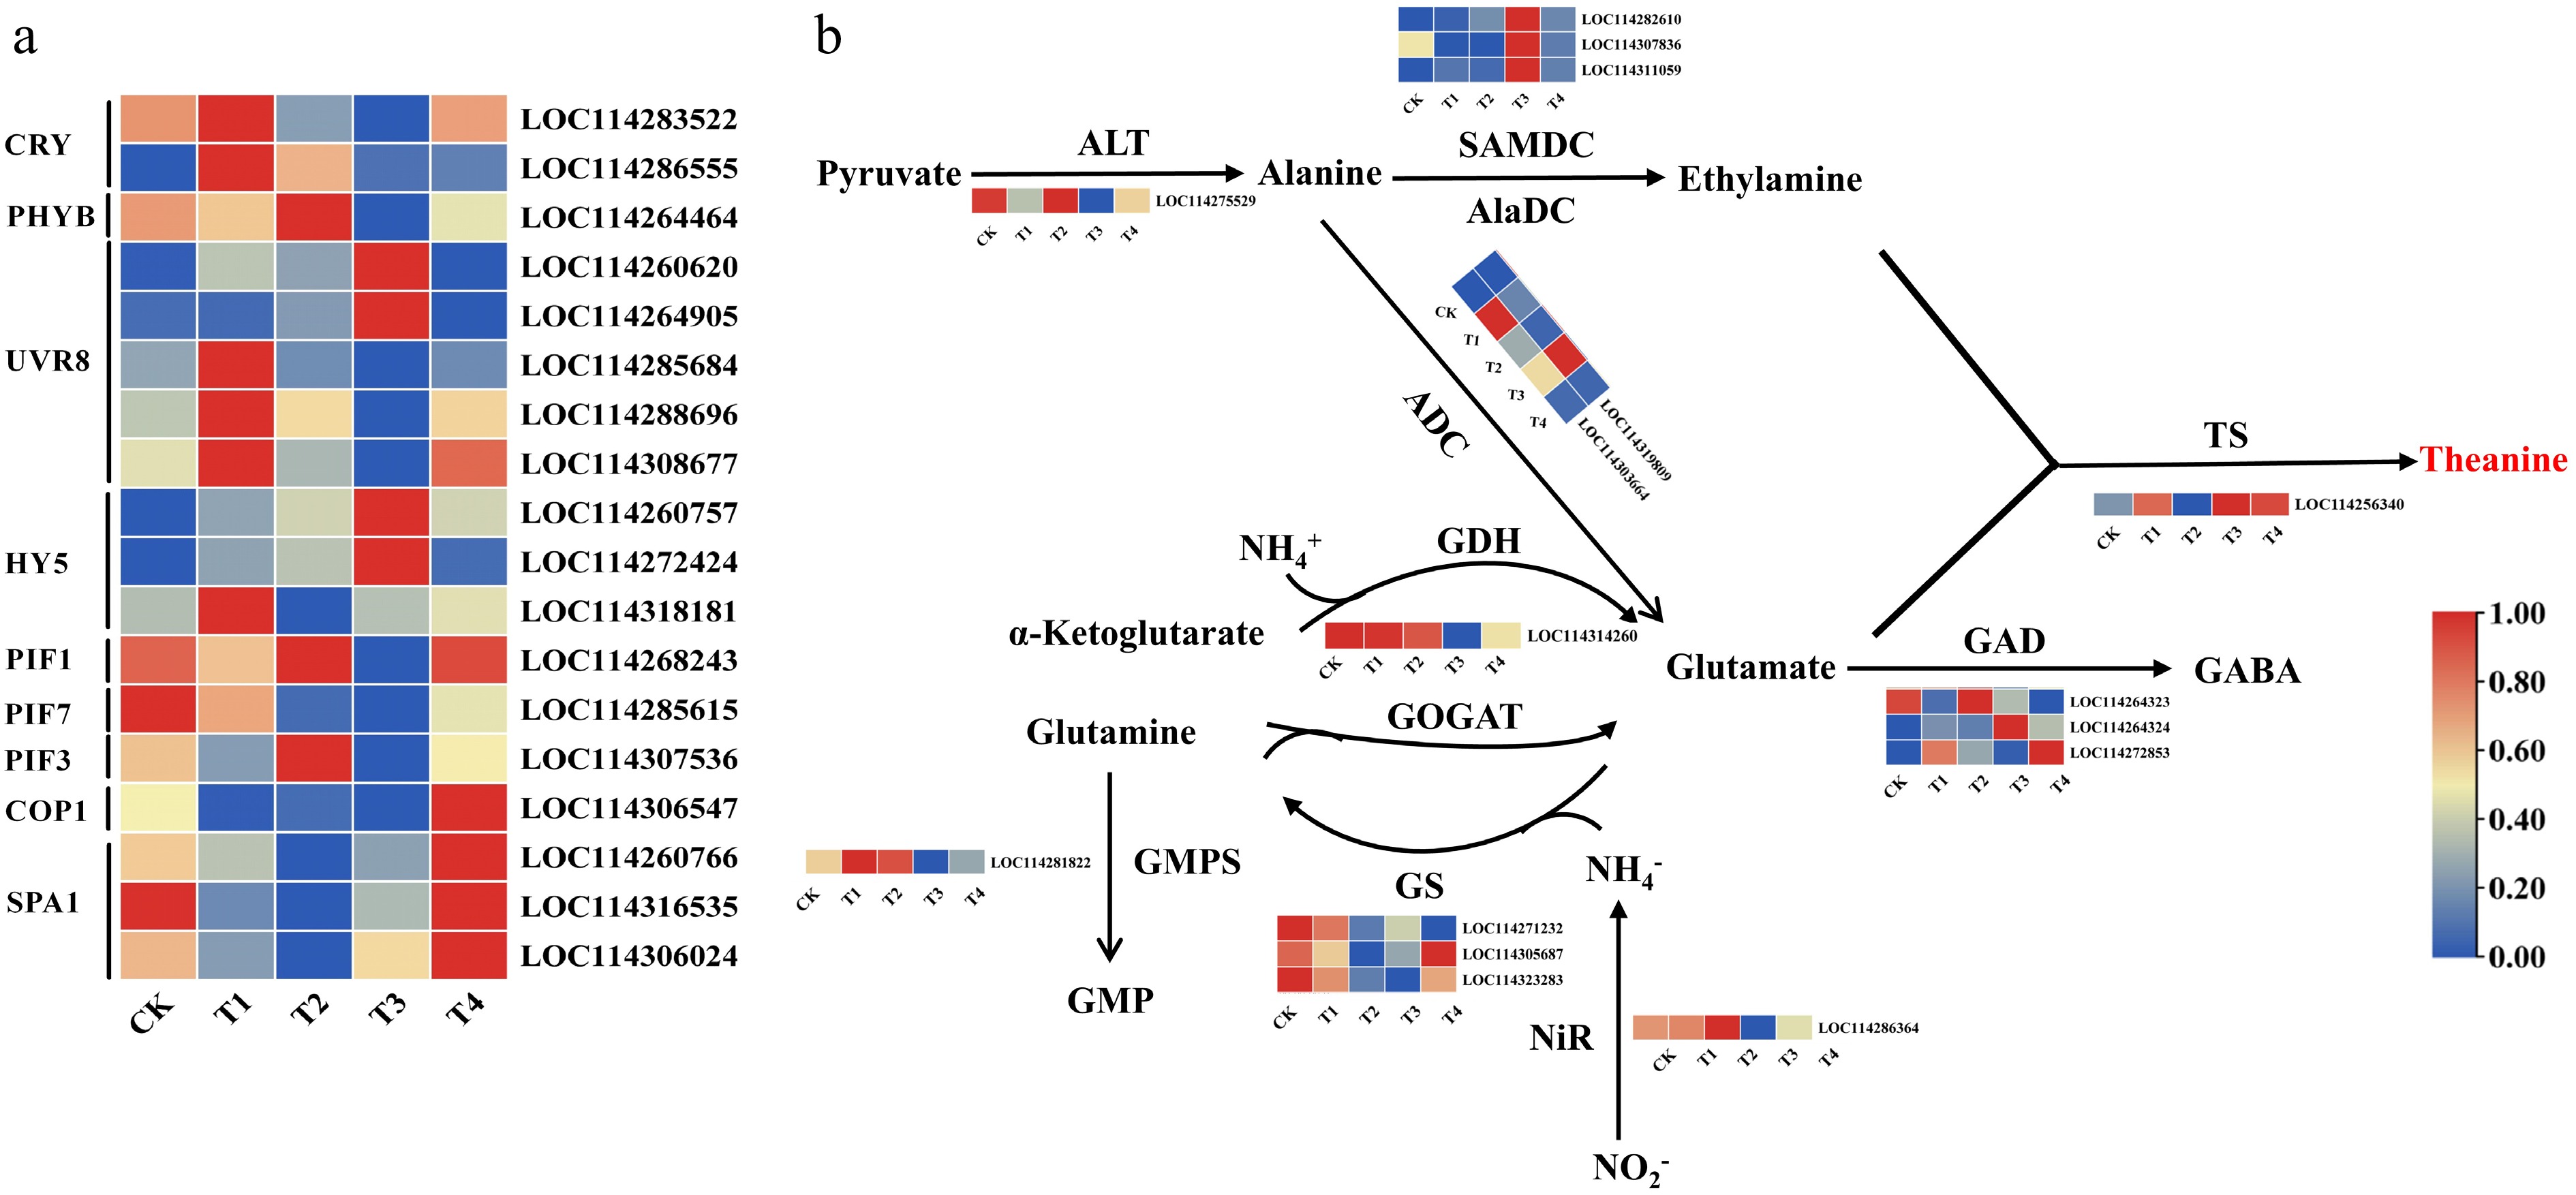
Figure 4.
Expression levels of light signalling genes (a), and expression patterns of the genes involved in theanine biosynthesis (b) under different light treatments. Note: The scale represents the normalized transformation of log10 fragments per kilobase of transcripts per million (FPKM) and the relative expression level of each gene. Differences in gene expression are indicated by different colors, ranging from low (blue) to high (red).
The metabolic pathway of theanine biosynthesis and the key genes involved in the process have been clearly identified, including CsTS, CsGS, and CsAlaDC, which regulate the primary precursor, ethylamine. This study identified and analyzed several genes associated with this pathway (Fig. 4b), revealing significant differences in expression across treatments. CsALT (LOC114275529) showed high expression under the CK and T3 treatments but low expression under the T4 treatment. GsTS (LOC114256340) and CsADC (LOC114319809/LOC114303664) showed the highest expression under the T1 and T3 treatments, in contrast to the other treatments. CsSAMDC (LOC11428610/LOC114307836) showed the highest expression under the T3 treatment compared with the other treatments. CsGDH (LOC114314260) showed high expression under the CK, T2, and T3 treatments. CsGS (LOC114305687) showed the highest expression under the T4 treatment compared with the other treatments. CsGMPS (LOC114281822) showed the highest expression under the T1 and T2 treatments. CsNiR (LOC114286364) showed higher expression under the CK and T2 treatments but low expression under the T3 treatment. Three genes related to glutamate decarboxylase (CsGAD) were differently expressed. The level of CsGAD1 (LOC114264323) was upregulated under the T3 and CK treatments, whereas CsGAD2 (LOC114264324) and CsGAD3 (LOC114272853) showed higher levels of expression under T3 and T4, respectively. These results suggest that the response of biosynthetic genes to light may be the primary mechanism underlying the observed differences in theanine accumulation in tea leaves.
The study also revealed differential effects of the light treatments on the expression of chlorophyll synthesis enzyme genes, with specific genes being identified and selected (Supplementary Fig. S1). The expression of CsHEMC, CsHEME, and CsCHLD was found to be consistent with the observed trend in chlorophyll content under different light conditions, providing evidence that light influences chlorophyll content through modulation of chlorophyll synthesis genes.
Coexpression network analysis
-
To further identify modules related to theanine and chlorophyll metabolism under light regulation, significantly alterations in theanine and chlorophyll content were integrated with RNA-seq data to develop a co-expression network (Fig. 5a). The screened genes identified 10 co-expression modules using the dynamic tree cutting method. The adjacency heatmap of selected genes revealed that adjacent co-expression modules exhibited higher correlations, whereas modules that are physically farther apart showed lower correlations (Fig. 5b). Among the different modules, the turquoise module contains the most genes (2,012), whereas the gray module has the fewest, with only 7 genes (Fig. 5c). Notably, among all modules, the brown module exhibited the most significant correlation with the accumulation patterns of theanine and chlorophyll (|r| > 0.5, p < 0.05). Within this module, 700 genes showed a strong positive correlation with theanine and a negative correlation with chlorophyll (Fig. 5c). According to the eigengene connectivity (KME) values in the co-expression network, the top 60 node genes in the brown module were selected to generate the co-expression subnetwork (Fig. 5d). Among these genes, CsNHL (LOC114280581), the CCR4-NOT complex (LOC114322279), and CsCML42 (LOC114279063) exhibited the strongest interconnections with the other node genes and had high KME values (Supplementary Table S6). Additionally, this module includes the light-responsive transcription factor CsHY5 (LOC114318181), the amino acid permease (AAP) genes involved in theanine transport (CsAAP3, LOC114305162), the WNK kinase (CsWNK11, LOC114323597) participating in multiple plant physiological functions, the chloroplast signal peptide (PCS1, LOC114257642), and the jasmonic acid (JA)-responsive transcription factor gene (CsERF109, LOC114264032). All of these may participate in regulating theanine metabolism in tea plants under different red and blue light conditions.
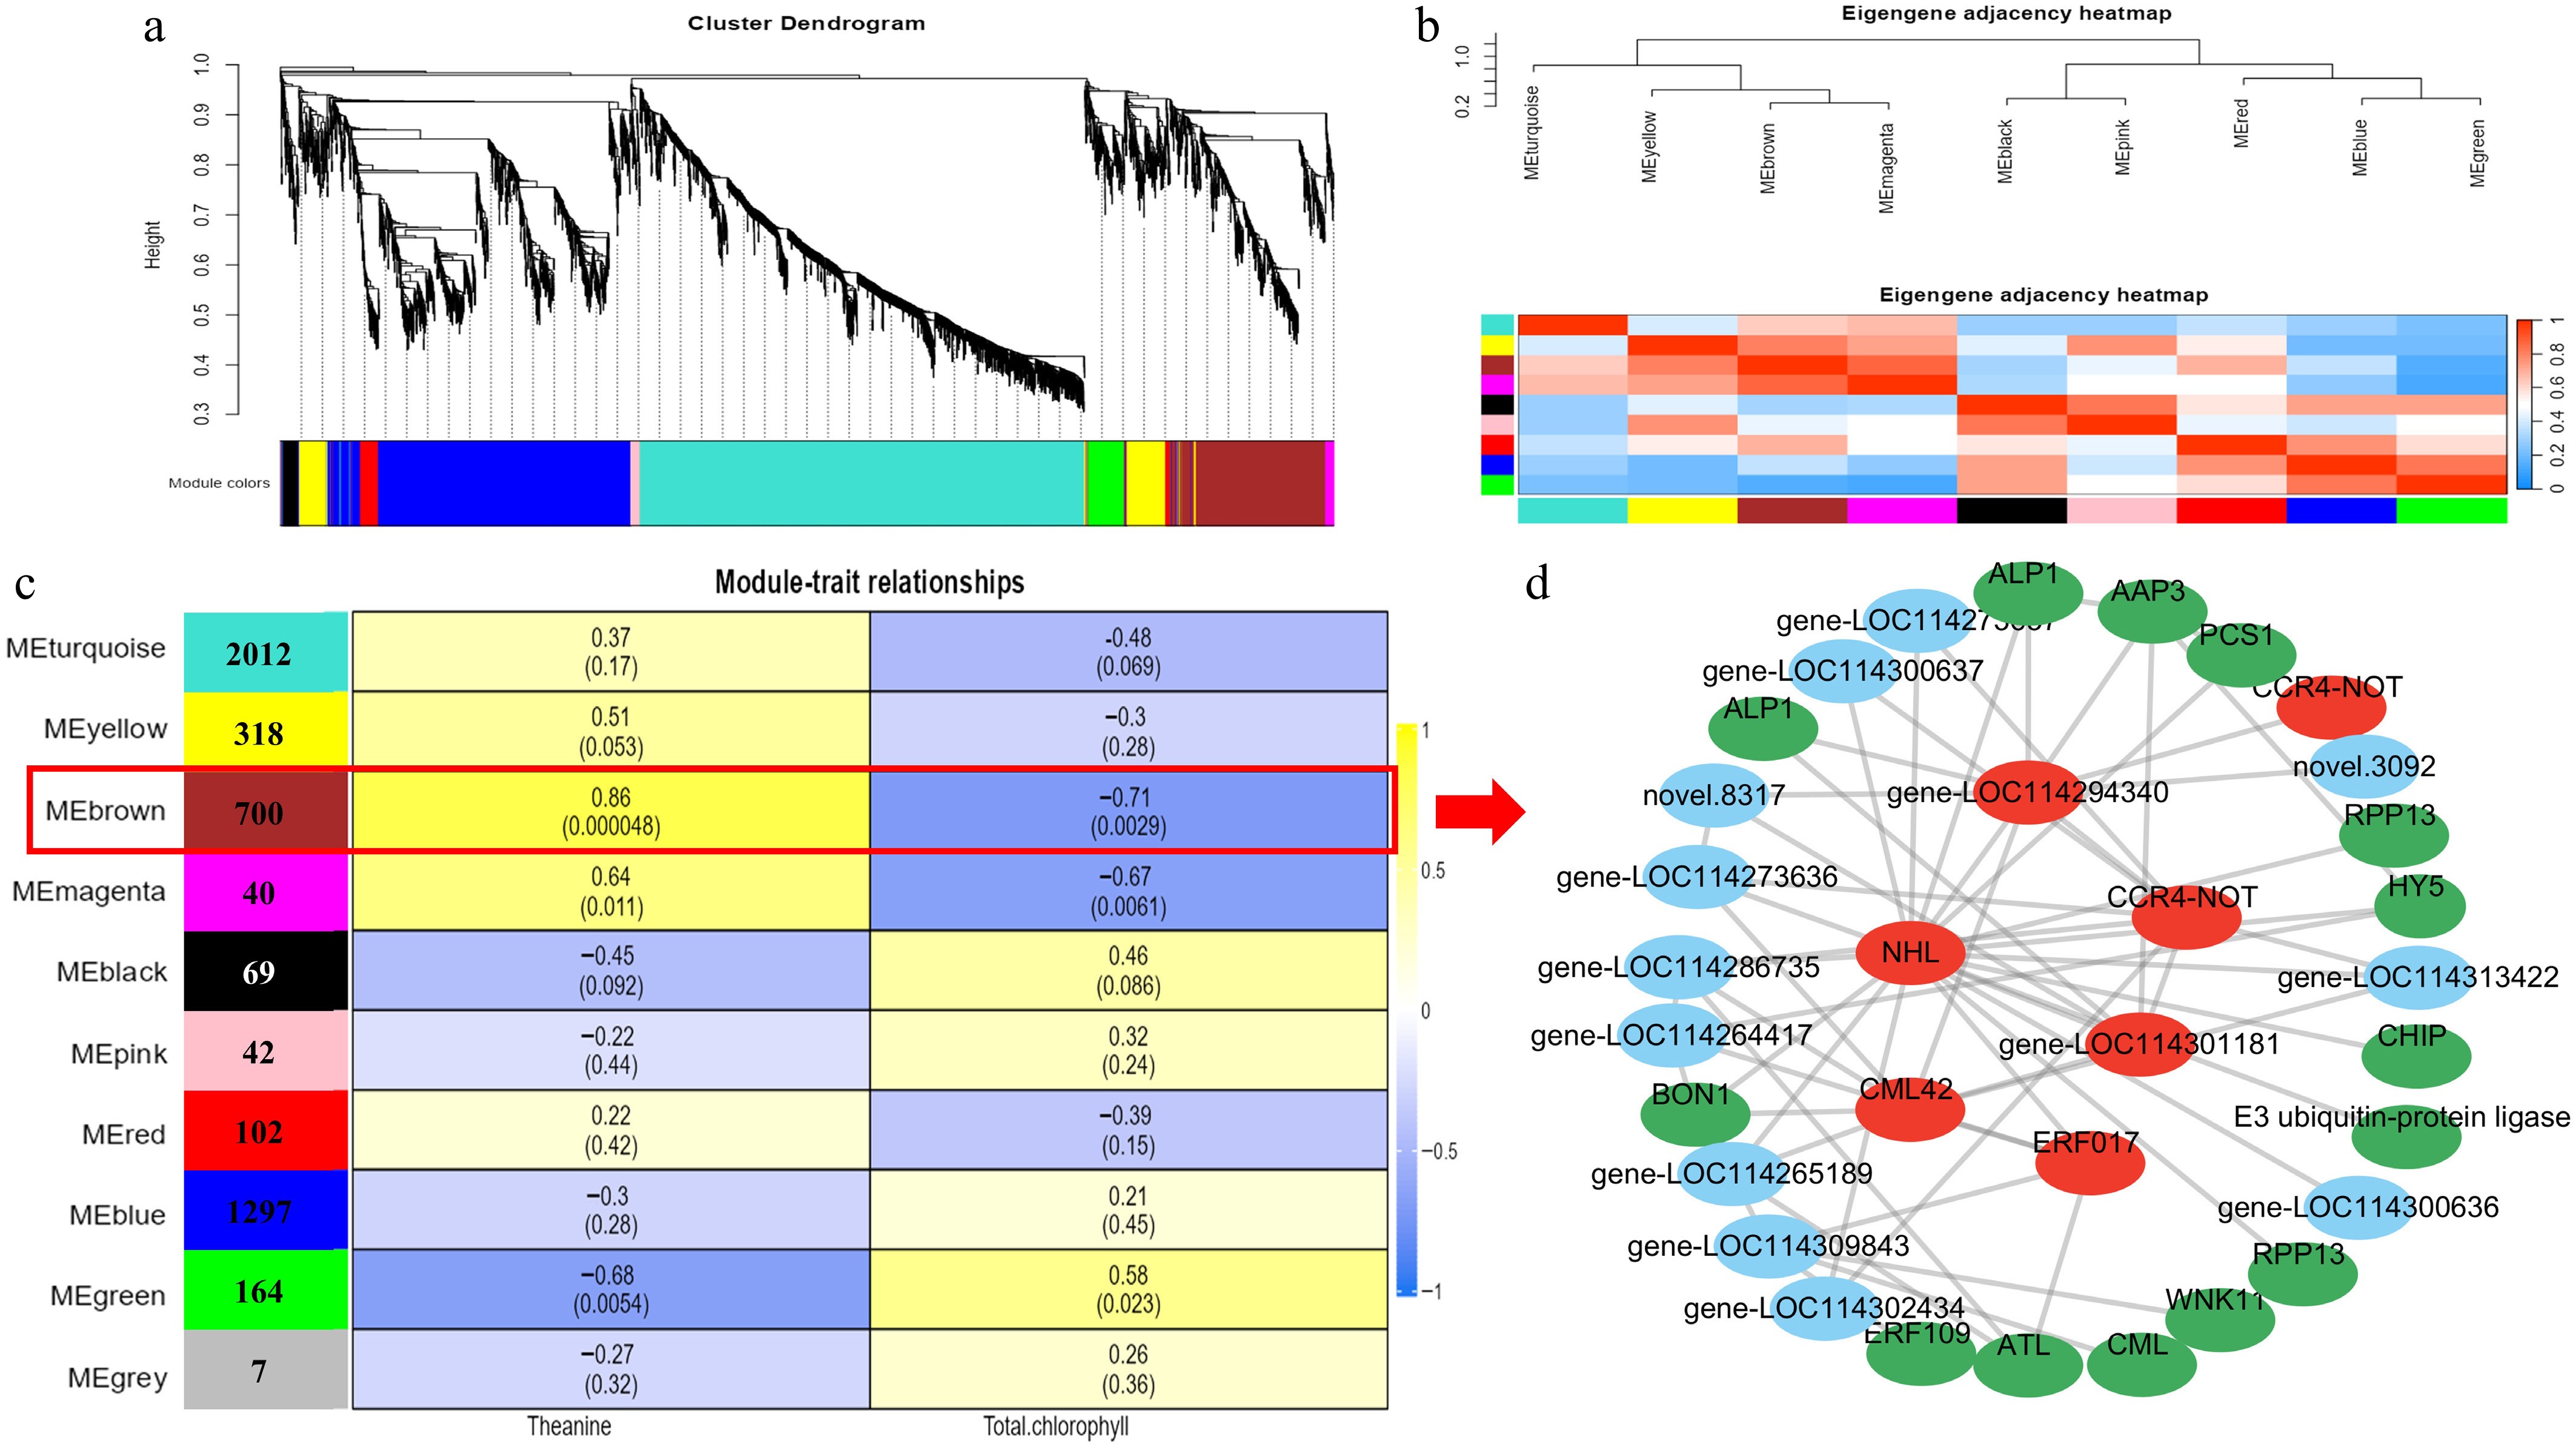
Figure 5.
Gene expression clustering and transcriptome co-expression analysis. (a) Hierarchical cluster tree showing 10 modules obtained by weighted gene co-expression network analysis (WGCNA). (b) Adjacency heatmap of featured genes. Module–metabolite correlation matrix. (c)The number of genes in each module is displayed in the left box, and the correlation coefficients and p-values between modules and metabolites are shown at the row–column intersections. Co-expression subnetwork analysis of the brown module associated with theanine and chlorophyll metabolic accumulation. (d) The top 60 nodes of the brown module were selected to construct the network, with hub genes marked in red, and genes involved in metabolism marked in green.
Validation by qRT-PCR
-
To verify the accuracy of the RNA-seq data, eight representative genes were randomly selected for qRT-PCR. As shown in Fig. 6, the expression trends of genes in the RNA-Seq data were generally consistent with the transcriptome analysis results. These included the photoreceptors CsCRY and CsPHYB, the light signaling transcription factors CsHY5 and CsPIF, and theanine and chlorophyll synthesis genes. The results of the qRT-PCR analysis were in agreement with the sequencing results, indicating that the RNA-seq data are accurate and reliable.
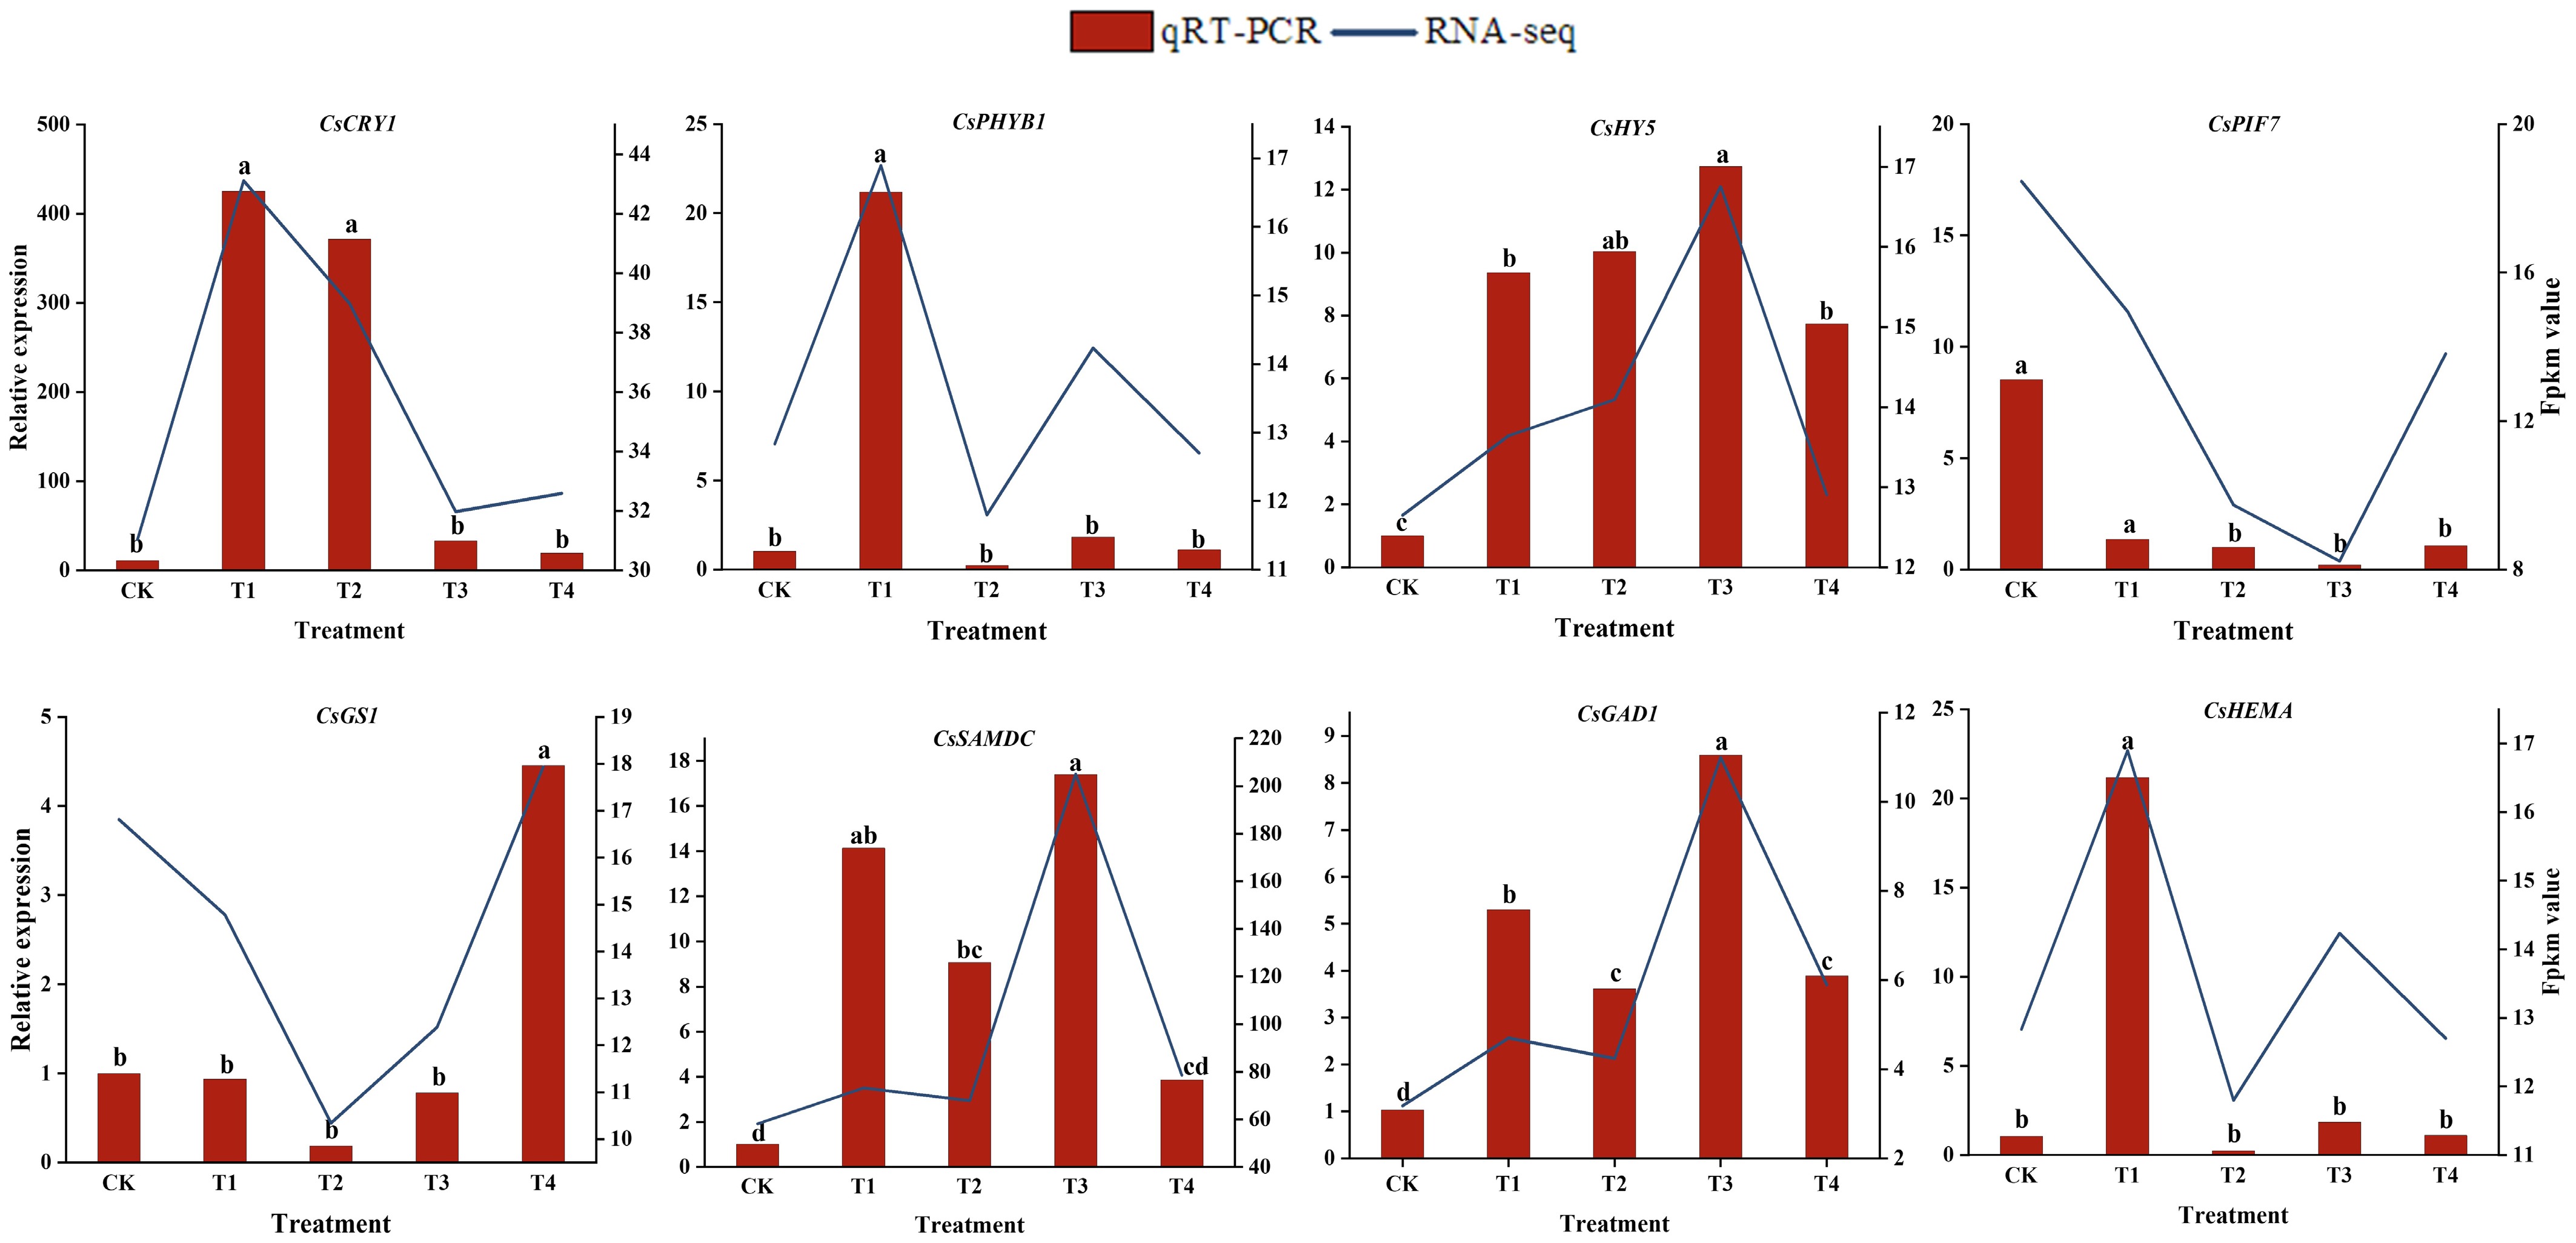
Figure 6.
The relative expression levels of eight selected DEGs were compared by RNA-seq and qRT-PCR. The line chart shows the gene expression levels from the transcriptome (FPKM). The qRT-PCR expression levels were calculated as a ratio relative to the level of expression in the CK, which was set to 1. Different letters above the bars represent significant differences between each other (p < 0.05).
-
Tea quality includes leaf morphology, color, and metabolite content, among other factors[37,38]. Theanine is a characteristic free amino acid unique to tea plants and serves as a core quality component of green tea. Chlorophylls, however, are key substances influencing leaf color. Moreover, a significant connection exists between these two compounds. Chlorophyll is synthesized via the tetrapyrrole pathway, using glutamate as a precursor, which also serves as a substrate for theanine biosynthesis[9]. Furthermore, studies have shown that both theanine and chlorophyll content are significantly influenced by light conditions[22,23]. In this study, under blue light (T1) conditions, chlorophyll content in leaves was significantly lower than under red light (T2) treatment, whereas theanine content was significantly higher than under red light (Table 1, Fig. 2d). A negative correlation was observed between chlorophyll and theanine levels under red and blue light treatments. This finding is consistent with the results of Huang et al., who identified a negative correlation between free amino acid content and chlorophyll levels in tea plants through analyses of cellular ultrastructure, metabolomic, and transcriptomic data[39]. Liu et al. also demonstrated that the concentration of essential amino acids in albino tea leaves is inversely proportional to the content of photosynthetic pigments, particularly carotenoids, chlorophyll a, and chlorophyll b[40].
To deepen our understanding of how red and blue light affect the accumulation of theanine, we analyzed the levels of different free amino acids. Compared with white light, both red and blue light increased the total free amino acid content, with blue light showing the highest accumulation. This demonstrates that blue light promotes amino acid synthesis (Table 1). Moreover, under blue light treatment, glutamate content was lower than under red light, whereas theanine levels were higher, accompanied by elevated CsTSI expression. This indicates that blue light activates CsTSI expression, promoting the utilization of glutamate as a substrate to synthesize more theanine. Additionally, CsADC (which positively regulates theanine synthesis) was upregulated but CsGDH (which negatively regulates theanine synthesis) was suppressed under blue light (Fig. 4b). These findings further demonstrate the promoting effect of blue light on theanine biosynthesis. This is consistent with the findings of Zhang et al., who reported that theanine levels in the leaves of Zhongcha 108 and Zhongbai 4 tea plants were significantly higher under the highest blue light treatment compared with white light, red light, and other light conditions[26].
The survival of plants relies on their capacity to perceive light[41]. This is mediated by PHYA-E (red/far-red), CRYs (CRY1-3; blue), and UVR8 (UV-B), and is essential for plant survival[42]. Zhang et al. indicated that blue light promotes the expression of photomorphogenesis-related genes by activating photoreceptors such as CRY2/3 and PHOT2, thereby regulating the synthesis of flavonoids in tea plants[20]. The same results were seen in tomatoes, where the activation of HY5 and PIF by blue light regulated the expression of the PSY1 gene and resulted in a higher lycopene content[43]. Shading can activate CsPIF7, which directly binds to and activates the theanine synthesis genes CsTSI/CsGSI, ultimately promoting theanine accumulation[18]. The results of this study indicate that compared with white light, CsCRY and CsHY5 are significantly upregulated under blue light, whereas CsPYHB, CsPIF1 and CsPIF3 are significantly upregulated under red light (Fig. 4a). According to the weighted gene co-expression network analysis (WGCNA), we identified CsHY5 as being involved in light regulation. The genes CsNHL and CsCML42 with the highest KME values may be the hub genes for the regulation of theanine metabolism by red and blue light. Additionally, we identified an amino acid permease (AAP) family transporter (CsAAP3, LOC114305162) with a transport function. Genes in the AAP family have been demonstrated to participate in theanine transport[44]. These include a unique serine/threonine-rich domain protein kinase, WNK kinase (CsWNK11, LOC114323597), which participates in various plant physiological processes, such as the circadian rhythm and the ability to cope with stress[45], and the JA-responsive transcription factor CsERF109 (LOC114264032), which has been reported to be involved in artemisinin biosynthesis and the ability to participate in substance metabolism[46]. These genes are likely involved in regulating theanine metabolism in tea plants under different red and blue light conditions. Therefore, BJHJC may perceive and transmit blue light signals through CsCRY, influencing downstream genes to regulate its biosynthetic pathway and thereby promoting theanine production.
In general, on the basis of the transcriptome gene heatmap (Fig. 4a) and WGCNA (Fig. 5d), we propose a model illustrating that blue light (through CRYs) and red light (through PHYB) regulate the biosynthesis of theanine and chlorophyll (Fig. 7). The main focus is on the involvement of these two types of light factors in inducing key transcription factors, which then trigger the biosynthetic pathways. Under blue light conditions, theanine content is upregulated, whereas red light inhibits theanine biosynthesis by promoting chlorophyll synthesis. These results can provide a reference for future research on the regulation of amino acid metabolism in tea plants by using red and blue light.
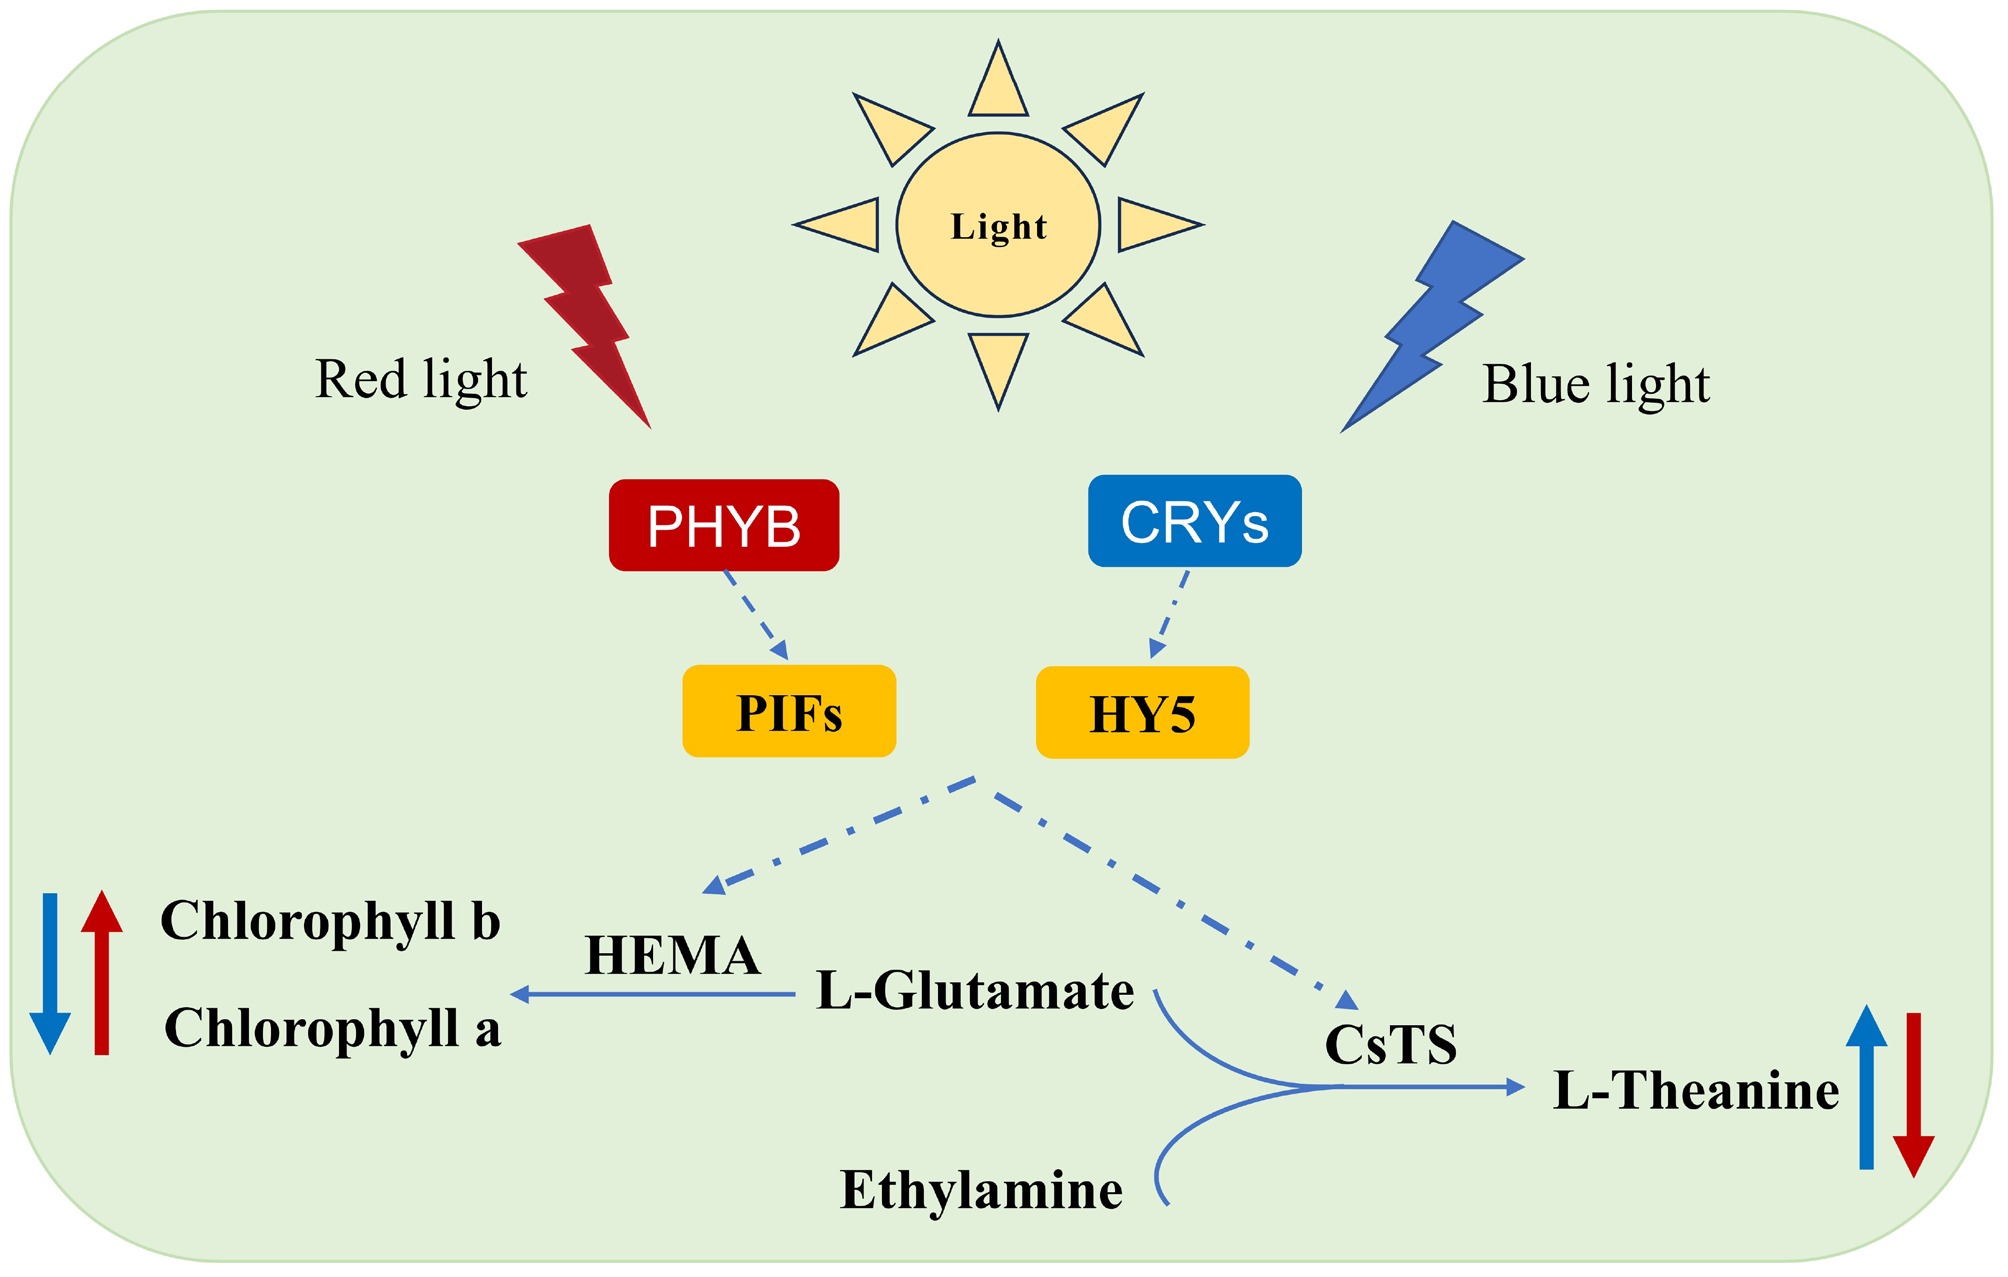
Figure 7.
Model diagram of light-induced theanine and chlorophyll biosynthesis.
-
This study investigated the effects of LED lighting on theanine concentration. The study revealed that blue LED illumination markedly enhanced both theanine content and free amino acid levels. Conversely, red light inhibited the synthesis of theanine, as it facilitated chlorophyll synthesis. Transcriptomic analysis revealed that the DEGs identified under the blue and red light treatments were primarily associated with the pathways of amino acid biosynthesis and chlorophyll metabolism. Simultaneously, heatmap analysis and WGCNA revealed that light signal-related genes (CsCRY, CsPHYB, CsHY5) mediated the expression of theanine synthesis and decomposition-related genes (CsTS, CsSAMDC, CsADC, CsGDH), thereby modifying the content of theanine. This study presented a novel mechanism for regulating the theanine content in tea plants via light modulation, and the research outcomes lay a foundation for more effective regulation of theanine content.
This work was supported by the Key R&D Projects in Hunan Province (2024JJ3019) and the Furong Plan Province Enterprise Science and Technology Innovation and Entrepreneurship Team Support Project of Hunan Optical Agriculture Engineering Technology Research Center (2018TP2003).
-
The authors confirm their contributions to the paper as follows: conceived the project: Zhou Z; performed the experiments and statistical analyses: Gai S, Zeng Z, Liu L; analyzed the results: Zhao Z, Chen Y; conducted the investigation: Chen Y, Wang Y; wrote the manuscript: Gai S, Zeng Z, Zhou Z. All authors reviewed the results and approved the final version of the manuscript.
-
The datasets generated during and/or analyzed in the current study are available from the corresponding author on reasonable request.
-
The authors declare that they have no conflict of interest.
- Supplementary Table S1 Transcriptome data.
- Supplementary Table S2 List of all primers for qRT-PCR used in this study.
- Supplementary Table S3 Effects of light- chlorophyll fluorescence of tea plants.
- Supplementary Table S4 The abbreviations for substance names.
- Supplementary Table S5 Summary of the Camellia sinensis transcriptome.
- Supplementary Table S6 The genes and their module from WGCNA.
- Supplementary Fig. S1 Expression patterns of genes related to chlorophyll metabolism under different light quality treatments.
- Copyright: © 2026 by the author(s). Published by Maximum Academic Press, Fayetteville, GA. This article is an open access article distributed under Creative Commons Attribution License (CC BY 4.0), visit https://creativecommons.org/licenses/by/4.0/.
-
About this article
Cite this article
Gai S, Zeng Z, Liu L, Zhao Z, Chen Y, et al. 2026. Transcriptome analysis revealed the effect of blue and red light on theanine content in Baojing Huangjincha tea. Beverage Plant Research 6: e006 doi: 10.48130/bpr-0025-0035 

Transcriptome analysis revealed the effect of blue and red light on theanine content in Baojing Huangjincha tea
- Received: 22 April 2025
- Revised: 09 September 2025
- Accepted: 28 September 2025
- Published online: 11 February 2026
Abstract: Camellia sinensis 'Baojing Huangjincha 1' (BJHJC), a high-theanine cultivar of tea dominant in Hunan province, experiences a rapid decline in decline in late spring. Light is essential for regulating the growth and metabolite accumulation of tea plants. However, the way light quality influences theanine accumulation in tea is not well understood. Here, under different light conditions (white, blue, red, blue/red (2:1), and red/blue (2:1)), we observed the changes in theanine content in BJHJC leaves. The results showed that theanine content significantly increased under blue and blue/red (2:1) light compared with white, whereas an opposite trend was observed under red and red/blue (1:2) light. Transcriptome analysis revealed that compared with white light, the blue and blue/red (2:1) treatments exhibited a greater number of differentially expressed genes (DEGs), 1,394 and 3,298 respectively, indicating more pronounced transcriptional changes induced by blue light than red light. Furthermore, these DEGs were categorized into five major Kyoto Encyclopedia of Genes and Genomes biological pathways, including primary metabolism, amino acid/glycine–serine–threonine pathways, and carotenoid/chlorophyll metabolism, consistent with the observed changes in theanine and chlorophyll. Meanwhile, the expression of the theanine biosynthesis-related genes CsTS and CsSAMDC was significantly upregulated under blue light, corroborated by real-time quantitative polymerase chain reaction results. Weighted gene co-expression network analysis also screened the genes CsNHL and CsCML42 with the highest eigengene connectivity value, may be the hub genes for the regulation of theanine metabolism by red–blue light. In conclusion, this study examines how varying light quality affects theanine accumulation in tea plants, aiming to provide an effective technical means for improving the economic value of BJHJC.
-
Key words:
- Camellia sinensis /
- Light quality /
- Transcriptome /
- L-Theanine