


-
Globally, coffee has been recognized for its nutritional benefits and economic importance[1]. Among the over 100 recognized coffee species, two dominate commercial production: Coffea arabica and Coffea canephora (Robusta). Robusta, known for its caffeine content and resistance to pests, contributes nearly 40% of global production and is commonly used in instant coffee and espresso blends[2].
Introduced to Ghana in the 18th century, coffee once played a prominent role in the country's agricultural exports, particularly in the Eastern, Central, and Ashanti regions. However, competition from cocoa and declining global coffee prices in the late 20th century led to reduced investment, cultivation, and underutilization of the Ghanaian Robusta coffee[3]. Although Ghana's annual production is modest (estimated at 7,000 metric tonnes in 2022), the country's tropical climate, fertile soils, and renewed policy support present opportunities for revitalization[3].
In economic terms, coffee remains the second most traded commodity worldwide, accounting for approximately US
${\$} $ Beyond its economic importance, regular coffee consumption has been associated with several health benefits, including improved cognitive performance, reduced risk of type 2 diabetes, cardiovascular diseases, and liver disorders[6]. Green coffee beans are rich in over 1,000 phytochemicals, including chlorogenic acids, trigonelline, methylxanthines, and diterpenes, compounds with demonstrated antioxidant, antimicrobial, and anti-inflammatory activities[7].
Roasting is a critical postharvest process where green coffee beans are subjected to temperatures exceeding 200 °C[8]. It results in physical and chemical changes such as moisture evaporation, Maillard reactions, and melanoidin formation, all of which contribute to aroma, flavor, color, and bioactivity[9]. Roasting also affects the concentration and bioavailability of biologically active compounds, including polyphenols, flavonoids, and minerals[10].
The chemical profile of coffee is influenced not only by roasting but also by bean type and brewing method[11]. Studies have shown that light roasts typically preserve thermolabile compounds like chlorogenic acids, while darker roasts enhance aroma but may degrade polyphenols[12]. However, most of these findings are based on Arabica coffee, leaving a gap in knowledge regarding African-grown Robusta coffee, particularly those from Ghana.
Given the global shift toward functional and health-based foods, understanding the biochemical and microbiological impact of roasting on Ghanaian Robusta coffee is both timely and relevant. Despite its resilience and caffeine strength, Robusta coffee has historically been undervalued compared to Arabica[13]. The growing demand for coffee consumption and trade in Asia and Europe, especially for espresso blends and instant coffee[14] presents opportunities for Ghana to reposition its coffee sector in the current global market.
Existing research on Ghanaian Robusta coffee covers genotype identification and diversity assessment[15,16], impact of drying methods on physical quality and sensory quality[17], fungal contamination, protein, caffeine[18], consumer knowledge and consumption patterns[19], and the use of coffee powder in baked products and fermented cocoa and cashew juices[20,21]. Aside from a recent NIR-based authentication study reporting proximate composition of African coffees, including Ghanaian green and roasted Robusta[22], comprehensive data on the nutritional, phytochemical, and bioactive properties of roasted and unroasted Ghanaian Robusta coffee remain absent, highlighting a major gap in Ghanaian coffee research.
To that end, this study investigated the effect of roasting on the proximate composition, mineral content (including essential and potentially toxic elements), oxidative stability, antioxidant capacity, and antimicrobial properties of Ghanaian Coffea canephora. Highlighting the uniqueness of Ghanaian coffee can bring it to the national, regional, and global spotlight, boosting local production and consumption while supporting the health of Ghanaians. This study is critical for establishing quality benchmarks and supporting Ghana's entry into premium and health-focused coffee markets. The study can provide useful data to support Ghana's investment in its coffee sector, expand production, access new markets, and generate substantial export revenue, much like the country has achieved with cocoa.
-
All the chemicals used were of analytical grade and were purchased from Sigma Aldrich (St. Louis, MO, United States) and CentralChem (Slovakia).
Material
-
Green, light, medium, and dark roasted Coffea canephora (Robusta) beans (Fig. 1) were purchased for this study. The coffee was cultivated and processed in Ghana by Kawa Moka Coffee Roasters, a 100% Ghanaian and female-led coffee roasting company. The coffee samples are artisanal specialty beans, sustainably sourced by the company from mostly women farmers in Leklebi, South Afadzato District, Volta Region of Ghana (Fig. 2), supporting their livelihoods and empowering their communities. The coffee beans were handpicked and carefully selected for quality during the harvesting season (November to March) and roasted in the facility powered by solar energy and packaged in recycled paper bags. Leklebi, situated around 500 m above sea level, is a small town surrounded by rainforest, waterfalls, and natural landscapes. The wild shade-grown Robusta coffee thrives in this ecosystem and across the region at elevations up to 800 m. Robusta coffee cultivation has a long history here, dating back to the 1930s (Moka kawa Coffee Roaster).
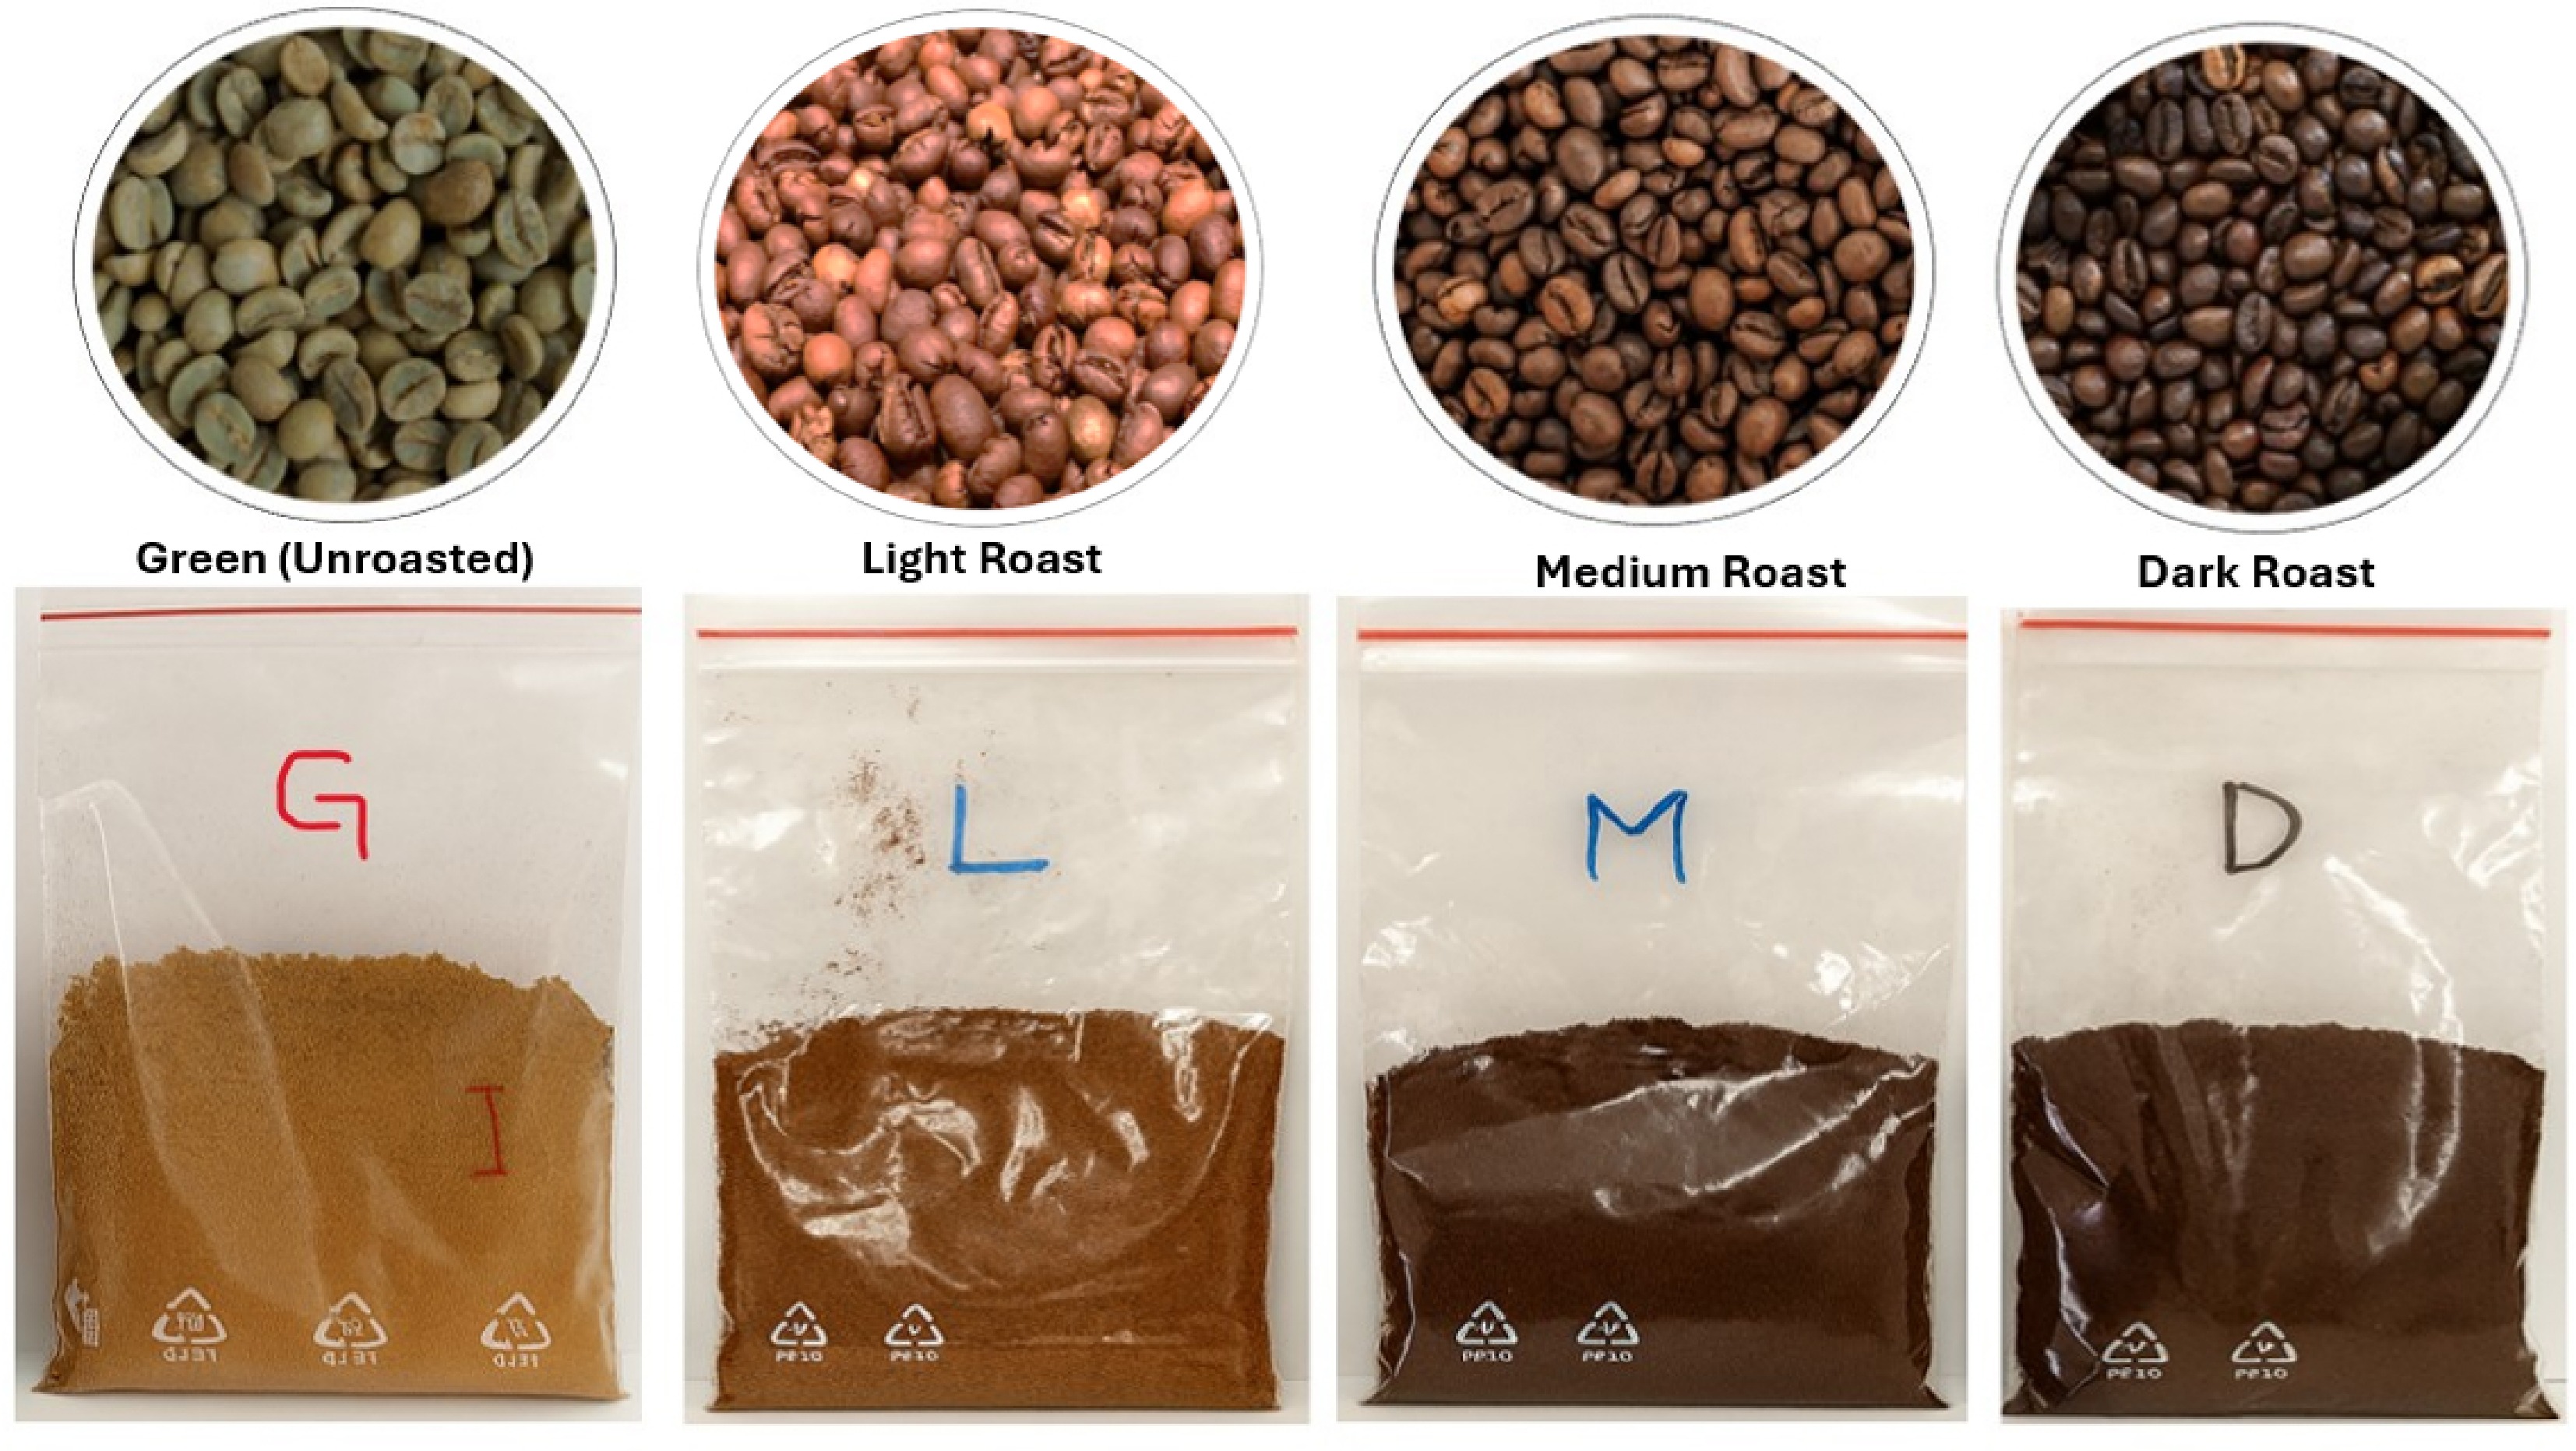
Figure 1.
Green and roasted Robusta coffee samples: whole beans and ground (image by Emmanuel Duah Osei).
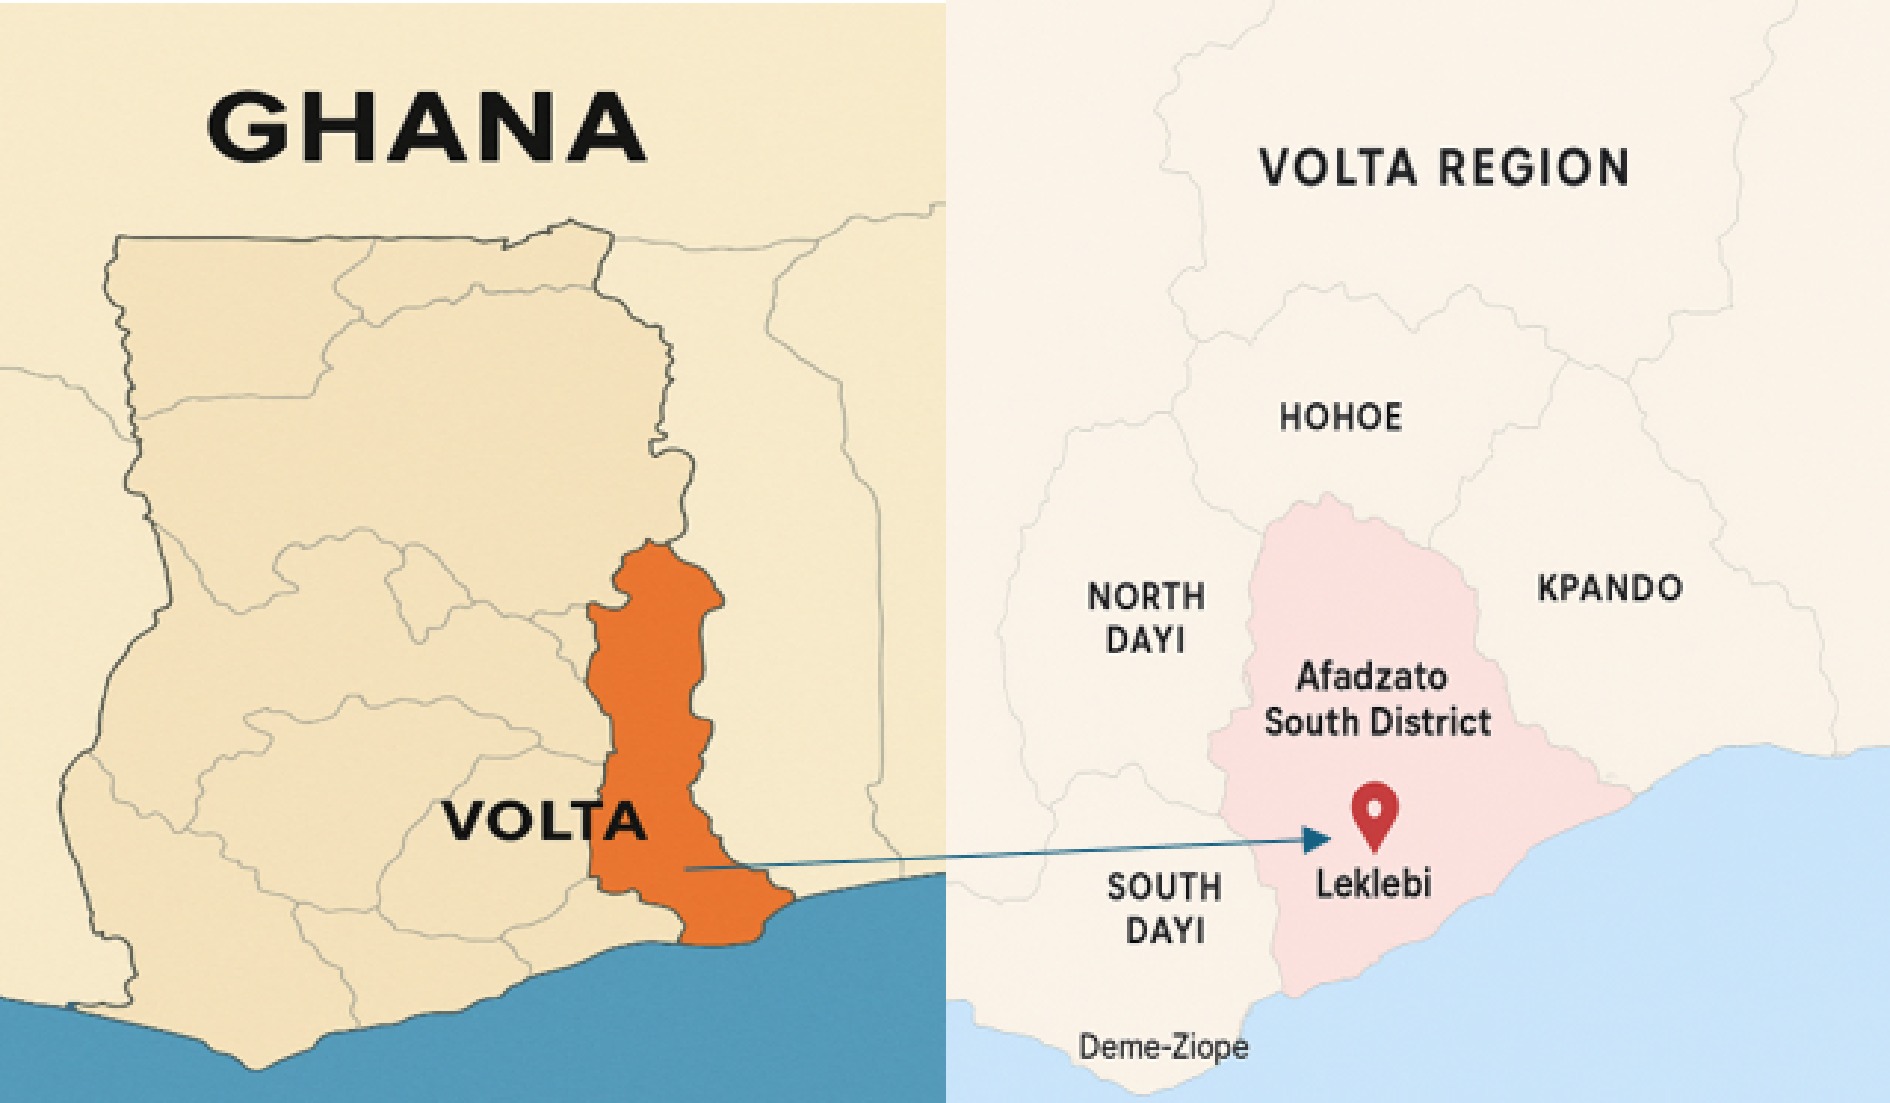
Figure 2.
Map showing the cultivation and processing location of the coffee (image by Emmanuel Duah Osei).
Sample preparation
-
The green and roasted coffee beans were ground to an average particle size (20 mesh), suitable for preparation in a paper filter using an electric grinding machine (Krups, GVX 2, Bur Grinder, Germany).
Nutritional analysis
Proximate analysis
-
Dry matter, ash, crude fat, and crude protein were determined according to the standard AACC method 08-01 (AACC 1996). For moisture content determination, samples were dried at 105 °C overnight for approximately 12 h. Ash content was determined by ashing 1 g of the samples at 600 °C using a muffle furnace. Fat content was determined using an Ancom XT15 fat extractor (Ancom, United States). Briefly, 1 g of the sample (W1) was placed in a filter bag (XT4, Ancom, United States) and dried at 105 °C for 3 h to remove moisture. The bag was cooled in a desiccator and weighed (W2), and then extracted with petroleum ether for 60 min at 90 °C. After extraction, the sample was dried at 105 °C for 30 min, cooled in a desiccator, and weighed again (W3). Fat content was calculated as: fat content (%) = (W2 – W3)/W1 × 100. Nitrogen content was measured by the semi-micro-Kjeldahl method. Nitrogen was converted to protein using the conventional factor of 6.25. Total carbohydrate was calculated using the difference method, and the total energy value was computed using the Atwater factor, where 4 represents carbohydrate, 9 represents fat, and 4 represents protein.
Mineral compounds including risk elements analysis
-
Mineral compounds, including risk elements analysis, were analyzed using inductively coupled plasma optical emission spectrometry (ICP-OES)[23]. A variety of elements (Ag, Al, As, Ba, Ca, Cd, Co, Cr, Cu, Fe, K, Li, Mg, Mn, Mo, Na, Ni, Pb, Sb, Se, Sr, and Zn) were examined in selected coffee samples using the ICP-OES. For sample preparation, mineralization was carried out in a microwave digestion system (Ethos UP, Milestone Srl, Sorisole, BG, Italy) with a mixture of 5 mL HNO3 (≥ 69.0%, Trace SELECT®, Honeywell Fluka, Morris Plains, United States), 1 mL H2O2 (≥ 30%, Sigma-Aldrich, Saint-Louis, Missouri, United States), and 2 mL ultrapure water (18.2 MΩ-cm; 25 °C, Synergy UV, Merck Millipore, France). The samples were heated to 200 °C for 15 min and then cooled to 50 °C over the next 15 min. Post mineralization, the samples were filtered (filter paper, 390, Munktell & Filtrak GmbH, Bärenstein, Germany) and diluted to a final volume of 50 mL with ultrapure water. Elemental analysis was conducted using ICP-OES (700 Series, Agilent Technologies, United States) equipped with axial argon plasma and an automated sampler (SPS-3, Agilent Technologies, United States). Calibration was achieved using a multielement standard solution prepared from individual element standards for ICP (Sigma-Aldrich Production GmbH, Switzerland). Detection limits (μg/kg) for each element were as follows: Ag 0.3; Al 0.2; As 1.5; Ba 0.03; Ca 0.01; Cd 0.05; Co 0.2; Cr 0.15; Cu 0.3; Fe 0.1; K 0.3; Li 0.06; Mg 0.01; Mn 0.03; Mo 0.5; Na 0.15; Ni 0.3; Pb 0.8; Sb 2.0; Se 2.0; Sr 0.01; and Zn 0.2. The accuracy of the method was verified using a certified reference material (CRM-ERM CE278K, Sigma-Aldrich Production GmbH, Switzerland).
Phytochemicals and antioxidant activity
Extract preparation
-
To prepare the extract, 0.1 g of the sample was extracted with 20 mL of 95 °C distilled water, after 5-min extraction, filtered through filter paper (Whatman No. 1), and used for phytochemical analysis.
Total phenolic content (TPC)
-
TPC was measured as outlined in a previous study using the Folin-Ciocalteu reagent[24]. A 0.1 mL sample was mixed with 0.1 mL of the Folin-Ciocalteu reagent, 1 mL of 20% (w/v) sodium carbonate, and 8.8 mL of distilled water, and left in the dark for 30 min. The absorbance at 700 nm was measured using the spectrophotometer Jenway (6405 UV/Vis, England). Gallic acid (25–300 mg/L; R2 = 0.998) was used as a standard, and the results were expressed in mg/L of gallic acid equivalent. Analysis was carried out in triplicate.
Total flavonoid content (TFC)
-
Total flavonoids were determined using the modified method by Willet[25]. The sample (0.5 mL) was mixed with 0.1 mL of 10% (w/v) ethanolic solution of aluminum chloride, 0.1 mL of 1 M potassium acetate, and 4.3 mL of distilled water. After 30 min in darkness, the absorbance at 415 nm was measured using the spectrophotometer Jenway (6405 UV/Vis, England). Quercetin (0.5–20 mg/L; R2 = 0.989) was used as the standard, and the results were expressed in mg/g quercetin equivalents. Analysis was carried out in triplicate.
Total phenolic acid (TPA)
-
Total phenolic acid content was determined using the method of Jain et al.[26] A 0.5 mL sample extract was mixed with 0.5 mL of 0.5 M hydrochloric acid, 0.5 mL Arnova reagent (10% NaNO2 + 10% Na2MoO4), 0.5 mL of 1 M sodium hydroxide (w/v), and 0.5 mL of water. Absorbance at 490 nm was measured using the spectrophotometer Jenway (6405 UV/Vis, England). Caffeic acid (1–200 mg/L, R2 = 0.999) was used as a standard, and the results were expressed in mg/g caffeic acid equivalents. Analysis was carried out in triplicate.
DPPH radical scavenging activity
-
The 2,2-diphenyl-1-picrylhydrazyl (DPPH) radical scavenging activity of samples was measured using DPPH reagent[27]. The sample (0.4 mL) was mixed with 3.6 mL of DPPH solution (0.025 g DPPH in 100 mL of ethanol). The absorbance of the reaction mixture was determined using the spectrophotometer Jenway (6,405 UV/Vis, England) at 515 nm. Trolox (6-hydroxy-2,5,7,8-tetramethylchroman-2-carboxylic acid) (10–100 mg/L; R2 = 0.989) was used as the standard, and the results were expressed in mg/g Trolox equivalents. Analysis was carried out in triplicate.
Oxidative stability determination
-
A sample of 3.0 g was used to determine the oxidative stability induction time (OIT) using the 892 Rancimat apparatus from Metrohm (Switzerland) according to ISO 6886:1997 Standard[28]. The temperatures used for all experiments were 120 °C, with a steady air flow of 20 L/h. The apparatus software generated the induction times with a precision of 0.005.
Antimicrobial activity
-
Antimicrobial activity was tested by the disc diffusion method[29]. Altogether eight strains of microorganisms were used in the experiment, including three yeasts (Candida glabrata CCM 8270, Candida albicans CCM 8186, and Candida tropicalis CCM 8223), one Gram-negative bacterium (Escherichia coli CCM 3954, Pseudomonas aeruginosa CCM 1959, Salmonella enterica subs. Enterica CCM 3807), and three Gram-positive bacteria (Staphylococcus aureus CCM 2461, Clostridium perfringens CCM 4991, and Enterococcus faecalis CCM 4224). All tested strains were from the Czech Collection of Microorganisms. The bacterial and yeast suspensions were cultured in the nutrient broth (Imuna, Slovakia) at 37 °C for 24 h before testing. A suspension of 0.1 mL of the tested microorganism with a density of 105 CFU/mL was spread on the Mueller-Hinton Agar (MHA, Oxoid, Basingstoke, United Kingdom). Filter paper discs of 6 mm in diameter were impregnated with 15 µL of the tea extract and placed on the inoculated agar. Agars were left at 4 °C for 2 h and then incubated aerobically at 37 °C for 24 h. The diameters of the inhibition zones were measured in millimetres after incubation. Analysis was carried out in triplicate.
Experimental design and statistical analysis
-
A completely randomized design (CRD) was adopted for this study. The study investigated the effect of the degree of roasting on Coffea canephora bean properties with a single independent variable (Coffea canephora) with four treatment levels (green, light roast, medium roast, and dark roast). The data obtained was subjected to a one-way analysis of variance using Minitab software (Minitab 21.2.0 Inc). Where the F-ratio was significant, all pairwise differences between the treatment means were compared using Fisher's least significant difference at p ≤ 0.05.
-
The roasting process has a considerable effect on the proximate composition of the coffee samples, affecting moisture, ash, protein, fat, carbohydrates, and energy content. Table 1 presents the compositional changes observed at different roasting levels. Moisture content significantly (p ≤ 0.05) decreased as roasting intensity increased, dropping from 9.81 ± 0.02 g/100 g in green beans to 1.84 ± 0.28 g/100 g in dark roast coffee. The observed values are consistent with earlier studies that report green Robusta coffee moisture levels between 8.5 and 13.0 g/100g, while roasted beans exhibit a moisture content of about 0.9 to 2 g/100 g[30,31]. The low water content may enhance shelf life by limiting microbial growth and degradation, while preserving volatile compounds and improving flavor retention during storage.
Table 1. Effect of roasting on the proximate composition of Robusta coffee.
Robusta coffee Proximate composition (g/100 g) Moisture Ash Protein Fat CHO Energy (kcal) Green 9.81 ± 0.02c 3.27 ± 0.09a 14.70 ± 1.26a 2.48 ± 0.24a 69.74 ± 1.445a 360.1 ± 1.480a Light roast 3.32 ± 0.04b 3.28 ± 0.02a 18.05 ± 0.32b 5.94 ± 0.05b 69.40 ± 0.350a 403.3 ± 0.336b Medium roast 1.84 ± 0.28a 3.69 ± 0.06b 20.70 ± 1.56b 7.40 ± 0.68bc 66.37 ± 2.468a 414.9 ± 2.530c Dark roast 1.92 ± 0.08a 4.11 ± 0.12c 18.06 ± 1.15b 8.60 ± 0.33c 67.31 ± 1.279a 418.9 ± 2.452c p-value < 0.001 0.001 0.030 < 0.001 0.239 < 0.001 Values are means ± standard deviation (n = 3). Means along the same row with different superscripts are significantly different (p ≤ 0.05). CHO, total carbohydrates. The ash content of the coffee samples increased with a higher degree of roasting. The lowest ash content (3.27 ± 0.09 g/100 g) was expressed by green coffee beans, and the highest (4.11 ± 0.12 g/100 g) by dark roast coffee. This may be attributed to the loss of organic mass during the roasting process, which results in a concentration of minerals[31]. The values observed exceed those of Robusta (0.52 g/100 g) as noted by Rohaya et al.[32], highlighting possible differences attributed to origin, cultivation conditions, and environmental influences. The high ash content of coffee samples in this study may indicate a rich mineral composition that may enhance nutritional value, providing consumers with minerals beneficial for overall health.
The protein content exhibited a significant (p ≤ 0.05) variation, increasing from 14.70 ± 1.26 g/100 g in green coffee and peaking at 20.70 ± 1.56 g/100 g for medium roast. This may be ascribed to moisture loss and degradation of non-protein components like carbohydrates, leading to a higher apparent concentration of protein. The protein levels observed are significantly higher than those reported earlier[33] for roasted coffee (11.56–12.92 g/100 g) but lower than values reported by Norazlin et al.[31] who reported higher protein content in green coffee (18.02 g/100 g) than roasted Robusta coffee bean (14.49 g/100 g). Protein values align well with values obtained previously for Robusta coffee beans[22].
The fat content exhibited a significant (p ≤ 0.05) increase with the degree of roasting. Dark roast coffee (8.60 ± 0.33 g/100 g) showed considerably higher fat content, denoting 3.46 and 1.44 times higher than green and light roast coffee, respectively. Contrarily, earlier studies reported higher fat content in green coffee than in roasted coffee beans[31]. The general increase in fat content observed with the degree of roasting in this study may be mainly due to moisture evaporation, which concentrates the residual constituents rather than substantial lipid alterations, since lipid compounds, including triglycerides, generally show heat stability[34]. The fat content in roasted coffee beans has been opined to be affected by the degree of roasting, whereby higher temperatures result in increased oil content in a consistent manner[35]. The breakdown of cellular matrices during roasting may have enhanced the extractability of lipids, contributing to the higher fat content in roasted samples compared to green beans. The higher fat content may easily expose the samples to lipid-oxidizing agents, potentially compromising sensory quality and storage stability. Considering this, appropriate storage measures are essential to mitigate this quality risk.
The carbohydrate (CHO) content ranged from 69.74 ± 1.445 g/100 g in green coffee to 67.31 ± 1.279 g/100 g in dark roast, with no observable differences. These values align well with the carbohydrate content of roasted coffee from Ghana[22]. The results in this study are contrary to other studies that reported a noticeable increase in total carbohydrate content resulting from moisture and organic mass reduction during the roasting process[31,36]. The slight decrease noted in this study may result from carbohydrate breakdown via caramelization and Maillard reactions, possibly leading to the formation of high molecular weight melanoidins[36,37]. Nonetheless, Robusta coffee beans may serve as a significant source of carbohydrates and energy[38].
The energy content exhibited a significant (p ≤ 0.05) increase with roasting, rising from 360.1 ± 1.480 kcal/100 g in green beans to 418.9 ± 2.452 kcal/100 g in dark roast. The observed increase corresponds with higher levels of protein and fat, validating the impact of roasting on boosting caloric density via moisture reduction and concentration of macronutrients[39].
Impact of roasting on minerals, including risk elements
Essential macro-elements (Ca, Na, K, Mg)
-
Table 2 shows the effect of the roasting process on the macro element contents of the coffee beans. The calcium content increased (p ≤ 0.05) from 193 ± 9.53 mg/kg in green coffee to 1,790 ± 8.42 mg/kg in dark roast. This nine-fold increase observed aligns with the findings[38] showing similar trends in mineral concentration enhancement via roasting, attributed to mass reduction in coffee beans and extraction at a roasting temperature of 250 °C[40]. As a necessary cofactor, calcium enables many enzymes to achieve full catalytic efficiency; in its absence, their activity is significantly compromised[41]. The high calcium content in the coffee beans is vital, as calcium is crucial for improving bone health and lowering systolic blood pressure[42].
Table 2. Impact of roasting on minerals, including risk elements of coffee beans.
Elements (mg/kg) Robusta coffee beans Green Light roast Medium roast Dark roast Cobalt (Co) nd nd nd nd Calcium (Ca) 193 ± 9.53d 1,726 ± 6.90b 1,631 ± 3.55a 1,790 ± 8.42c Sodium (Na) 454.0 ± 4.09d 384.3 ± 1.20c 373.2 ± 0.38b 325.8 ± 1.71a Potassium (K) 17,480 ± 4.03d 15,848.7 ± 2.71c 14,690 ± 3.03a 15,062 ± 1.77b Aluminium (Al) 0.95 ± 0.77a 8.66 ± 1.04c 2.89 ± 0.46b 2.72 ± 0.38ab Silver (Ag) 0.08 ± 0.03b 0.01 ± 0.02a 0.02 ± 0.01a 0.01 ± 0.017a Magnesium (Mg) 245.8 ± 0.84d 235.8 ± 0.48c 225.9 ± 0.07b 204.7 ± 0.61a Barium (Ba) 5.37 ± 0.01d 4.33 ± 0.01b 3.60 ± 0.00a 4.84 ± 0.03c Cadmium (Cd) nd nd nd nd Chromium (Cr) nd nd nd nd Copper (Cu) 17.63 ± 0.09c 14.03 ± 0.01a 17.69 ± 0.03c 15.62 ± 0.12b Iron (Fe) 42.29 ± 0.24bc 41.74 ± 0.23b 42.61 ± 0.19c 35.70 ± 0.42a Lithium (Li) 0.09 ± 0.02b 0.03 ± 0.00a 0.03 ± 0.00a 0.02 ± 0.00a Manganese (Mn) 13.08 ± 0.05d 12.81 ± 0.07c 11.46 ± 0.02a 11.76 ± 0.02b Nickel (Ni) nd 2.29 ± 0.21a 2.53 ± 0.04b 3.14 ± 0.14c Strontium (Sr) 7.85 ± 0.05d 6.63 ± 0.02b 6.22 ± 0.01a 7.07 ± 0.05c Lead (Pb) nd nd nd nd Zinc (Zn) 5.90 ± 0.62b 4.70 ± 0.53b 2.49 ± 0.58a 3.01 ± 0.80a Antimony (Sb) 0.32 ± 0.60a 0.49 ± 0.10a nd 0.21 ± 0.52a Arsenic (As) nd nd nd nd Mercury (Hg) nd nd nd nd Selenium (Se) nd nd nd nd Values are means ± standard deviation (n = 3). Means along the same row with different superscripts are significantly different (p ≤ 0.05). nd, not detected. Sodium and potassium are both essential electrolytes and predominant alkali metals in coffee[38]. Potassium plays a crucial role in muscle growth and blood pressure regulation, whereas sodium is essential for maintaining acid–base equilibrium and osmotic balance, facilitating nerve impulse transmission, activating enzymes, and mediating cellular signaling[41]. The coffee beans demonstrated a general decline in concentration with increasing roasting intensity[38]. Sodium decreased significantly (p ≤ 0.05) from 454.0 ± 4.09 mg/kg in green coffee to 325.8 ± 1.71 mg/kg in dark-roasted beans, while potassium, the most abundant mineral in coffee, declined from 17,480 ± 4.03 to 15,062 ± 1.77 mg/kg. These findings contrast with the increased potassium reported by Al-Dalain et al.[43] a discrepancy that may stem from variations in sample origin or analytical methodology used[44]. Given that both sodium and Potassium are non-volatile and highly water-soluble, their reduction is unlikely due to thermal degradation. Instead, it may result from the physical detachment and loss of the silverskin during roasting, which is known to retain substantial mineral content and is often excluded from mineral analysis[45]. Additionally, structural and physicochemical transformations of the coffee matrix during roasting may reduce the extractability of these elements[38]. Moreover, Van Cuong et al.[40] noted that increased roasting temperatures may elevate potassium concentration per unit dry mass due to moisture loss, although this does not necessarily imply higher total potassium retention. Despite this decline in this study, potassium remains nutritionally significant in roasted coffee, with reported extraction efficiencies between 72.9% and 88.6% in brewed infusions[46].
Similarly, magnesium (Mg) exhibited a decreasing trend from green (245.8 ± 0.84 mg/kg) to dark roast (204.7 ± 0.61 mg/kg). These values are consistent with the exploratory analysis of minerals and organic compounds of roasted and ground coffee[47]. Previous studies[48,49] reported magnesium contents ranging from 47.6 to 284.0 mg/kg. Magnesium typically increases slightly post-roasting due to concentration effects[50]. However, the observed reduction may reflect minor losses through the removal of coffee chaff or measurement variability.
Essential trace elements (Fe, Zn, Cu, Mn, Cr, Se, Co)
-
Iron content significantly (p ≤ 0.05) decreased from 42.29 ± 0.24 mg/kg in green coffee to 35.70 ± 0.42 mg/kg in dark roast. This pattern contrasts with findings by Dippong et al.[38], who observed minor increases or stability in iron content with increasing roast. The differences could be attributed to bean origin, roasting conditions, or possible Iron loss during processing. Iron is essential for biological functions like oxygen transport and cellular respiration.
Zinc, manganese, and copper followed a similar declining trend as the degree of roasting increased. These reductions are consistent with thermal losses or matrix entrapment during roasting[51]. Coffee contributes meaningfully to dietary mineral intake, providing up to 13.7% of daily manganese, 4.0% (women) and 3.1% (men) of zinc, 2.7% (women) and 2.1% (men) of copper, and 0.4% (women) and 0.6% (men) of iron requirements per serving[52]. However, excessive zinc intake may interfere with copper metabolism by suppressing copper-dependent enzymes such as ceruloplasmin[53].
Undetectable levels of cobalt (Co), selenium (Se), and chromium (Cr) in the analyzed Robusta coffee samples indicate a favourable safety profile, consistent with previous findings on high-quality beans[54]. It is important to acknowledge that trace quantities of Cr and Co may occasionally be present in coffee, though typically at concentrations far below established safety thresholds.
Non-essential, potentially toxic elements (Al, Ag, Ba, Ni, Sr, Li)
-
Aluminium (Al) markedly increased in light roast (8.66 ± 1.04 mg/kg) before sharply declining in medium and dark roasts. This pattern likely reflects cross-contamination from roasting equipment rather than bean composition. Soluble forms of aluminium have been associated with neurotoxicity and oxidative stress and have been investigated for a potential link to Alzheimer's disease[55]. Although usual dietary aluminium exposure poses little risk to healthy individuals, intakes exceeding 1 mg/kg body weight per week may be harmful, particularly for vulnerable groups[56]. An increased degree of roasting significantly increased the Nickel (Ni) levels of the roasted samples. Nickel functions as a cofactor for enzymes that facilitate iron absorption[57]. However, excessive intake can lead to genotoxicity and hematotoxicity, with a tolerable daily intake established at 13 μg/kg body weight[58].
Barium levels were significantly lower in the roasted coffee beans compared to green beans; however, no distinct variations existed among the roast samples. The World Health Organization sets a guideline value of 0.7 mg/L for barium in drinking water. While specific limits for food are not well established, monitoring may be necessary[59]. Silver, lithium, and strontium showed fluctuating levels with no clear thermal trend, possibly due to measurement variability.
Heavy metals/Toxic risk elements (Pb, Cd, As, Sb)
-
Metal contamination in food, particularly from lead (Pb), cadmium (Cd), arsenic (As), mercury (Hg), and antimony (Sb), poses considerable health risks, ranging from acute toxicity to chronic conditions affecting the kidneys, bones, and nervous system[60]. In this study, none of these toxic elements was detected in any coffee sample. This reflects the safety of the cultivation soils and proper agronomic practices employed in the coffee bean production. This further reinforces the safety of the Ghanaian Robusta beans, even after thermal processing. Their absence is a positive indicator for food safety and consumer health[50].
Phytochemicals and antioxidant properties of Robusta coffee
-
Figure 3 shows the effect of roasting on the phytochemical and antioxidant activity of the coffee samples. The TPC content significantly (p ≤ 0.05) ranged from 54.11 ± 1.50 mg GAE/g in green beans to 99.21 ± 4.29 mg GAE/g in light roast, with light roast exhibiting the greatest TPC concentration across roasted samples (Fig. 3a). In contrast, Norazlin et al.[31] reported a nearly 50% reduction in TPC from 5.48 mg GAE/g in green Robusta to 2.96 mg GAE/g after roasting. These inconsistencies may arise from variations in bean origin, roasting conditions/technique, or analytical procedures[61]. As roasting progressed to medium and dark roast, the phenolic compounds generally decreased under these roasting conditions, indicating the thermolabile nature of these compounds. Phenolic compounds are recognized for their biological activities, including antioxidant and anti-inflammatory attributes[38]. The elevated polyphenol levels in roasted samples may indicate the release or improved extractability of bound polyphenols or phenolic derivatives, especially during the initial phases of roasting. The concentration of phenolic acids was significantly (p ≤ 0.05) elevated throughout roasting, escalating from 37.51 ± 1.04 mg CAE/g in green coffee to a maximum of 53.60 ± 1.32 mg CAE/g in medium (Fig. 3b). This trend contrasts with findings[62] showing higher phenolic acid in unroasted samples. The elevated phenolic acids noted herein indicate variability affected by roasting profiles, geographic origin, and extraction techniques[63]. As shown in Fig. 3c, the total flavonoid content (TFC) showed a significant increase (p ≤ 0.05) with a higher degree of roasting, with light roast recording the highest. Overall, roasting increased TFC approximately 3.5 times compared to green coffee beans (10.34 ± 0.33 mg QE/g). Although flavonoids are recognized for their temperature sensitivity, roasting under certain conditions may lead to partial hydrolysis or structural alterations, hence increasing their quantifiable content[64]. The increasing levels of flavonoids in the samples are vital since flavonoids such as quercetin, catechin, epicatechin, and rutin help reduce the risk of oxidative stress-related disorders, thereby contributing to improved human health and disease prevention[65]. The antioxidant activity exhibited a significant (p ≤ 0.05) change, reaching a maximum of 19.92 ± 0.05 mg TEAC/g in the light roast, 1.6-, 1.2-, and 1.5-fold greater than the dark roast, green beans, and medium roast, respectively (Fig. 3d). This finding is consistent with earlier which observed increased antioxidant activity in roasted coffee despite diminished phenolic content[66]. The apparent increase in phenolic content after coffee roasting likely results from the release of bound phenolics. Another study reported a contrary outcome where a higher DPPH radical scavenging activity was expressed by green robusta coffee than light and dark roasted robusta coffee[67]. For consumers, the increased levels of phytochemicals may provide additional health benefits. However, it must be noted that the biological effects may vary due to heat-derived phenolics and Maillard reaction products, which differ in bioavailability from native compounds, and further studies are needed to validate these effects in the coffee samples.
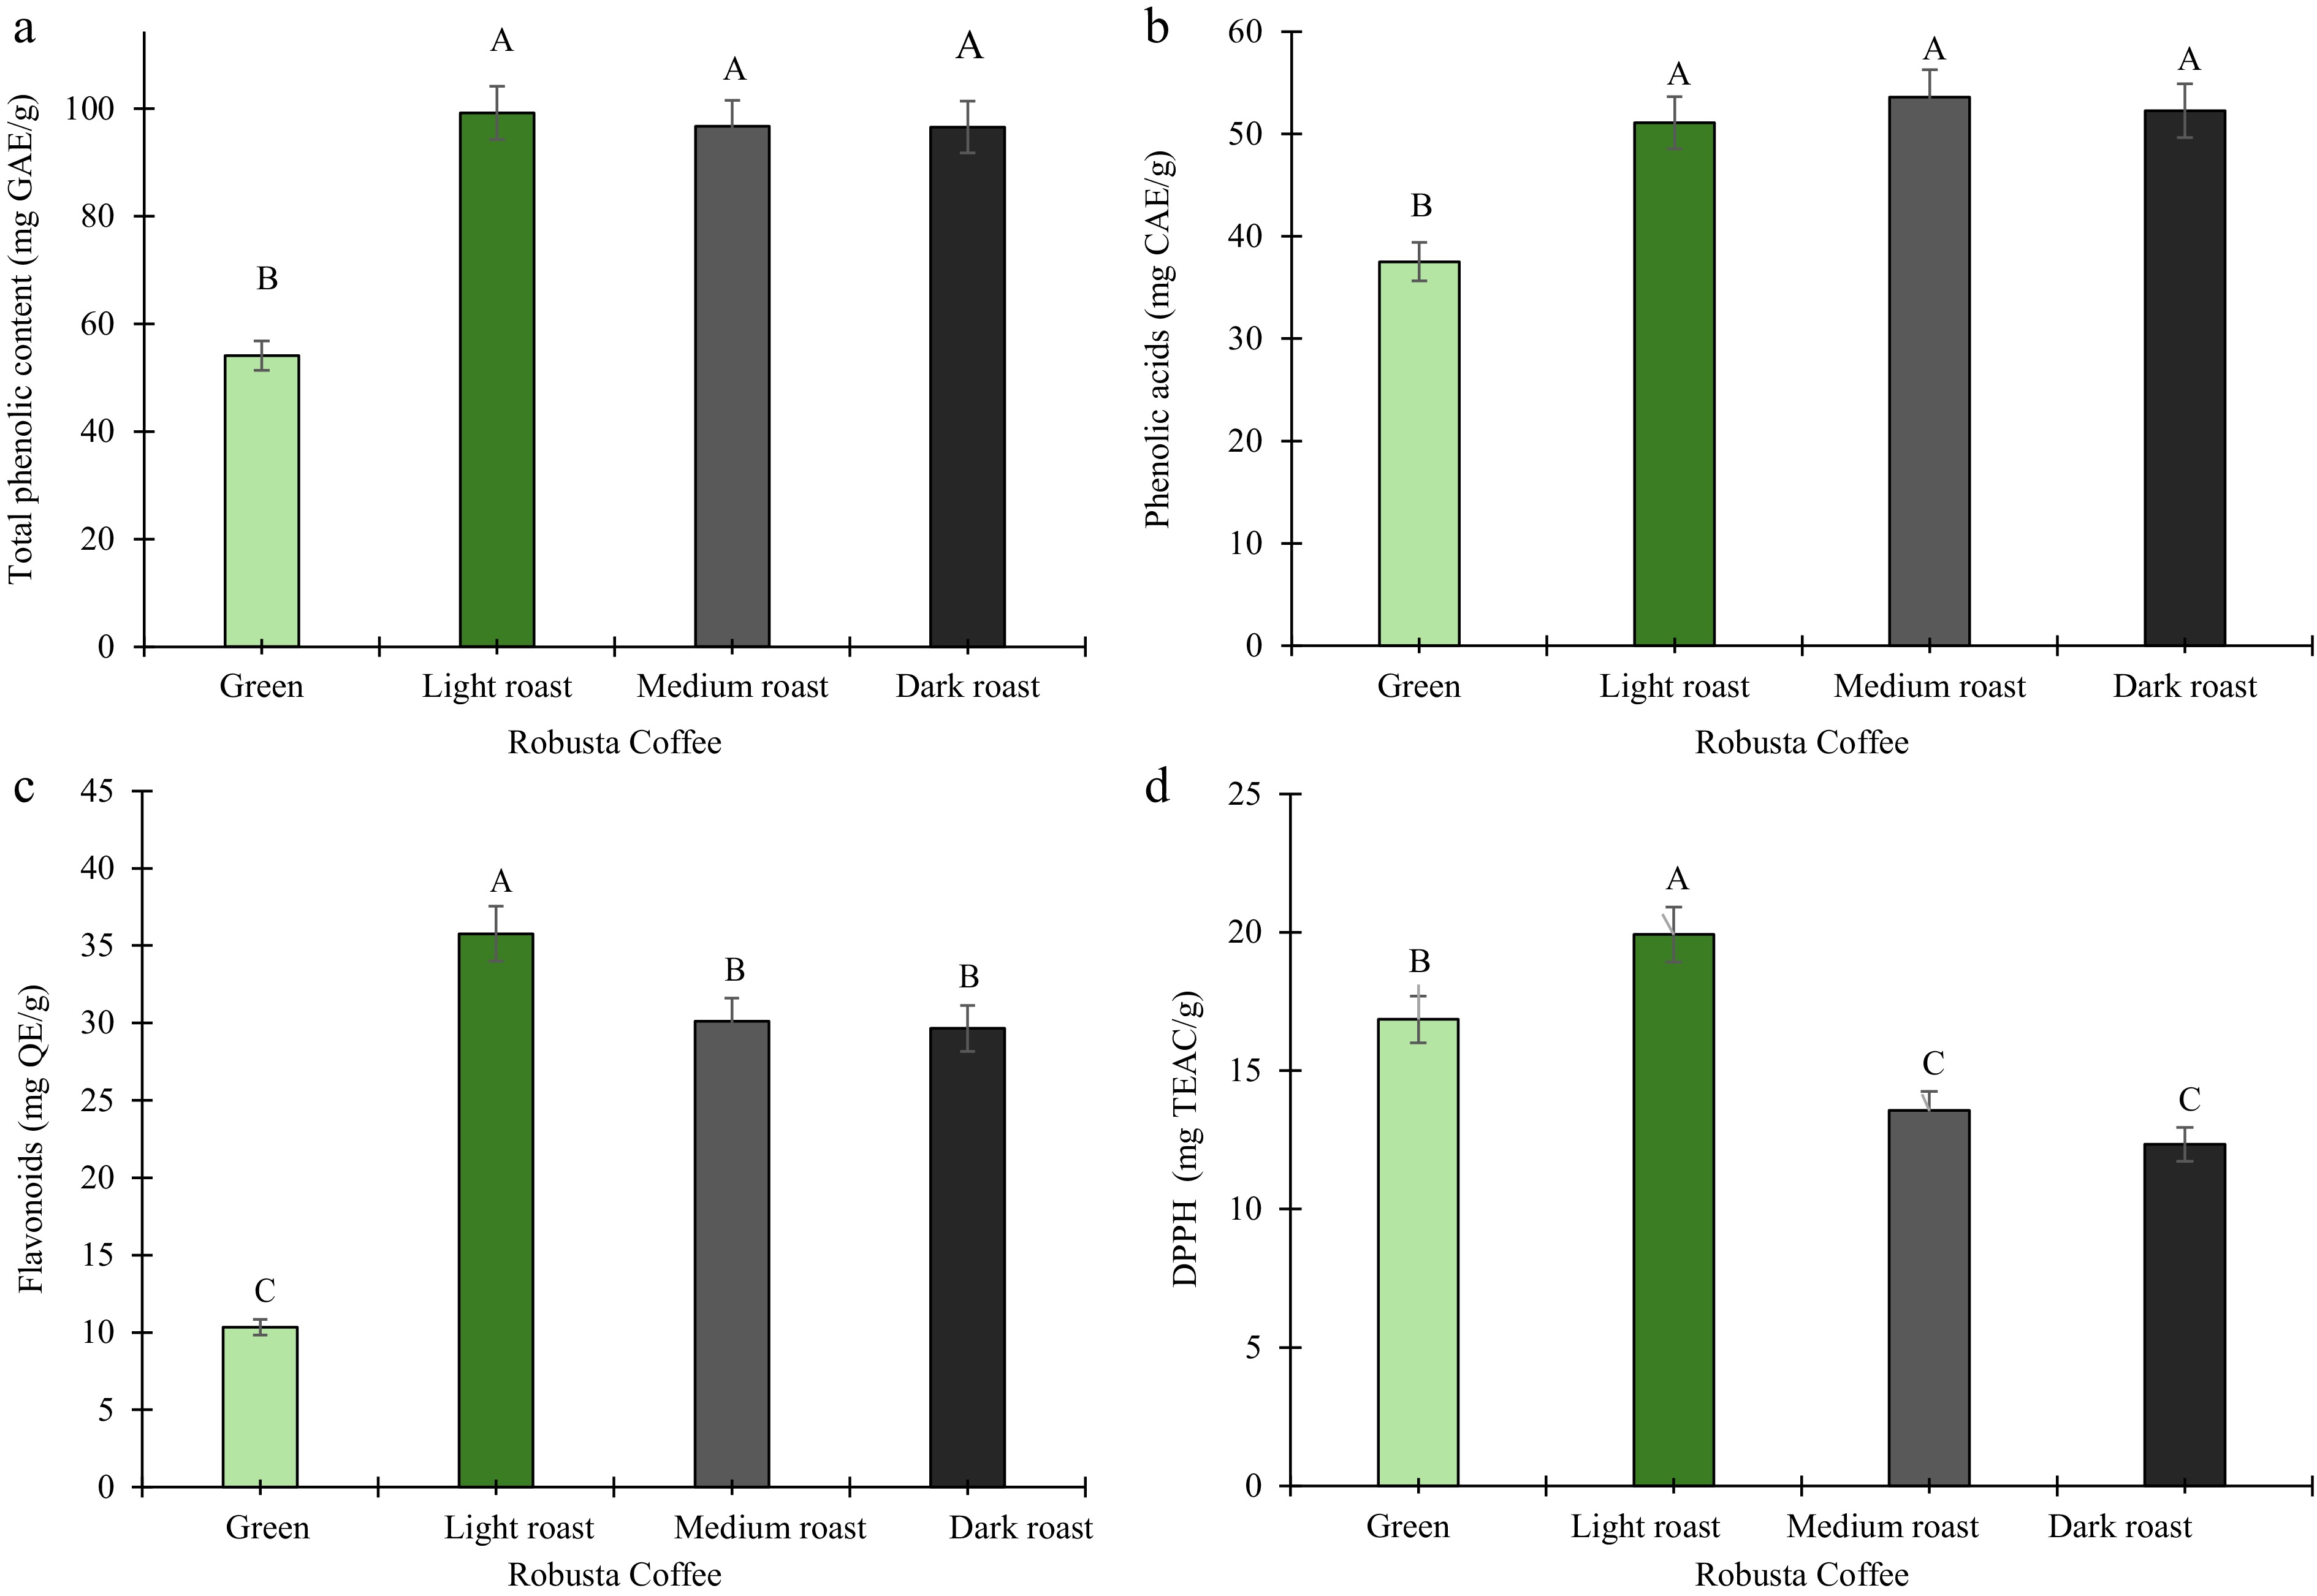
Figure 3.
Phytochemical and antioxidant activity of green, light, medium, and dark roasted robusta coffee beans. (a) Total phenolic content. (b) Total phenolic acids. (c) Total flavonoid content. (d) DPPH radical scavenging activity. Results are expressed as means (n = 3). Error bars represent standard deviation. Different capital letters (A, B, C) above the bars represent significant differences (p ≤ 0.05).
Oxidative stability of coffee beans
-
OIT, a marker of lipid oxidation, assesses the resistance of samples to oxidation by determining the duration between initial oxygen exposure and the onset of exothermic degradation under isothermal conditions[60]. OIT significantly (p ≤ 0.05) decreased with roasting, from 71.73 ± 0.29 h in green beans to 45.66 ± 0.09 h in dark roast (Fig. 4). This finding aligns with existing studies, highlighting the correlation between roasting and antioxidant degradation[68]. This decline is likely due to the degradation of native antioxidant compounds, such as chlorogenic acids and flavonoids, as well as the breakdown of lipid structures at higher roasting temperatures. In contrast, light roasting may better preserve phenolic acids and Maillard reaction products, which may have contributed to protection against rapid lipid oxidation. The low oxidation induction time of roasted coffee beans suggests that roasting increases their susceptibility to lipid oxidation, leading to quality loss in flavor, aroma, and shelf life. Optimizing roasting and storage conditions, along with using oxygen-barrier packaging, can enhance the stability of roasted coffee beans.
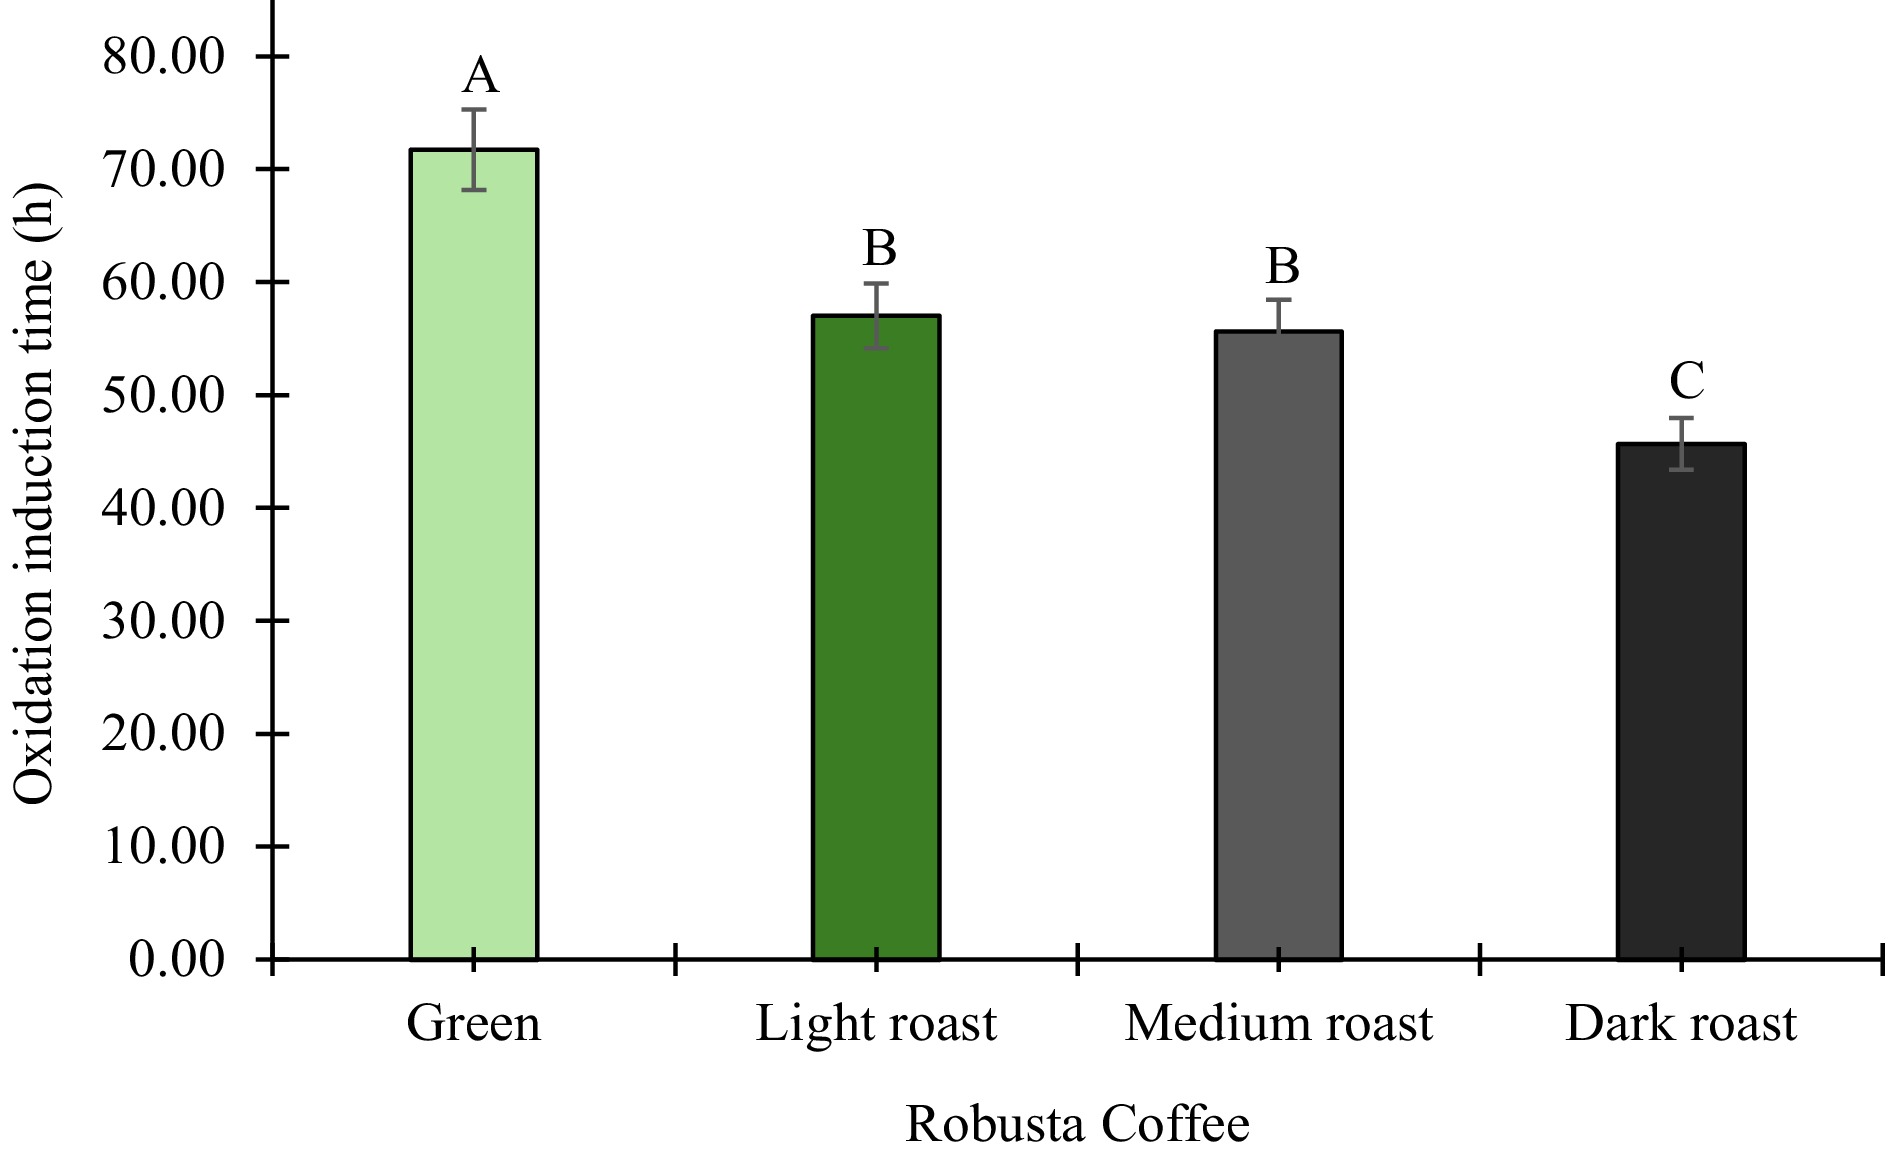
Figure 4.
Oxidative stability of green, light, medium, and dark roasted robusta coffee beans. Results are expressed as means (n = 3). Error bars represent standard deviation. Different capital letters (A, B, C) above the bars represent significant differences (p ≤ 0.05).
Antimicrobial activity of coffee beans
-
Green and roasted samples exhibited significantly (p ≤ 0.05) different inhibitory activities against all the tested yeast and bacteria investigated in this study (Table 3). This variability is primarily attributed to alterations in coffee's chemical composition during roasting, which may have impacted bioactive compounds with potent antimicrobial properties[23].
Table 3. Antimicrobial activity of green, light, medium, and dark roasted robusta coffee.
Microorganism Zone of inhibition (mm) Green coffee Light roast coffee Medium roast coffee Dark roast coffee CCM 8270 3.58 ± 0.71b 3.84 ± 0.87a 3.58 ± 0.72b 3.04 ± 0.44c CCM 8186 3.84 ± 0.87a 2.78 ± 0.29c 2.78 ± 0.29c 3.58 ± 0.72b CCM 8223 3.04 ± 0.44a 3.04 ± 0.44a 3.04 ± 0.44a 2.78 ± 0.29b CCM 4224 7.58 ± 0.93a 5.18 ± 0.60b 5.18 ± 0.60b 2.78 ± 0.29a CCM 3954 4.38 ± 0.16d 5.44 ± 0.75a 4.64 ± 0.31c 5.18 ± 0.60b CCM 4699 5.98 ± 0.04a 3.84 ± 0.87b 3.84 ± 0.87b 5.98 ± 0.04a CCM 1959 5.18 ± 0.60a 4.38 ± 0.16b 3.85 ± 0.87c 3.85 ± 0.87c CCM 3807 4.64 ± 0.31b 5.44 ± 0.75a 4.38 ± 0.16c 3.84 ± 0.87d CCM 2461 6.78 ± 0.49a 3.84 ± 0.87 3.84 ± 0.87 5.98 ± 0.04b Candida glabrata CCM 8270, Candida albicans CCM 8186, Candida tropicalis CCM 8223, Enterococcus faecalis CCM 4224, Escherichia coli CCM 3954, Listeria monocytogenes CCM 4699, Pseudomonas aeruginosa CCM 1959, Salmonella enterica subs. Enterica CCM 3807, Staphylococcus aureus subs. aureus CCM 2461. Values are means ± standard deviation (n = 3). Means along the same row with different superscripts are significantly different (p ≤ 0.05). nd, not detected. The coffee extracts exhibited inhibitory effects on all tested yeasts, with Candida glabrata CCM 8270 presenting inhibition zones between 3.04 ± 1.44 mm for dark roast and 3.84 ± 1.87 mm for light roast. Candida albicans CCM 8186 exhibited the highest sensitivity to the green coffee extract (3.84 ± 1.87 mm), while the medium roast demonstrated the least inhibition (2.78 ± 1.29 mm). In a similar manner, Candida tropicalis CCM 8223 demonstrated consistent inhibition (approximately 3.04 mm) across all roast levels, apart from the dark roast, which showed a marginally reduced activity (2.78 ± 1.29 mm). The findings indicate that roasting may reduce antifungal activity, probably due to the degradation of thermolabile phenolic compounds that are essential for the antimicrobial potential of coffee[69].
Against Gram-positive bacteria, the coffee extracts produced stronger inhibition. Enterococcus faecalis CCM 4224 showed significantly (p ≤ 0.05) higher inhibition in green coffee (7.58 ± 3.93 mm), with activity decreasing progressively as roasting intensity increased, reaching minimal inhibition in the dark roast (2.78 ± 1.29 mm). Listeria monocytogenes CCM 4699 also exhibited notable susceptibility to green and dark roast extracts (both 5.98 ± 3.04 mm), whereas light and medium roasts showed weaker inhibition (3.84 ± 1.87 mm). The strongest inhibition was observed in Staphylococcus aureus subsp. aureus CCM 2461, where green (6.78 ± 3.49 mm) and dark roast (5.98 ± 3.04 mm) extracts showed high antimicrobial potential. This effect likely results from the combined action of chlorogenic acids in green coffee and melanoidins formed during roasting, both of which are known to possess antimicrobial properties[50,68]. These results are consistent with previous reports indicating that green and roasted coffees exhibit considerable antibacterial activity[31].
The Gram-negative bacteria exhibited moderate sensitivity to the coffee extracts. Escherichia coli CCM 3954 showed inhibition zones ranging from 4.38 ± 2.16 mm in green coffee to 5.44 ± 2.75 mm in light roast. Pseudomonas aeruginosa CCM 1959 and Salmonella enterica subsp. Enterica CCM 3807 also displayed moderate susceptibility, with medium and dark roasts producing effects comparable to those observed by Daglia et al.[70] who reported greater activity in dark-roasted coffee. The relatively lower inhibition of Gram-negative bacteria can be attributed to their outer membrane, which limits the permeability of bioactive compounds. This trend aligns with the general observation that gram-negative bacteria are more resistant than gram-positive strains[50,68]. Overall, the inhibitory activity of the coffee extracts carries important food safety implications, as it highlights the potential of coffee bioactives in mitigating bacterial and fungal infections.
-
This study investigated the effects of roasting on the nutritional, mineral, and functional properties of Ghanaian Coffea canephora beans. The study demonstrates that Ghanaian coffee possesses a rich nutritional and phytochemical profile, with roasting significantly modifying its key nutrients, bioactive compounds, antioxidant capacity, and antimicrobial activity. These results positioned Ghanaian Robusta as a promising raw material for functional foods, nutraceuticals, and specialty coffee products. The findings are relevant for coffee producers, food manufacturers, and consumers seeking health-promoting products, as they demonstrate that roasting can enhance nutritional and functional properties while retaining bioactive compounds. In practicals sense, light roast offers the highest antioxidant activity and phenolic content, making it suitable for health-focused beverages, whereas medium roast provides peak phenolic acids with a balanced flavor, fitting traditional coffee with added health benefits. In contrast, dark roast, favoured for its strong flavor, aligns with conventional markets, while green coffee, rich in minerals and possessing antioxidant and antimicrobial properties, is ideal for niche applications emphasizing health benefits. These findings highlight the strengths of each roasted coffee but are not intended to dictate a specific choice. Instead, they provide guidance for tailoring roasting strategies to consumer preferences and market needs. Accurate genotype identification is essential for the effective use of Coffea canephora L.; however, the genotype of the sample analyzed in this study could not be verified, representing an important information limitation. Future research should focus on genotypic identification of the samples, optimizing roasting protocols, multidimensional sensory evaluation, assessing the bioaccessibility and bioavailability of key compounds to support the development of high-value, functional coffee-based products for the Ghanaian and global market.
-
The authors confirm contribution to the paper as follows: study conception and design: Ivanišová E, Osei ED; methodology: Osei ED, Joanidis P, Ivanišová E, Jančo I, Kačániová M, Amotoe-Bondzie A; software: Osei ED, Laar WS; validation: Jančo I, Kačániová M, Ivanišová E, Afoakwah NA; formal analysis: Ivanišová E, Amotoe-Bondzie A, Osei ED; investigation: Ivanišová E, Osei ED, Amotoe-Bondzie A, Laar WS; resources: Osei ED, Amotoe-Bondzie A, Ivanišová E; data curation: Ivanišová E, Joanidis P, Osei ED, Amotoe-Bondzie A; visualization: Afoakwah NA, Ivanišová E, Osei ED, Amotoe-Bondzie A; draft manuscript preparation: Osei ED, Amotoe-Bondzie A; writing − review and editing: Ivanišová E, Afoakwah NA, Laar WS, Amotoe-Bondzie A, Osei ED; supervision: Ivanišová E, Afoakwah NA; project administration: Ivanišová E, Osei ED; funding acquisition: Ivanišová E. All authors reviewed the results and approved the final version of the manuscript.
-
The datasets generated during and/or analyzed during the current study are available from the corresponding author on reasonable request.
-
We also acknowledge Mr. James Osei Kwakye, a B.Sc. Business Administration student specializing in Procurement and Supply Chain Management at the Faculty of Business Education, University of Skills Training and Entrepreneurial Development (USTED), Ghana, who dedicated his time and effort to facilitating the purchase and safe transport of the coffee samples from Ghana to Europe. This research was funded by the Operational Program Integrated Infrastructure within the project: Demand-driven research for the sustainable and innovative food, Drive4SIFood (Grant No. 313011V336), co-financed by the European Regional Development Fund.
-
The authors declare that they have no conflict of interest.
- Copyright: © 2026 by the author(s). Published by Maximum Academic Press, Fayetteville, GA. This article is an open access article distributed under Creative Commons Attribution License (CC BY 4.0), visit https://creativecommons.org/licenses/by/4.0/.
-
About this article
Cite this article
Osei ED, Amotoe-Bondzie A, Joanidis P, Jančo I, Ivanišová E, et al. 2026. Evaluation of the quality attributes of Ghanaian Robusta coffee subjected to different degrees of roasting. Beverage Plant Research 6: e012 doi: 10.48130/bpr-0025-0042 

Evaluation of the quality attributes of Ghanaian Robusta coffee subjected to different degrees of roasting
- Received: 07 October 2025
- Revised: 16 November 2025
- Accepted: 10 December 2025
- Published online: 31 March 2026
Abstract: In recent years, there has been increasing interest in functional beverages that provide health benefits and an energy boost. With the underutilized Ghanaian Coffea canephora (Robusta) emerging as a promising beverage, this study investigated the impact of roasting on the proximate composition, minerals, phytochemicals, oxidative stability, antioxidant, and antimicrobial activity of Ghanaian Robusta coffee beans (green, light, medium, and dark roasts). Moisture and total carbohydrate contents significantly (p ≤ 0.05) decreased with roasting, while ash, protein, fat, and caloric value increased. Total phenolics (99.21 ± 4.29 mg GAE/g), flavonoids, and antioxidant activity (19.92 ± 0.05 mg TEAC/g) peaked in light roast, whereas phenolic acids were highest in medium roast (53.60 ± 1.32 mg CAE/g). Calcium increased ninefold across roasts relative to green coffee beans, while green coffee had the highest contents of potassium, magnesium, iron, zinc, manganese, and copper. Toxic elements were not detected, confirming the safety of the coffee samples. Increasing roasting intensity decreased the oxidation induction time of roasted coffee compared to green coffee. All coffee samples exhibited significant inhibitory activity against the tested microorganisms. The findings of this study provide valuable insights into the quality of Ghanaian Robusta coffee and enhance its potential in the global functional beverage market.
-
Key words:
- Robusta coffee /
- Roasting /
- Oxidation /
- Antioxidant /
- Antimicrobial /
- Nutritional composition