













-
Ampelopsis grossedentata, a perennial liana of the Vitaceae family, is processed from its young stems and leaves into a characteristic herbal tea known as 'Meicha' or 'Vine tea' in the Xiangxi region. Currently, intensive cultivation zones have been established in Yongshun County (Xiangxi, Hunan, China), Yongding District (Zhangjiajie, Hunan, China), and Laifeng County (Enshi, Hubei, China), with a total planting area of approximately 20,000 hectares and an annual output value exceeding 30 billion CNY. This herbal tea is rich in flavonoids such as dihydromyricetin and is valued for its anti-inflammatory[1], antioxidant[2], and blood glucose-regulating properties[3], gaining wide consumer acceptance. In production, leaf color and morphological variation in A. grossedentata often serve as key criteria for processing distinct tea types. However, phenotypic mixing and high diversity in leaf color and shape among cultivated lines in major producing areas lead to inconsistent product appearance and quality, which hinders the standardized development of the Meicha industry.
Excellent genetic resources are essential for the sustainable development of the Meicha industry, and germplasm evaluation serves as an important foundation for improving flavor quality. The diverse leaf colors, such as green, light purple, and purple-red leaves, are important phenotypic traits of A. grossedentata. In traditional tea plants, leaf color variation is often closely associated with the accumulation of quality-related compounds[4]. Tea cultivars with different leaf colors exhibit substantial differences in the aroma and taste of tea processed from their young shoots, as reported in studies on 'Zijuan'[5] and 'Zifuxing'[6]. Metabolomic analyses have revealed that purple-leaf strains exhibit significantly enhanced phenylpropanoid and flavonoid biosynthesis, along with greater accumulation of anthocyanins and polyphenols. In contrast, albino[7] or etiolated[8] tea cultivars typically exhibit underdeveloped chloroplasts, impaired pigment synthesis, and reduced accumulation of flavonoids such as polyphenols, but tend to have relatively higher amino acid content. In tea cultivars with different leaf colors, carbon and nitrogen metabolic fluxes are markedly shifted, contributing synergistically to astringency, umami, and sweetness[9]. However, whether the quality characteristics of green, light purple, and purple-red young stems and leaves of A. grossedentata exhibit a similar regulatory mechanism to that observed in purple and green tea cultivars, particularly the specific regulation of the flavonoid biosynthesis pathway, has not yet been explored.
The accumulation of metabolites is fundamentally regulated by the activity of key biosynthetic enzymes. Phenylalanine ammonia-lyase (PAL), chalcone isomerase (CHI), and 4-coumarate-CoA ligase (4CL) are key enzymes in the flavonoid biosynthesis pathway[10]. In A. grossedentata, flavonoids are considered to be its primary metabolites and bioactive components[11]. Studies have shown that enhanced activities of PAL and CHI in Zijuan tea are closely associated with anthocyanin accumulation and the formation of its unique flavor profile, further confirming that leaf color variation is often an external manifestation of the remodeling of complex metabolic networks within plants[12]. However, how such changes in upstream enzyme activities drive the formation of downstream specific flavors remains unreported in A. grossedentata.
Accordingly, five A. grossedentata lines exhibiting distinct leaf color and morphology were selected as the study materials. By employing an integrated multidimensional approach that encompassed sensory evaluation, physicochemical profiling, non-targeted metabolomics, assays of key flavonoid biosynthetic enzyme activities, and in vitro antioxidant activity, this study conducted a comprehensive analysis of the association mechanisms between leaf color differentiation and quality formation in A. grossedentata at the levels of phenotypic traits, metabolites, and enzyme activities. The research findings could offer theoretical foundations for genetic resource evaluation and flavor-oriented improvement strategies.
-
Five genetic resources of A. grossedentata provided by the Germplasm Resource Nursery of the Yongshun County Agriculture and Rural Affairs Bureau in Hunan Province and used for processing 'Meicha', were used as experimental materials. Based on differences in leaf color, they were respectively designated as: line 1 'Chunlv Xiaoye Mei', line 2 'Boliang Mei', line 3 'Zixiangbian Mei', line 4 'Banshan Banzi Mei', and line 5 'Zimo Mei'.
Sample preparation
-
In May 2025, researchers selected nine plants from each of five genetic resources of A. grossedentata to collect stem and leaf samples at three developmental stages. The collection criteria were: young (5–8 cm in length), semi-mature (partially expanded leaves located below the young shoots, 10–12 cm in length), and mature (current year, fully expanded leaves). Samples from each genetic resource and maturity stage were thoroughly mixed, and three biological replicates were collected and rapidly frozen in liquid nitrogen for non-targeted metabolomics analysis. Samples for sensory evaluation and physicochemical property analysis were subjected to microwave fixation, drying at 70 °C, and then stored at 4 °C for subsequent use.
Reagents and instruments
-
Methanol (HPLC grade) and acetonitrile (HPLC grade) were purchased from TEDIA (USA). Sodium carbonate, Folin-Ciocalteu reagent, disodium hydrogen phosphate, potassium dihydrogen phosphate, ninhydrin, aluminum chloride, anthrone, concentrated sulfuric acid, boric acid, ethylenediaminetetraacetic acid disodium salt, bovine serum albumin, p-coumaric acid, and chalcone were of analytical grade and sourced domestically. PVPP (USP grade), coenzyme A (BR grade), and adenosine 5'-triphosphate disodium salt isopropanol (BR grade) were supplied by Macklin Biochemical Technology Co., Ltd (Shanghai, China).
The instruments used included an ST-700D array spectrophotometric colorimeter (3nh Technology Co., Ltd, Guangdong, China); a UV-1750 spectrophotometer and an LC-M20A analytical HPLC system (Shimadzu, Japan); and a Welchrom C18 column (250 × 4.6 mm, 5 μm) (Weltech, Shanghai, China).
Experimental methods
Leaf color trait observation
-
The five A. grossedentata lines with distinct leaf colors were observed annually from April to June over three consecutive years (2023–2025). From spring to early summer, young leaf color was classified and described using the Royal Horticultural Society (RHS) Colour Chart, and dynamic color changes were documented photographically. Chromaticity values (L*, a*, b*) were measured using a 3nh colorimeter.
Sensory quality evaluation (QDA)
-
The sensory evaluation was conducted at the Tea Sensory Evaluation Laboratory of the College of Horticulture, Hunan Agricultural University. A panel of 10 tea science professors and graduate students, all with extensive evaluation experience (five males and five females), was organized to form the evaluation team. Sensory evaluation was performed following the national standard GB/T 23776-2018 'Methodology for sensory evaluation of tea'. A 2.0 g sample of microwave-fixed material was infused with 250 mL of boiling water for 4 min and then evaluated for appearance, liquor color, taste, aroma, and infused leaves.
Quantitative Descriptive Analysis (QDA): Based on the above sensory evaluation results, characteristic keywords were selected from the lexicon established by Gan et al.[13]. Samples were re-prepared following the same brewing procedure. Taste and aroma intensity were scored on a 10-point scale (0: none; 2: weak; 5: moderate; 10: extremely strong). Each batch of samples was evaluated in triplicate, and the intensity values for each attribute were recorded. The mean of the three replicates was calculated for each batch. Multiple comparison tests were subsequently performed on the batch means to identify significant differences between batches.
Determination of physicochemical components
-
The microwave-fixed A. grossedentata sample was ground and passed through a 40-mesh sieve. The sieved powder was collected for subsequent analysis. The methods for determination were as follows: the content of water extract was determined according to GB/T 8305-2013 'Determination of Water Extracts in Tea'; free amino acid content was measured using the ninhydrin colorimetric method, with absorbance measured at 570 nm; soluble sugar content was analyzed by the sulfuric acid-anthrone colorimetric method, with absorbance measured at 620 nm; anthocyanin content was determined following the method described by Li et al.[14].
The contents of dihydromyricetin and myricetin were determined according to the method of Yang et al.[15]. HPLC analysis was performed under the following conditions: a Welchrom C18 column (250 × 4.6 mm, 5 μm) with a flow rate of 1 mL/min, column temperature of 30 °C, injection volume of 10 μL, and detection wavelength of 292 nm. The mobile phase consisted of (A) methanol: acetonitrile (95: 5, v/v) and (B) 0.2% phosphoric acid solution, with a gradient elution program as follows: 0.01 min, 15% A; 0.01–25 min, 60% A; 25–27 min, 15% A; 27–37 min, 15% A.
Non-targeted metabolomics analysis
-
UHPLC-MS/MS analysis was performed at Novogene Co., Ltd (Beijing, China) using a Vanquish UHPLC system coupled with an Orbitrap Exploris™ 480 mass spectrometer (Thermo Fisher Scientific, Germany). Chromatographic separation was achieved on a Hypersil Gold column (100 × 2.1 mm, 1.9 μm) maintained at 40 °C with a flow rate of 0.2 mL/min. The mobile phase consisted of 0.1% formic acid in water (A) and methanol (B). The gradient elution program was as follows: 0–1.5 min, 2% B; 1.5–4.5 min, 2% to 85% B; 4.5–10 min,85% to 100% B; 10–10.1 min, 100% to 2% B; 10.1–12 min, 2% B.
Mass spectrometric detection was conducted in positive/negative switching mode with the following key parameters: spray voltage, 3.5 kV; capillary temperature, 320 °C; sheath gas pressure, 35 psi; auxiliary gas flow rate, 10 L/min; auxiliary gas heater temperature, 350 °C; S-Lens RF level, 60.
Enzyme activity assays
-
The activities of phenylalanine ammonia-lyase (PAL), chalcone isomerase (CHI), and 4-coumarate-CoA ligase (4CL) were determined according to the method described by Lister[16] using a phenylalanine colorimetric assay.
In vitro antioxidant activity assays
-
The scavenging capacities against 1,1-diphenyl-2-picrylhydrazyl (DPPH) radicals and superoxide anion radicals (O2–), as well as the total reducing power, were determined according to the method described by Wang et al.[8].
The scavenging activity (SA) for DPPH and O2– was calculated using the formula: SA = 1/Half maximal inhibitory concentration (IC50). A higher SA value indicates stronger scavenging capacity and greater antioxidant activity. The total reducing power was expressed as the absorbance value at 700 nm (A700) at a sample concentration of 0.6 mg/mL.
Statistical analysis
-
All experiments were conducted with three biological replicates and three technical replicates. Data were organized using Microsoft Excel 2021. Difference and correlation analyses were performed with IBM SPSS Statistics 27.0.1, and results are presented as mean ± standard deviation (SD). Colorimetric data were subjected to hierarchical cluster analysis (HCA) and multivariate statistical analysis, including principal component analysis (PCA), partial least squares-discriminant analysis (PLS-DA), and orthogonal partial least squares discriminant analysis (OPLS-DA), using SIMCA-P 14.1 software to calculate variable importance in projection (VIP) values and fold change (FC). Figures were generated using GraphPad Prism 10.6.0. Correlation analysis was conducted with Origin 2024. Heatmap analysis was performed using TBtools-II v2.423 software (China). Correlation network diagrams were generated with Cytoscape 3.10.4.
-
Based on three consecutive years of field morphological observations, the young stem and leaf colors of the five A. grossedentata lines showed distinct differences. The specific phenotypic characteristics were as follows (Fig. 1): line 1 'Chunlv Xiaoye Mei' maintained a stable green color; line 2 'Boliang Mei' had new leaves displaying light purple; line 3 'Zixiangbian Mei' exhibited striking purple-red leaf margins; line 4 'Banshan Banzi Mei' showed stable green-purple mixed leaves, overall light purple; line 5 'Zimo Mei' stably maintained purple. In addition, the leaf color phenotypes of mature leaves also showed certain differences. Based on the chromaticity values (L*, a*, b*) of young stems and leaves (Supplementary Table S1), the five lines were classified into three categories (Fig. 1f): line 1 'Chunlv Xiaoye Mei' independently formed the green group; lines 2 and 4 clustered together as the light purple group; lines 3 and 5 were classified as the purple group. Among them, the chromaticity characteristics of line 3 fell between light purple and deep purple, consistent with its purple-edged leaf phenotype. Based on field observations and quantitative classification of leaf color, the five A. grossedentata lines exhibited significant differentiation in leaf color.
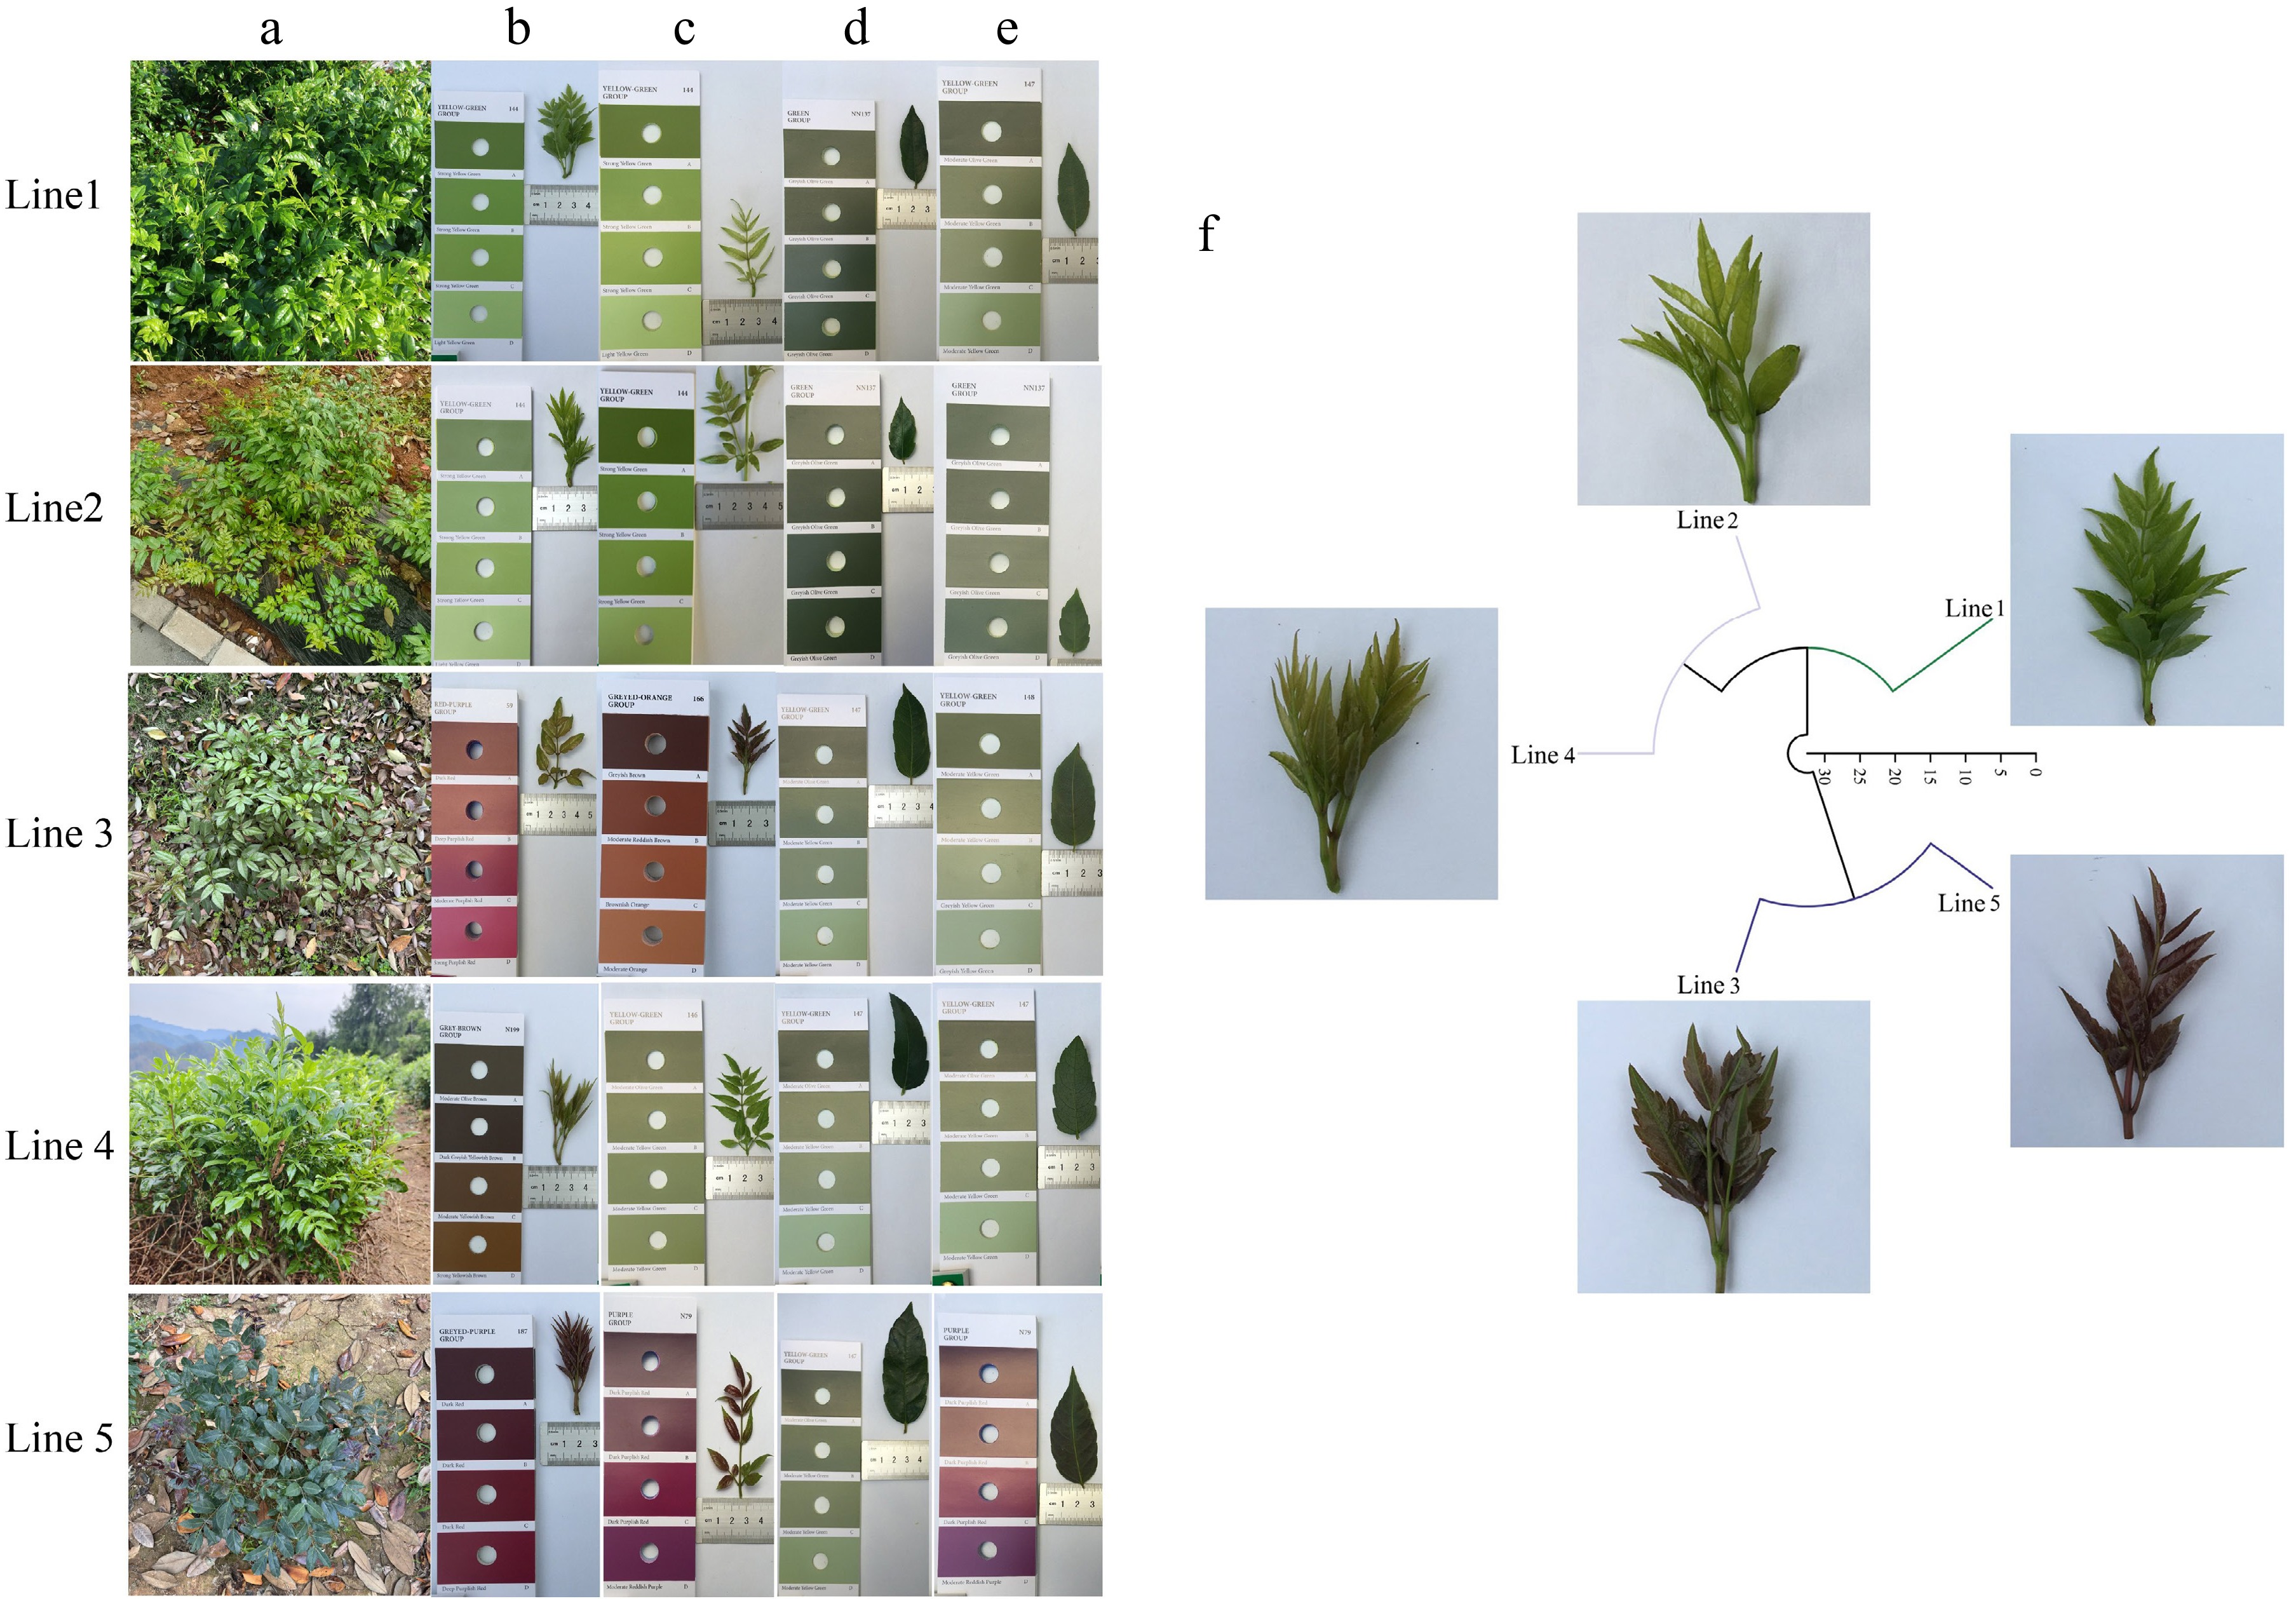
Figure 1.
Field phenotype characteristics of five Ampelopsis grossedentata lines. Note: 1, 2, 3, 4, and 5 represent line 1 'Chunlv Xiaoye Mei', line 2 'Boliang Mei', line 3 'Zixiangbian Mei', line 4 'Banshan Banzi Mei', and line 5 'Zimo Mei', respectively. (a) Field photograph of the plant. (b) Colorimetric chart of newly sprouted stems and leaves in spring. (c) Colorimetric chart of newly sprouted stems and leaves in summer. (d) Colorimetric chart of the adaxial side of mature stems and leaves in summer. (e) Colorimetric chart of the abaxial side of mature stems and leaves. (f) Cluster analysis of leaf color.
Sensory quality and QDA analysis
-
Sensory evaluation is a key method for assessing tea quality, as sensory characteristics are influenced by leaf color-related cultivars[17], processing techniques[18], and different substitute teas[19]. Systematic sensory evaluation is also essential for assessing the quality of A. grossedentata, a raw material for herbal tea. Five representative lines were sampled at young (Y), semi-mature (SM), and mature (M) stages. After microwave fixation, their dry leaf appearance, aroma, liquor color, taste, and infused leaves were evaluated (Supplementary Table S2, Fig. 2a). Results showed that Y and SM samples retained fresh leaf color, while M samples of all lines turned withered brown, with no significant interline differences. Aroma profiles were characterized by cowpea and cooked-corn notes, with green odors decreasing as maturity increased. Lines 2, 3, 4, and 5 (with purple young stems/leaves) exhibited stronger cooked-corn and preserved-plum aromas than line 1. In taste, Y and SM samples were fuller and mellower, with a clearer sweet aftertaste than M samples. The more purple lines (3, 4, and 5) showed greater sweetness, and line 5 at the Y/SM stages had a darker liquor color and a distinct taste.
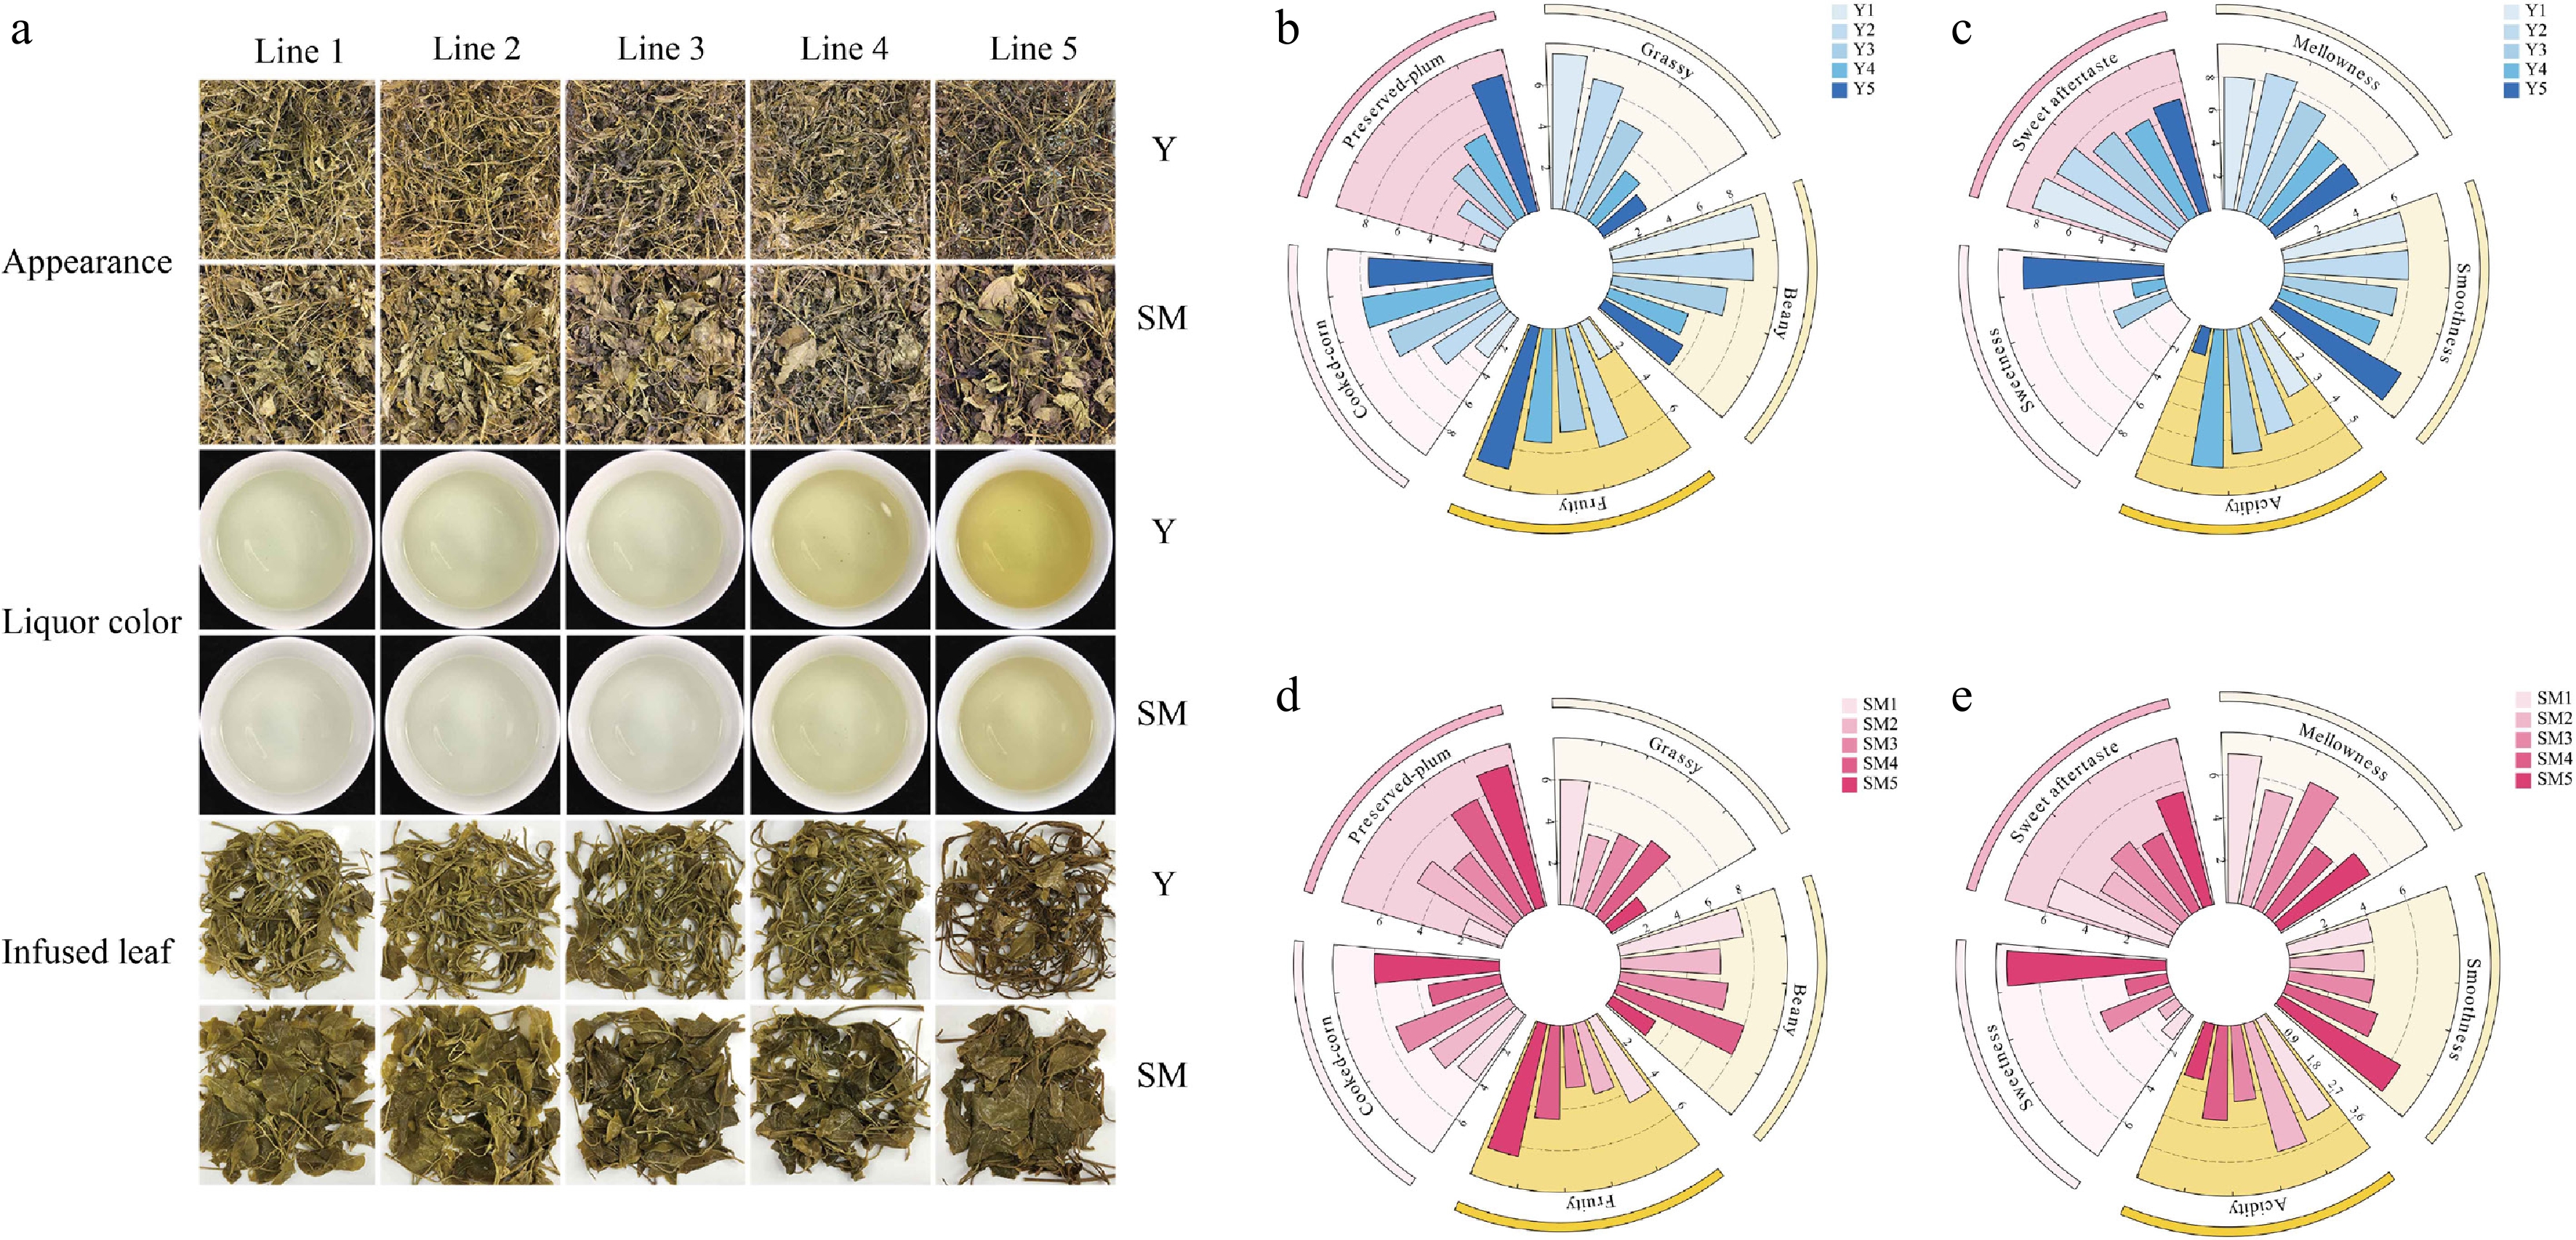
Figure 2.
Sensory evaluation and QDA analysis of taste and aroma for five A. grossedentata lines. Note: (a) Photos of the appearance, tea liquor, and leaf base of stems and leaves from five different maturity levels of A. grossedentata after microwave fixing. (b) Aroma characteristics in the Y stage. (c) Liquor taste characteristics in the Y stage. (d) Aroma characteristics in the SM stage. (e) Liquor taste characteristics in the SM stage.
In summary, aroma and taste varied significantly among lines, especially at Y and SM stages, but converged at maturity. Therefore, sensory quality evaluation of A. grossedentata should focus primarily on the early and semi-mature stages.
To further quantify flavor characteristics, this study employed Quantitative Descriptive Analysis (QDA) to construct flavor wheels (Fig. 2b–e). Aroma analysis revealed that at the Y stage, lines 1 and 2 were dominated by beany notes; line 3 exhibited a combination of beany and cooked-corn aromas; line 4 showed prominent cooked-corn aroma; and line 5 displayed significant and intense preserved-plum aroma. By the SM stage, the fruity and cooked-corn aromas of line 1 intensified, while the preserved-plum aroma of lines 3 and 5 weakened, and that of lines 1, 2, and 4 strengthened somewhat. Taste analysis indicated that from the Y to the SM stage, overall taste intensity decreased across all lines, while mellowness and smoothness showed coordinated trends: lines 1 and 2 maintained characteristics of mellowness, smoothness, and sweet aftertaste; line 5 exhibited particularly prominent sweetness, which may be related to its higher soluble sugar content. The study demonstrates an inherent link between the sensory quality of A. grossedentata and its leaf color phenotype, with the genetic background and developmental maturity of stems and leaves playing key roles in flavor formation, a process likely accompanied by significant changes in physicochemical composition.
Quality characteristics analysis of different lines and developmental stages
Dynamic changes in major chemical components
-
Differences in taste among different lines and developmental stages of A. grossedentata mainly stem from variations in their physicochemical components. Determination of the major chemical components in five representative lines at three developmental stages (Y, SM, M) (Fig. 3) revealed clear differences in the content of each component both among lines and across maturity stages.
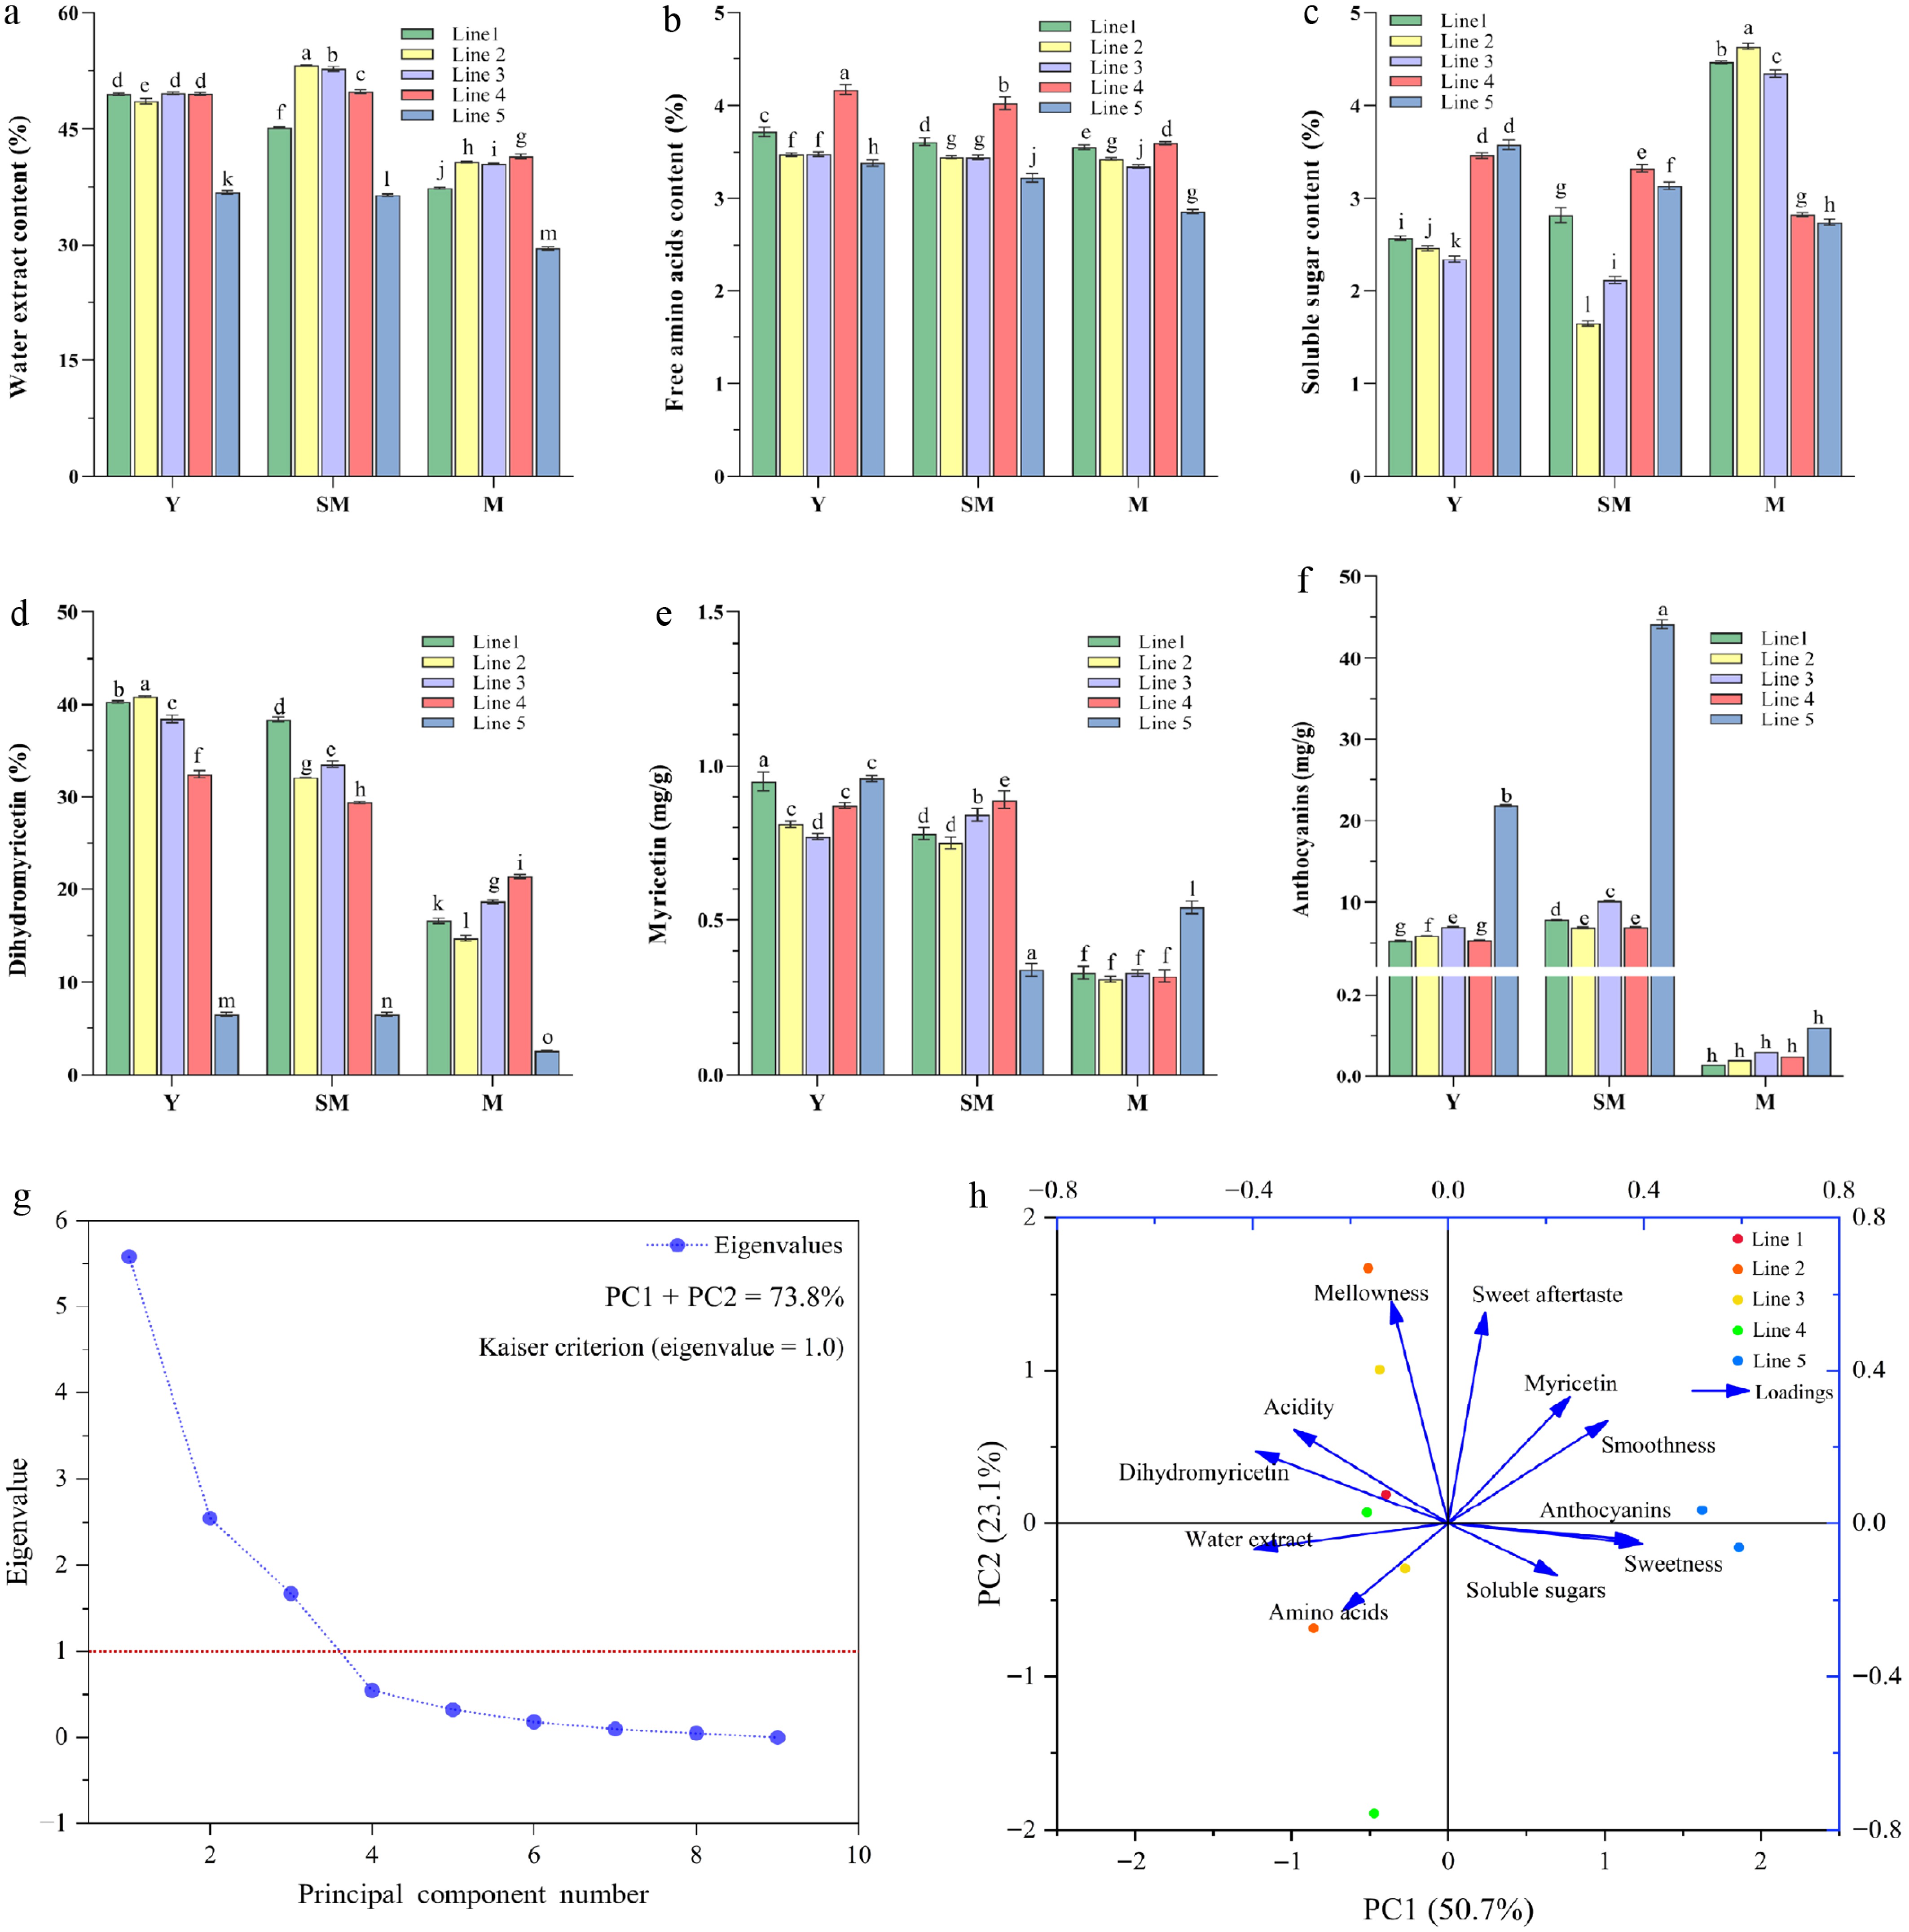
Figure 3.
Main biochemical component contents and taste characteristics PCA for five A. grossedentata lines. Note: 1, 2, 3, 4, and 5 represent line 1 'Chunlv Xiaoye Mei', line 2 'Boliang Mei', line 3 'Zixiangbian Mei', line 4 'Banshan Banzi Mei', and line 5 'Zimo Mei', respectively; Y, SM, and M denote young, semi-mature, and mature stems and leaves, respectively. (a)–(f) Represent the contents of water extract, free amino acids, soluble sugars, dihydromyricetin, myricetin, and anthocyanins, respectively. (g), (h) Represents the scree plot of principal component eigenvalues and the PCA biplot (sample scores and variable loadings), respectively. In h, the variable vectors (purple arrows) indicate the projection directions of chemical constituents and sensory attributes in the principal component space. The angles between vectors reflect their correlations: an angle < 90° denotes a positive correlation, while an angle > 90° indicates a negative correlation. Different letters within the same column signify significant differences (p < 0.05).
The water extract content generally decreased with increasing developmental maturity (Y, SM to M) (Fig. 3a), which is consistent with the relatively bland taste observed in the sensory evaluation at the M stage. However, variation trends differed slightly among lines: lines 1 and 5 showed a continuous decline, whereas lines 2, 3, and 4 exhibited an initial increase followed by a decrease.
Both free amino acids and dihydromyricetin contents displayed the pattern Y > SM > M across all lines (Fig. 3b). The highest free amino acid content was found in Y4 (4.17%), and the lowest in M5 (2.82%). Y2 had the highest dihydromyricetin content (42.31%), aligning with the mellow, smooth, and sweet aftertaste characteristics noted in sensory evaluation, confirming the key role of dihydromyricetin in quality formation[20]. The dihydromyricetin content in line 5 was significantly lower than in the other lines at all stages (Fig. 3d).
Changes in soluble sugars varied by line (Fig. 3c): lines 1 and 3 showed a continuous increase, line 2 first decreased and then increased, while lines 4 and 5 exhibited a continuous decline. M2 had the highest content (4.63%), yet its taste performance was relatively flat. This may be related to the substantial decreases in water extract and dihydromyricetin content at this stage, indicating that taste formation results from the synergistic action of multiple components.
Myricetin content remained in the range of 0.54–0.97 mg/g during the Y and SM stages, and generally decreased significantly in the M stage (Fig. 3e). Regarding anthocyanin content (Fig. 3f), line 5 was significantly higher than the other lines at all stages, consistent with its purplish-red appearance. Anthocyanin content in each line peaked at the SM stage (e.g., SM5 reached 44.14 mg/g), indicating that this stage is critical for anthocyanin accumulation, and dropped to the lowest level in the M stage.
Overall, both line characteristics and raw-material maturity jointly determine the physicochemical profile of Meicha: dihydromyricetin content was highest at the Y stage, soluble sugars accumulated more at the M stage, while the variation patterns of anthocyanins and soluble sugars were closely related to line-specific traits. The physicochemical composition was strongly linked to sensory quality: lines 1, 2, and 3, with higher dihydromyricetin content, delivered a mellow taste with a lingering sweet aftertaste; line 5, which possessed both higher anthocyanin and soluble sugar contents, provided a material basis for its distinct flavor quality.
Multivariate statistical analysis of chemical components and taste quality
-
To explore the chemical basis of the flavor quality in A. grossedentata stems and leaves, this study integrated sensory scores from QDA with data from major physicochemical components for principal component analysis (PCA). The eigenvalues of the first three principal components (PC1 = 5.60, PC2 = 2.53, PC3 = 1.71) were all greater than 1. PC1 (50.7%) and PC2 (23.1%) had a cumulative contribution rate of 73.8%, effectively representing the main variation in the data.
The PCA biplot (Fig. 3h) showed that line 5 was chemically distinct from the other lines, likely due to its 'high anthocyanin, low dihydromyricetin' composition. Variable vector analysis indicated a strong positive correlation between anthocyanins and sweetness (angle ≈ 30°), whereas dihydromyricetin was significantly negatively correlated with sweetness (angle ≈ 150°). This may be attributed to the inherent bitterness and astringency of dihydromyricetin and the masking effect of other polyphenols, which suppress sweetness perception[21]. When dihydromyricetin content is low, sweetness becomes more prominent, explaining the uniquely high sweetness of line 5. Furthermore, the three mouthfeel attributes, namely mellowness, smoothness, and sweet aftertaste, formed angles smaller than 45° with each other, indicating positive correlations. This suggests that they may share common chemical bases, such as soluble sugars and free amino acids[22], which work synergistically to build a rich taste profile.
Based on the above analysis, the taste differences in A. grossedentata arise from variations in genetic background and physicochemical composition among the lines. The developmental maturity of the raw material (Y, SM, M) is a key factor influencing its sensory quality and chemical composition, which aligns with patterns observed in tea research[23]. Different lines exhibit distinct flavor transformation patterns, such as enhanced fruity notes and increased aromatic complexity. These specific traits are strongly correlated with their genetic backgrounds, providing a theoretical basis for the differentiated utilization of stems and leaves from each line.
Metabolomic analysis of young leaves and stems
-
To further investigate metabolite differences, non-targeted metabolomics analysis was performed on young stems and leaves of the five lines, identifying 3,010 metabolites in positive and negative ion modes. The PLS-DA model (Fig. 4a) yielded parameters R2X = 0.908, R2Y = 0.986, and Q2 = 0.754, indicating good separation. In the score plot, lines 1, 2, and 3 formed a close cluster, while lines 4 and 5 were clearly separated, consistent with their higher sweetness scores in QDA. A permutation test (Fig. 4b) confirmed the model's robustness without overfitting.
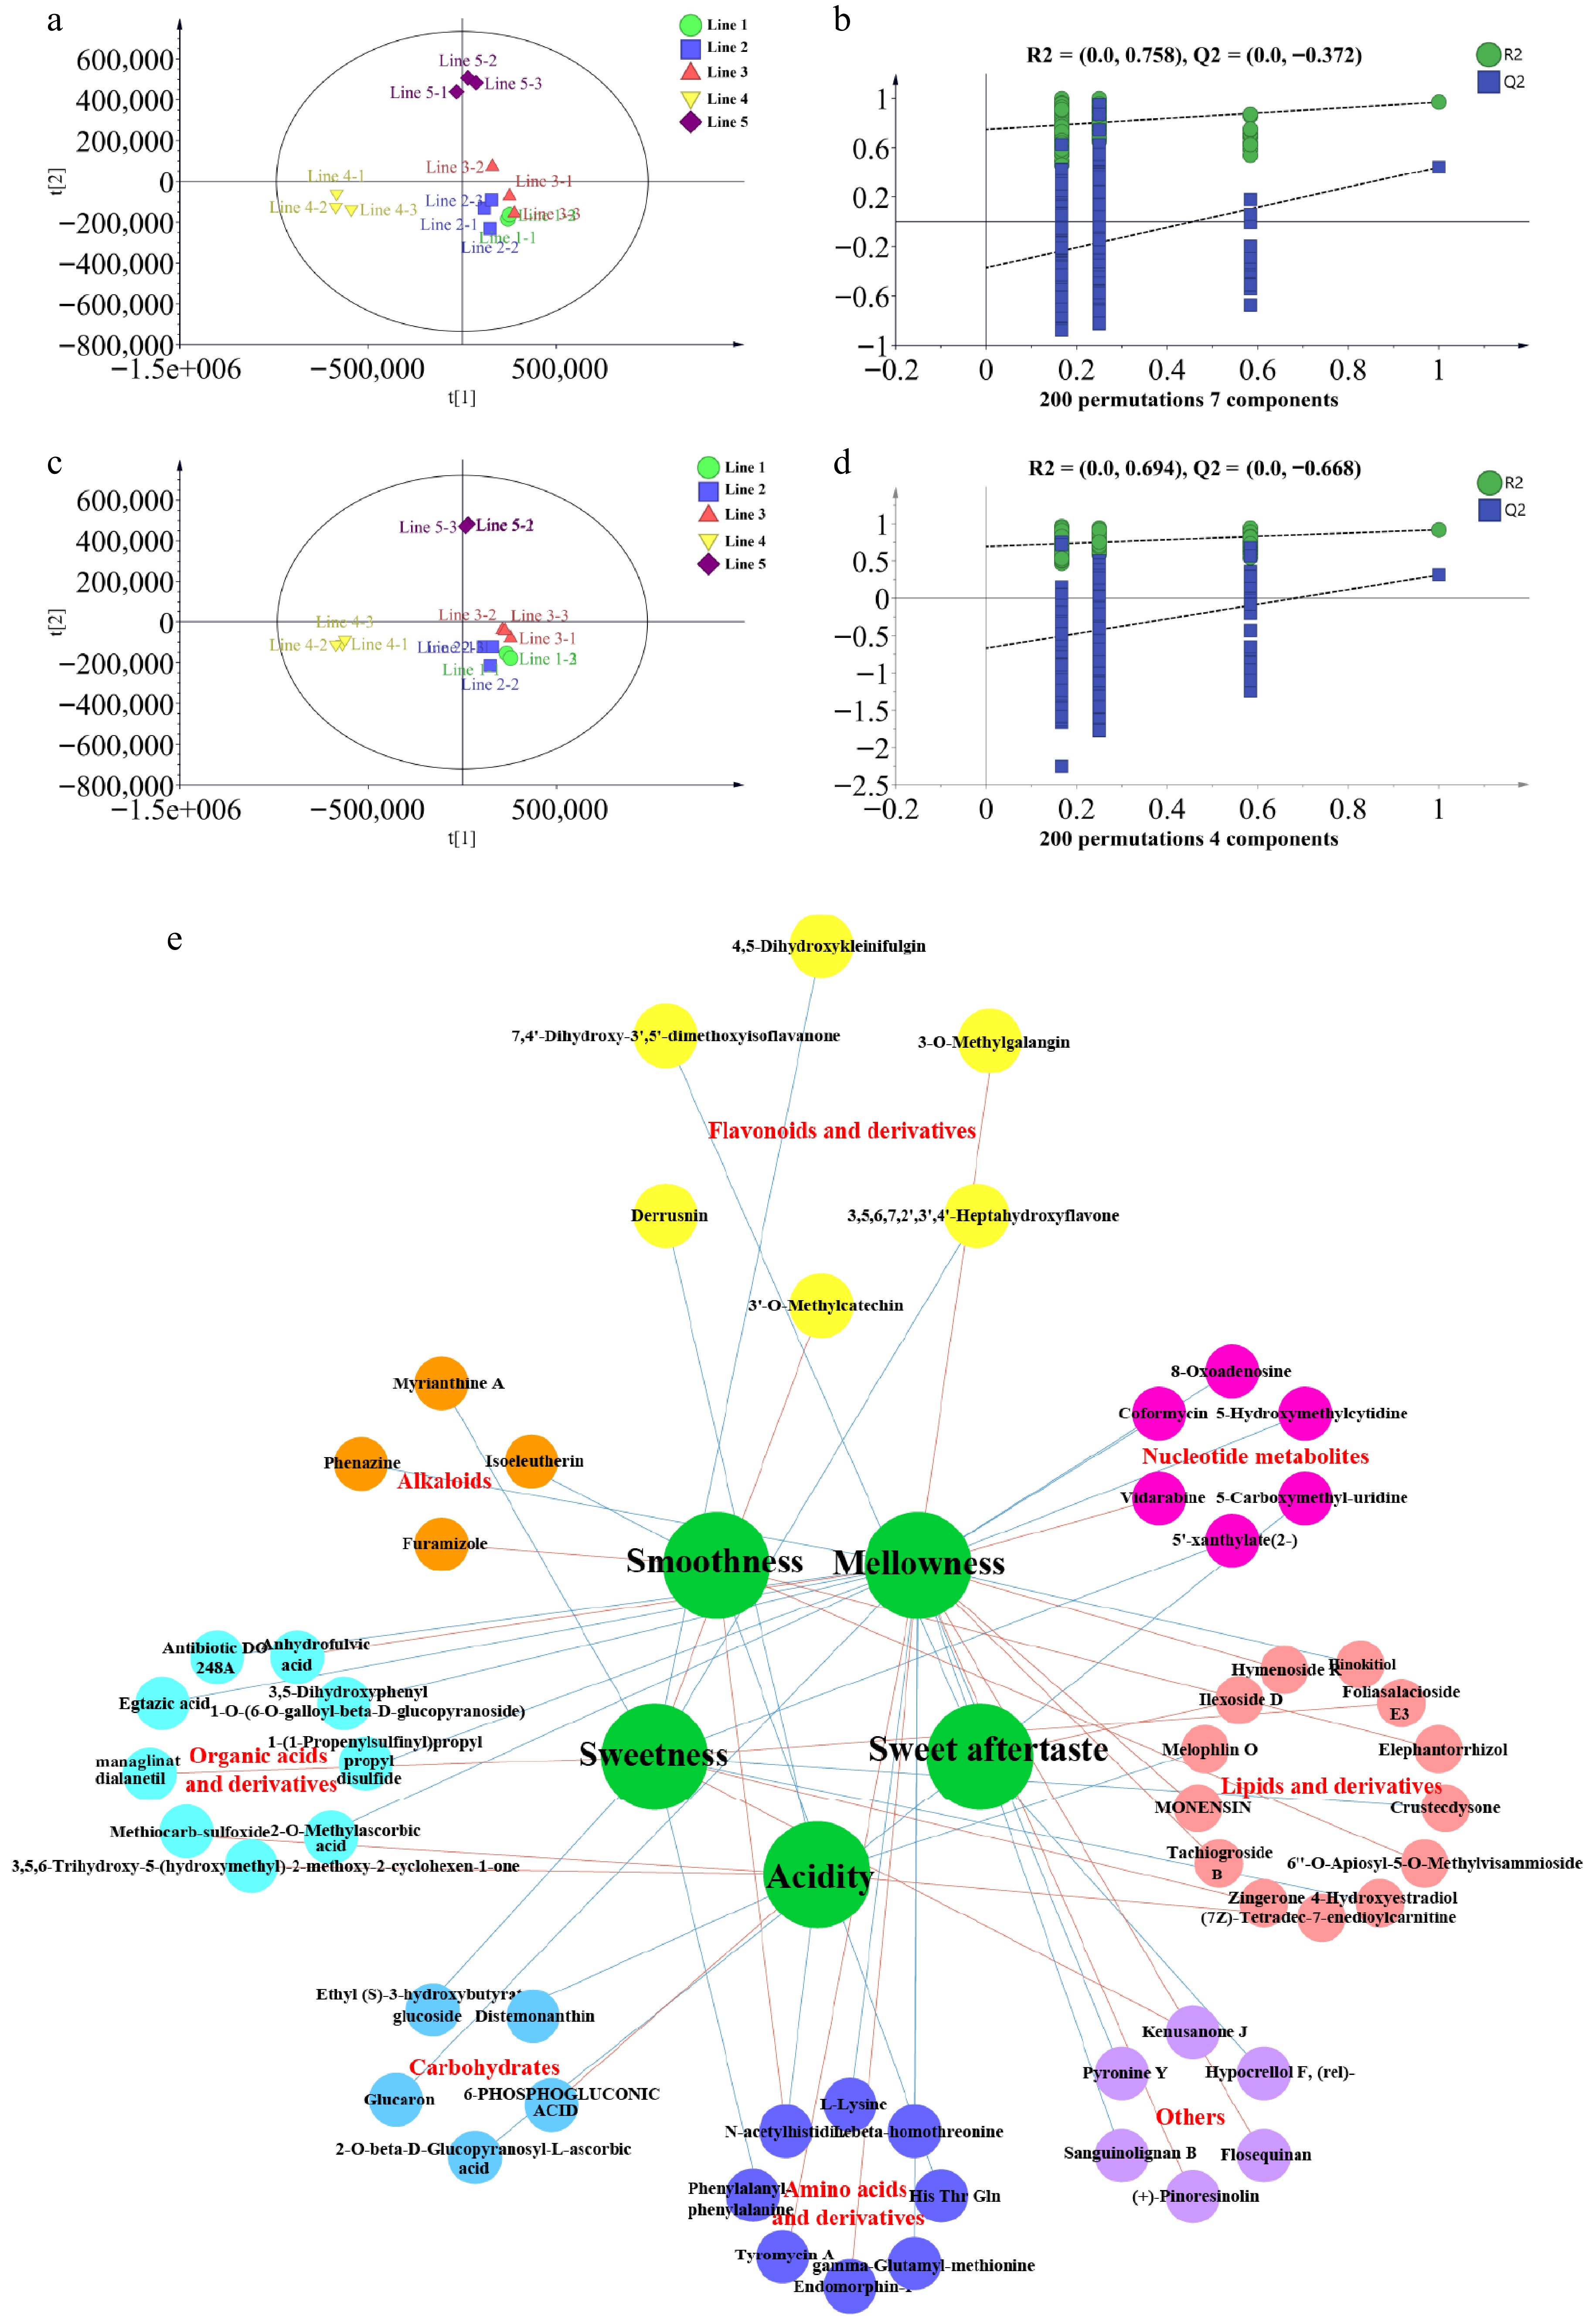
Figure 4.
Association analysis between differential metabolites from non-targeted metabolomics and taste quality. Note: (a) PLS-DA score plot, (b) PLS-DA permutation test plot, (c) OPLS-DA score plot, (d) OPLS-DA permutation test plot, and (e) correlation network diagram between flavor attributes and metabolites (|r| > 0.85, p < 0.01), with red lines indicating positive correlations and blue lines indicating negative correlations.
Based on these results, to further remove systematic noise unrelated to classification and accurately extract key differential variables, an OPLS-DA model was constructed (Fig. 4c). The OPLS-DA model parameters R2X, R2Y, and Q2 were 0.877, 0.957, and 0.673, respectively, indicating good discrimination performance. Moreover, the OPLS-DA score plot clearly reproduced the clustering trend observed in the PLS-DA, and the corresponding permutation test with 200 iterations (Fig. 4d), with an R2 intercept of 0.694 and a Q2 intercept of –0.668), further confirmed that the model had good predictive ability and showed no overfitting.
Based on the OPLS-DA results, differential metabolites were screened using the criteria VIP > 1 and (FC > 2 or FC < 0.5) with FDR < 0.05. No overlapping differential metabolites were found between any two lines, indicating significant differences in intrinsic composition among the lines. Therefore, the union set of differential metabolites from all pairwise comparisons (1,449 in total) was taken, and Pearson correlation analysis (|r| ≥ 0.85, p < 0.05) was performed to finally identify 301 metabolites significantly associated with QDA taste scores. Through annotation via HMDB and KEGG, the differential metabolites were categorized into eight classes (Fig. 5): alkaloids (26), amino acids and derivatives (26), carbohydrates (16), flavonoids and derivatives (31), organic acids and derivatives (32), nucleotide metabolites (12), lipids and derivatives (117), and others (41). All these substances are closely related to taste attributes.
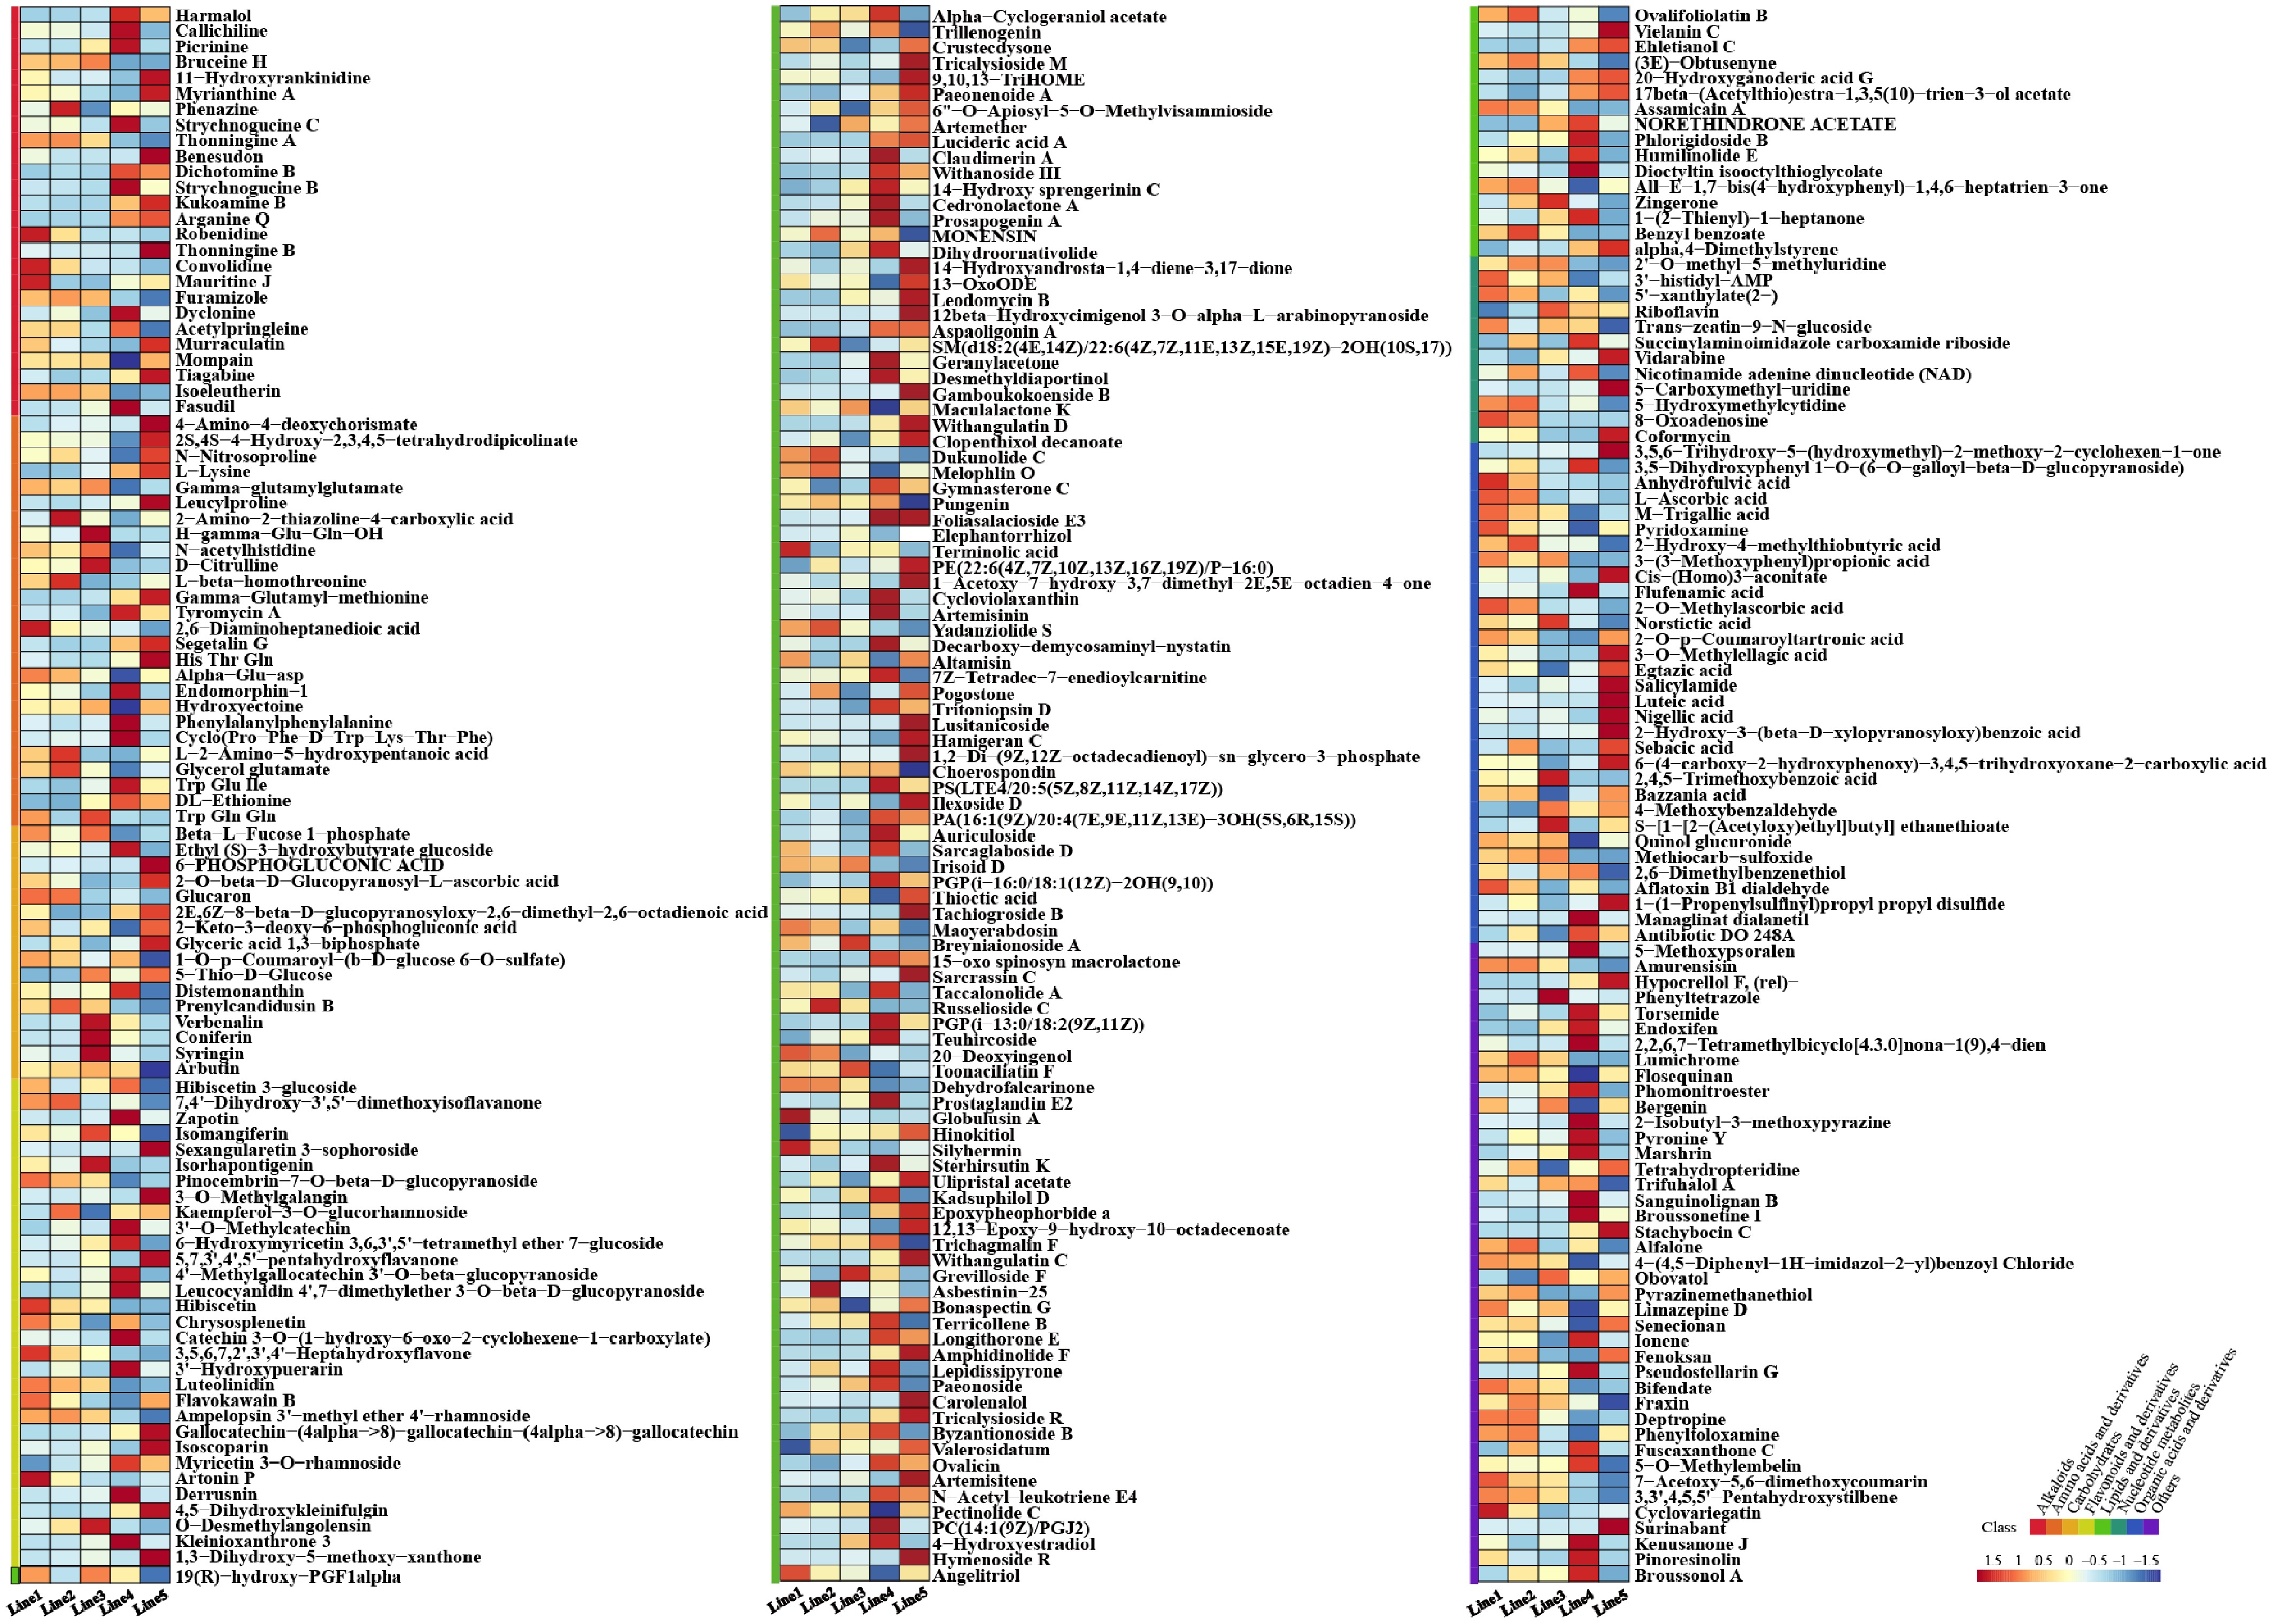
Figure 5.
Heatmap of taste-related differential metabolites across lines.
To further investigate the flavor formation mechanism, 58 metabolites with the strongest associations were selected to construct a co-occurrence network (p < 0.01; Fig. 4e). The analysis demonstrated that the taste profile of A. grossedentata is not dictated by a single class of compounds. Attributes such as mellowness, smoothness, and sweet aftertaste arise from the synergistic effects of multiple classes of substances, namely flavonoids, amino acids, lipids, and nucleotides[24], which collectively shape the liquor flavor. These findings confirm that key flavor compounds, including flavonoids, lipids, and organic acids, exhibit distinct line specificity and that these 58 metabolites are essential in defining the unique taste of each line. Furthermore, network correlation analysis reinforces that the overall taste expression of A. grossedentata depends on the coordinated contribution of diverse compound classes.
Mellowness and smoothness exhibited the most extensive network associations (Fig. 4e), Derivatives of amino acid metabolism pathways, such as endomorphin-1 and tyrocidine A, showed positive correlations with mellowness, supporting the established conclusion that nitrogen-containing compounds contribute to a full body[25]. N-Acetyl-histidine and bulbocodin, among others, were strongly positively correlated with smoothness. Notably, N-acetyl-histidine correlated positively with smoothness but negatively with sourness, suggesting that its acetylation modification may comprehensively influence taste perception by altering solubility and release kinetics. Furthermore, lipids/terpenoid glycosides (e.g., ilexsaponin D) were positively correlated with sweet aftertaste, whereas nucleotide metabolites such as 5-carboxymethyluridine showed negative correlations. This may be because the former have lower polarity, making them less prone to bind salivary proteins and produce astringency, thereby facilitating the perception of sweetness and lingering sweet aftertaste (Fig. 4e). This also provides a chemical explanation for the pronounced mellowness and sweet aftertaste in lines 1, 2, and 3. Although soluble sugars are commonly considered the primary source of sweetness, this study found that lipid derivatives in lipid metabolism (e.g., zingerone) and methylated flavonoids in the flavonoid biosynthesis pathway (e.g., 3'-O-methyl-catechin) significantly contribute to their distinctive sweet characteristics (Fig. 4e). Unlike non-methylated catechins, which are primarily bitter and astringent, methylated catechins may reduce bitterness or enhance sweet aftertaste by modulating receptor responses[26]. Regarding sourness, conventional studies attribute it mainly to organic acids such as citric acid and malic acid[27]. However, this study found that sourness not only correlates with organic acids but also positively correlates with metabolites such as (7Z)-tetradec-7-enedioylcarnitine and 6-phosphogluconic acid, indicating that the formation mechanism of sour taste is more complex.
Integrated analysis of metabolomics, physicochemical indices (Fig. 3), sensory QDA (Fig. 2), and PCA consistently indicates that the chemical composition differences among A. grossedentata lines are closely linked to their taste quality characteristics. Specifically, mellowness and smoothness depend mainly on particular combinations of amino acids and lipids, whereas sweetness and sweet aftertaste are not dominated solely by sugars, but are rather the result of the synergistic regulation of key metabolic hub compounds such as methylated flavonoids and terpenoid glycosides (Fig. 4e). Notably, line 5 exhibited remarkably high sweetness, which originates from a multilevel metabolic regulation characterized by low dihydromyricetin content, high levels of methylated flavonoid/anthocyanin precursors, and specific lipid derivatives. This combined profile effectively suppresses bitterness and astringency while enhancing sweetness and sweet aftertaste, thereby forming the distinctive taste quality of this line. This remodeling of metabolic flux effectively suppressed bitterness and astringency while enhancing sweetness and aftertaste, which not only explains the unique taste quality of line 5 but also confirms that leaf color variation serves as an external manifestation of underlying metabolic network remodeling.
Biosynthesis of characteristic flavonoids and their antioxidant properties
Line differences and developmental dynamics of key enzyme activities
-
The accumulation of flavonoids is co-regulated by the activities of key enzymes in their biosynthesis pathway[28]. This study measured the activities of PAL, 4CL, and CHI in five lines at three developmental stages (Y, SM, M) (Fig. 6). The results showed significant differences in enzyme activities among lines and maturity stages. Both CHI and PAL activities decreased significantly with increasing leaf maturity (Fig. 6a, b). Among them, line 2 ('Boliang Mei') exhibited the highest activities at the Y stage (CHI: 211.40 U/g FW; PAL: 404.55 U/g FW), which aligns with its highest dihydromyricetin content (42.31%) at this stage, suggesting that these two enzymes may play key regulatory roles in dihydromyricetin biosynthesis. PAL is the initial enzyme of the phenylpropanoid pathway[29], while CHI is a key node in flavonoid synthesis[12]. The high enzyme activities in line 2 at the Y stage may promote metabolic flux toward dihydromyricetin synthesis, thereby supporting its mellow and sweet-aftertaste flavor characteristics.
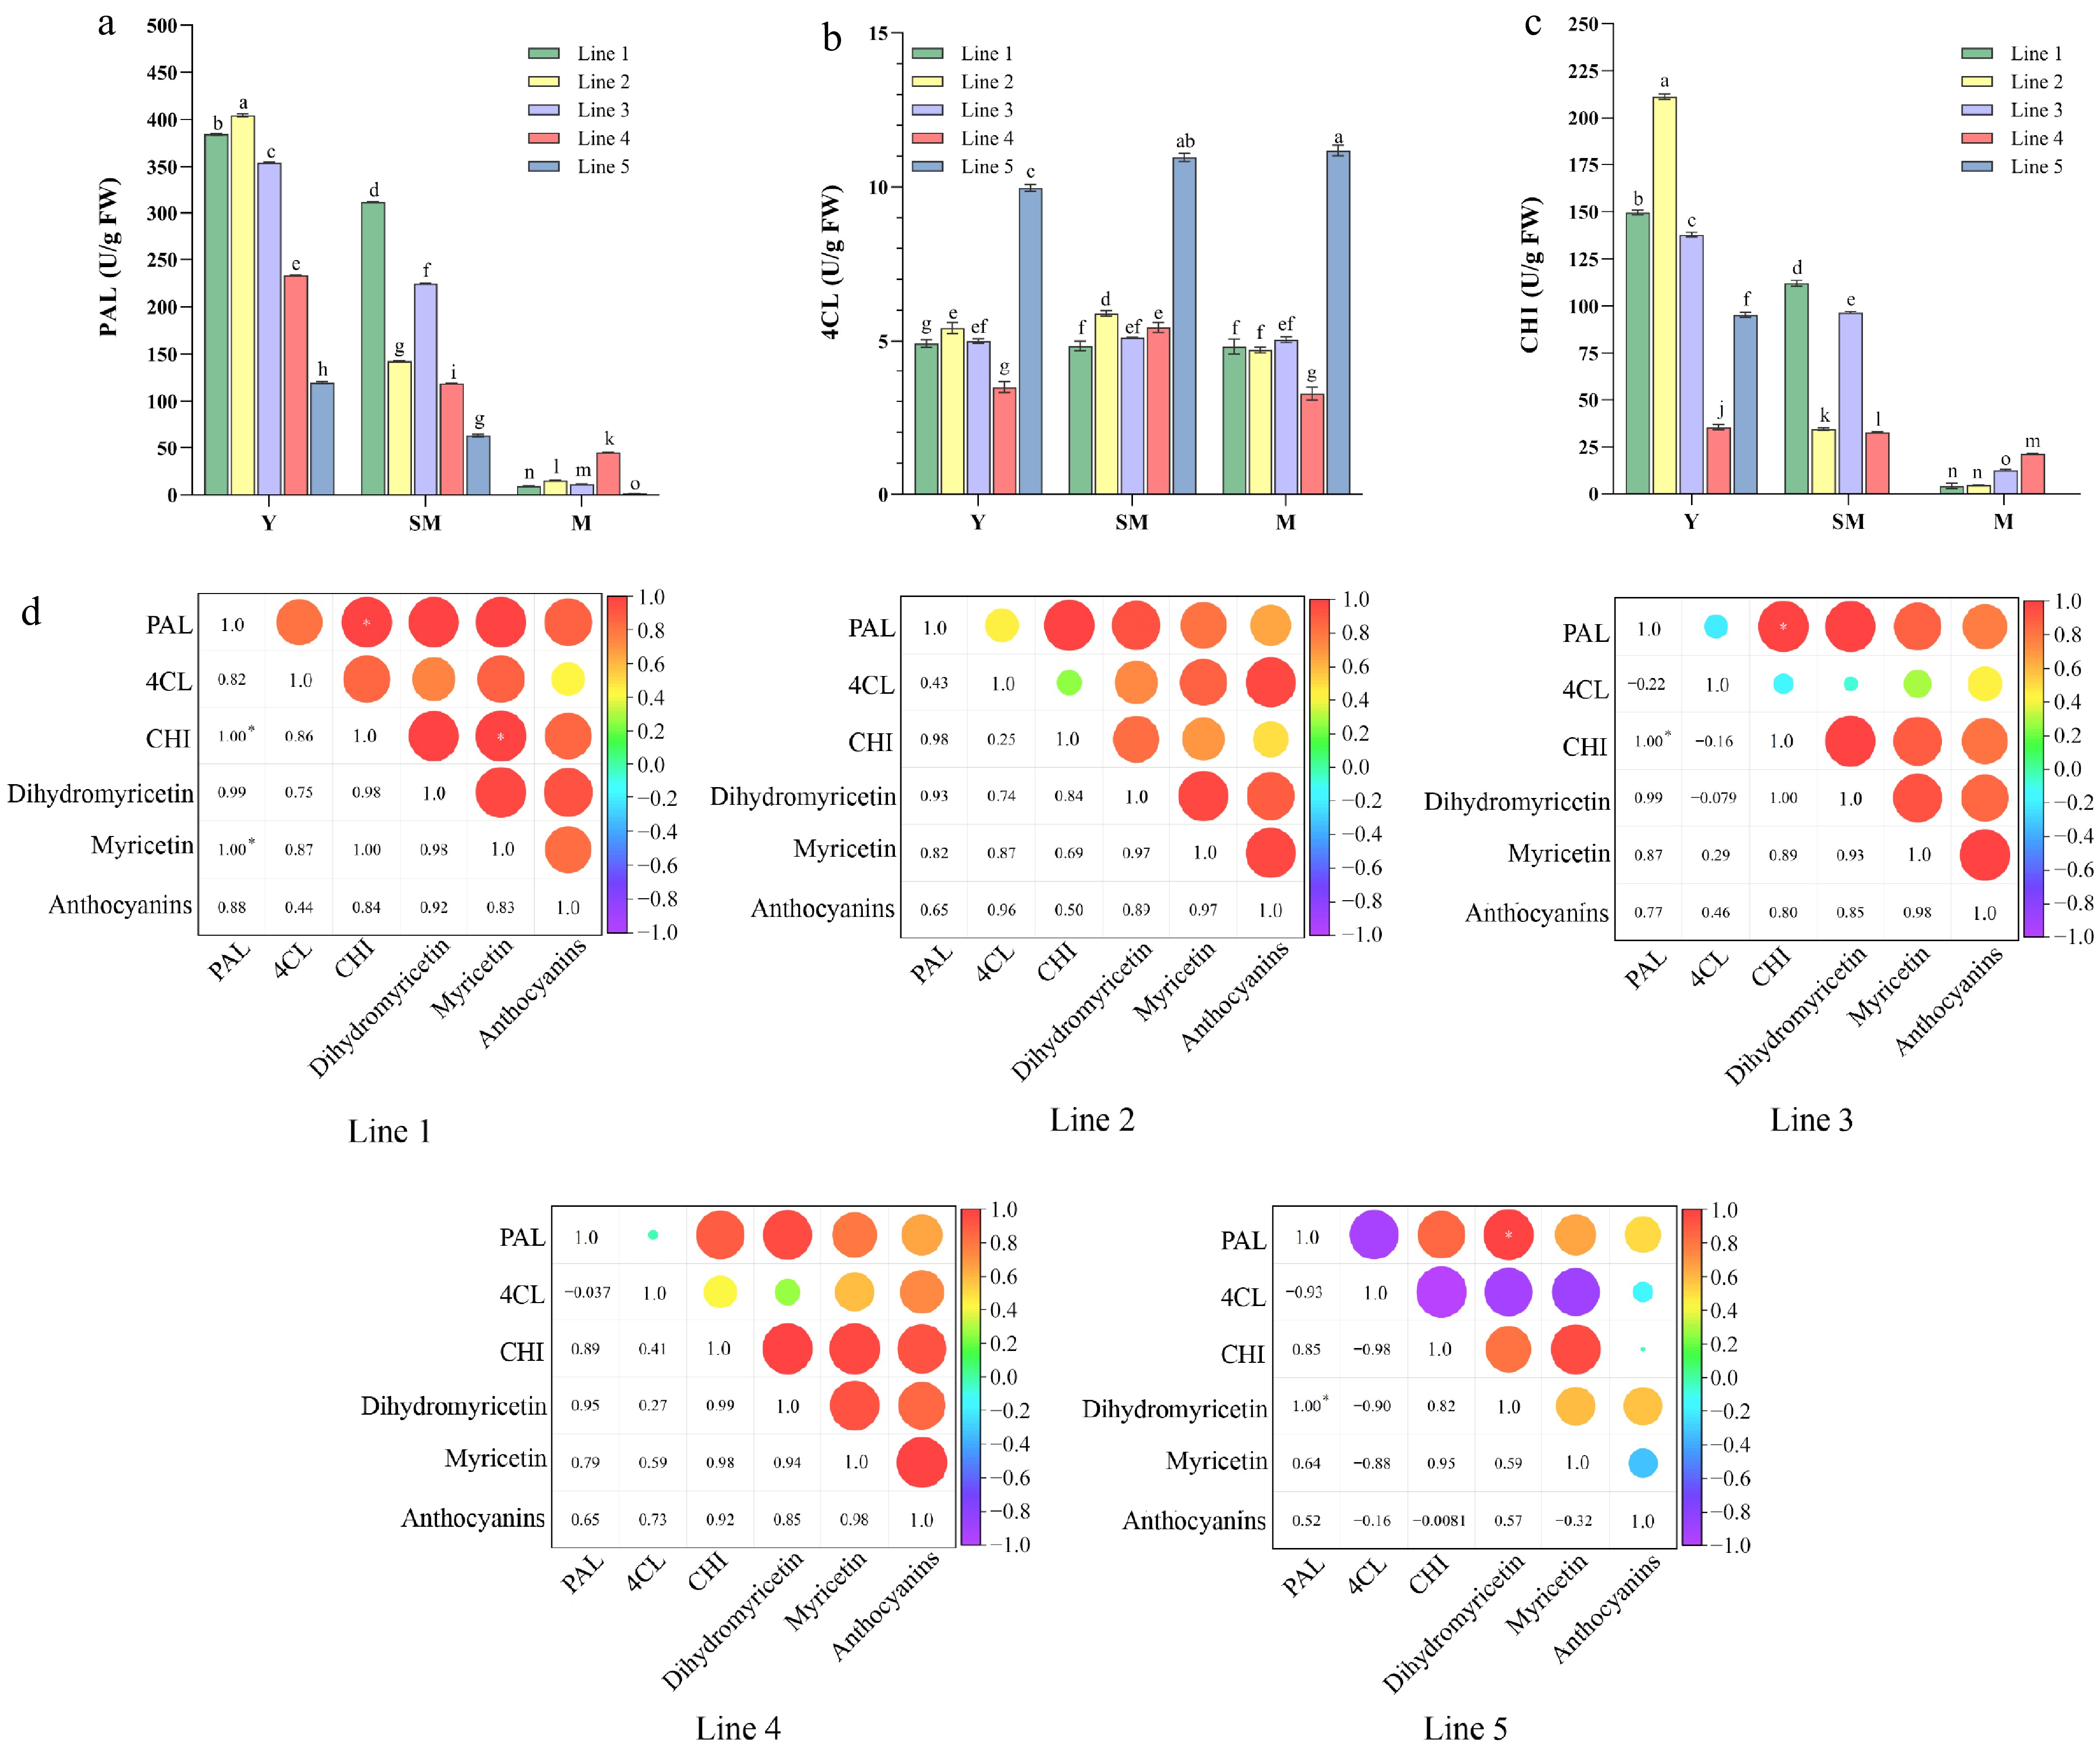
Figure 6.
Correlation analysis between enzyme activities and characteristic flavonoid contents. Note: 1, 2, 3, 4, and 5 represent line 1 'Chunlv Xiaoye Mei', line 2 'Boliang Mei', line 3 'Zixiangbian Mei', line 4 'Banshan Banzi Mei', and line 5 'Zimo Mei', respectively. (a)–(d) Represent PAL enzyme activity, 4CL enzyme activity, CHI enzyme activity, and the heatmap of correlations between characteristic flavonoid contents and key enzyme activities for each line, respectively. In panel d, the size of the circle represents the strength of the correlation, with color ranging from purple (negative correlation) to red (positive correlation); an asterisk (*) within a circle indicates a significant correlation (p < 0.05), and a double asterisk (**) indicates a highly significant correlation (p < 0.01).
In contrast, 4CL activity mainly showed line-specific patterns (Fig. 6c). Line 5 ('Zimo Mei') had significantly higher 4CL activity than the other lines at all three stages (Y: 9.97, SM: 10.96, M: 11.18 U/g FW), with its M stage activity being 2.32-fold that of line 1 (4.82 U/g FW). 4CL supplies precursors for downstream synthesis[30]. The sustained high 4CL activity in line 5 corresponds to its high anthocyanin content, indicating that 4CL may play an important role in anthocyanin biosynthesis, which is closely related to its intense preserved-plum aroma and pronounced sweetness.
In summary, in A. grossedentata, the activities of PAL and CHI are primarily regulated by developmental stage, influencing the accumulation of characteristic flavonoids (e.g., dihydromyricetin) at different maturity periods, while the activity of 4CL is mainly determined by genetic background, governing the metabolic differences among lines. Together, these three enzymes co-regulate the synthesis of characteristic flavonoids such as dihydromyricetin, myricetin, and anthocyanins, ultimately shaping the distinct qualitative physiological traits of each line.
Correlation between characteristic flavonoid contents and key enzyme activities
-
Pearson correlation analysis was performed on the contents of dihydromyricetin, myricetin, and anthocyanins (Fig. 3) and the activities of PAL, CHI, and 4CL for the five lines at the Y, SM, and M stages (Fig. 6). The results revealed distinct association patterns between key enzyme activities and characteristic flavonoids across different lines. In lines 1, 2, and 4, PAL, CHI, and 4CL activities were positively correlated with dihydromyricetin, myricetin, and anthocyanin contents, indicating coordinated regulation. Notably, in line 2, the correlation coefficient between PAL activity and dihydromyricetin content reached 0.93, suggesting that PAL efficiently promotes dihydromyricetin synthesis, which aligns with its high dihydromyricetin accumulation and mellow, sweet aftertaste profile.
In line 3, 4CL activity showed a weak negative correlation with dihydromyricetin (r = −0.079) but a positive correlation with anthocyanins (r = 0.46), implying that metabolic flux might be biased toward anthocyanin synthesis, consistent with its well-balanced taste characteristics at the SM stage. Line 5 ('Zimo Mei') was particularly distinctive; it exhibited high 4CL activity and high anthocyanin content at both Y and SM stages, yet 4CL activity was negatively correlated with dihydromyricetin, myricetin, and anthocyanin contents, with the correlation coefficient for dihydromyricetin being −0.90. This suggests that its metabolic flow may shift during development. The 'high anthocyanin-low dihydromyricetin' combination in this line highlights that anthocyanin and flavonoid accumulation are strongly regulated by genetic background. Its specific regulatory mechanism resembles the myricetin B-mediated anthocyanin synthesis observed in some purple leaf tea cultivars[31], although the rapid degradation of anthocyanins during development may reflect a different transcriptional network.
Therefore, it can be inferred that the genetic background of the line ultimately determines its characteristic flavor quality by regulating the synthesis and accumulation of metabolites.
Evaluation of the antioxidant capacity of stems and leaves at different developmental stages
-
The scavenging capacity against DPPH radicals, superoxide anion radicals (O2−), and the total reducing power reflect the level of antioxidant activity. An analysis of the antioxidant properties of five A. grossedentata lines at three stem and leaf developmental stages (Y, SM, M) (Fig. 7) showed that the antioxidant activity of all samples increased with rising sample concentration. To quantitatively compare the antioxidant efficacy of different samples, nonlinear regression models were used to calculate the half maximal inhibitory concentration (IC50). A lower IC50 value indicates stronger scavenging capacity, while a higher total reducing power value represents greater reducing ability. Within each line across different maturity stages, the DPPH radical scavenging capacity, superoxide anion scavenging capacity, and total reducing power all followed the trend: Y > SM > M.
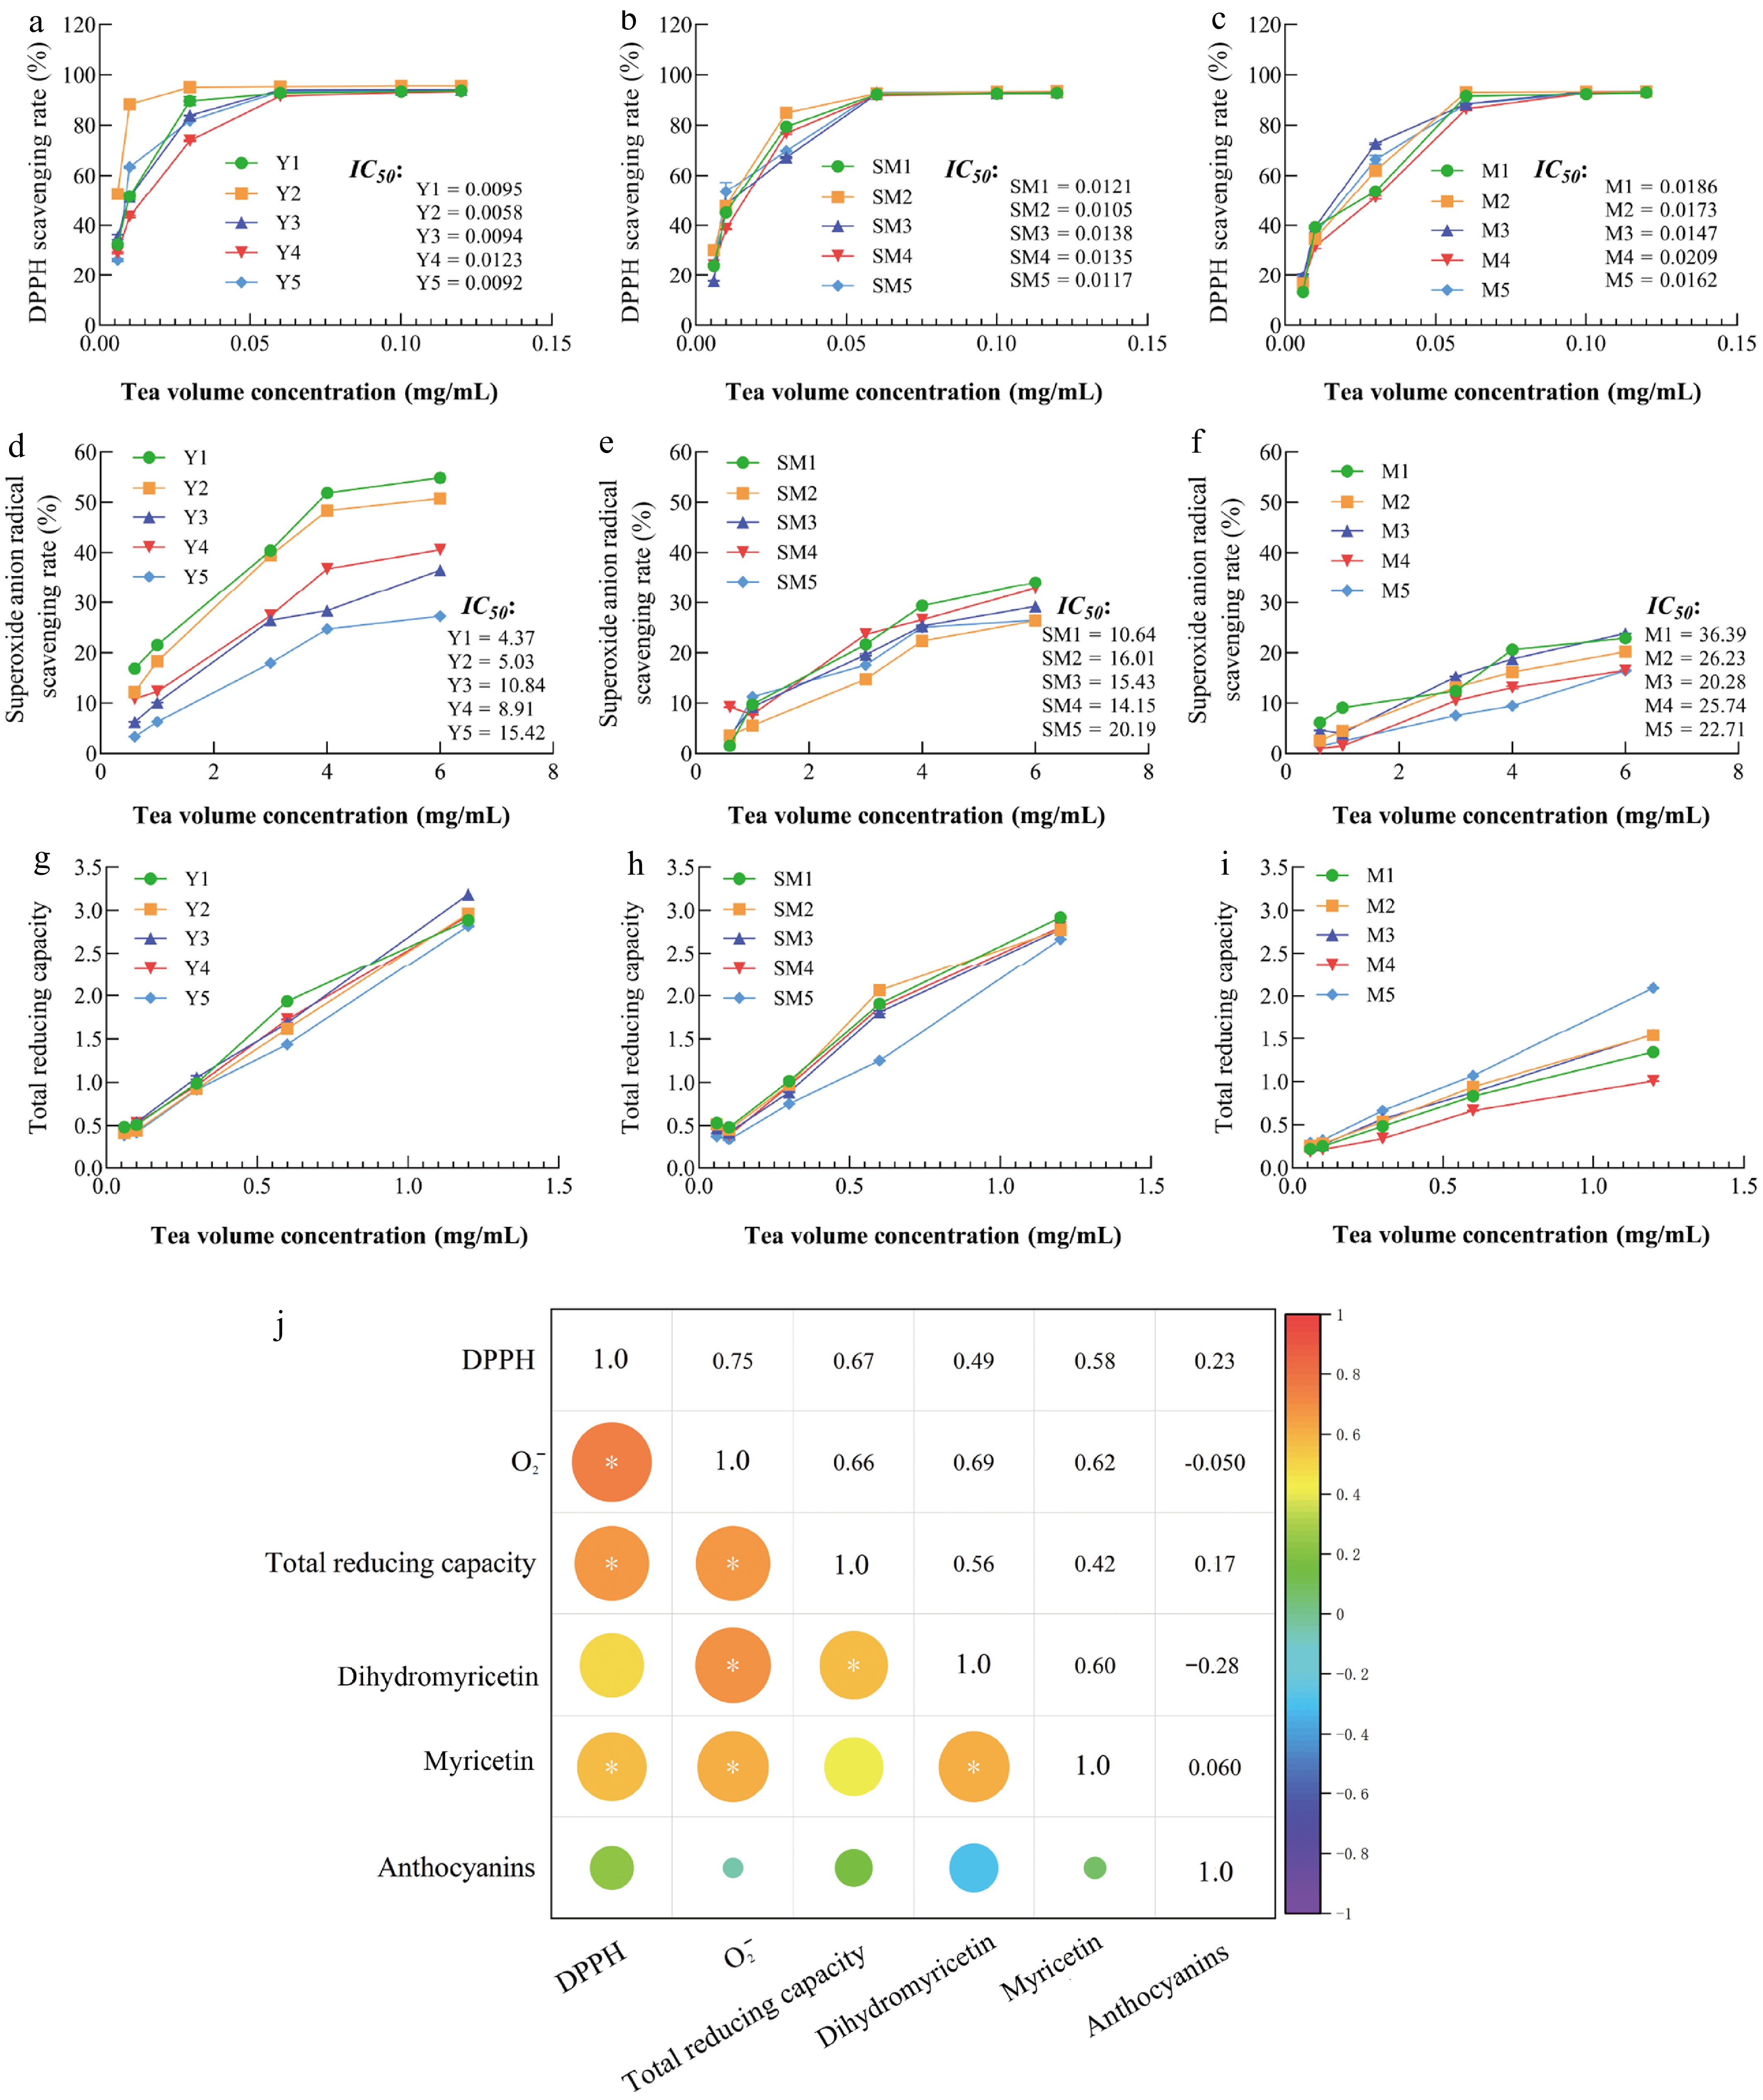
Figure 7.
Correlation analysis of overall antioxidant capacity and characteristic flavonoid content in the stems and leaves of five A. grossedentata lines. Note: 1, 2, 3, 4, and 5 represent line 1 'Chunlv Xiaoye Mei', line 2 'Boliang Mei', line 3 'Zixiangbian Mei', line 4 'Banshan Banzi Mei', and line 5 'Zimo Mei', respectively. Y, SM, and M denote young, semi-mature, and mature stems and leaves, respectively. (a)–(c) Represent DPPH radical scavenging activity (including IC50) of Y, SM, and M stage samples, respectively. (d)–(f) Represent superoxide anion scavenging activity (including IC50) of Y, SM, and M stage samples, respectively. (g)–(i) Represent the total reducing power of Y, SM, and M stage samples, respectively. (j) The heatmap of the correlation between the flavonoid content and the in vitro antioxidant activity of the features; in panel j, the size of the circle represents the strength of the correlation, with color ranging from purple (negative correlation) to red (positive correlation); an asterisk (*) within a circle indicates a significant correlation (p < 0.05), and a double asterisk (**) indicates a highly significant correlation (p < 0.01).
At the same maturity stage of stems and leaves, DPPH radical scavenging capacity showed specific differentiation among lines. At the Y stage, the IC50 values for DPPH scavenging of lines Y1, Y2, Y3, Y4, and Y5 were 0.0095, 0.0058, 0.0094, 0.0123, and 0.0092 mg/mL, respectively, displaying the order Y2 > Y5 > Y3 > Y1 > Y4. This indicates that line 2 'Boliang Mei' had the strongest DPPH scavenging ability, which is consistent with its highest dihydromyricetin content and highest PAL activity. At the SM stage, the DPPH scavenging capacity followed the order SM2 > SM5 > SM1 > SM4 > SM3. At the M stage, the order was M3 > M5 > M2 > M1 > M4.
For superoxide anion (O2−) scavenging capacity, in the Y stage, line Y1 showed the strongest activity (4.37 mg/mL), while Y5 was the weakest (15.42 mg/mL). At the SM stage, SM1 performed best (10.64 mg/mL), and SM5 was the weakest (20.19 mg/mL). At the M stage, M3 exhibited the highest scavenging capacity (20.28 mg/mL), and M1 the lowest (36.39 mg/mL). In terms of total reducing power, at the Y stage, Y3 was significantly higher than the other lines. At the SM stage, the pattern was consistent with O2− scavenging capacity, with SM1 being the strongest and SM5 the weakest. At the M stage, M5 performed the best.
Based on the above results, it can be concluded that within the same line, the order of antioxidant capacity was Y > SM > M. Significant line-specific differences were observed in DPPH radical scavenging capacity, O2– scavenging capacity, and total reducing power across different lines. This distinct differentiation in antioxidant capacity among lines fundamentally stems from genetic differences in the ability to synthesize and accumulate flavonoids, such as dihydromyricetin and anthocyanins.
Correlation between antioxidant capacity and characteristic flavonoids
-
To clarify the relationship between the characteristic flavonoid components of A. grossedentata and their antioxidant activity, this study analyzed samples from five lines representing different leaf color types at Y, SM, and M, three developmental stages. The core flavonoid components, dihydromyricetin, myricetin, and anthocyanins, were confirmed as important material bases for its antioxidant capacity. Among them, dihydromyricetin possesses excellent electron donor ability due to the 3',4',5'-trihydroxy configuration on its B-ring[32]; myricetin, as its precursor, exhibits comparable antioxidant activity[33]; and anthocyanins exert antioxidant effects via their unique phenolic hydroxyl structures[34].
Overall Pearson correlation analysis was then performed between DPPH radical scavenging capacity, O2− scavenging capacity, total reducing power, and the contents of the three flavonoids (Fig. 7j). The results revealed distinct contributions of each component to the antioxidant mechanism: dihydromyricetin showed a significant positive correlation with total reducing power (r = 0.56, p < 0.05), confirming its central antioxidant role through electron transfer mechanisms[32]. Myricetin was significantly positively correlated with both DPPH scavenging capacity (r = 0.58, p < 0.05) and O2− scavenging capacity (r = 0.62, p < 0.05), highlighting its prominent role in direct radical scavenging. Anthocyanins exhibited a weak negative correlation with O2− scavenging capacity (r = −0.050), suggesting their limited direct contribution to this measure.
The correlation analysis demonstrates that the overall antioxidant capacity of A. grossedentata arises from the synergistic action of multiple flavonoid components and is regulated by both genetic background and developmental stage.
The antioxidant performance of each line was closely linked to its specific compositional and metabolic profile. Line 1 displayed balanced PAL/CHI/4CL enzyme activities alongside sustained dihydromyricetin content, which together supported its superior O2− scavenging capacity and stable antioxidant performance at the Y and SM stages. In contrast, line 2, with its high dihydromyricetin content and elevated PAL activity at the Y stage, showed the strongest DPPH radical scavenging capacity among all lines, consistent with the potent radical scavenging ability conferred by multiple phenolic hydroxyl groups in its structure. Line 3 exhibited notably high total reducing power at the Y stage, while line 4 maintained a consistently moderate antioxidant capacity across developmental stages. Furthermore, line 5 was characterized by a distinct metabolic pattern of high 4CL activity, high anthocyanin content, and low dihydromyricetin content; this profile resulted in DPPH scavenging capacity second only to line 2 and still exceeded that of the remaining lines. These findings further underscore the important contribution of dihydromyricetin to antioxidant function and suggest that the contribution of anthocyanins may be modulated by more potent antioxidants such as dihydromyricetin and myricetin.
In summary, this study clarifies that different flavonoid components play distinct roles in the antioxidant mechanism. O2− scavenging capacity depends primarily on dihydromyricetin and myricetin, with little association to anthocyanins. In comparison, DPPH radical scavenging capacity and total reducing power arose from the combined contributions of multiple components, including dihydromyricetin, myricetin, and anthocyanins. This indicates that the antioxidant efficacy of A. grossedentata is determined by the overall balance and synergy among flavonoid components, rather than by the content of any single compound.
-
This study systematically elucidated the quality formation mechanism of five A. grossedentata lines with different leaf colors by integrating leaf color phenotype quantification, quantitative descriptive analysis (QDA), untargeted metabolomics, and biochemical analysis. The results showed that the differentiation of flavor quality and in vitro antioxidant activity among lines with different leaf colors represents a comprehensive manifestation of the remodeling of secondary metabolic pathways, primarily driven by flavonoids. The developmental maturity of the plant material is a key influencing factor, with young stems and leaves (Y) and semi-mature stems and leaves (SM) representing critical stages for flavor formation and quality evaluation. Untargeted metabolomics revealed that the thickness and smoothness of tea infusion mainly depend on the synergistic effects of specific amino acids and lipids, whereas sweetness and aftertaste are co-regulated by key metabolic hubs such as specific methylated flavonoids and terpenoid glycosides. In terms of metabolic regulation, key enzymes in the flavonoid biosynthesis pathway are subject to dual regulation by developmental stage and genetic background. The activities of PAL and CHI decrease progressively with developmental progression (Y > SM > M), while 4CL activity is mainly determined by genetic background. Collectively, these three enzymes regulate the accumulation of characteristic flavonoids such as dihydromyricetin, myricetin, and anthocyanins, thereby shaping the unique flavor profiles and in vitro antioxidant capacity of each line.
In conclusion, this study has elucidated the metabolic basis of quality differentiation among A. grossedentata lines with different leaf colors, providing a systematic theoretical foundation for the selection of characteristic varieties and the precise development of the industry.
-
The authors confirm contributions to the paper as follows: study conception and design: Su Z; experiments performed: Su Z, Rong Z; analysis and interpretation of results: Su Z; draft manuscript preparation: Su Z; review: Huang J, Liu Z, Lin Y, Yu L; funding acquisition: Liu Z, Yu L. All authors reviewed the results and approved the final version of the manuscript.
-
All data generated or analyzed during this study are included in this published article and its supplementary information files.
-
The authors declare that they have no conflict of interest.
-
accompanies this paper online at: https://doi.org/10.48130/bpr-0026-0020.
- Supplementary Table S1 Description of stem and leaf quantitative traits and color differences for the five Ampelopsis grossedentata lines.
- Supplementary Table S2 Stem and leaf sensory evaluation results for the five Ampelopsis grossedentata lines.
- Copyright: © 2026 by the author(s). Published by Maximum Academic Press, Fayetteville, GA. This article is an open access article distributed under Creative Commons Attribution License (CC BY 4.0), visit https://creativecommons.org/licenses/by/4.0/.
-
About this article
Cite this article
Su Z, Rong Z, Lin Y, Huang J, Liu Z, et al. 2026. Multidimensional evaluation of five Ampelopsis grossedentata lines with distinct leaf colors: from quality characterizations to their antioxidant activity. Beverage Plant Research 6: e037 doi: 10.48130/bpr-0026-0020 

Multidimensional evaluation of five Ampelopsis grossedentata lines with distinct leaf colors: from quality characterizations to their antioxidant activity
- Received: 14 February 2026
- Revised: 30 April 2026
- Accepted: 04 May 2026
- Published online: 13 October 2026
Abstract: The young stems and leaves of Ampelopsis grossedentata serve as a primary material for herbal tea and show significant leaf color phenotypic diversity in field-grown plants. This study systematically investigated the quality formation mechanisms in five distinct lines displaying pronounced leaf color variations, employing an integrated approach encompassing sensory evaluation, physicochemical analysis, and metabolomics. Results indicated that distinguishing differences in the constituent components and their contents among the green, light purple, and purplish-red lines, and the young (Y) and semi-mature (SM) leaf stages are the key periods for flavor formation and quality evaluation. Metabolomics and correlation analyses revealed that the mellowness and smoothness of the infusion are primarily associated with specific amino acids and lipid profiles, while sweetness and lingering sweet aftertaste are co-modulated by multiple metabolites, including methylated flavonoids and terpenoid glycosides, and so on. The activities of key flavonoid biosynthesis enzymes (PAL, CHI, 4CL) were regulated by both genetic background and maturation stage, influencing the accumulation of dihydromyricetin, myricetin, and anthocyanins, thereby shaping the distinct quality characteristics and antioxidant capacities of each line. This study systematically elucidated the quality differentiation mechanisms among five genetic resources with distinct leaf colors, which could provide a systematic theoretical foundation for genetic resource evaluation and targeted product development of A. grossedentata.