


-
The electrification of transportation represents one of the primary trends in the future evolution of urban transportation systems. Trucks, serving as the principal carriers of road freight transportation, are also embracing the development of electrification. Given the fact that the carbon emissions caused by road freight transportation account for more than 60% of the emissions of freight, it is necessary to promote the electrification of trucks[1]. Thanks to the rapid development of electric vehicle (EV) technology and policy support, many cities have been witnessing the increasing scale of battery electric trucks (BETs) in the freight transportation industry. For example, the BETs in Beijing (the capital of China), have already accounted for more than 20% of the trucks in freight transportation, and their scale is still rapidly growing[2]. In the foreseeable future, the BET will become the main vehicle type for urban freight transportation. However, unlike conventional oil-fueled trucks, BETs typically have shorter driving ranges, posing challenges for freight transportation companies. In order to establish a reasonable freight transport scheme, the operators of freight transportation companies need to understand the energy consumption rate (ECR) of BETs and ensure that the transport tasks can be finished without breaking down due to energy depletion. This need is particularly crucial due to the dynamic nature of BET energy consumption. This concept refers to the variability in energy consumption patterns caused by fluctuating operational conditions such as speed changes, driving behavior, battery charge state, and real-time environmental factors. ECR directly affects driving range as it represents energy consumption per unit of driving distance. In a real-world situation, the ECR is influenced by various factors, and thus, it is difficult to accurately obtain the driving range by the calibrated ECR that is often measured under specified operating conditions and cycle conditions. In addition, BETs in cities are mainly used for cargo, and there are significant differences in operating modes and vehicle characteristics compared to other types of vehicles, such as passenger cars and buses, which further results in differences in the ECR. To this end, special attention should be provided to the ECR estimation for BETs by considering the impact of actual environments.
In recent years, with the development of transportation electrification, a number of research studies have focused on the estimation of energy consumption for EVs. A conventional approach for energy consumption estimation is to explore the operating mechanism of the vehicle by considering visible vehicle states. Such an approach often aims to analyze the driving range under a certain operating state. For example, Zhang et al. established a set of systematic models for ECR estimation under different operation modes from a physical and statistical perspective[3]. Liu et al. introduced the predictive control theory into the energy consumption estimation for the EV battery[4]. Fiori et al. proposed a model to compute the instantaneous energy consumption of EVs for real-time eco-driving and eco-routing systems[5]. Miri et al.[6] and Xie et al.[7] further investigated the ECR using simulation-based models by considering different parameters on the performance characteristics of EVs. Doluweera et al. conducted a scenario-based study to examine the battery energy consumption and utilized a hybrid simulation method to model the EVs in the transport system[8]. The above-mentioned approaches attempted to use numerical models to explore the relationship between visible vehicle states and ECR. However, these approaches often neglected the impacts of real-world operating environments on vehicle operation. As a matter of fact, the operation process of EVs is affected by multiple invisible factors, such as driver's driving habits and road network conditions, and thus, only relying on the visible state of EVs makes it hard to ensure an accurate estimation of energy consumption in a certain state.
With the development of data collection technology, many transportation operators have the ability to gain a rich supply of real-world data on vehicle operations. The data is able to record vehicle operation features in the actual traffic environment, such as driving speed and ECR. More importantly, some invisible factors can also be indirectly reflected by the real-world data, which makes the vehicle operation feature more realistic. Given the advantages of data, several studies have investigated the energy consumption of EVs by utilizing data-based approaches. For instance, Du et al. used the grey neural network model to estimate the battery state of charge of EVs considering rebound voltage[9]. Li et al. provided a dynamic data-driven model with Markov machine representation to estimate the energy consumption of EV batteries[10]. Sheng & Xiao proposed a fuzzy least square support vector machine to improve the estimation accuracy of the battery state of charge for EVs[11]. Wang et al. adopted ensemble machine learning methods to estimate the battery energy consumption rate and further discussed its impacts on the driving range of electric buses[12]. Zhang et al. used the real-world data collected from electric taxis to estimate the energy consumption based on the machine learning method[13]. How et al. and Tian et al. investigated the battery energy consumption rates of EVs using deep neural network-based approaches[14,15]. Chandran et al. and Manoharan et al. attempted to adopt multiple machine-learning algorithms to estimate the energy consumption rates of EVs and compare their performance[16,17]. Basso et al. proposed a probabilistic Bayesian machine learning model to estimate energy consumption for the use of EV routing problems[18]. Ji et al. provided a logarithmic, linear model to estimate the energy consumption for electric buses based on their operation data[19].
Note that, whilst the aforementioned works have shown some achievements in the ECR estimation of EVs, there are still several challenges that need to be overcome. For one thing, although existing literature has discussed the energy consumption of EVs, it mainly focuses on passenger EVs, whose operating modes and vehicle characteristics differ significantly from BETs. In real-world operations, several factors impact ECR estimation, including driving behavior. Factors like acceleration, deceleration, and driving style (e.g., aggressive or conservative driving) significantly affect energy consumption. Load and road conditions: The vehicle's load (e.g., cargo weight) and road conditions (e.g., incline, traffic) affect ECR. Battery aging: Over time, a battery's capacity and efficiency degrade. Using real-world BET operation data, the data-driven method overcomes the limitations of traditional model-based approaches. It more accurately reflects BET operational states while capturing dynamic influences like human factors and environmental conditions. Moreover, existing studies have often used black box methods to model ECR estimation, which usually has complex parameters It is difficult to accurately obtain the mathematical expression of the models, making it inconvenient for practical applications. In view of the above issues, this paper aims to use the BET operation data to investigate the ECR of BETs operating in the actual environment. The primary objective of this study is to establish a data-driven model for ECR estimation of BETs based on the nonlinear regression method, and a specific mathematical expression of the model is provided. The proposed model is able to overcome the limitations of the existing BET energy consumption estimation models through the specific data-driven approach and nonlinear regression, where the complex relationship between driving speed and ECR can be better captured. In summary, the proposed model offers a more nuanced, data-driven, and comprehensive approach to estimating ECR compared to existing models, making it a valuable tool for BET operational optimization and energy management. Based on the proposed ECR estimation model, the economic driving speed is further discussed. Identifying the economical driving speed can significantly assist logistics companies in reducing both energy consumption and transportation costs while maintaining optimal delivery times. Additionally, it provides drivers with valuable insights to make informed decisions that can help extend the vehicle's range, particularly during long-distance trips.
Specifically, the principal contributions of this study are summarized as follows. First, this research leverages the real-world data of BET operations to explore the energy consumption patterns of these vehicles. It overcomes the challenge that conventional estimation models, usually built with data from passenger cars and buses, frequently encounter difficulties in being effectively applied to BETs. Second, a data-driven method is adopted to construct a nonlinear regression model for estimating the ECR of BETs, along with its mathematical formulation. The mathematical formulation can accurately describe the relationship between driving speed and ECR and combine speed decision-making to minimize energy consumption with strong generality and scalability. Finally, following the validation of the model, the economic speed of BETs is verified to be 52.02 km/h, which can reduce the overall energy consumption of the BETs and improve energy utilization efficiency. The results of this study can offer decision-making support for freight transportation companies in formulating transport plans customized for BETs.
-
In this study, the real-time operation data of ten BETs with the same specifications is used to investigate the ECR estimation. The dataset for BET operation comprises a total of 471,102 original data entries, encompassing a wide range of parameters related to BET performance. This dataset includes 69 indicators, such as current, voltage, driving speed, state of charge (SOC), and accumulated mileage, recorded during the operation of the BETs. Although previous studies have indicated that factors such as slope and road conditions can influence the energy consumption of electric vehicles, recent data-driven research has identified speed as the predominant factor affecting the energy consumption ratio[20,21]. It will be a major part of the subsequent calculations. The data collection focuses on BETs primarily engaged in daily commuting and cargo transportation tasks, making their operational status and performance crucial for analyzing charging induction issues. To ensure the accuracy of the final experimental results, some factors of BETs are limited: The BETs are equipped with lithium iron phosphate batteries, each with a capacity of approximately 82.5 kWh; The load of the BETs during the data collection process is 0; The data collection section is urban traffic road. Although slope has a potential impact on the energy consumption of BET, considering the dataset and operating conditions used, the influence of slope on analysis results is relatively small. The collected real-world data covers various driving environments and conditions, including driving conditions in cities and highways. In these data, vehicles mostly travel on relatively flat road sections, and the proportion of slope changes during operation is relatively low.
Before the data cleaning and extraction process, this section first defines and explains the information contained within the dataset. Driving speed and driving range correspond to the speed displayed on the BET's instrument panel (in km/h) and the accumulated mileage (in meters), respectively. Generally, these data exhibit continuity, providing a solid foundation for subsequent analysis and processing. The state of charge (SOC) refers to the current level of battery power remaining, typically expressed as a percentage[21]. It is defined as the ratio of the remaining battery capacity to the total battery capacity. An SOC of 0% indicates that the battery is fully discharged, while an SOC of 100% signifies that the battery is fully charged. The mathematical expression for SOC is represented in Eq (1):
$ SOC = \dfrac{{{E_t}}}{E} \times 100{\text{%}} $ (1) where, SOC represents the SOC of the BET, Et is the current battery capacity (in kWh); E is the nominal battery capacity (in kWh).
Data cleaning
-
The original data will inevitably be affected by the external environment during the collection process, such as the disconnection of the wireless network and the abnormality of the collection instrument, which leads to data duplication, data abnormality, and missing data. Therefore, the original data should be cleaned before further analysis to reduce the negative influence on the accuracy and reliability of the estimation results.
Data duplication is a common issue found in the original dataset, leading to an increase in redundant data, which in turn raises query time and decreases both computing efficiency and data accuracy. To address this problem, duplicate data entries within the original dataset can be identified and removed using methods for extracting and deleting redundant and repetitive data. This process ensures the uniqueness and accuracy of the dataset.
Table 1 displays the repetitive data entries. In this table, it can be observed that the driving data of the BET remains unchanged over four consecutive rows, with values such as current and speed consistently recorded as 0 and voltage remaining at 563, indicating the presence of duplicate data.
Table 1. An example of duplicate data.
Current (A) Voltage (V) Driving speed (km/h) SOC (%) Mileage (m) 0 563 0 99 19560600 0 563 0 99 19560600 0 563 0 99 19560600 0 563 0 99 19560600 The issue of data abnormality is evident in a small portion of the SOC values, which have inexplicably changed to 0. During normal driving and charging, the SOC should fluctuate continuously within an effective range, and a true value of zero should not occur. As shown in Fig. 1, the trends of SOC variation, when not accounting for outliers, reflect the continuous changes in the overall SOC curve; outliers with an SOC of 0 are highlighted with solid red circles. It can be observed that the points on the curve where SOC drops to 0 represent abnormal spikes. To mitigate the impact of these abnormal data on the overall analysis, a data deletion method can be employed to extract and remove the entries with an SOC of 0 from the dataset. After the removal of these abnormal data points, the overall change curve becomes more coherent, and the potential for error in data analysis is significantly reduced.
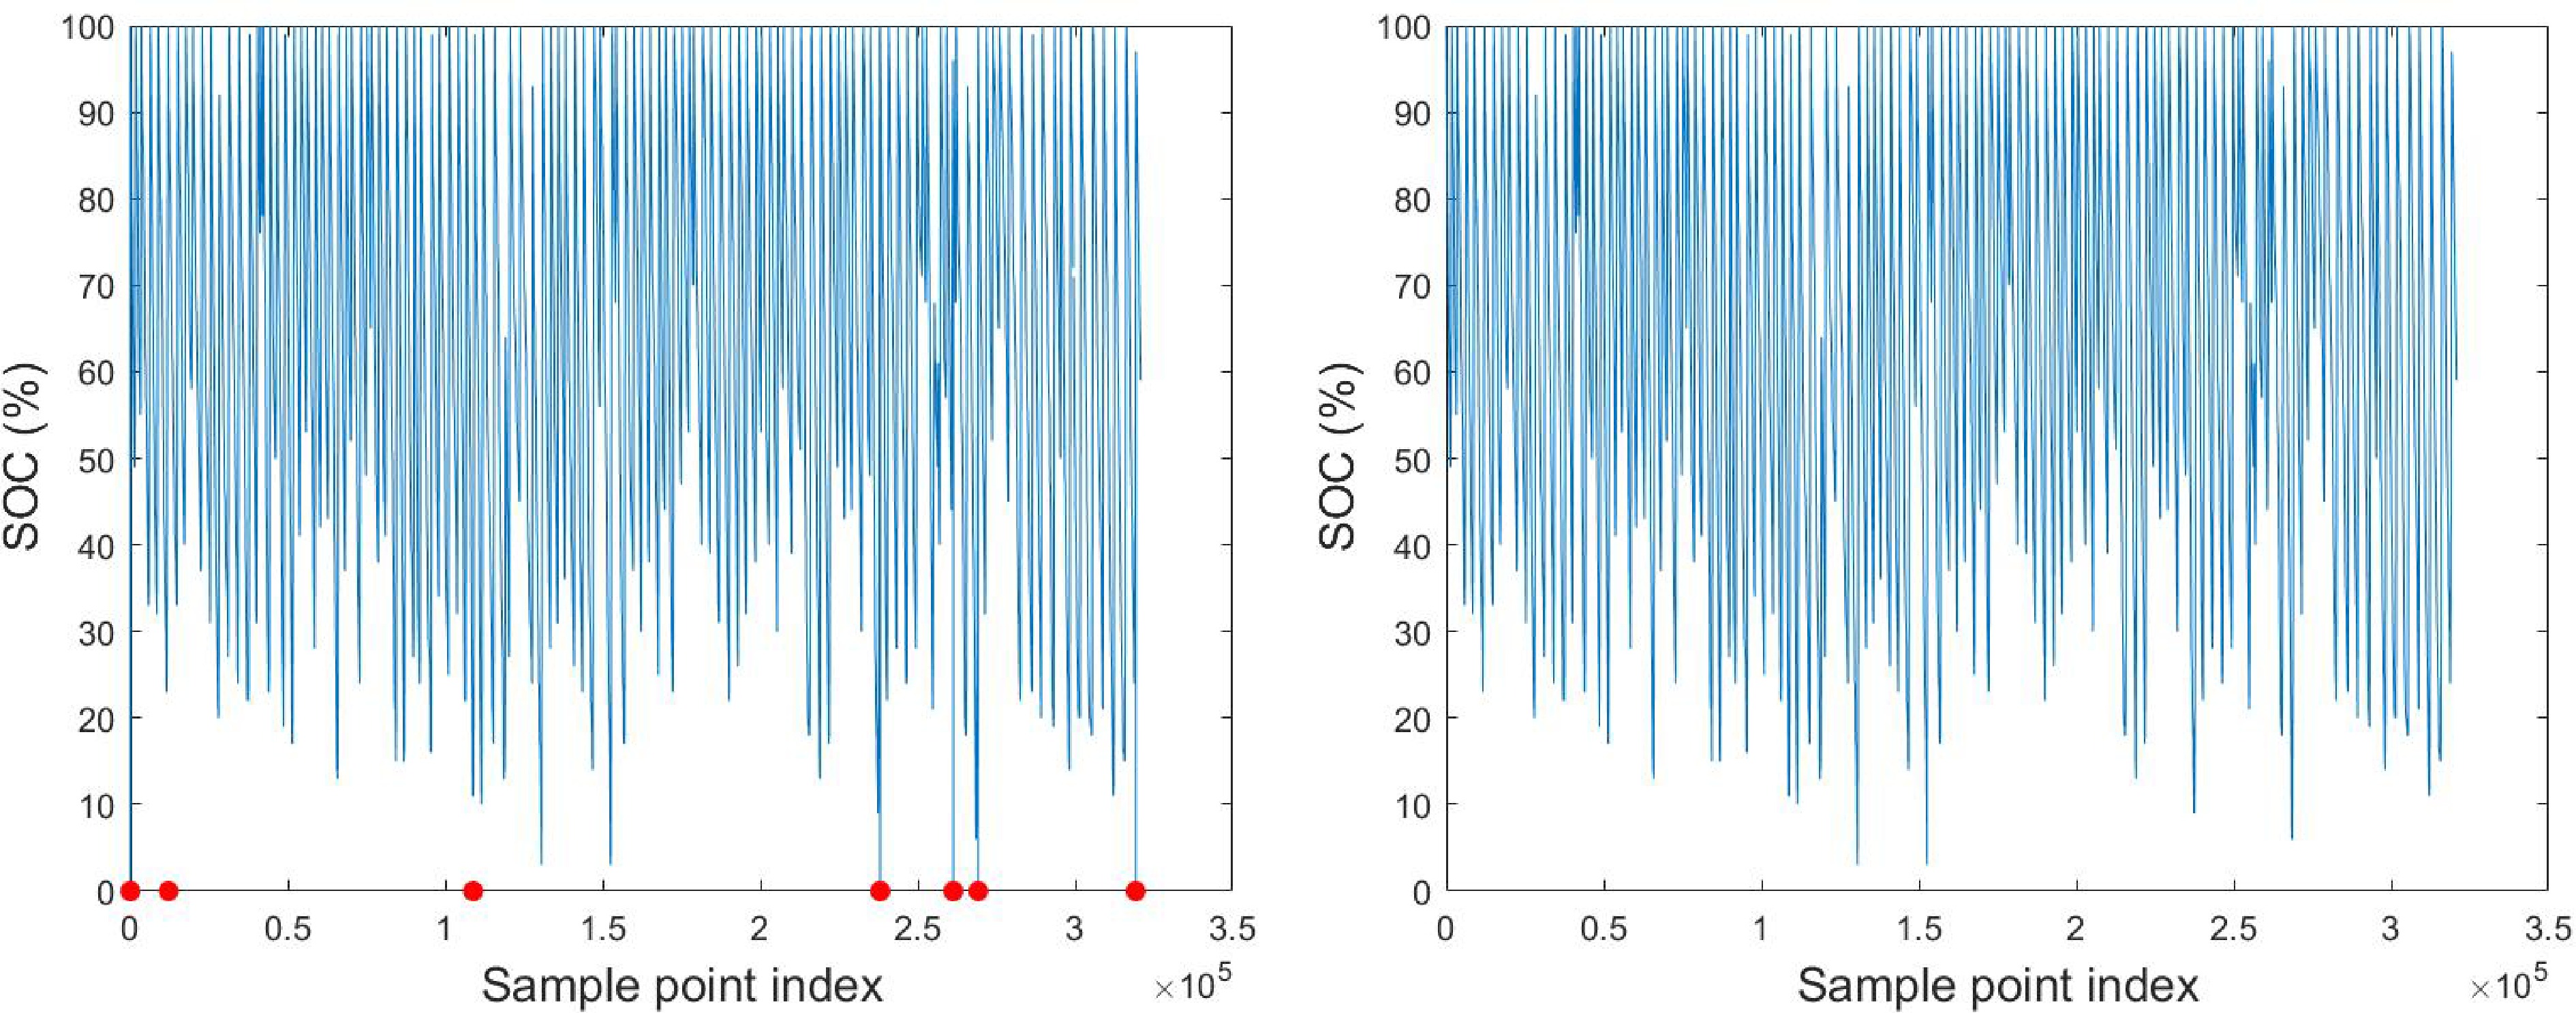
Figure 1.
SOC trends before and after outliers are removed.
The issue of missing data occurs during the early stages of each driving state of the BETs, primarily due to instability in the data acquisition instrument or temporary interruptions in the data transmission process, as shown in Table 2. To address this problem, a method for supplementing the missing data can be employed. Given that the frequency of missing data is low, the value of the most recent non-missing data point would be used to fill in the gaps. This approach not only preserves the accuracy and validity of the original data but also facilitates subsequent calculations and operations. Table 2 illustrates an example of missing data.
Table 2. An example of missing data.
Current (A) Voltage (V) Driving speed (km/h) SOC Mileage (m) NAN NAN NAN NAN NAN 0 562.60 0 99 19560500 5.20 560.90 1.20 99 19560500 NAN NAN NAN NAN NAN Data extraction
-
In the subsequent data processing process, the ECR estimation model of BET will be established according to the driving data of BETs. Therefore, it is necessary to separate the driving state and charging state in the running data of BETs and analyze the driving process separately. The main basis for distinguishing the driving state and the charging state is the changing trend of SOC. Since the BET alternately changes in the driving state from the charging state, SOC also shows a cyclical change of declining, rising, and falling. If the SOC shows a downward trend, it means that the BET is consuming energy and is in a running state. If the SOC is on the rise, it means that the BET is being charged and is in a charging state. According to the criterion of SOC change trend, the data set of SOC decreasing part is extracted, which is the data under the driving state of BETs.
It is important to note that the trends in SOC can exhibit fluctuations and are not strictly monotonically increasing or decreasing. This variability arises from minor errors in SOC detection, which can cause a small number of data points within an overall declining or rising trend to reverse the expected change. Figure 2 illustrates an example of this abnormal situation. Therefore, when the SOC of the current data point exceeds that of the previous data point during the extraction of the driving state of the BETs, it is essential to further assess whether this indicates a genuine transition to the charging state. This assessment should be based on subsequent changes in SOC; for instance, if the SOC remains in an upward trend for a period following the data point in question. This approach helps to prevent erroneous data points from compromising the accuracy of state judgments.
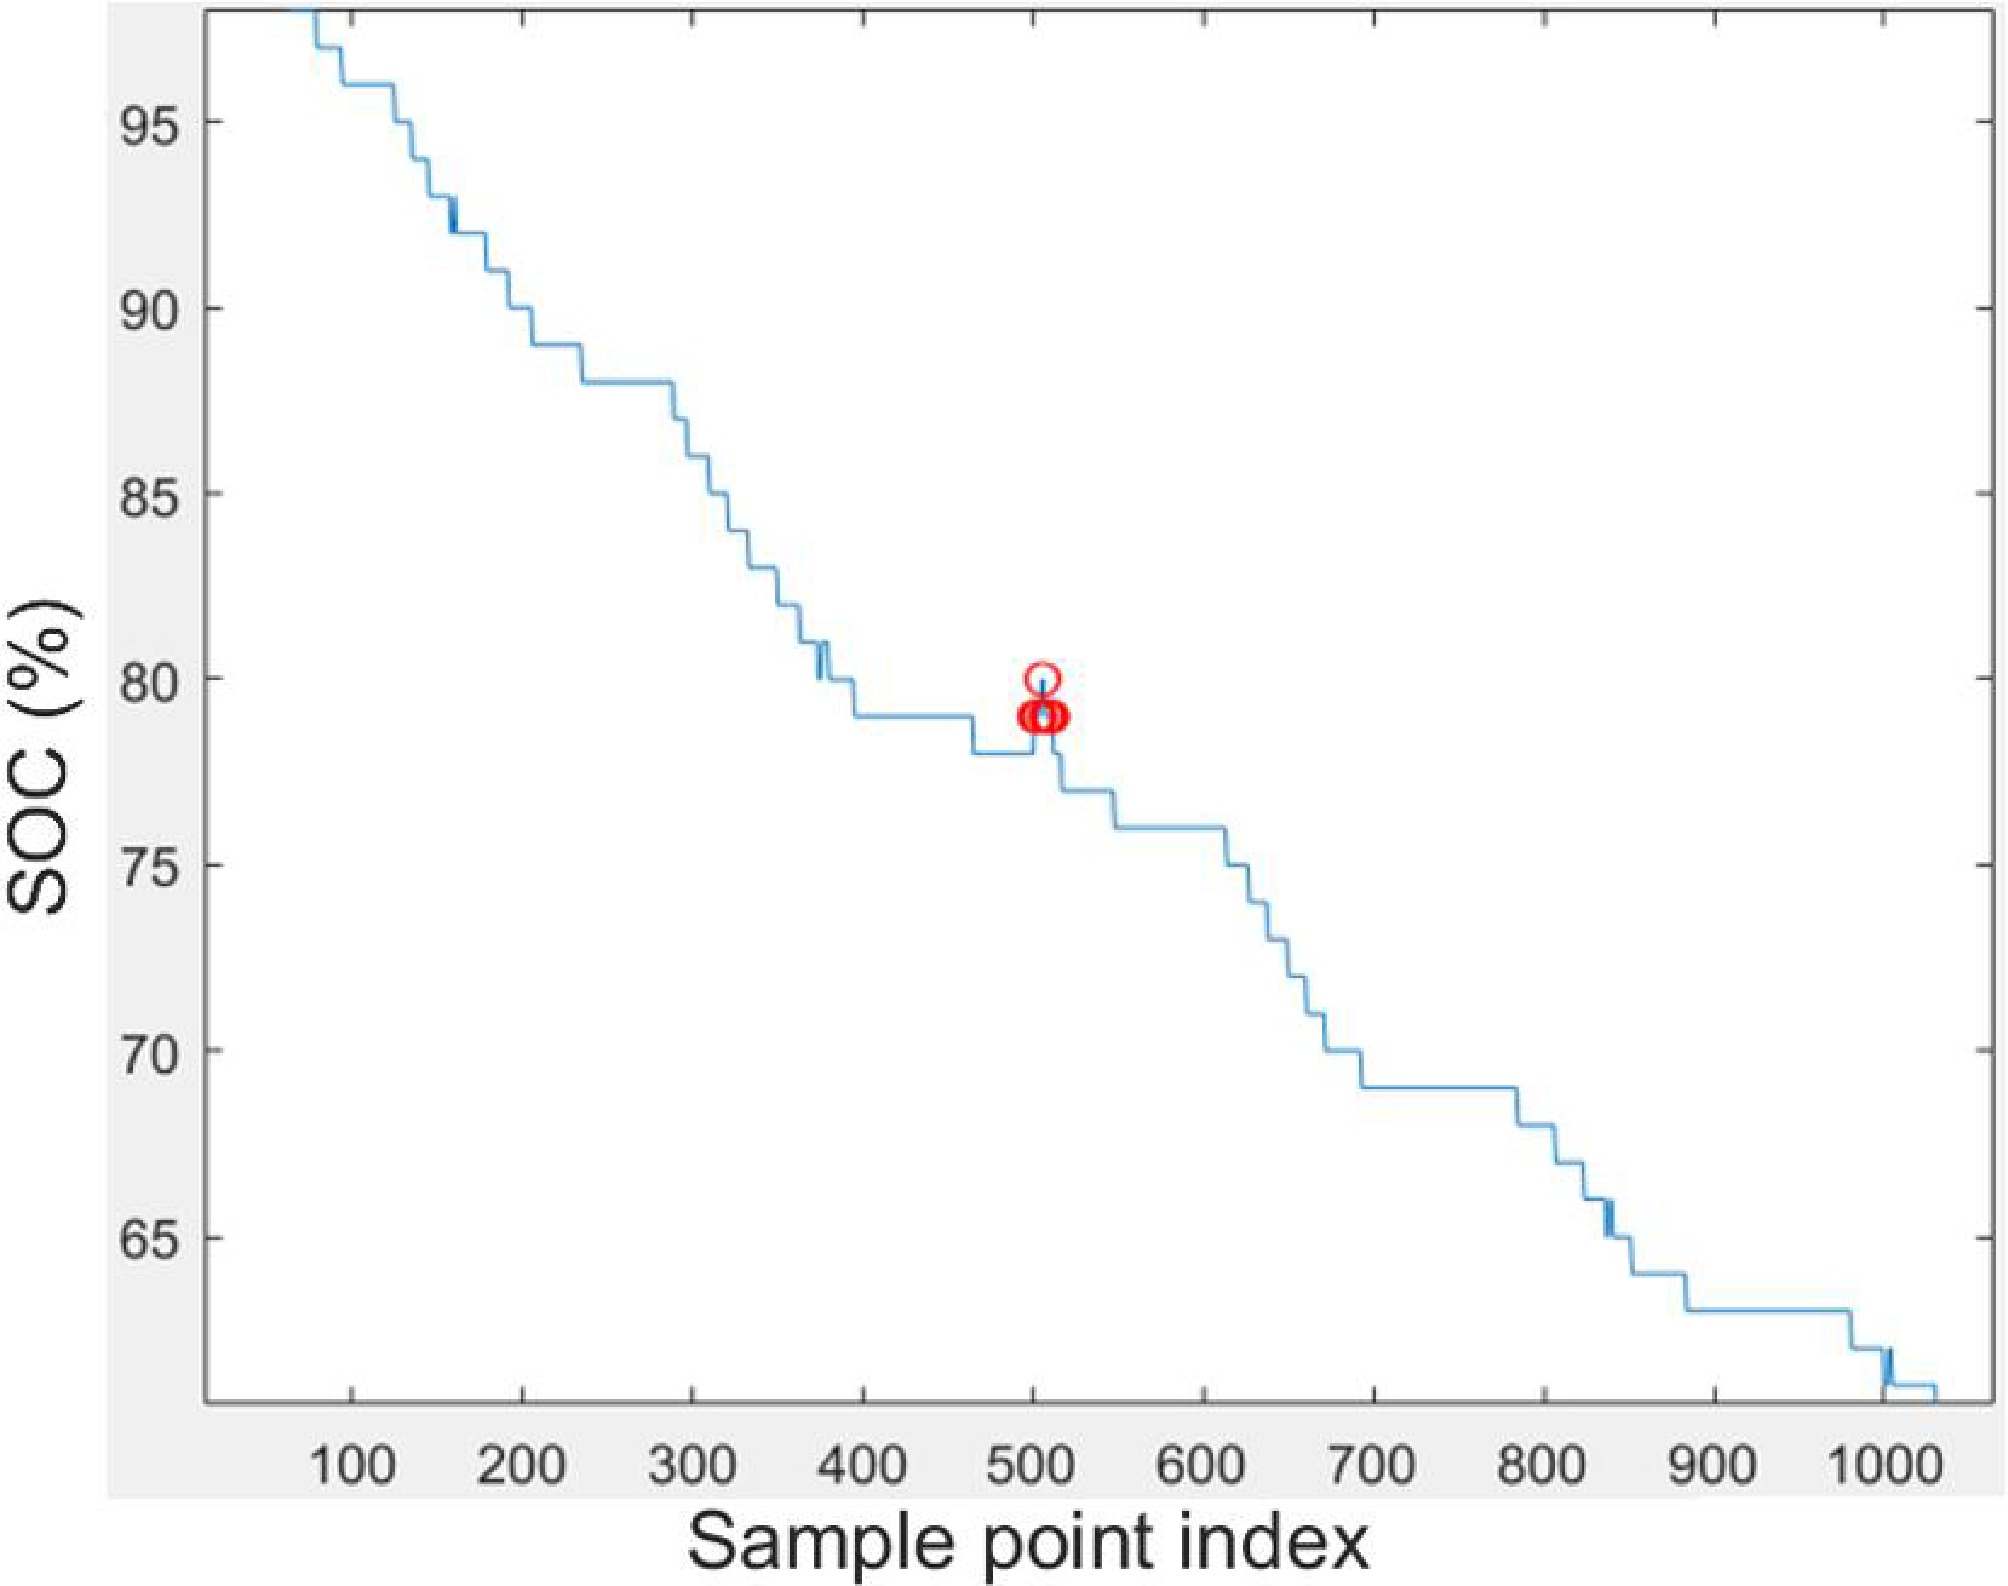
Figure 2.
An example of SOC trend under abnormal conditions.
The processed data includes segments exhibiting a decreasing trend in SOC, as depicted in Fig. 3. Following data cleaning and extraction, a total of 273,202 data points have been obtained, which can be classified into 118 complete discharge processes. On average, each discharge process consists of approximately 2,000 data points.
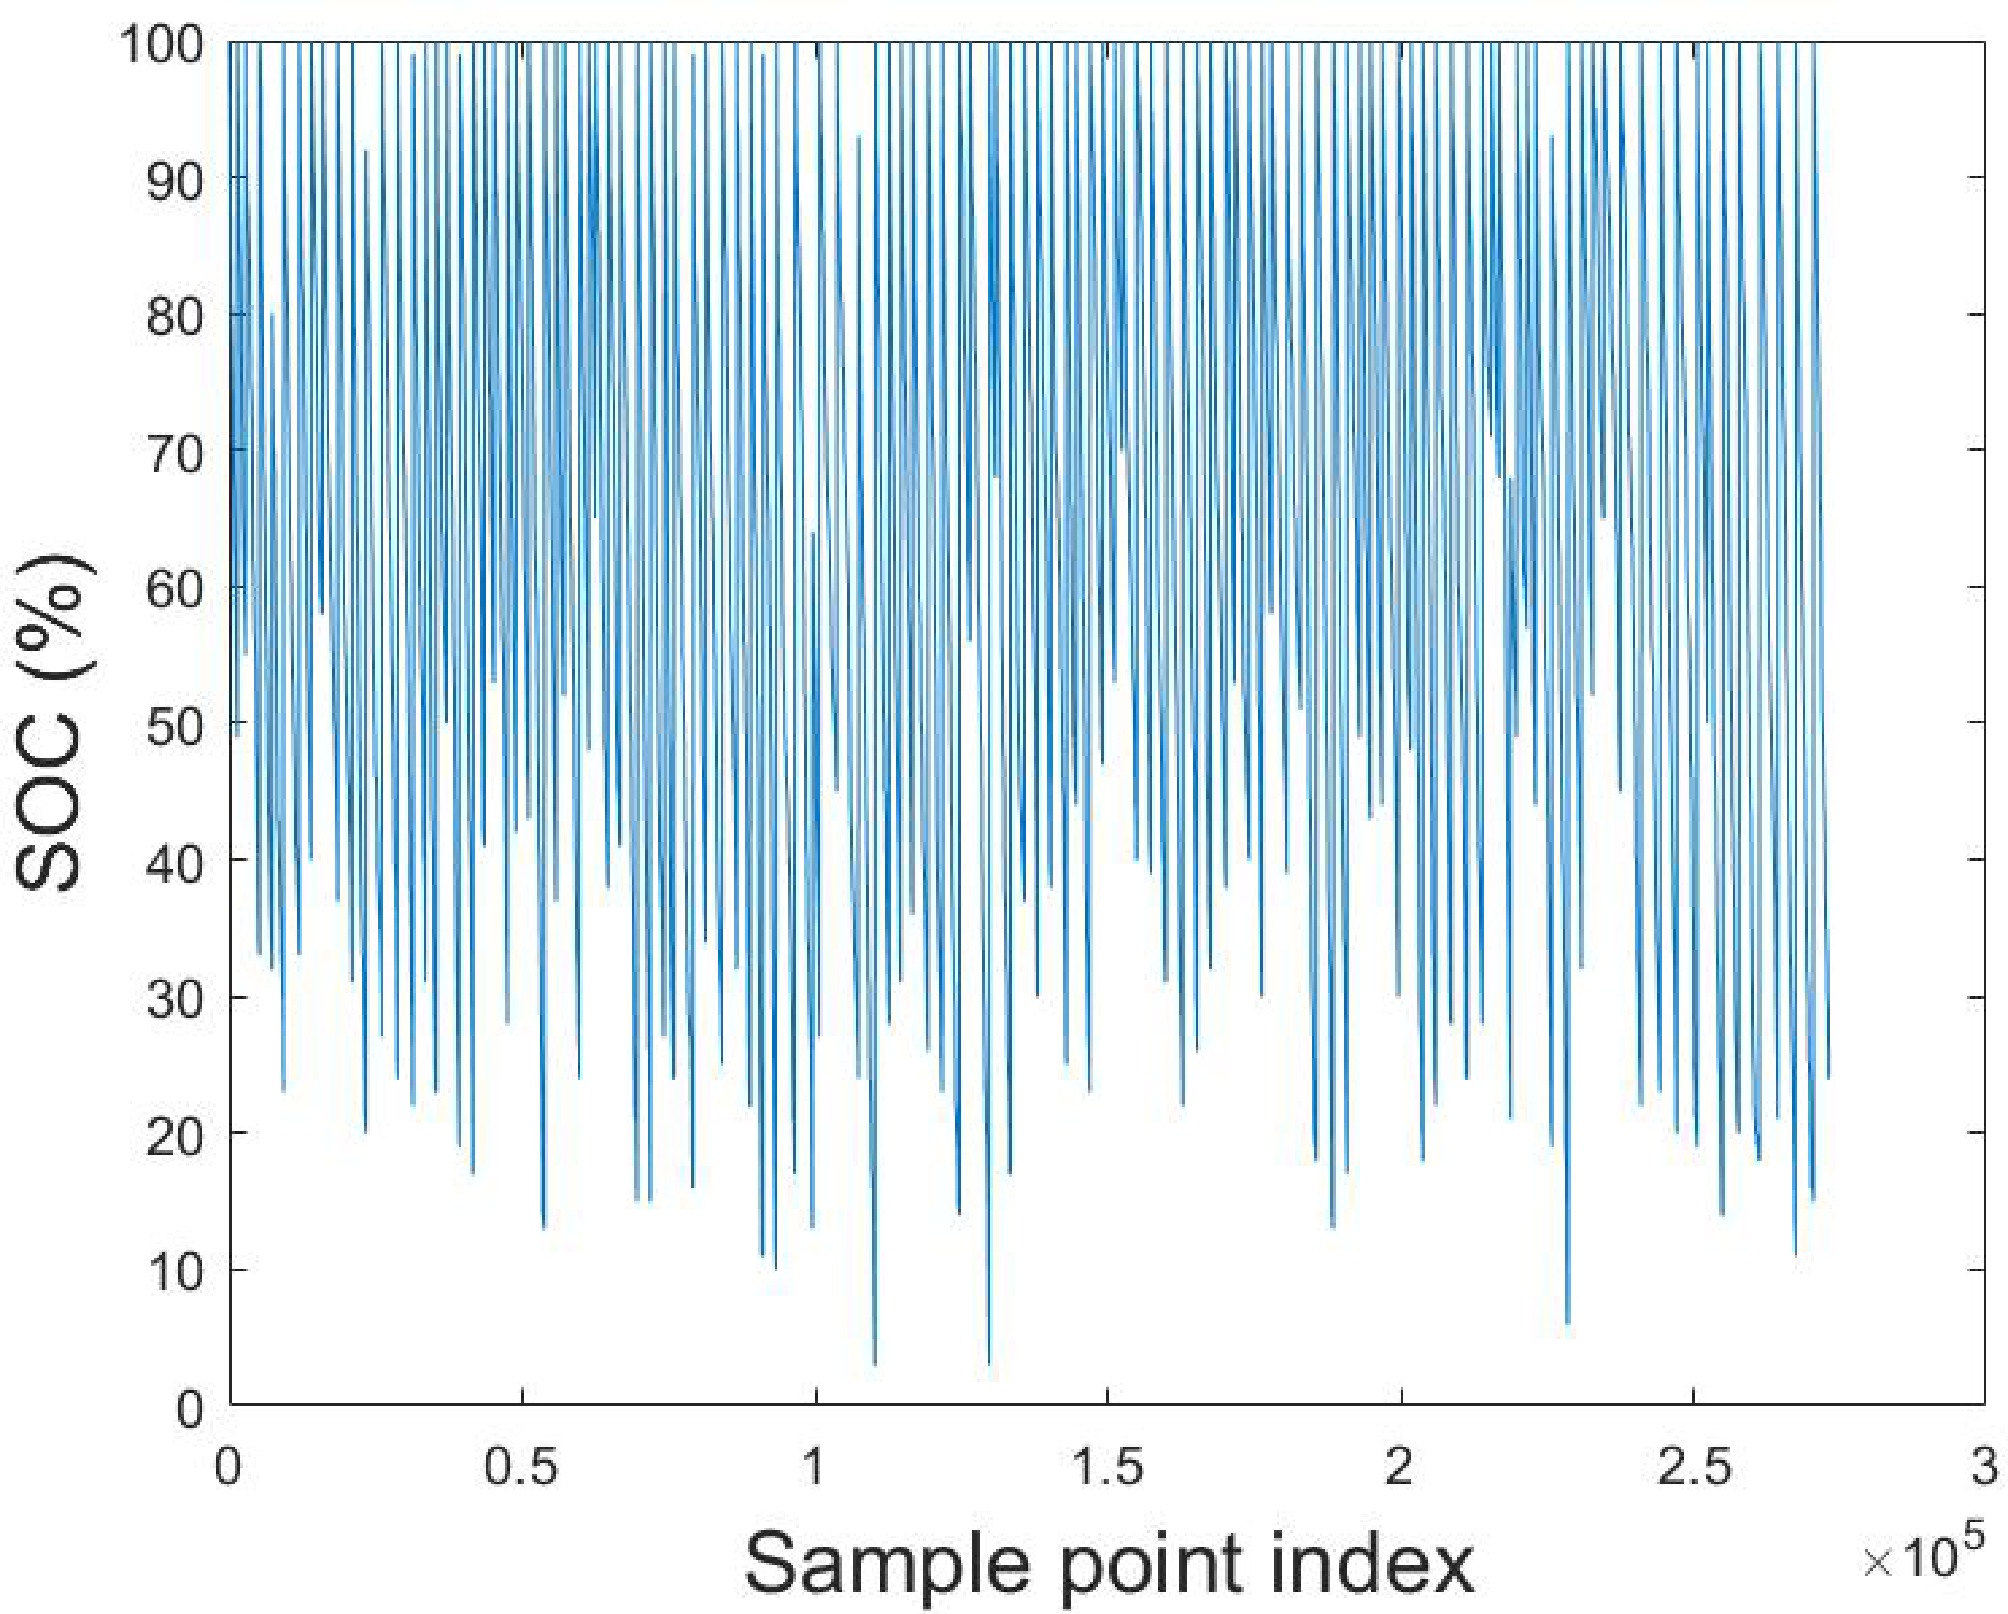
Figure 3.
SOC decreasing trend of processed data.
-
Conventional factors such as road conditions, load, and aerodynamics are often relatively consistent in the context of BET operations. As a result, driving speed emerges as the primary variable influencing the calculation of economic driving speed. In a controlled operational environment, other influencing factors are often implicitly captured in the data, making speed the dominant factor in estimating economic efficiency. The ECR of BETs is strongly correlated with driving speed. By establishing an ECR estimation model based on this relationship, energy consumption can be estimated, given specific driving speeds and distances. This model not only highlights the energy consumption characteristics of BETs through mathematical formulas but also aids in identifying the most economical driving speed, essentially determining the speed that maximizes driving range in practical applications. This optimization improves energy efficiency and plays a crucial role in subsequent modeling enhancements.
After data processing, a total of 273,202 data points have been obtained, which can be categorized into 118 complete discharge processes, with each average discharge process containing approximately 2,000 data points. The processed data comprises multiple complete discharge processes, with each complete discharge process referred to as a data group.
To investigate the specific relationship between ECR and the driving speed of BETs, this section divides the processed data into consecutive fixed datasets at specified intervals. For each dataset, the average voltage, average driving speed, changes in SOC, and changes in mileage are calculated. By analyzing these averages and their variations, the energy consumed per kilometer for each dataset at the corresponding average speed can be derived. The mathematical expression used to quantify the relationship between speed and energy consumption is as follows:
$ \bar U = \dfrac{{\sum\nolimits_{i = 1}^p {{U_i}} }}{p} $ (2) $ \bar v = \dfrac{{\sum\nolimits_{i = 1}^p {{v_i}} }}{p} $ (3) $ \Delta SOC = SO{C_1} - SO{C_2} $ (4) $ \Delta d = {d_p} - {d_1} $ (5) $ \Delta {E_t} = \dfrac{{\bar U \cdot E \cdot \Delta SOC}}{{\Delta d}} $ (6) where,
$ \bar U $ $ \bar v $ $ \Delta $ $ \Delta $ $ \Delta $ This section explains how to set the data group interval as a parameter to facilitate data adjustments during subsequent processing. The resulting datasets consist of the average driving speed and ECR. To explore the relationship between average driving speed and ECR, a nonlinear regression estimation method was utilized. Nonlinear regression is a fundamental technique in mathematics and statistics, aiming to establish a curve that effectively describes the distribution trend of these data points based on existing observations. Its flexible fitting capabilities make it widely applicable across various fields[22].
However, it is noted that the dataset may contain multiple ECRs corresponding to the same average driving speed, which can complicate the nonlinear regression fitting process. To address this issue, the one-to-many energy consumption values were analyzed, and similarities were found among them. Consequently, these energy consumption values were averaged, and the calculated average was treated as the sole ECR corresponding to the specific speed. This processing ensures that the corresponding relationship between the two factors meets the requirements for subsequent nonlinear regression fitting while enhancing the accuracy and effectiveness of the data. The resulting scatter plot is presented in Fig. 4.
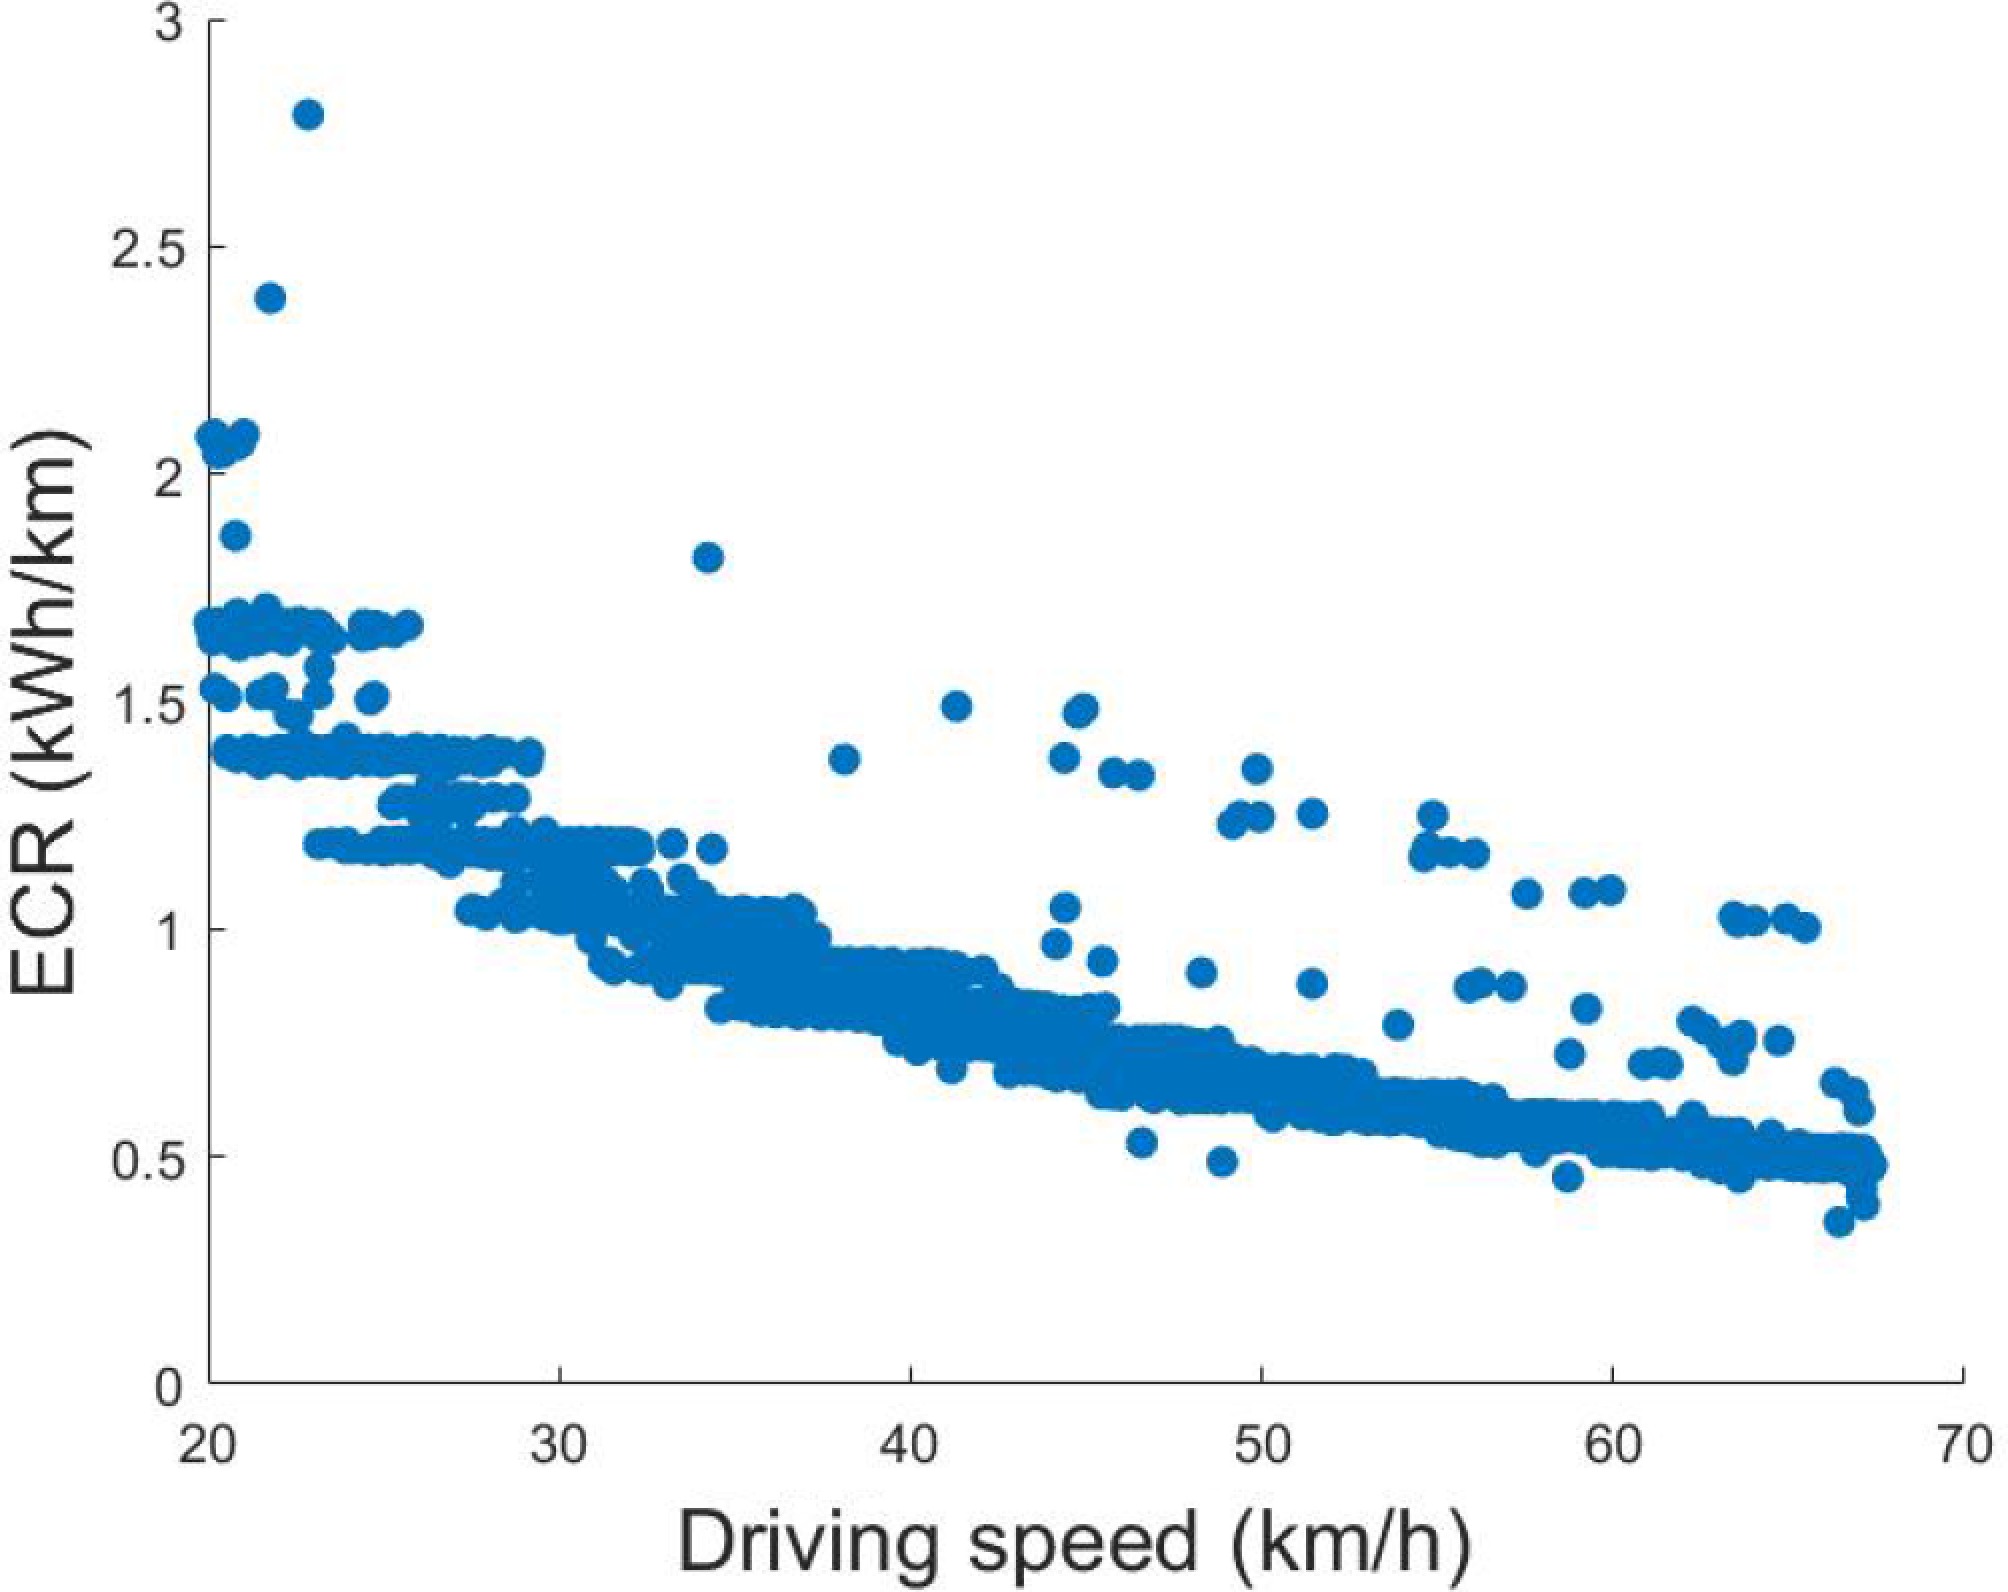
Figure 4.
Scatter plot of the ECR and driving speed.
By observing Fig. 4, it can be noted that the data points are primarily clustered around a curve; the function graph is smooth and does not show a trend of rapid growth or decay. Exponential fitting is generally used to describe situations where data grows rapidly, or decays, logarithmic fitting is often used to describe situations where data growth gradually slows down, power-law relationships are usually applicable to data in the form of power functions, and neural networks are generally used for complex nonlinear modeling, especially for complex and high-dimensional problems with data changes. In contrast, a quadratic function or a higher-order polynomial provides simpler, more computationally efficient, and more interpretable models and can accurately capture the changing trends of data, although the specific parameters require further verification through subsequent calculations.
In this part, function fitting was performed on the scattered points representing the average driving speed and ECR. The underlying mathematical principle of the function is based on least squares curve fitting, which aims to find the best-fitting polynomial by minimizing the residual sum of squares between the fitted polynomial and the actual data points. After inputting the data points and specifying the polynomial order, the function constructs the corresponding Van der Monde matrix and employs the pseudo-inverse operation of the matrix to solve the linear system using the least squares method. This process identifies the polynomial coefficients that minimize the sum of the squared residuals, yielding the final fitting polynomial.
It is important to highlight that when the speed is below 20 km/h, the ECR tends to be significantly higher than average, which does not accurately reflect the energy consumption of BETs. After excluding these anomalous data points, it was determined that the collection subjects in this data sample rarely operated at a constant speed below 20 km/h. Instead, many BETs were mostly in the acceleration or deceleration phases when traveling at speeds below this threshold. In particular, during the motor's transitional phase, the energy required to overcome resistance is substantial, resulting in low ECRs. This leads to inflated results that do not objectively represent the energy consumption of BETs at low and steady speeds.
Therefore, in the nonlinear regression analysis, data points below 20 km/h are excluded from consideration, and the remaining data points are utilized for function fitting. Specifically, the quadratic, cubic, quartic, and quintic functions are selected as candidate model frameworks based on initial observations from the scatter plot. Not only do these functions resemble the scatter plot visually, but they also provide clear mathematical expressions. The predicted ECRs at different driving speeds can be visually assessed, allowing for an understanding of how changes in speed influence ECRs through the varying coefficients, thus offering high flexibility.
Subsequently, the fitting effects of the four functions are compared to determine the most suitable model for the estimation of energy consumption. The fitted curves of the frameworks from the quadratic, cubic, quartic, and quintic functions are illustrated in Fig. 5.
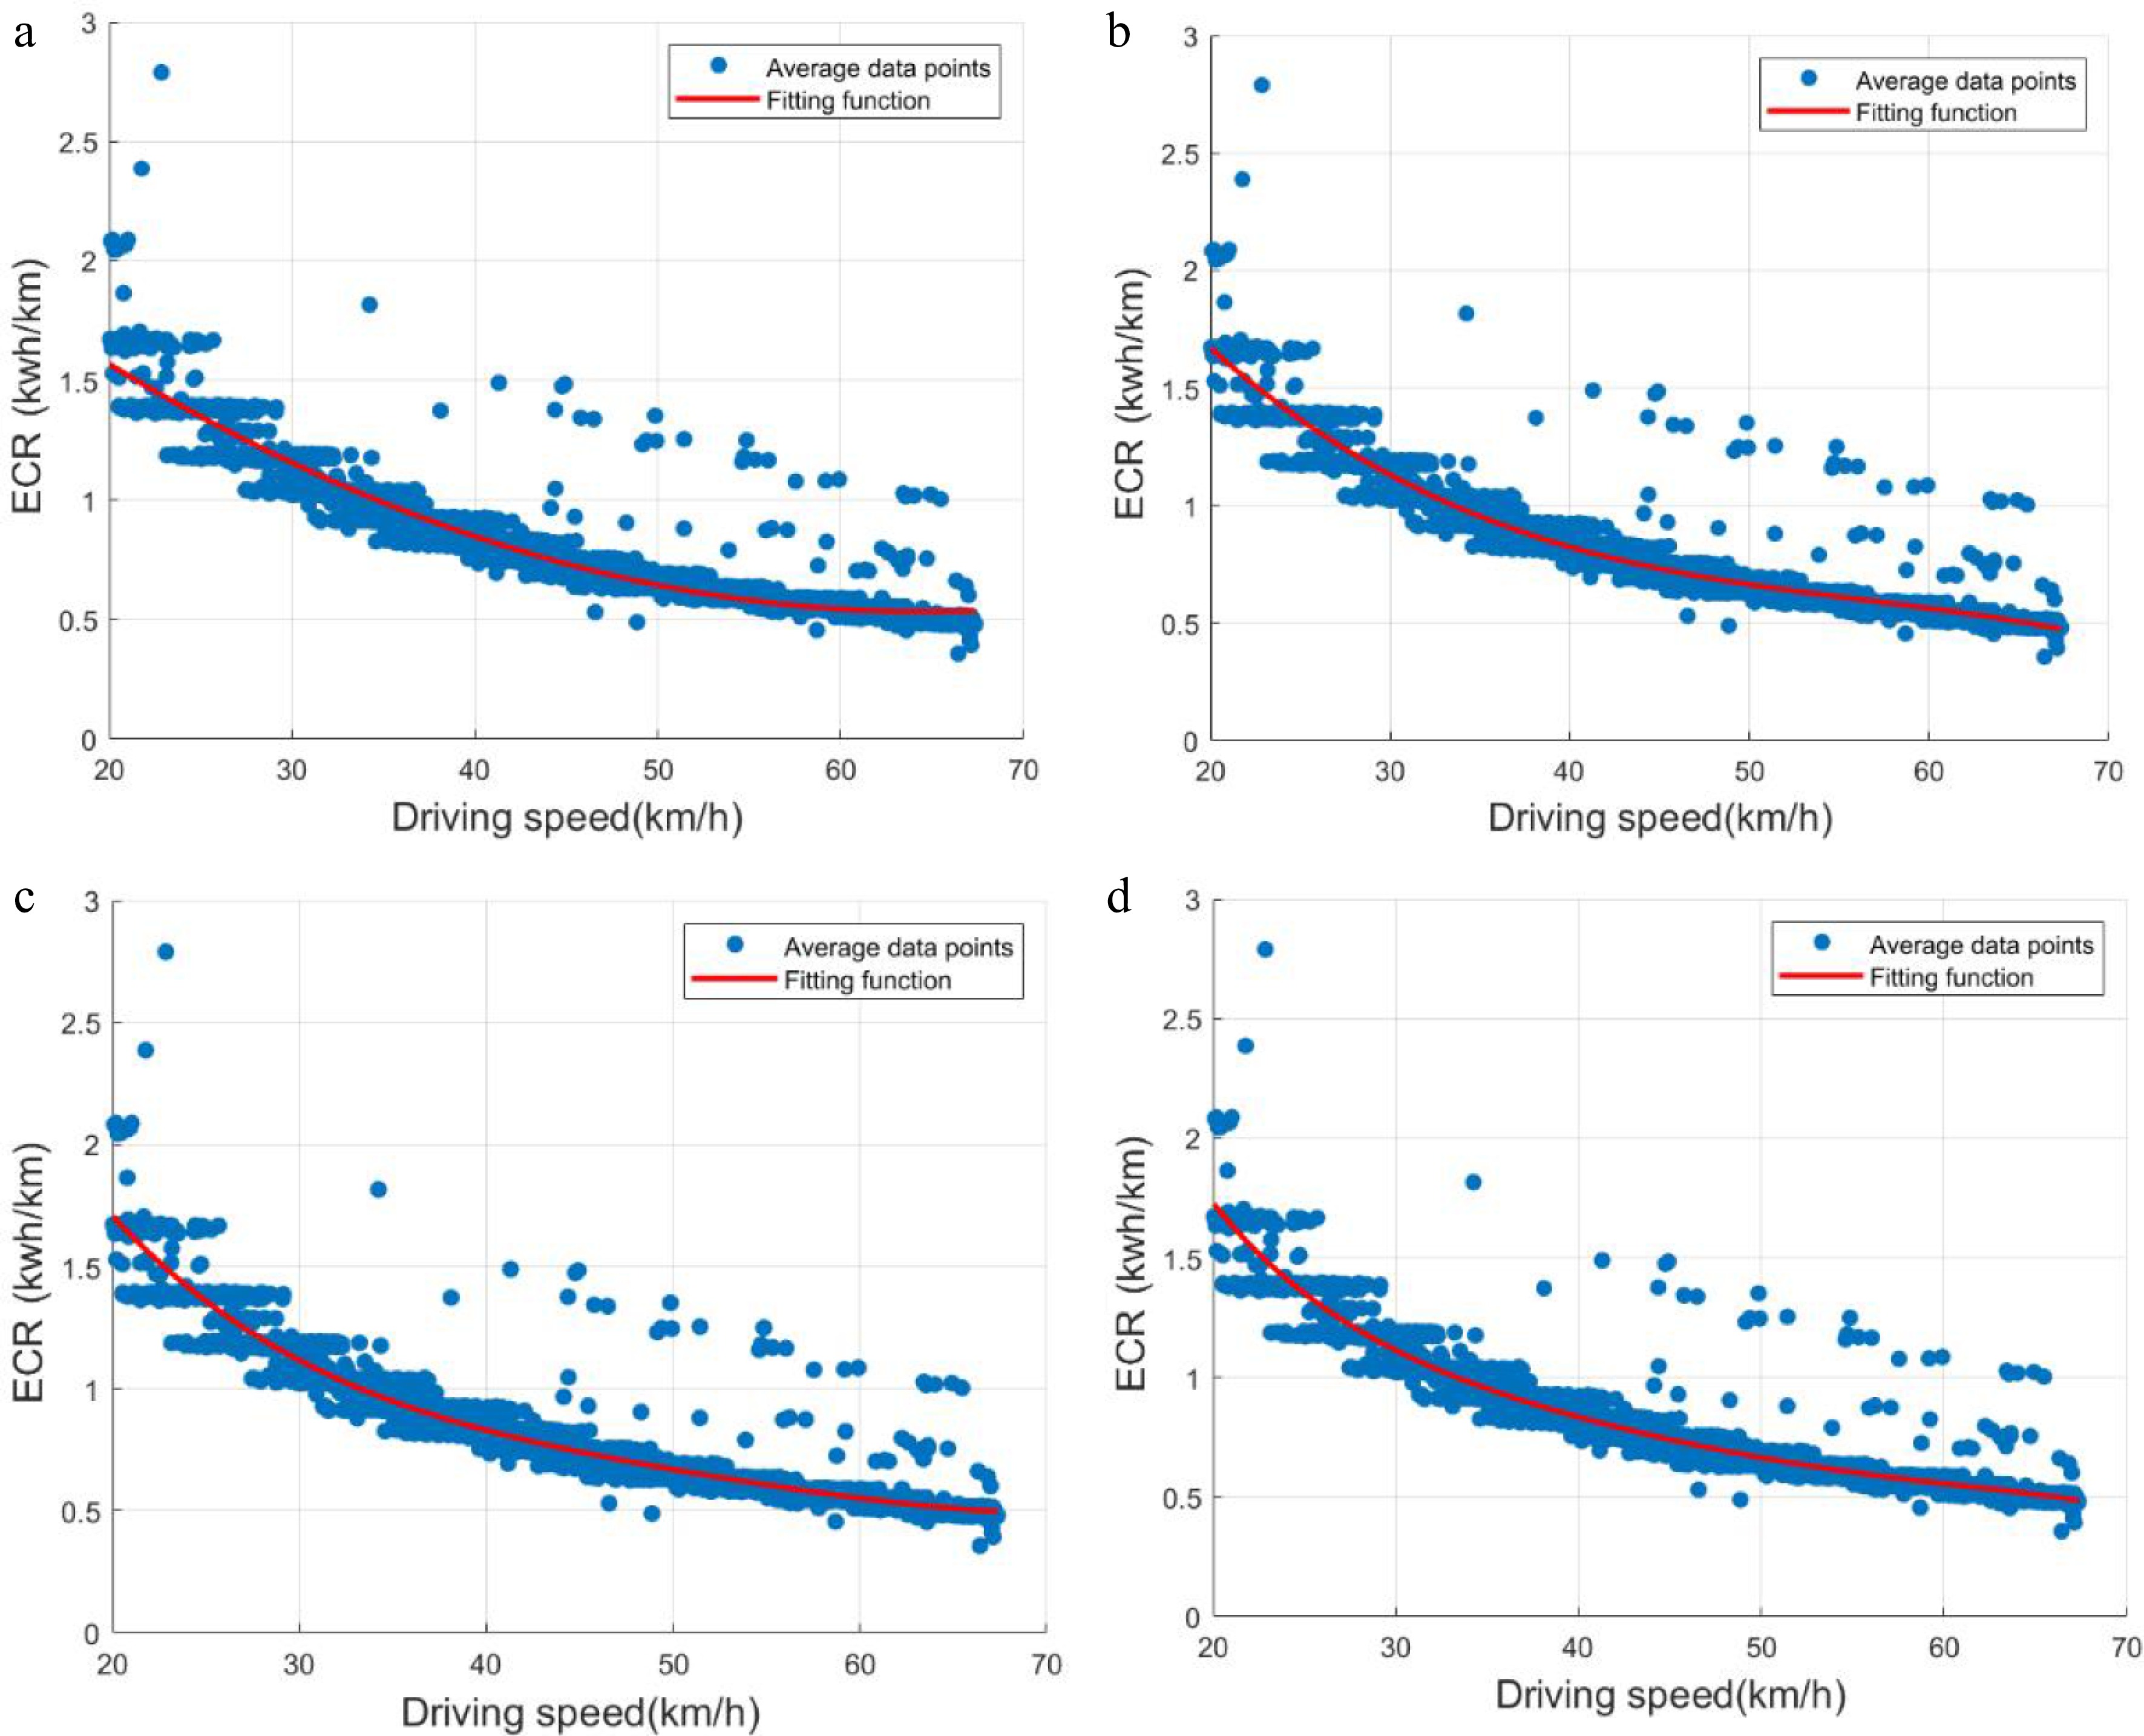
Figure 5.
Fitted curves of the model frameworks. (a) Quadratic function fitting, (b) Cubic function fitting, (c) Quartic function fitting, (d) Quintic function fitting.
Parameter identification
-
The results of the analysis indicate that the four model frameworks exhibit a satisfactory fit to the model. Furthermore, the intricate relationships and trends within the data are more effectively captured as the complexity of the model increases to a certain threshold. Specifically, higher-order polynomial model frameworks incorporate a greater number of parameters, thereby enhancing their flexibility. In contrast, lower-order functions, while capable of representing certain characteristics of the data, tend to be less responsive to subtle variations.
It is important to acknowledge the potential for overfitting, which can arise when the number of model frameworks is excessively high[23]. Overfitting is characterized by a model that demonstrates strong performance on the training dataset but lacks predictive accuracy when applied to unseen data. This occurs because, with an abundance of model frameworks, the model may not only accurately reflect the underlying trends within the data but also inadvertently capture noise and random errors present in the dataset. This complexity poses challenges in distinguishing genuine patterns from spurious fluctuations.
Moreover, employing higher-order model frameworks is associated with increased computational complexity, which can diminish computational efficiency in subsequent analyses. Thus, it is crucial to identify an optimal balance between model complexity and its generalization capability when selecting an appropriate model framework. In this context, the cubic model more effectively captures the complex, nonlinear relationship between ECR and driving speed. Compared to simpler models like the quadratic function, the cubic model offers a better fit to the observed data, which is essential for accurately predicting ECR across varying driving conditions. This improved fit ensures that the model accounts for subtle variations in energy consumption that might be overlooked by less flexible models. While the cubic model introduces additional complexity compared to the quadratic model, it remains computationally efficient compared to higher-order models (such as quartic or quintic). The cubic function strikes a balance between improved fitting accuracy and computational efficiency, making it more practical for real-world applications where computational resources and processing time may be limited. As such, this study prioritizes the cubic function model to ensure the robustness of predictive performance on new data while maintaining an improved fitting effect. To implement the parameter identification for the selected cubic model, this study employs the polyfit function in MATLAB. The polyfit function utilizes a least squares approach to determine the optimal coefficients of a polynomial that best fits the given dataset, which has been widely used in data-based models[24]. Specifically, for the cubic model discussed in this paper, a cubic polynomial is used to establish the relationship, where the driving speed data serves as the input variable and the observed ECR as the output variable. This method effectively minimizes the squared error between the observed and predicted values, ensuring an optimal fit while maintaining computational efficiency. The resulting polynomial coefficients provide a precise mathematical representation of the nonlinear relationship between ECR and driving speed, facilitating accurate predictions under varying driving conditions.
Table 3 presents the parameter values corresponding to the four model frameworks.
Table 3. Parameter values of each model framework.
Model framework Quintic coefficient Quartic coefficient Cubic coefficient Quadratic coefficient Linear coefficient Constant term Quadratic 0.0005 −0.0672 2.7038 Cubic −0.000013 0.0025 −0.1505 3.5024 Quartic 0.0000004 −0.00009 0.0071 −0.2765 5.0188 Quintic 0 0.000004 −0.0004 0.0202 −0.5375 7.0127 -
The datasets of driving speed and ECR of the BETs are divided into training and test groups. The training group is used to establish a curve describing the data distribution trend by the nonlinear regression method, and the test set is used to verify the model's accuracy. Specifically, 75% of the data points are selected as the training group, while the remaining 25% of them are regarded as the test group to verify the performance of the trained models, which is common to ensure that the model has high accuracy and effectiveness in fitting polynomials and evaluating model performance[12].
The estimation models underwent rigorous validation to ensure their capacity to accurately represent the intrinsic relationship between driving speed and ECR. Furthermore, during actual road driving, the driving speed of BET is often variable because the driving speed can be influenced by road conditions. Thus, it is difficult to accurately estimate ECR using only a fixed speed throughout an entire trip. However, specific intervals can be identified, which refer to segments of the journey where the driving speed remains relatively constant for a certain period. Within these specific intervals, the speed stabilizes with minimal fluctuations, allowing for the estimation of ECR by superimposing values across this range. While maintaining a constant speed over the entire trip is difficult, there are distinct phases where the vehicle's speed can be treated as fixed. Thus, the energy consumption estimated by these estimation models effectively reflects real-world data patterns. A flow chart illustrating the model verification process is presented in Fig. 6. In the figure, n denotes the maximum number of intervals during the travelling process; V(i) is the speed during the i-th interval; M1(i) and M2(i) are the energy consumption when a BET operates between the starting and ending points of the i-th interval;
$ \Delta $ 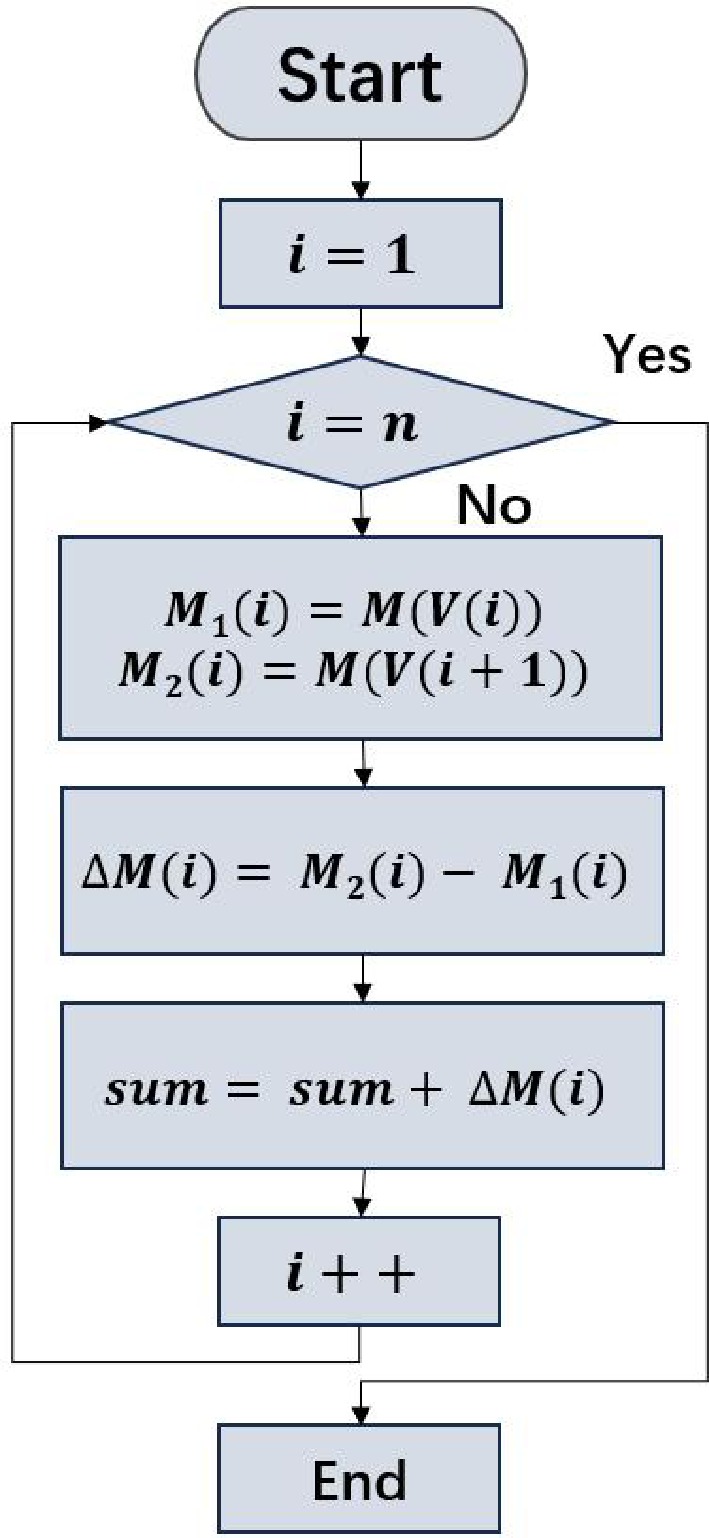
Figure 6.
Flow chart for model verification.
To comprehensively and objectively evaluate the performance of the models, three evaluation criteria are employed, including the root mean square error (RMSE), the coefficient of determination (R²), and the root mean square error of the estimation on the test set (
$ \overline {RMSE} $ $ RMS E = \sqrt {\dfrac{{\sum_{i = 1}^n {{{({y_i} - {{\hat y}_l})}^2}} }}{n}} $ (7) $ {R^2} = 1 - \dfrac{{\sum_{i = 1}^n {{{({y_i} - {{\hat y}_l})}^2}} }}{{\sum_{i = 1}^n {{{({y_i} - {{\bar y}_l})}^2}} }} $ (8) $ \overline {RMS E} = \sqrt {\dfrac{{\sum\nolimits_{i = 1}^n {{{({y_i} - {{\hat y'}_l})}^2}} }}{n}} $ (9) where, yi is the i-th observation value;
$ {\hat y_l} $ $ {\bar y_l} $ $ \hat y' $ The RMSE serves as a reliable metric for quantifying the deviation between predicted and observed values. A smaller RMSE indicates a reduced discrepancy between the predicted values and the actual observations, thereby reflecting a higher accuracy of the model's predictions. The R2 quantifies the model's fit to the data by measuring the proportion of variability in the data that is explained by the model. R2 values range from 0 to 1; a value closer to 1 signifies a superior fit of the model to the data, while a value closer to 0 indicates a limited capacity of the model to interpret the data. In addition to assessing the fitting performance on the training dataset, the estimation accuracy on the test dataset is also a crucial criterion for evaluating the practical utility of the model. The evaluation method for the test set is consistent with that used for the
$ \overline {RMS E} $ Table 4. Metric values for the evaluation of the model frameworks.
Model framework RMSE R2 $ \overline {RMSE} $ Quadratic function 0.0818 0.9144 0.0856 Cubic function 0.0767 0.9247 0.0823 Quartic function 0.0762 0.9258 0.0629 Quintic function 0.0760 0.9261 0.0831 As seen in the table, the values of RMSE and
$ \overline {RMS E} $ Economic driving speed
-
Economical driving speed refers to the driving speed that causes ECR to reach its minimum value, which can be obtained by using the ECR estimation model. In this section, the cubic function model is used to analyze the relationship between ECR and driving speed to obtain the economical speed. The expression of the ECR estimation model based on cubic function is shown as follows.
$ y = - 0.000013{v^3} + 0.0025{v^2} - 0.1505v + 3.5024 $ (10) where, y and v represent the ECR and driving speed, respectively.
By utilizing the ECR estimation model, the economical driving speed can be explored. Figure 7 provides the change trends of ECR with driving speed under the estimation model. It can be seen from the figure that the economical driving speed can be captured by calculating the valley value of the model. Consequently, it is found that the economic driving speed of BET can be calculated as 52.02 km/h, and the corresponding ECR is 0.53 kWh/km.
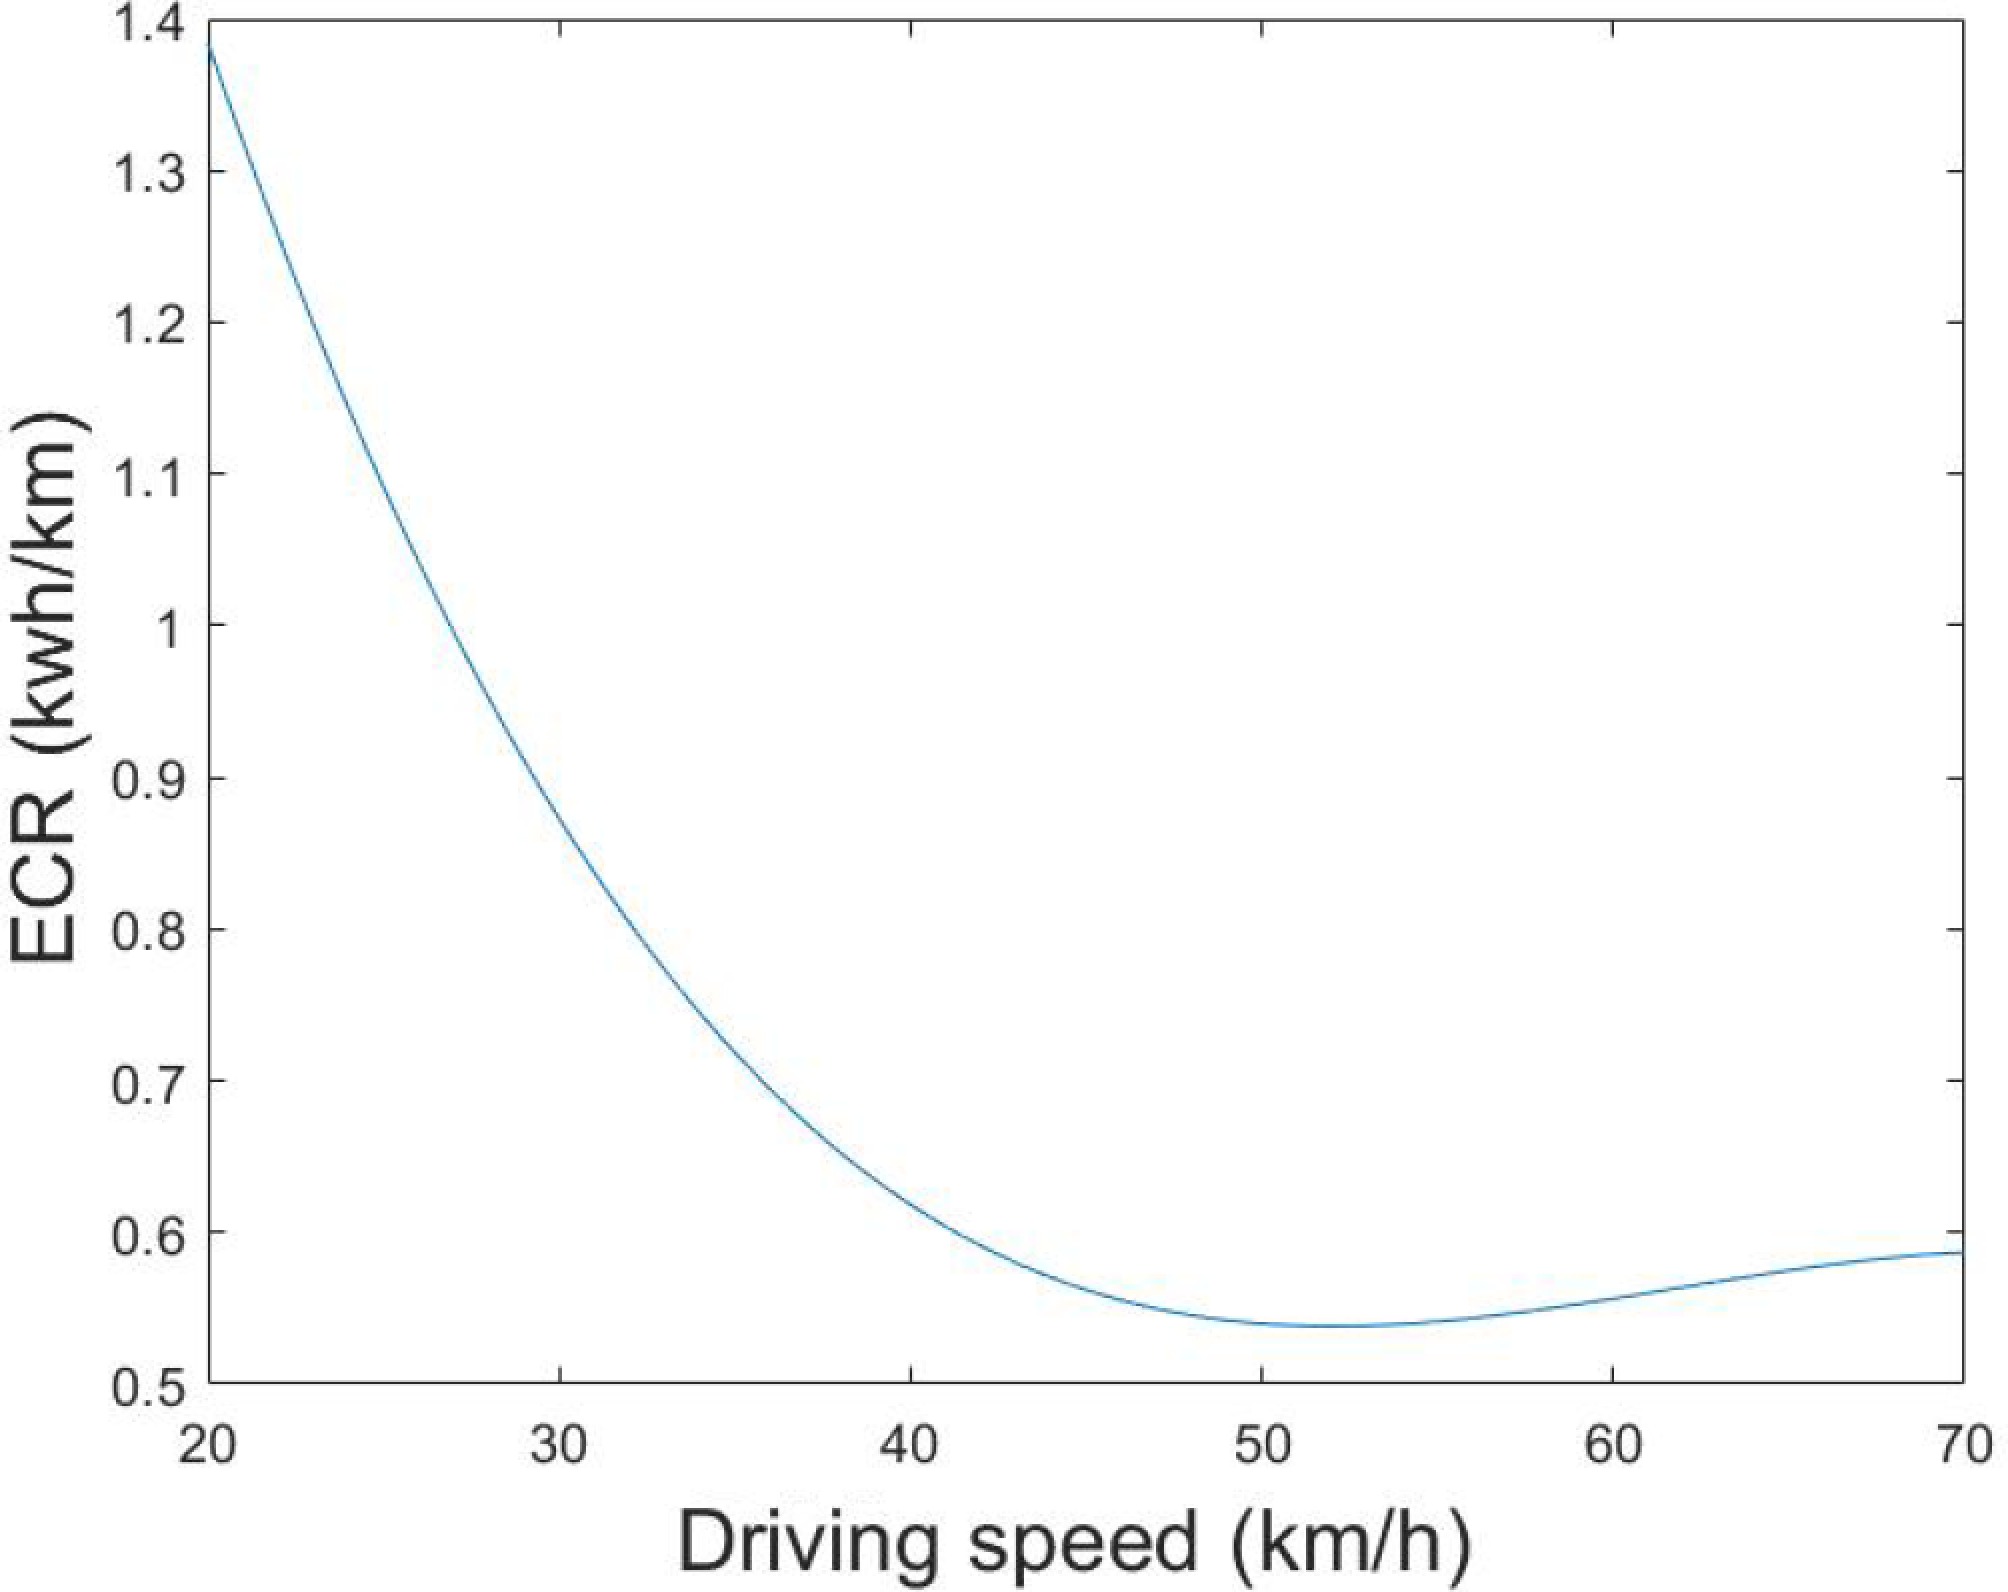
Figure 7.
Change trends of ECR with driving speed.
-
Accurately estimating ECR is an important issue for BET operation, which is very useful for determining transport strategies and alleviating range anxiety during trips. Using the BET operation data collected from real-world situations, this study adopts the data-driven approach to establish the nonlinear regression models for estimating the ECR of BETs, accompanied by its mathematical expression. To be specific, four model frameworks are designed to model the ECR estimation, and the results indicate that the cubic function model is selected considering the complexity and robustness. In addition, the ECR estimation model is used to explore the economic driving speed of BETs, and the driving speed with minimum ECR value can be obtained. The results indicate that the economic driving speed of BET is 52.02 km/h, and the corresponding ECR is 0.53 kWh/km.
It is worth noting that the dataset used in this study is based on a fixed set of BET models that are highly representative and widely used in the current market. However, some crucial factors like load and wind speed were not recorded during the data collection process and, therefore, were not included in the current analysis. In future work, the study intends to address this limitation by incorporating these variables into the dataset and the modeling process. In addition, the usage lifespan of batteries may also have potential impacts on their capacity and discharge efficiency. Built upon the proposed models, the effects of battery degradation on the ECR will be considered in future studies. Furthermore, the ECR estimation model would be improved by introducing multivariable regression or machine learning models to incorporate diverse predictors to further improve estimation accuracy.
This research was funded by the Talent Fund of Beijing Jiaotong University (Grant No. 2023JBRC006), and the National Natural Science Foundation of China (Grant No. 72301020).
-
The authors confirm their contributions to the paper as follows: study conception and design: Gao Y, Wang Y; data collection: Wang Y; analysis and interpretation of results: Gao Y, Sai Q; draft manuscript preparation: Gao Y, Wang Y. All authors reviewed the results and approved the final version of the manuscript.
-
The datasets generated during and/or analyzed during the current study are not publicly available due internal confidentiality but are available from the corresponding author on reasonable request.
-
The authors declare that they have no conflict of interest.
- Copyright: © 2025 by the author(s). Published by Maximum Academic Press, Fayetteville, GA. This article is an open access article distributed under Creative Commons Attribution License (CC BY 4.0), visit https://creativecommons.org/licenses/by/4.0/.
-
About this article
Cite this article
Gao Y, Wang Y, Sai Q. 2025. Estimating energy consumption rates for battery electric truck based on real-world data. Digital Transportation and Safety 4(3): 207−214 doi: 10.48130/dts-0025-0020 

Estimating energy consumption rates for battery electric truck based on real-world data
- Received: 29 July 2024
- Revised: 03 April 2025
- Accepted: 22 May 2025
- Published online: 28 September 2025
Abstract: Battery electric trucks (BETs) have been regarded as an environmentally friendly mode of road freight transportation. However, since BETs have limited driving ranges, the freight transportation companies experience the challenge of establishing reasonable freight transport schemes, where the operators of freight transportation companies need to understand the energy consumption rate (ECR) of BETs and ensure that the transport tasks can be finished without breaking down due to energy depletion. The accurate estimation of ECR is an effective method to alleviate the negative effects of limited driving range. To this end, this study utilizes the BET operational data collected from real-world situations to investigate the estimation of ECR. A data-driven approach is adopted to establish the nonlinear regression models for estimating the ECR of BETs, accompanied by its mathematical expression. The estimated performance of the models is evaluated, and consequently, the cubic function model is selected by considering the complexity and robustness. Based on the established estimation model, the economic driving speed of BETs is investigated. The results indicate that the economic driving speed of BETs is 52.02 km/h, and the corresponding ECR is 0.53 kWh/km.