


-
Phthalate acid esters (PAEs) are a class of commonly used synthetic chemicals closely associated with human activities, primarily serving as plasticizers and additives in medical devices, construction materials, household goods, personal care items, and other plastic products, to enhance durability and flexibility[1−3]. As PAEs lack chemical bonding to polymers, they are susceptible to environmental release during the production, use, and disposal of industrial products and consumer goods[4]. Considering that PAEs exhibit endocrine-disrupting effects and carcinogenic potential[5,6], their environmental persistence and bioaccumulative nature would lead to trophic magnification through food-chain transfer, especially in aquatic ecosystems, and pose toxicological risks to both aquatic organisms and humans[7,8]. Stringent international regulations on PAEs have been established. Six PAEs, including dimethyl phthalate (DMP), diethyl phthalate (DEP), di-n-butyl phthalate (DBP), benzyl-n-butyl phthalate (BBP), bis(2-ethylhexyl) phthalate (DEHP), and di-n-octyl phthalate (DnOP), have been recognized as priority control pollutants by the US Environmental Protection Agency[2]. Elucidating the contamination conditions and investigating the ecological and health threats posed by PAEs, especially in urban areas, is increasingly urgent for risk management and the sustainable development of human society.
China is the world's largest consumer of PAEs, with annual consumption exceeding 1 million metric tons in 2020[9], resulting in widespread PAE contamination of major river systems. According to relevant studies, DEHP and DBP were commonly identified as the predominant components in the Yangtze River[10], the Pearl River[11], and the Haihe River[12], with the total concentration of PAEs ranging from 1.59 to 5.16, 0.56 to 1.46, and 11.74 to 345.6 µg/L, respectively. However, limited research has covered PAE contamination levels in the tributaries of those large rivers, leaving the identification of contamination sources and the planning of further management measures a challenging problem. Additionally, serving as integrated contaminant sinks, sediments in the Qiantang River[13], Taihu Lake[14], and the Songhua River basin[15] have been reported to exhibit various levels of PAEs contamination. Elucidating the transport patterns of PAEs between water and sediment is crucial for ecological risk assessment and effective pollution control. Nevertheless, the effects of spatiotemporal variation on PAE partitioning behavior remain unclear.
Wuhan, situated in the economically developed middle reaches of the Yangtze River with approximately 13.74 million residents, serves as a central hub of China's Yangtze River Economic Belt. Previous studies have reported the occurrence of PAEs in the water and sediment of the Yangtze River mainstream (Wuhan section), identifying DBP and DEHP as the predominant pollutants[16]. In addition, intensive industrial and agricultural activities, as well as domestic products, have been considered as primary sources of PAEs contamination[17]. Urban rivers in Wuhan, especially those traversing high-population-density areas, may carry considerable amounts of PAEs when they flow into the Yangtze River mainstream. However, the contribution of these tributaries to the overall PAEs contamination in the Yangtze River was ignored. Whether river sediments act as a sink or a source of PAEs in the water column remained unclear. In general, this study aims to: (1) investigate the occurrence of 16 PAE congeners in Wuhan's urban rivers, including the mainstream of the Yangtze River and its eight tributaries; (2) elucidate the transport mechanisms of PAEs at the water-sediment interface; and (3) assess ecological risk levels to aquatic organisms and human health risk.
-
Nine typical rivers in Wuhan were selected in this study, including the Yangtze River mainstream, Han River, Sheshui River, Jushui River, Daoshui River, Jinshui River, Dongjing River, Neijing River, and Fu River. A comprehensive monitoring network of 36 sampling sites was established, comprising 15 on the Yangtze River mainstream and 21 across its eight tributaries in Wuhan, as illustrated in Fig. 1. The geographic coordinates and specific locations of each site were provided in Supplementary Table S1. During the dry season (January 2024), and the wet season (May 2024), surface water and river sediment samples were collected at all sampling sites mentioned above.
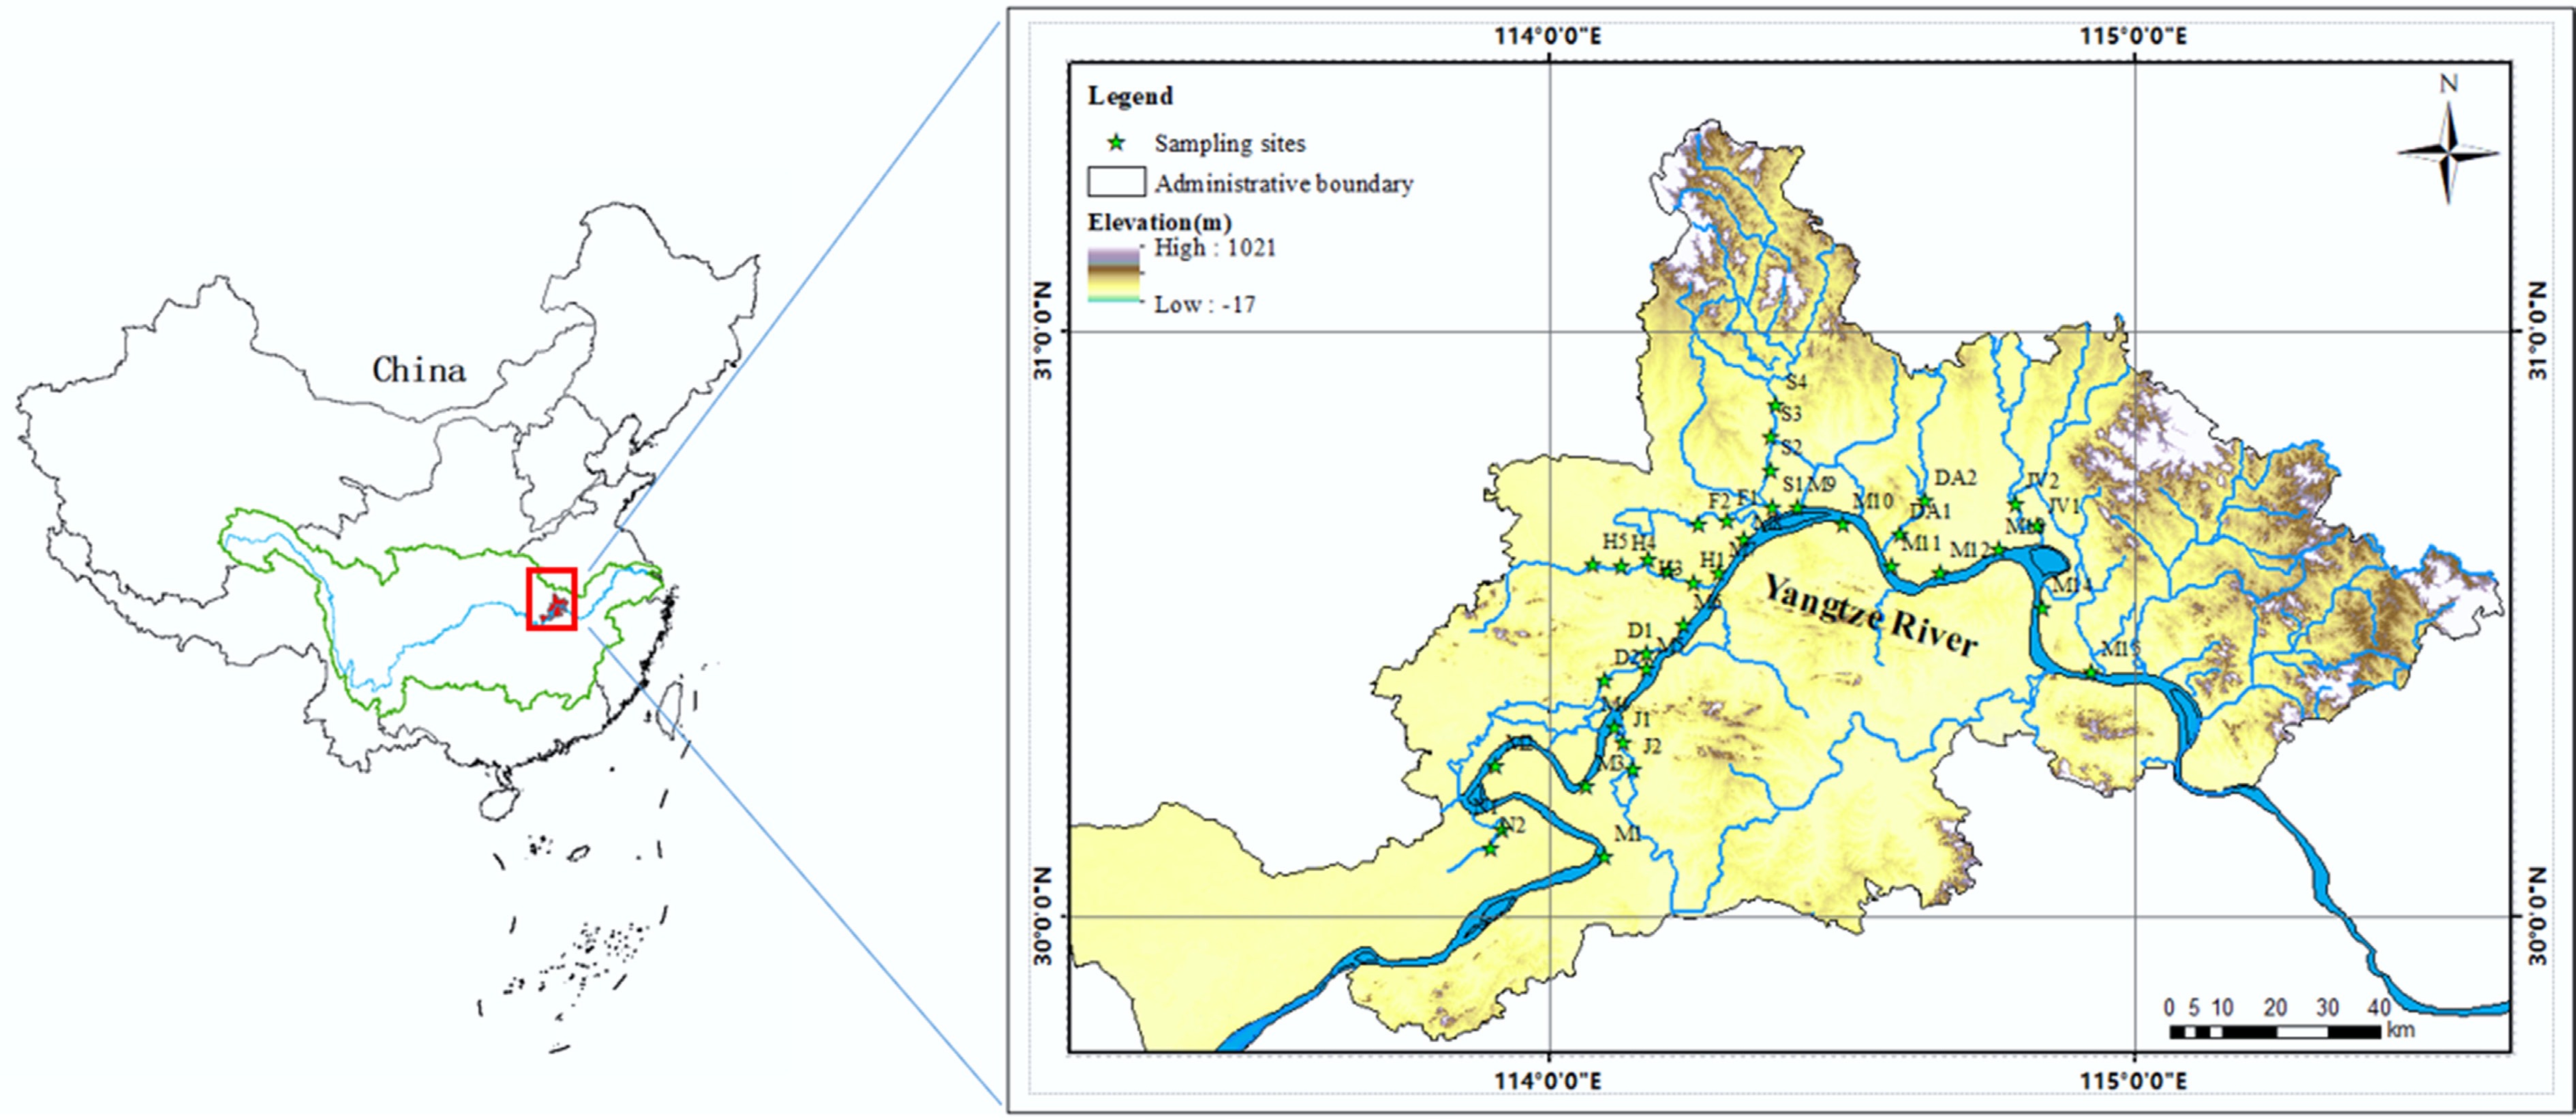
Figure 1.
Distribution of urban river sampling sites in Wuhan.
Chemicals and materials
-
The physicochemical parameters of the 16 target compounds were summarized in Supplementary Table S2. Four internal standards (ISTDs), including benzyl benzoate (BBZ), dibutyl phthalate-d4 (DBP-d4), bis(2-ethylhexyl) phthalate-d4 (DEHP-d4), and di-n-octyl phthalate-d4 (DNOP-d4), were employed. All analytical standards and ISTDs were purchased from Dr. Ehrenstorfer GmbH (Augsburg, Germany). HPLC-grade solvents, including n-hexane, dichloromethane, methanol, and ethyl acetate, were acquired from Merck Co. (Darmstadt, Germany). Sodium sulphate (Na2SO4) was purchased from Sinopharm (Shanghai, China), and deionized water was produced by Watsons (Guangzhou, China). Solid-phase extraction (SPE) cartridges (Cleanert S C18, 500 mg/6 mL) and a glass fiber filter (aperture 0.7 μm) were purchased from Agela Laboratories (Tianjin, China) and Whatman (UK), respectively. To eliminate organic contaminants, all glassware and aluminum foil were muffled at 450 °C for 4 h prior to use.
Extraction and analysis
-
Water samples were filtered through a 0.7 μm glass fiber filter (Whatman, UK) to remove particulate matter. Each sample was then spiked with 100 μL of a mixed internal standard solution (DBP-d4, DEHP-d4, DNOP-d4, BBZ, 1 μg/mL). Subsequently, the samples were passed through C18 solid-phase extraction (SPE) cartridges (500 mg/6 mL, Agela, China) at a flow rate of 5 mL/min. Prior to extraction, the cartridges were conditioned sequentially with 10 mL of dichloromethane, 10 mL of methanol, and 10 mL of deionized water. Following sample loading, the cartridges were vacuum-dried for 30 min, and the targeted analytes were eluted using 10 mL of ethyl acetate. The collected eluate was dehydrated with anhydrous sodium sulfate and concentrated to near dryness under a gentle nitrogen stream. Finally, it was reconstituted in 100 μL of n-hexane in a vial for instrumental analysis.
For sediment analysis, samples were freeze-dried, ground to a fine powder, sieved through a 60-mesh screen, and stored in glass jars within brown glass desiccators. An aliquot of 1.0 g from each sample was weighed into a sealed glass tube with a PTFE-lined cap, followed by the addition of the same mixed internal standard solution. The extraction was performed with 10 mL of dichloromethane using ultrasonication (300 W, 40 kHz) for 10 min. For quality control, procedural blanks, spiked samples, and duplicate analyses were included in each batch. The combined extracts were concentrated under nitrogen to approximately 2 mL and purified on silica gel columns (CNW-BOND, ANPEL, China). The columns were pre-conditioned with 5 mL of n-hexane. The targeted compounds were then eluted with 10 mL of ethyl acetate, concentrated to near-dryness under N2, and reconstituted in 0.1 mL of n-hexane prior to analysis.
Target PAEs were determined using a 7890B Gas Chromatograph linked to a 5977B Mass Spectrometer (GC/MS, Agilent, USA) operating in selective ion monitoring (SIM) mode. Separation was achieved on a ZB-SemiVolatiles fused silica capillary column (30 m × 0.25 mm × 0.25 μm, Phenomenex, USA). The carrier gas was high-purity Helium (≥ 99.999%) at a flow rate of 1.2 mL/min. Samples (1 μL) were injected in splitless injection mode. The temperature program was initiated at 50 °C for 1 min, increased at 15 °C/min to 200 °C, held for 1 min, and finally increased to 280 °C at 8 °C/min for 3 min.
Quality control and quality assurance
-
Before sample analysis, the glass containers were rinsed with ultrapure water (18.2 MΩ, SYS-III, Chengdu, China) and combusted at 450 °C for 4 h. During field sampling, glass bottles were rinsed with Yangtze River water. Sediment and soil samples were manually cleared of debris (stones, grass roots, plant fragments). The isotopic internal standard method was used to trace the pretreatment process. Before sample analysis, solvent blanks were used to monitor the background contamination associated with the instrument. Then, the relevant standards were analyzed to verify instrument performance, peak height, and resolution. Throughout the analysis, solvent blanks and standards were analyzed after every 10 samples. Experimental blanks and procedural blanks processed simultaneously with sample batches enabled recovery calculations and blank subtraction. The PAEs concentrations were corrected by subtracting procedural blank values. The detailed recoveries and method limit of detection (LOD) are detailed in Supplementary Table S3.
Sediment-water partitioning
-
The sediment-water partition coefficient (Kp), defined as the ratio of PAE concentrations in sediment to those in water, was used to characterize the partitioning behavior of PAEs between sediment and water phases[12]. The calculation formula was as follows:
$ {\mathrm{K}}_{\mathrm{p}}=\dfrac{{\mathrm{C}}_{\mathrm{s}}}{{\mathrm{C}}_{\mathrm{w}}} $ (1) where, Cs (ng/g) represented the PAEs concentration in sediment, and Cw (ng/L) denoted the PAEs content in water.
Sediment-water transport pattern was determined by comparing the calculated PAE partition coefficients (Kp) with theoretical sediment-water partition coefficients (Kd). A Kp > Kd indicated potential remobilization of PAEs from sediment to water, while Kp < Kd suggested net adsorption of aqueous PAEs onto sediments[18]. The Kd was calculated as follows:
$ {\mathrm{K}}_{\mathrm{d}}={f}_{oc}\times {\mathrm{K}}_{\mathrm{o}\mathrm{c}} $ (2) Ecological risk assessment of PAEs
Individual ecological risk assessment
-
This study employed the risk quotient (RQ) method to evaluate the ecological risks posed by PAEs in both water and sediment samples collected from urban rivers in Wuhan, following the equation provided in the Technical Guidance Document (TGD) on risk assessment issued by the European Commission:
$ \text{R}\text{Q}=\dfrac{\text{MEC}}{\text{PNEC}} $ (3) where, MEC was the measured ambient concentration of PAEs, and the equilibrium partitioning method was used to calculate the predicted no-effect concentration (PNEC) of the pollutant. Acute and chronic toxicity data, including no-observed-effect concentration (NOEC), half-effect concentration (EC50), and half-lethal concentration (LC50), were obtained from the US EPA ECOTOX database (
https://cfpub.epa.gov/ecotox ) (Supplementary Table S4). When multiple toxicity datasets were available for the same PAEs congener, the average of the most sensitive organisms was selected. Ecological risk was categorized into three classes: low (RQ < 0.1), moderate (0.1 < RQ < 1.0), and high (RQ > 1.0)[12,19].Mixed ecological risk assessment
-
Risk quotients (RQmix) based on environmental quality standards (EQS) were used to calculate the comprehensive risk of various PAE congeners.
$ \rm RQmix =\dfrac{\sum ({RPF}_{i}\times \mathrm{ }\mathrm{M}\mathrm{E}\mathrm{C}i)}{{\mathrm{P}\mathrm{N}\mathrm{E}\mathrm{C}}_{\mathrm{D}\mathrm{E}\mathrm{H}\mathrm{P}}} $ (4) $\rm RPF=\dfrac{{\mathrm{E}\mathrm{Q}\mathrm{S}}_{\mathrm{D}\mathrm{E}\mathrm{H}\mathrm{P}}}{{\mathrm{E}\mathrm{Q}\mathrm{S}}_{\mathrm{i}}} $ (5) The relative potency factors (RPF) approach was used to standardize the effects of PAEs exposure. DEHP was chosen as the reference chemical due to its well-documented prevalence in the literature[20]. The environmental quality standard for PAEi (EQSi) was provided by the European Chemicals Agency (ECHA), and predicted no-effect concentrations (PNEC) were used as substitutes when EQS data were unavailable. In this study, only eight PAEs (DMP, DEP, DBP, DIBP, DEHP, DnOP, DnHP, and BBP) were included in the analysis due to limited data on other compounds. In the sediment risk assessment, PNECs rather than EQS were used because sediment-specific EQS were unavailable.
Health risk assessment of PAEs
-
In this study, the risk of human exposure to PAEs in urban river waters in Wuhan was systematically evaluated using the health risk assessment methodology recommended by the US Environmental Protection Agency (US EPA). The assessment employed a standardized US EPA calculation model, including risk quantification methods for multiple exposure pathways (oral ingestion and dermal contact). The corresponding mathematical models are shown in Eqs (6)–(10) as follows:
$ \text{H}\text{I}=\sum \dfrac{{\text{CDI}}_{\text{i}}}{\text{RfD}}$ (6) The non-carcinogenic risk index (HI) was determined as described above, with CDI representing the long-term exposure dose and RfD denoting the pollutant's toxicity threshold. The carcinogenicity risk index (R) was calculated as the product of the CDI and the carcinogenicity slope factor (SF) (Eq. [7]).
$ \text{R}=\text{S}\text{F}\times \text{C}\text{D}\text{I} $ (7) Drinking exposure and dermal exposure were selected to calculate CDI in this study, where C referred to the amount of pollutant adsorbed by human skin:
$ {\text{CDI}}_{\text{d}\text{rinking exposure}}=\dfrac{\text{C}\;\text{×}\;\text{U}\;\text{×}\;\text{EF}\;\text{×}\;\text{ED}}{\text{BW}\;\text{×}\;\text{AT}} $ (8) $ {\text{CDI}}_{\text{dermal exposure}}=\dfrac{\text{I}\;\text{×}\;\text{Asd}\;\text{×}\;\text{FE}\;\text{×}\;\text{EF}\;\text{×}\;\text{ED}}{\text{BW}\;\text{×}\;\text{AT}\;\text{×}\;\text{f}} $ (9) $\text{C}=\text{2}\;\text{×}\;{10}^{-3}\;\text{×}\;\text{K}\;\text{×}\;\text{C}\sqrt{\dfrac{6\;\text{×}\;\text{}\text{T}\text{}\;\text{×}\;\text{}\text{TE}}{\text π}} $ (10) The specific values of other parameters were detailed in Supplementary Table S5. These assessment parameters were determined based on three key considerations: (1) recommendations from relevant domestic and international literature; (2) current environmental standard requirements; and (3) authoritative data from the China Population Exposure Parameters Handbook (Adults' Volume) published by the Ministry of Ecology and Environment. This multi-source approach integrated pollutant toxicity parameters, exposure factors, and population characteristics, while ensuring the scientific validity and reliability of parameter selection, providing robust data support for health risk assessment and, thereafter, a scientific basis for urban aquatic environment health risk management[21].
-
The total concentration of 16 PAEs (∑16PAEs) in surface water of these studied urban rivers ranged from 40.57 to 2,464 ng/L, with a mean value of 1,183 ng/L, as detailed in Supplementary Table S6. All PAE congeners except BBP were detected across the nine rivers during both dry and wet seasons. Among them, DMP, DEP, DIBP, DBP, and DEHP were detected in all samples, with concentration ranges of 1.59−1,489, 1.53−444.6, 4.49−1,009, 1.83−910.0, and 1.27−996.6 ng/L, respectively. Collectively, these five PAE congeners constituted over 95% of ∑16PAEs (Fig. 2a, b). Given that DMP, DEP, DBP, and DEHP are priority control pollutants, their prevalence indicates a serious threat to local ecosystems and human health. The overall PAE contamination level in this study was higher than that in the Yangtze River mainstream in a previous study (∑16PAEs: range 472.6−867.8 ng/L, mean 328.2 ng/L)[17]. This disparity is likely attributable to the elevated concentrations in the eight urban tributaries (∑16PAEs: range 141.9−2,464 ng/L, mean 905.1 ng/L), as the levels within the Yangtze River mainstream itself in this study (∑16PAEs: range 40.57−1,909 ng/L, mean 651.2 ng/L) were comparable to the earlier data.
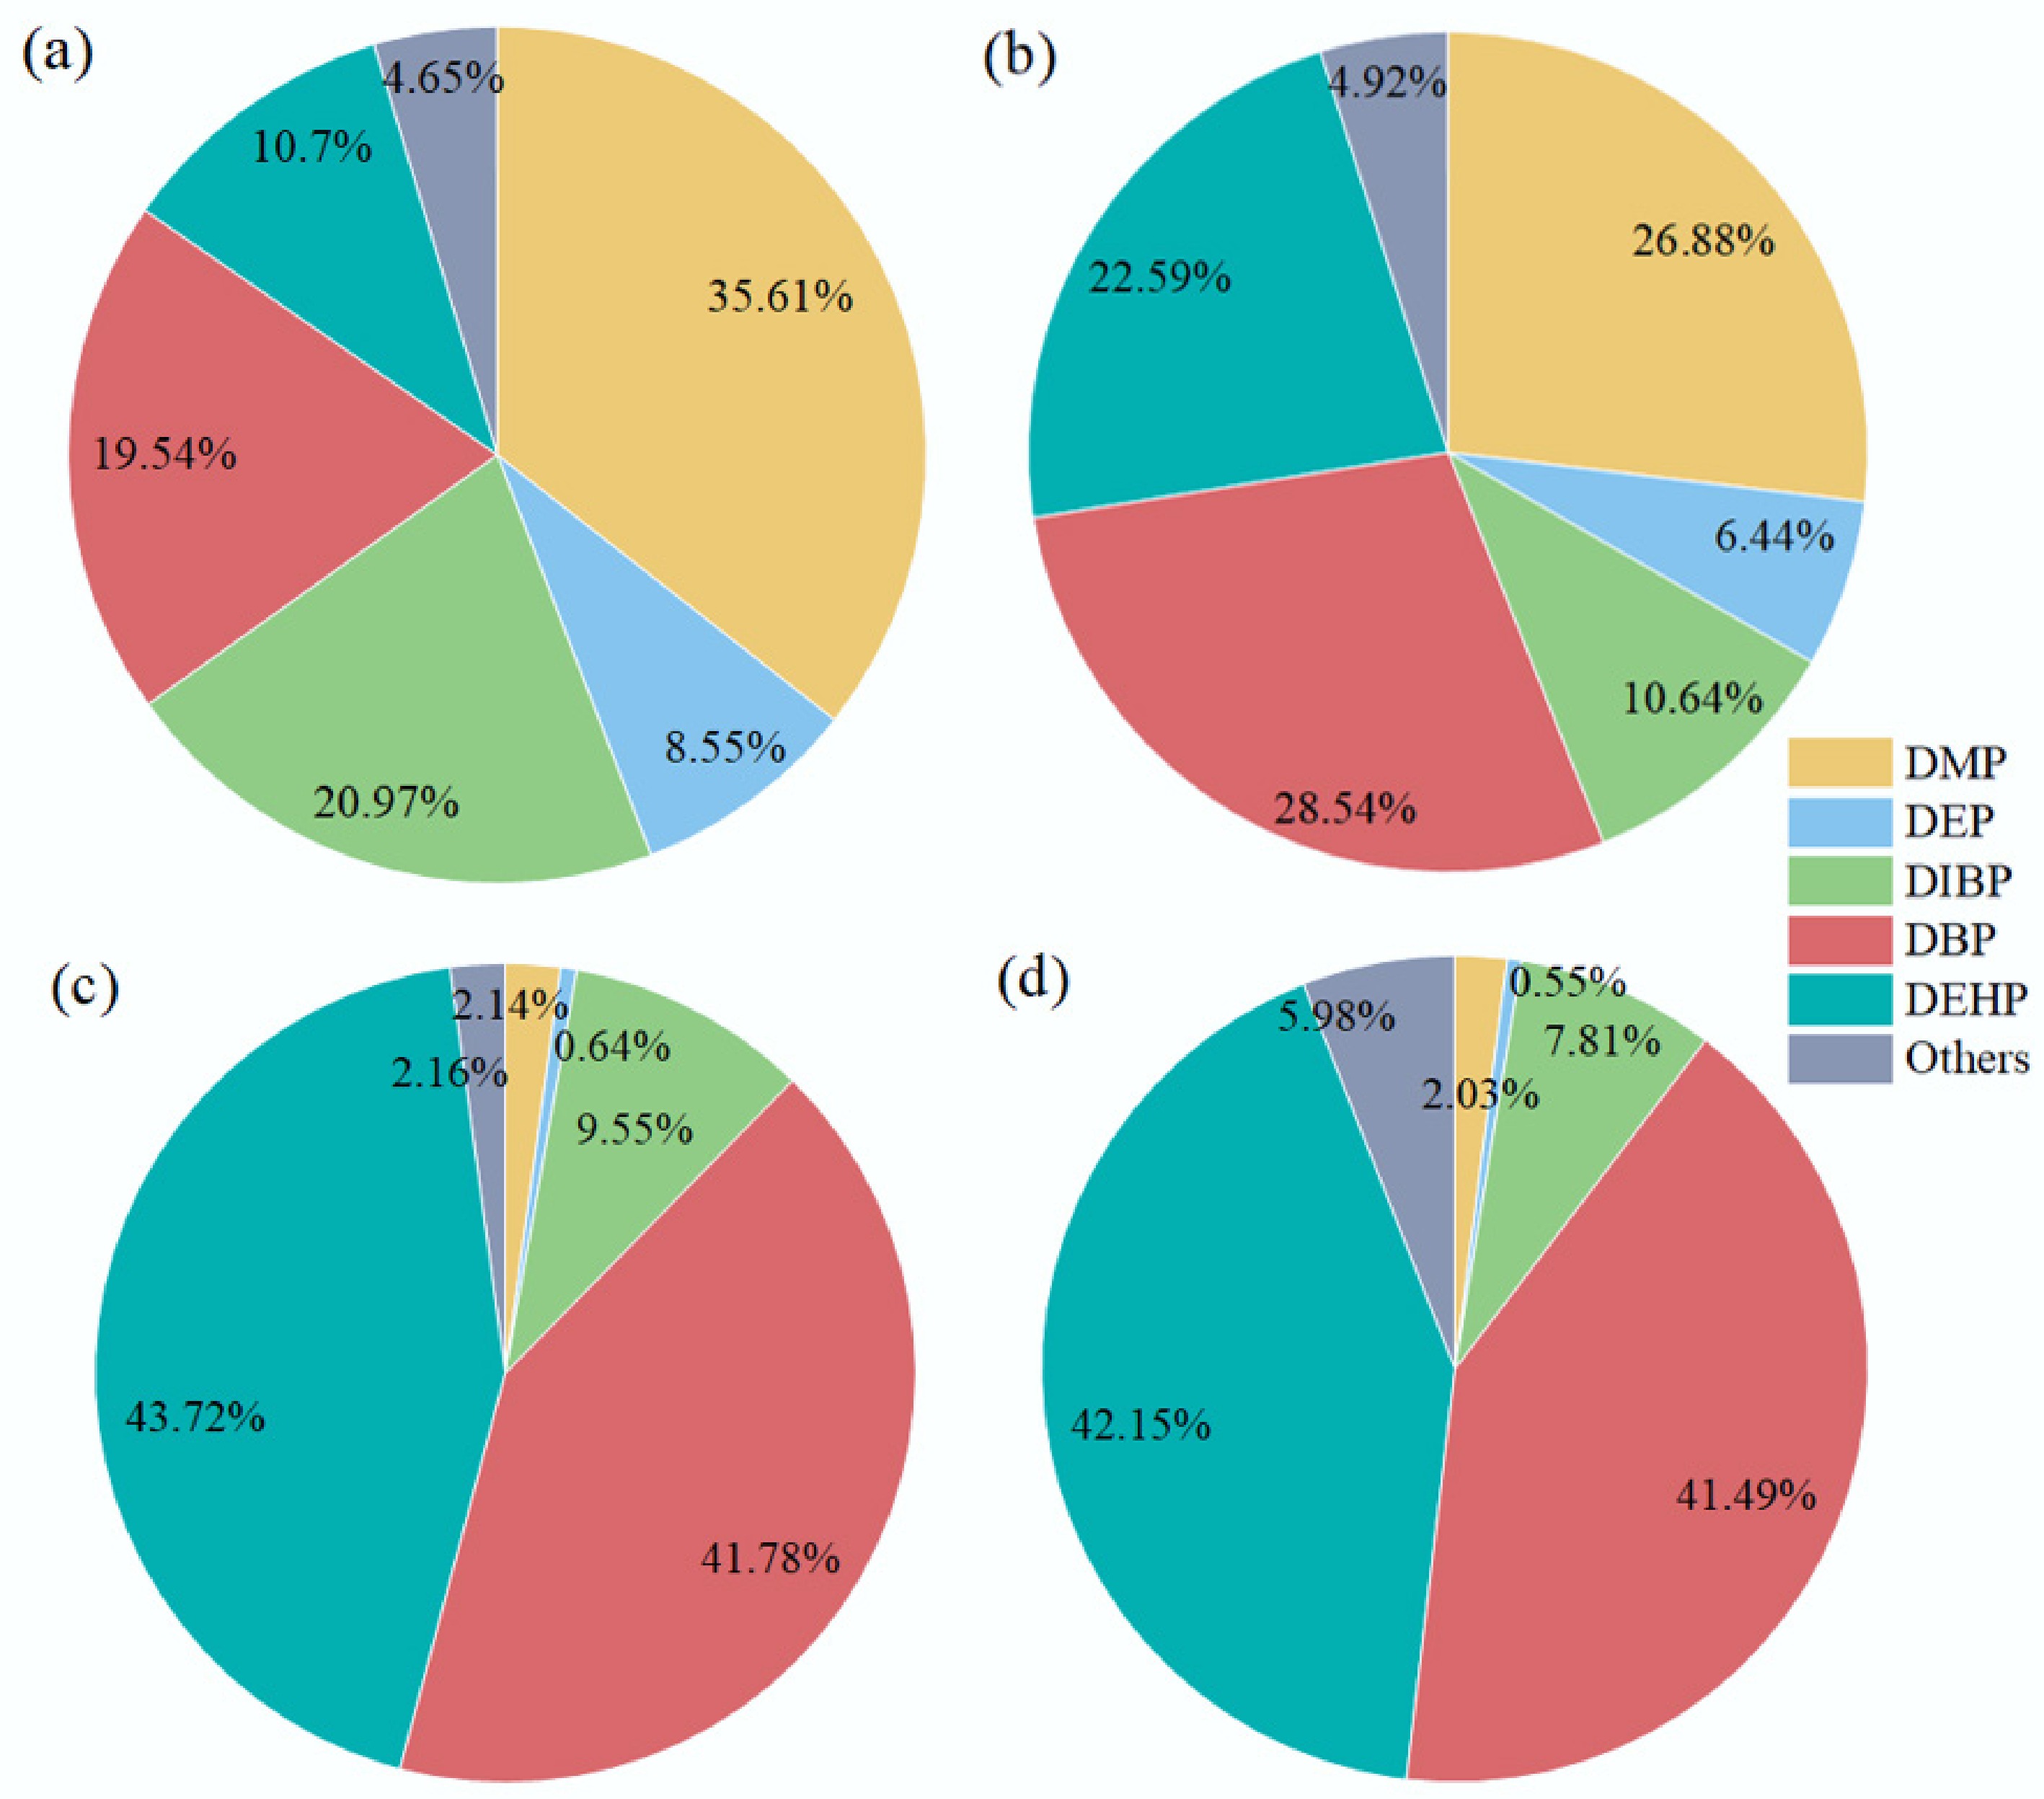
Figure 2.
Compositional characterization of five predominant PAEs and other components in urban rivers. (a) PAEs congeners in water samples during the dry season; (b) PAEs congeners in water samples during the wet season; (c) PAEs congeners in river sediments during the dry season; (d) PAEs congeners in river sediments during the wet season.
Nevertheless, the PAEs concentrations in these urban rivers were generally lower than those documented in other Chinese aquatic systems (Table 1), including Hangzhou Bay (∑10PAEs: range 7,305−33,329 ng/L, mean 16,726 ng/L)[22], the Bohai Sea (∑16PAEs: range 0.01−52.58 μg/L, mean 5.24 μg/L)[23], the Pearl River (∑6PAEs: range 0.5−28.1 μg/L, mean 8.7 μg/L)[24], and Lake Chao (∑6PAEs: range 0.370−13.2 μg/L, mean 1.79 μg/L)[25]. Interestingly, DEHP and DIBP were commonly predominant in these Chinese rivers and urban rivers in this study, suggesting that PAE contamination sources might be consistent nationwide, such as plasticizers used in industrial manufacturing and additives in personal toiletries.
Table 1. Comparison of PAEs concentrations in this study with other aquatic media cited from relevant studies
River Sampling time DMP DEP DBP BBP DEHP DNOP ∑PAEs Ref. Water (ng/L) Urban rivers, Wuhan Jan. 2024 1.58–1,489 3.64−150.9 1.83−248.3 n.d. 1.27−251.6 n.d.−17.85 40.57−2,135 This study May 2024 4.95−902.1 4.52−444.6 3.18−910.0 n.d. 8.54−996.6 n.d.−40.10 224.9−2,464 Yangtze River, Wuhan section 2022 10.51−338.7 1.12−26.75 n.d.−323.4 n.d.−33.79 5.00−471.6 n.d.−113.2 74.21−869.4 [17] Hangzhou Bay Summer 2019 1.66−55.6 31.2−426 n.d.−260 57.4−9,738 n.d.−1,386 7,305−22,861 [22] Autumn 2019 1.18−110 19.5−2,404 3.28−76 79−1,649 7.13−274 8,100−33,329 Poyang Lake Jun. 2019 n.d.−116 n.d.−127 121−744 n.d. 12−352 n.d. 288−1,033 [28] Dec. 2018 n.d.−253 n.d.−119 254−1,297 n.d. 88−896 n.d.−18 46−2,079 Bohai Sea May 2015 n.d.−2,310 n.d.−20,450 40−30,200 n.d.−1,210 n.d.−1,080 610−39,620 [23] Aug. 2015 n.d.−4,430 n.d.−6,830 n.d.−2,660 1,080−2,580 160−2,620 1,670−22,400 Jan. 2016 n.d.−33,810 n.d.−2,540 n.d.−440 n.d.−150 n.d.−2,520 10 - 52580 Pearl River Jan. 2013 n.d.−3,390 n.d.−490 42−1,010 n.d.−800 150−1,360 n.d.−130 500−5,030 [24] Apr. 2013 44−140 n.d.−950 60−2,040 790−5,320 1,080−8,840 79−4,300 2,780−20,700 Lake Chao Aug. 2011 21−193 78−174 463−11,200 1−3 n.d.−67 1,540−13,200 [25] Nov. 2011 n.d.−111 24−160 426−3,650 1−11 n.d.−86 1,280−5,390 Feb. 2012 6−99 10−102 98−465 1−4 2−217 370−1,480 Sediment (ng/g) Urban rivers, Wuhan Jan. 2014 1.41−17.76 0.64−4.68 74.92−347.0 n.d.−8.18 43.66−1,196 n.d.−3.18 159.6−1,542 This study May 2014 4.27−56.63 0.54−11.01 3.87−2,707 n.d.−55.53 44.36−3,494 n.d.−51.65 141.7−4,315 Yangtze River, Wuhan section 2022 3.28−26.87 0.72−4.91 22.35−107.1 n.d.−1.56 30.66−359.4 n.d.−12.37 106.1−486.0 [17] Hangzhou Bay Summer 2019 6.08−1,483 2.48−1,778 0.31−2.23 0.31−2,414 n.d.−28.9 118−5,888 [22] Autumn 2019 4.02−189 3.17−219 0.29−5.01 61.3−1,114 n.d.−3.07 145−4,746 Haihe River Apr. 2019 n.d.−0.97 0.54−4.70 19.91−229.8 n.d.−13.30 40.84−1,146 0.16−16.10 62.27−1,242 [12] Dec. 2018 0.12−1.30 0.18−3.32 9.01−55.05 0.13−4.66 23.42−337.6 0.12−1.60 35.83−395.0 Jul. 2018 0.24−1.82 0.2−4.38 12.75−65.10 0.14−3.83 27.09−754.9 0.24−7.94 40.88−825.6 Pearl River Jan. 2013 90−750 20−170 280−1,160 10−160 810−2,110 40−230 1,600−4,620 [24] Apr. 2013 n.d.−220 n.d.−180 150−2,500 n.d.−120 470−2,720 10−310 880−5,690 In sedimentary environments, the total concentration of ∑16PAEs ranged from 141.7 to 4,314 ng/g, with a mean value of 708.4 ng/g (Supplementary Table S7). Among the 16 PAE components, 14 were detected in all collected samples, excluding DnHP and DNP. Consistent with water samples, five PAE congeners (DMP, DEP, DIBP, DBP, and DEHP) exhibited 100% detection frequencies, with concentrations ranging from 1.41−56.63, 0.54−11.01, 16.84−248.2, 3.87−2,707, and 43.66−3,494 ng/g, respectively. These five predominant pollutants accounted for approximately 98% and 94% of ∑16PAEs during the dry and wet seasons in this study (Fig. 2c, d). Specifically, DEHP dominated in the dry season (43.72%), followed by DBP (41.78%), DIBP (9.55%), DMP (2.14%), and DEP (0.64%). Similar composition characteristics of PAEs in sediment were observed in the wet season, with the following order of DEHP (42.15%), DBP (41.49%), DIBP (7.81%), DMP (2.03%), and DEP (0.55%). The composition of PAEs exhibited less seasonal variation in sediment than in water, implying that sediment acts as a stable sink or potential source for dissolved PAEs in urban rivers. Comparably, the PAEs levels in Wuhan urban river sediments were lower than those reported in Hangzhou Bay (∑10PAEs: range 145−5,888 ng/g, mean 1,000 ng/g)[22], the Yangtze Estuary (∑16PAEs: range 0.48−29.94 μg/g, mean: 12.88 μg/g)[6], and Pearl River sediments (∑10PAEs: range 0.88−13.6 μg/g, mean: 3.37 μg/g)[24].
Spatiotemporal characteristics of PAEs in urban rivers
-
Seasonal variation in PAEs concentrations within urban rivers is illustrated in Fig. 3 and Table 1. In surface water, the concentrations of ∑16PAEs ranged from 40.57 to 2,135 ng/L (mean: 415.1 ng/L) during the dry season, and from 224.9 to 2,464 ng/L (mean: 1,183 ng/L) during the wet season. A similar seasonal pattern was evident not only in the Yangtze River mainstream but also in its eight tributaries in this study (Fig. 3a, b). Furthermore, higher PAE concentrations during the wet season have been reported in other aquatic environments (Table 1), including the Pearl River[24], Lake Chao[25], the Yangtze River Basin[10], and the Haihe River Basin[26]. This observed elevation in wet-season PAEs levels may result from increased precipitation and surface runoff[10].
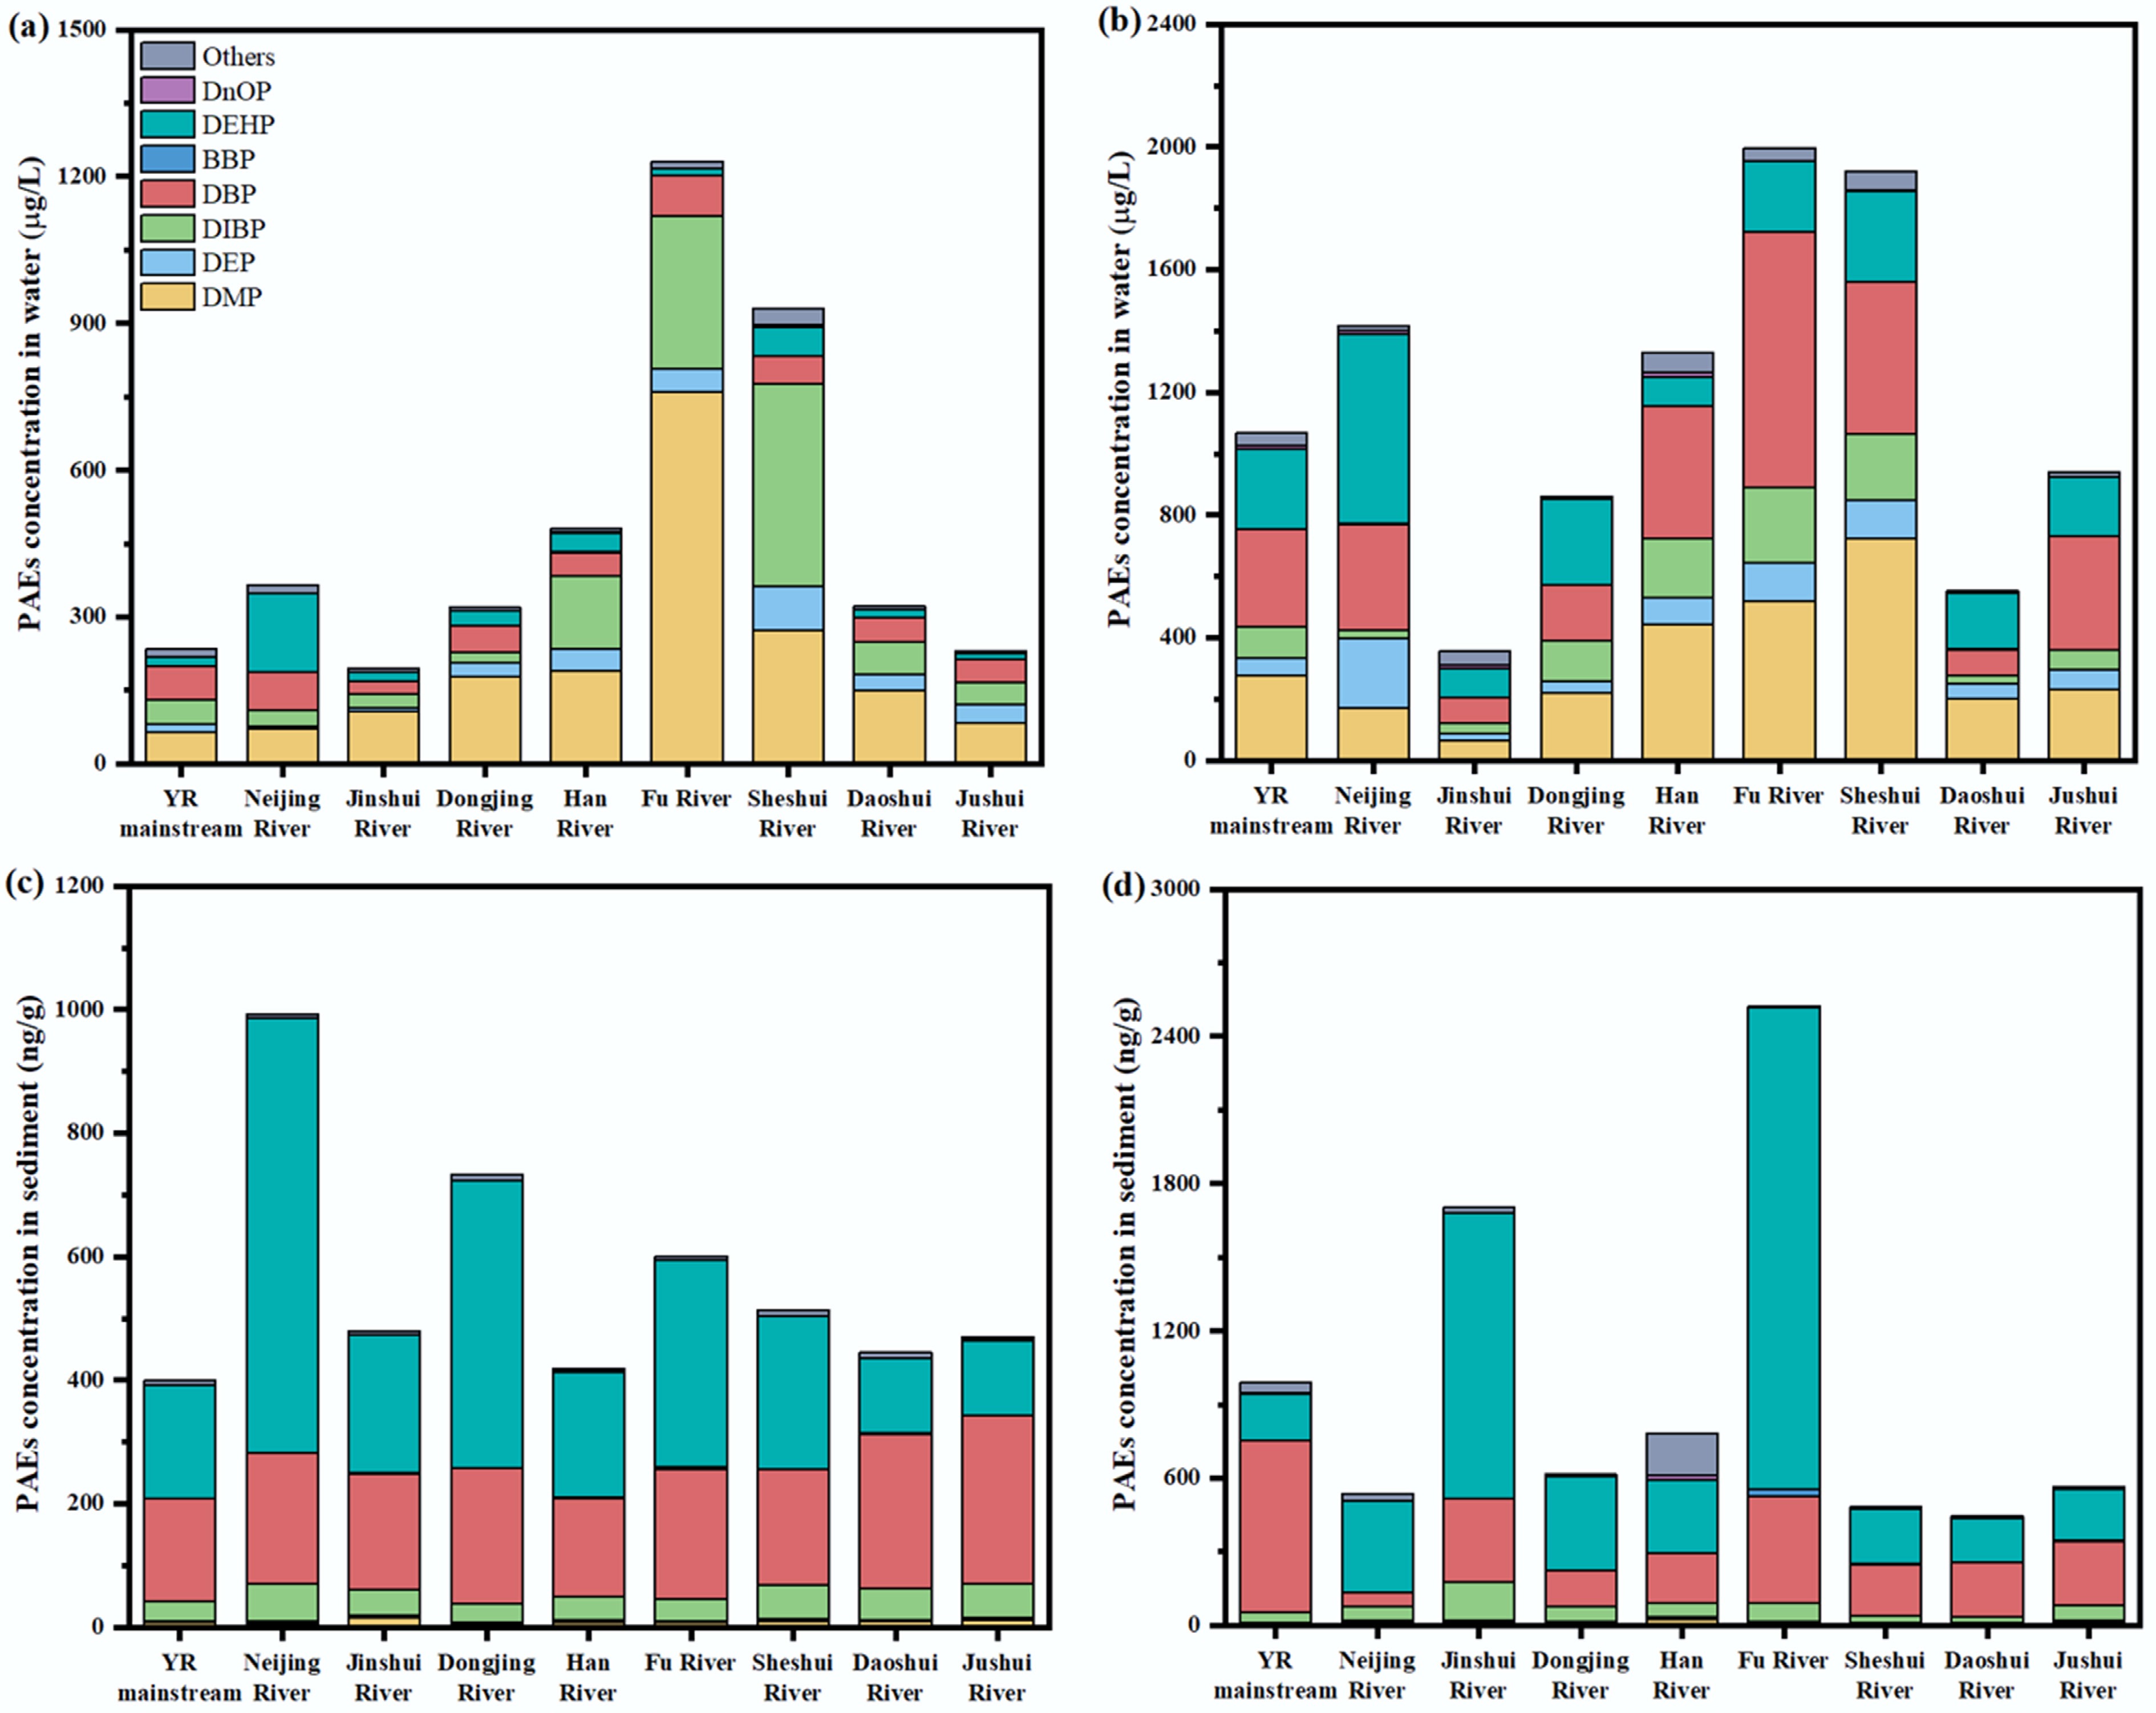
Figure 3.
The mean concentration of PAEs in eight tributaries and the mainstream of the Yangtze River in the Wuhan section. (a) PAEs concentrations in river water during the dry season; (b) PAEs concentrations in river water during the wet season; (c) PAEs concentrations in river sediments during the dry season; (d) PAEs concentrations in river sediments during the wet season.
Consistent with the seasonal variation exhibited in surface water, PAEs concentrations in sediment samples were significantly higher during the wet season than during the dry season (independent t-test, p < 0.05). Specifically, ∑16PAEs in urban river sediments ranged from 159.6 to 1,542 ng/g (mean: 488.5 ng/g) in the dry season and from 141.7 to 4,315 ng/g (mean: 708.4 ng/g) in the wet season. Similarly, such seasonal variation was also observed in the Yangtze River mainstream and several of its tributaries in this study, including the Jinshui River, the Han River, and the Jushui River (Fig. 3c, d). Furthermore, this trend aligns with findings from other river sediments (Table 1), including the Haihe River[12], and the Pearl River[24]. The elevated wet-season concentrations may be driven by enhanced wet deposition of PAEs from atmospheric aerosols due to abundant summer precipitation, coupled with accelerated transport of watershed pollutants from topsoil through surface runoff generated by heavy rainfall.
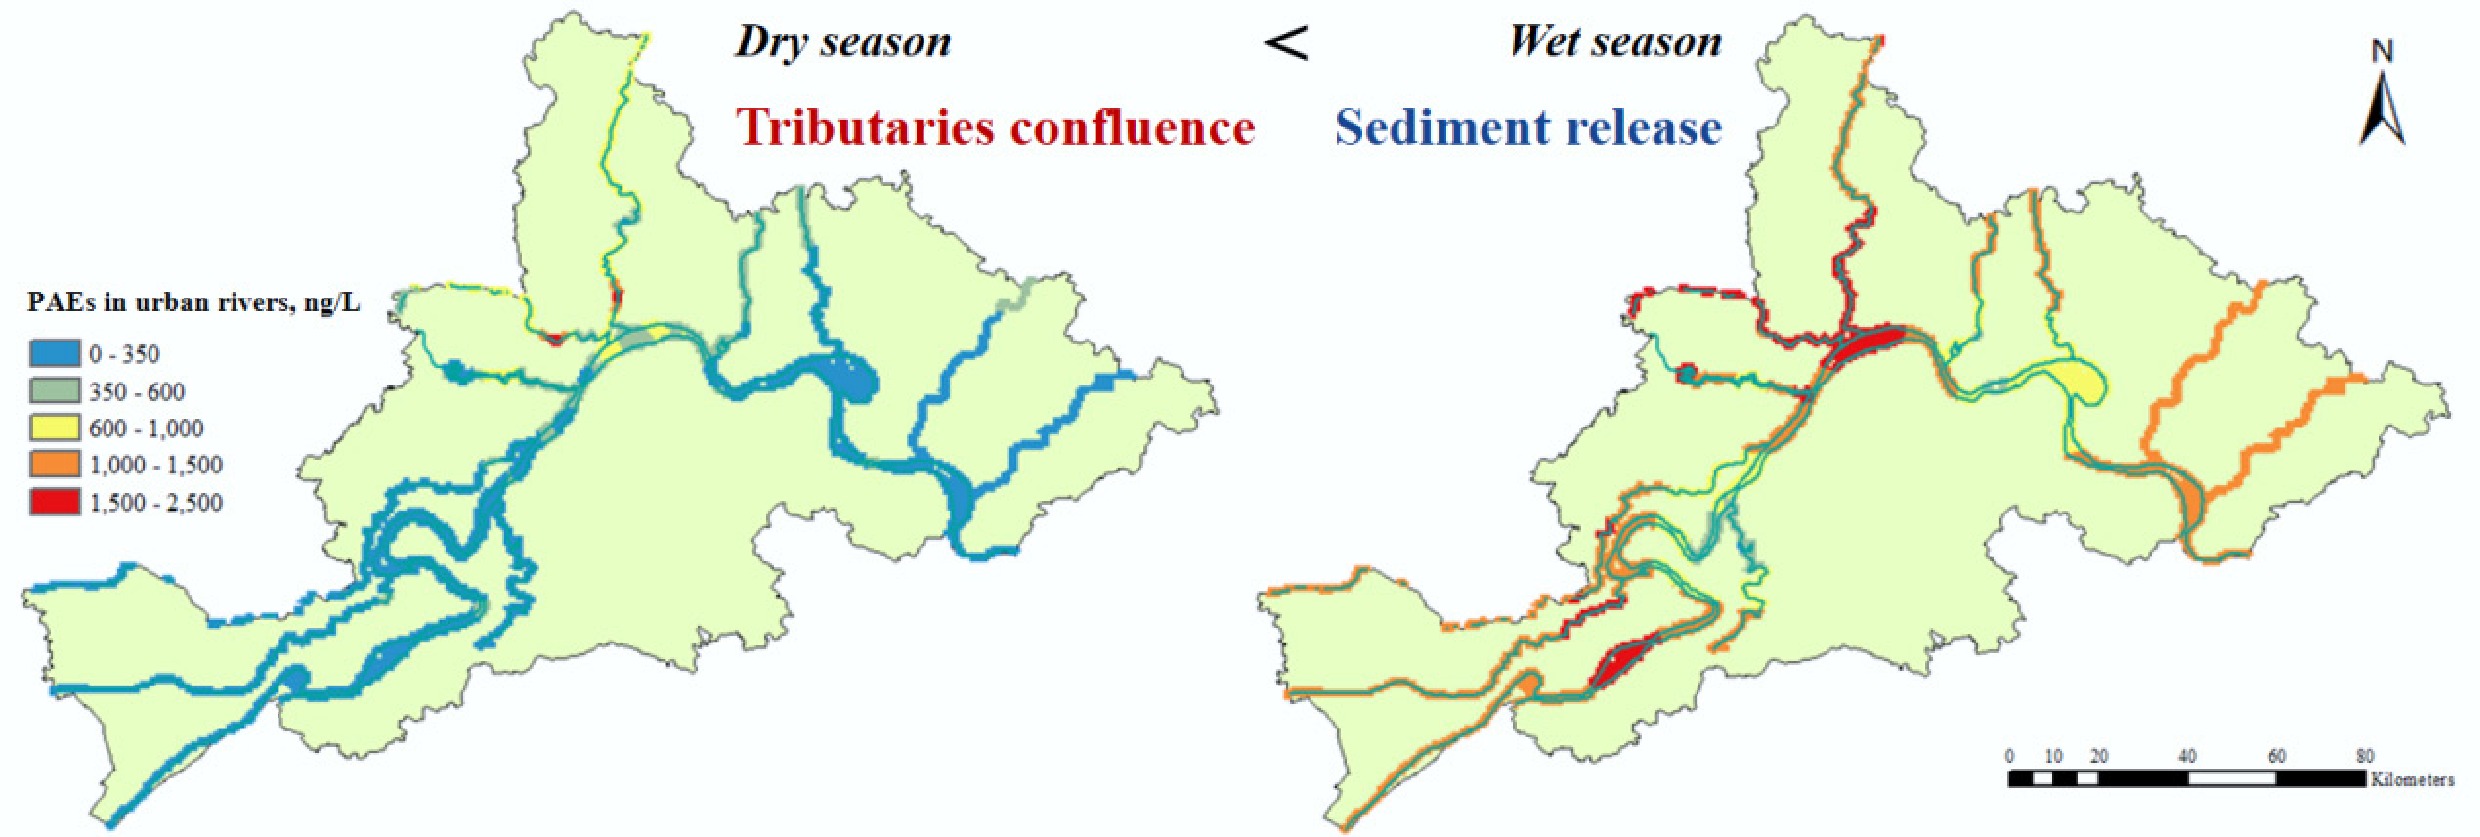
Notably, tributaries generally exhibited higher contamination levels than the mainstream of the Yangtze River, especially during the dry season (independent t-test, p < 0.05), a pattern observed in both surface water and sediment (Fig. 3). Specifically, the Fu River, Sheshui River, and Han River displayed consistently elevated PAEs contaminations in surface water across both seasons (Supplementary Table S8), with the mean concentration of ∑16PAEs as 1,230 ng/L (Fu River, dry season), 929.7 ng/L (Sheshui River, dry season), 1,997 ng/L (Fu River, wet season), and 1,921 ng/L (Sheshui River, wet season), respectively. Geographically, these two rivers flow through industrial and agricultural zones within Wuhan, and continuous pollutant inputs from anthropogenic activities might be the primary reason for their elevated PAEs levels, which subsequently contribute to higher PAEs levels in the Yangtze River mainstream after confluence (Fig. 4). In contrast, the Jinshui River and the Jushui River maintained lower contamination levels than the mainstream (independent t-test, p < 0.5), likely due to their locations beyond major urban and industrial centers. It is noteworthy that the highest individual concentrations were recorded at site F2 in the Fu River (2,135 ng/L, dry season), and site S3 in the Sheshui River (2,645 ng/L, wet season). These findings underscore the need to control PAE contamination in tributaries rather than focusing solely on the mainstream.
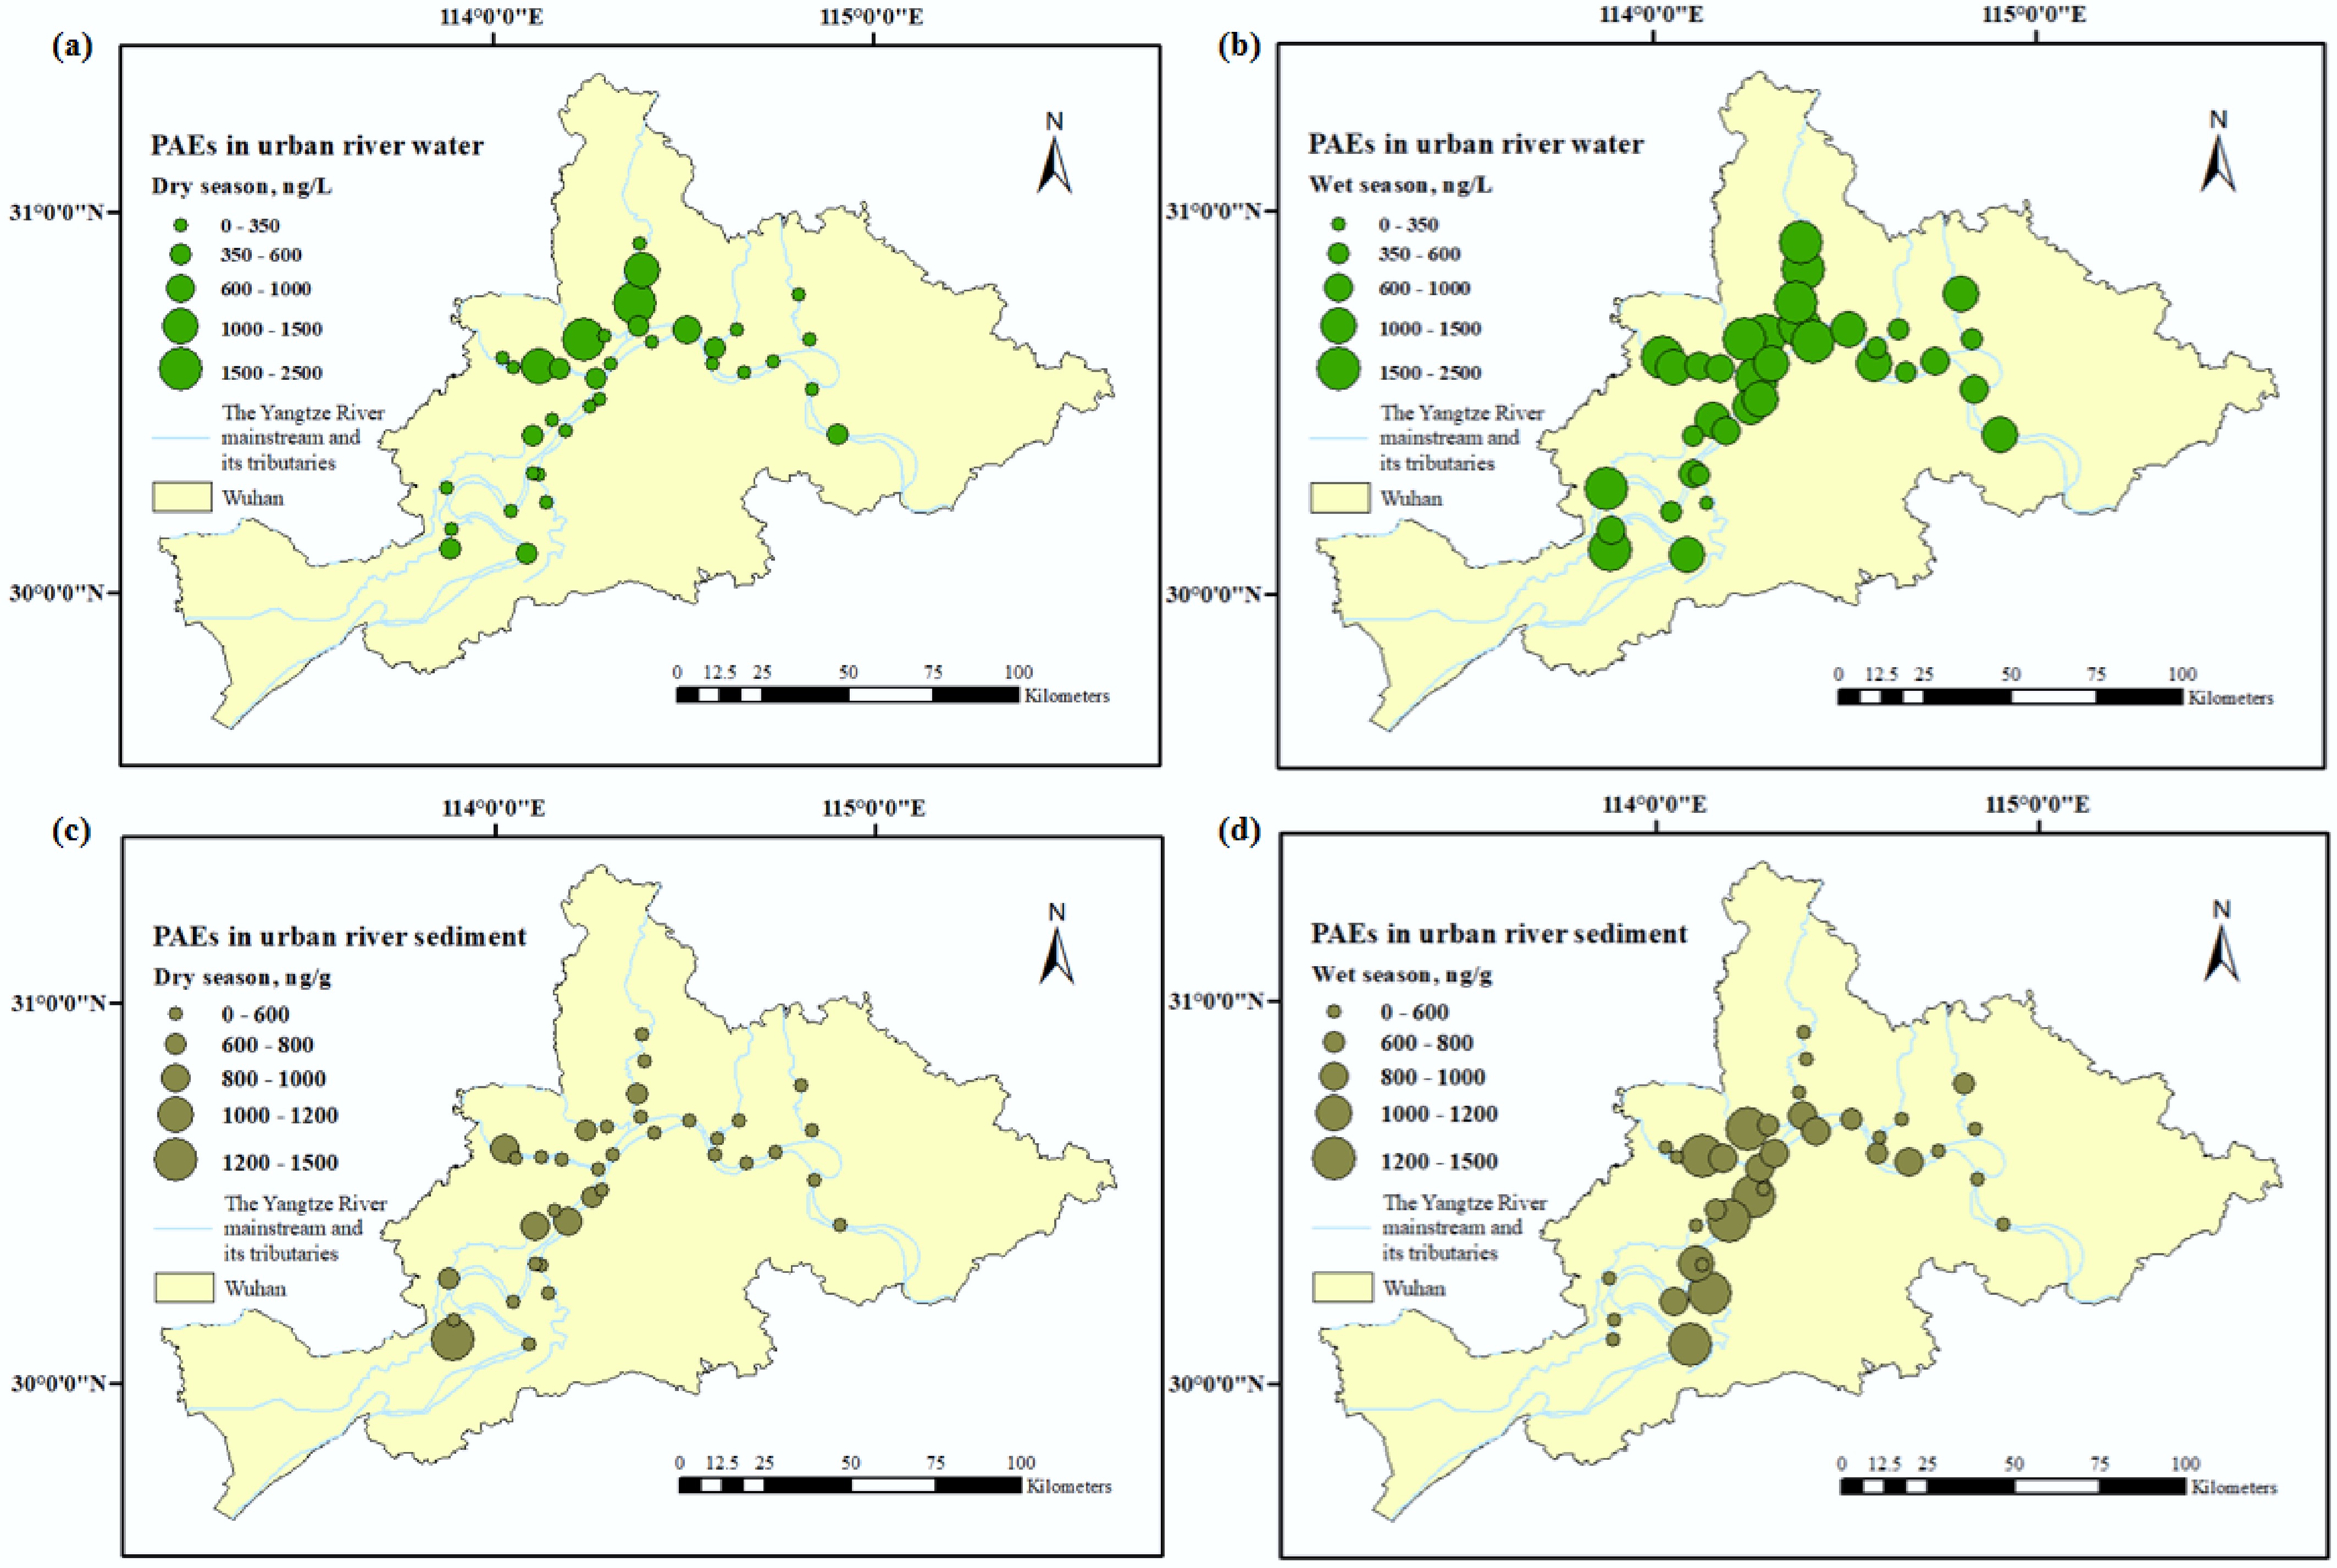
Figure 4.
Spatiotemporal characteristics of PAEs in eight tributaries and the mainstream of the Yangtze River in the Wuhan section. (a) Distribution of PAEs in urban river water during the dry season; (b) Distribution of PAEs in urban river water during the wet season; (c) Distribution of PAEs in urban river sediments during the dry season; (d) Distribution of PAEs in urban river sediments during the wet season.
In the sedimentary environments, the Yangtze River mainstream exhibited comparatively low levels of pollution, contrasting with the severe contamination observed in its tributary, the Fu River (Fig. 4). In this study, the mean concentrations of ∑16PAEs in the mainstream sediment were 399.7 ng/g (dry season) and 988.1 ng/g (wet season). In contrast, those in the Fu River were significantly higher at 600.2 ng/g (dry season), and 2,524 ng/g (wet season) (independent t-test, p < 0.05) (Supplementary Table S9). The peak contamination level occurred at site F2 in the Fu River during the wet season (4,315 ng/g), located within Wutongyu Park in the Dongxihu District of Wuhan. The substantial influx of tourists during the summer vacation likely contributed to the extremely high pollution load in this area. Conversely, the highest PAE concentration in the dry season was observed at site N2 in the Neijing River, a rural area in Honghu District, suggesting that dense residential settlements rather than industrial activities were the primary source of pollution here. Notably, site M6 along the mainstream of the Yangtze River maintained consistently elevated pollution levels across both seasons (619.4 ng/g in the dry season and 3,171 ng/g in the wet season). Its proximity to Jiangtan Park and the Wuhan International Expo Center suggests that persistent anthropogenic activities may be the dominant cause of contamination at this location.
Partitioning behaviors of PAEs between water and sediment in urban rivers
-
The sediment-water partition coefficients (Kp) for major PAEs components, including DMP, DEP, DBP, DIBP, and DEHP, which maintained a 100% detection frequency, were measured in urban rivers. As presented in Supplementary Table S10, the Kp values of nine urban rivers in the dry season followed the descending order as DEHP (35.54 L/g) > DBP (10.25 L/g) > DIBP (1.18 L/g) > DMP (0.25 L/g) > DEP (0.18 L/g). A similar trend was observed in the wet season, with DEHP (4.21 L/g) > DBP (2.25 L/g) > DIBP (2.18 L/g) > DMP (0.19 L/g) > DEP (0.09 L/g). As a typical long-chain PAE, DEHP exhibited significantly higher Kp values than the short-chain congeners in this study (independent t-test, p < 0.05), indicating its stronger affinity for sediment adsorption. This finding is consistent with research results from the Haihe River Basin[12]. Additionally, Kp values were generally higher during the dry season than during the wet season (independent t-test, p < 0.1), and hydrological influences on kinetic processes and partitioning mechanisms were considered the primary causes[25].
The sediment-water transport of PAEs, governed by adsorption and desorption processes at the interface, was assessed by comparing experimental partition coefficients (Kp) with theoretical distribution coefficients (Kd). For DMP, DEP, DBP, and DIBP in this study, Kp values consistently exceeded their corresponding Kd values in both the dry and wet seasons, indicating that their concentrations in sediment exceeded their equilibrium levels. This finding suggests a potential risk of secondary release of PAEs from sediment into the water column, supporting the established view of sediments as both sinks and secondary sources of PAE pollution under dynamic conditions[2]. Notably, while no tributaries showed higher DMP Kp values than the mainstream in the dry season, six tributaries (excluding the Fu River and Sheshui River) exhibited higher values in the wet season. This pattern was more pronounced for DEP, DIBP, and DEHP during the wet season (independent t-test, p < 0.5), where tributary Kp values frequently surpassed those of the mainstream. These observations implied that tributary contributions are severe during the wet season, as PAEs in tributary sediments were more likely to be released into the water column. Comparative studies revealed distinct transport mechanisms across different aquatic systems. In Lake Chaohu, the distribution of PAEs between water and sediment demonstrated a general equilibrium condition[25]. In Taihu Lake, congener-specific transport tendencies were reported: DMP, DEP, and BBP exhibited net migration from sediment to water, DBP maintained dynamic equilibrium between phases, and DEHP preferentially remobilized from water to sediment[9]. Consequently, when it comes to PAE contamination control in the Yangtze River, more attention should be paid to tributary contamination, especially during the wet season.
Ecological risk assessment of PAEs in urban rivers
Individual ecological risk assessment
-
Following the methodologies outlined in the European Commission's Technical Guidance Document (TGD) for risk assessment (EC, 2003) and the approach developed for the Taihu Lake Basin[14], the potential ecological risks of five predominant PAEs were calculated (DMP, DEP, DIBP, DBP, and DEHP). The resulting risk quotients (RQs) for three US EPA-recommended indicator species (algae, crustaceans, and fish) are presented in Fig. 5. The ecological risk levels in urban river water were significantly higher during the wet season than the dry season (independent t-test, p < 0.05), with RQs ranging from 1.44 × 10⁻⁶ to 2.52, and from 1.88 × 10⁻⁶ to 9.97, respectively. Notably, DEHP consistently exhibited the highest risk levels across both periods and exceeded high-risk thresholds in some cases, a finding likely attributable to its extensive use in industrial products. The risk ranking of PAEs congeners was identical in both seasons: DEHP > DIBP > DBP > DMP > DEP. This observed pattern aligned with previous risk assessments of PAEs in the East China Sea and Haihe River basin[12,27], implying a consistent contamination profile for these compounds in aquatic environments. Specifically, during the dry season, DMP, DEP, and DBP posed a low risk to sensitive aquatic organisms (RQ < 0.1). Nevertheless, DIBP presented a moderate potential risk to crustaceans and fish (RQ: 0.1−1), while DEHP exhibited a moderate risk to algae and fish (RQ: 0.1−1). Similarly, in the wet season, DMP, DEP, and DBP all showed low risk to sensitive aquatic organisms (RQ < 0.1), and DIBP exhibited low risk to crustaceans but moderate risk to fish (RQ: 0.1−1). In particular, the mean RQ values for DEHP in crustaceans, fish, and algae are 0.29, 0.41, and 2.44, respectively, suggesting a medium risk to crustaceans and fish and a potential high risk to algae.
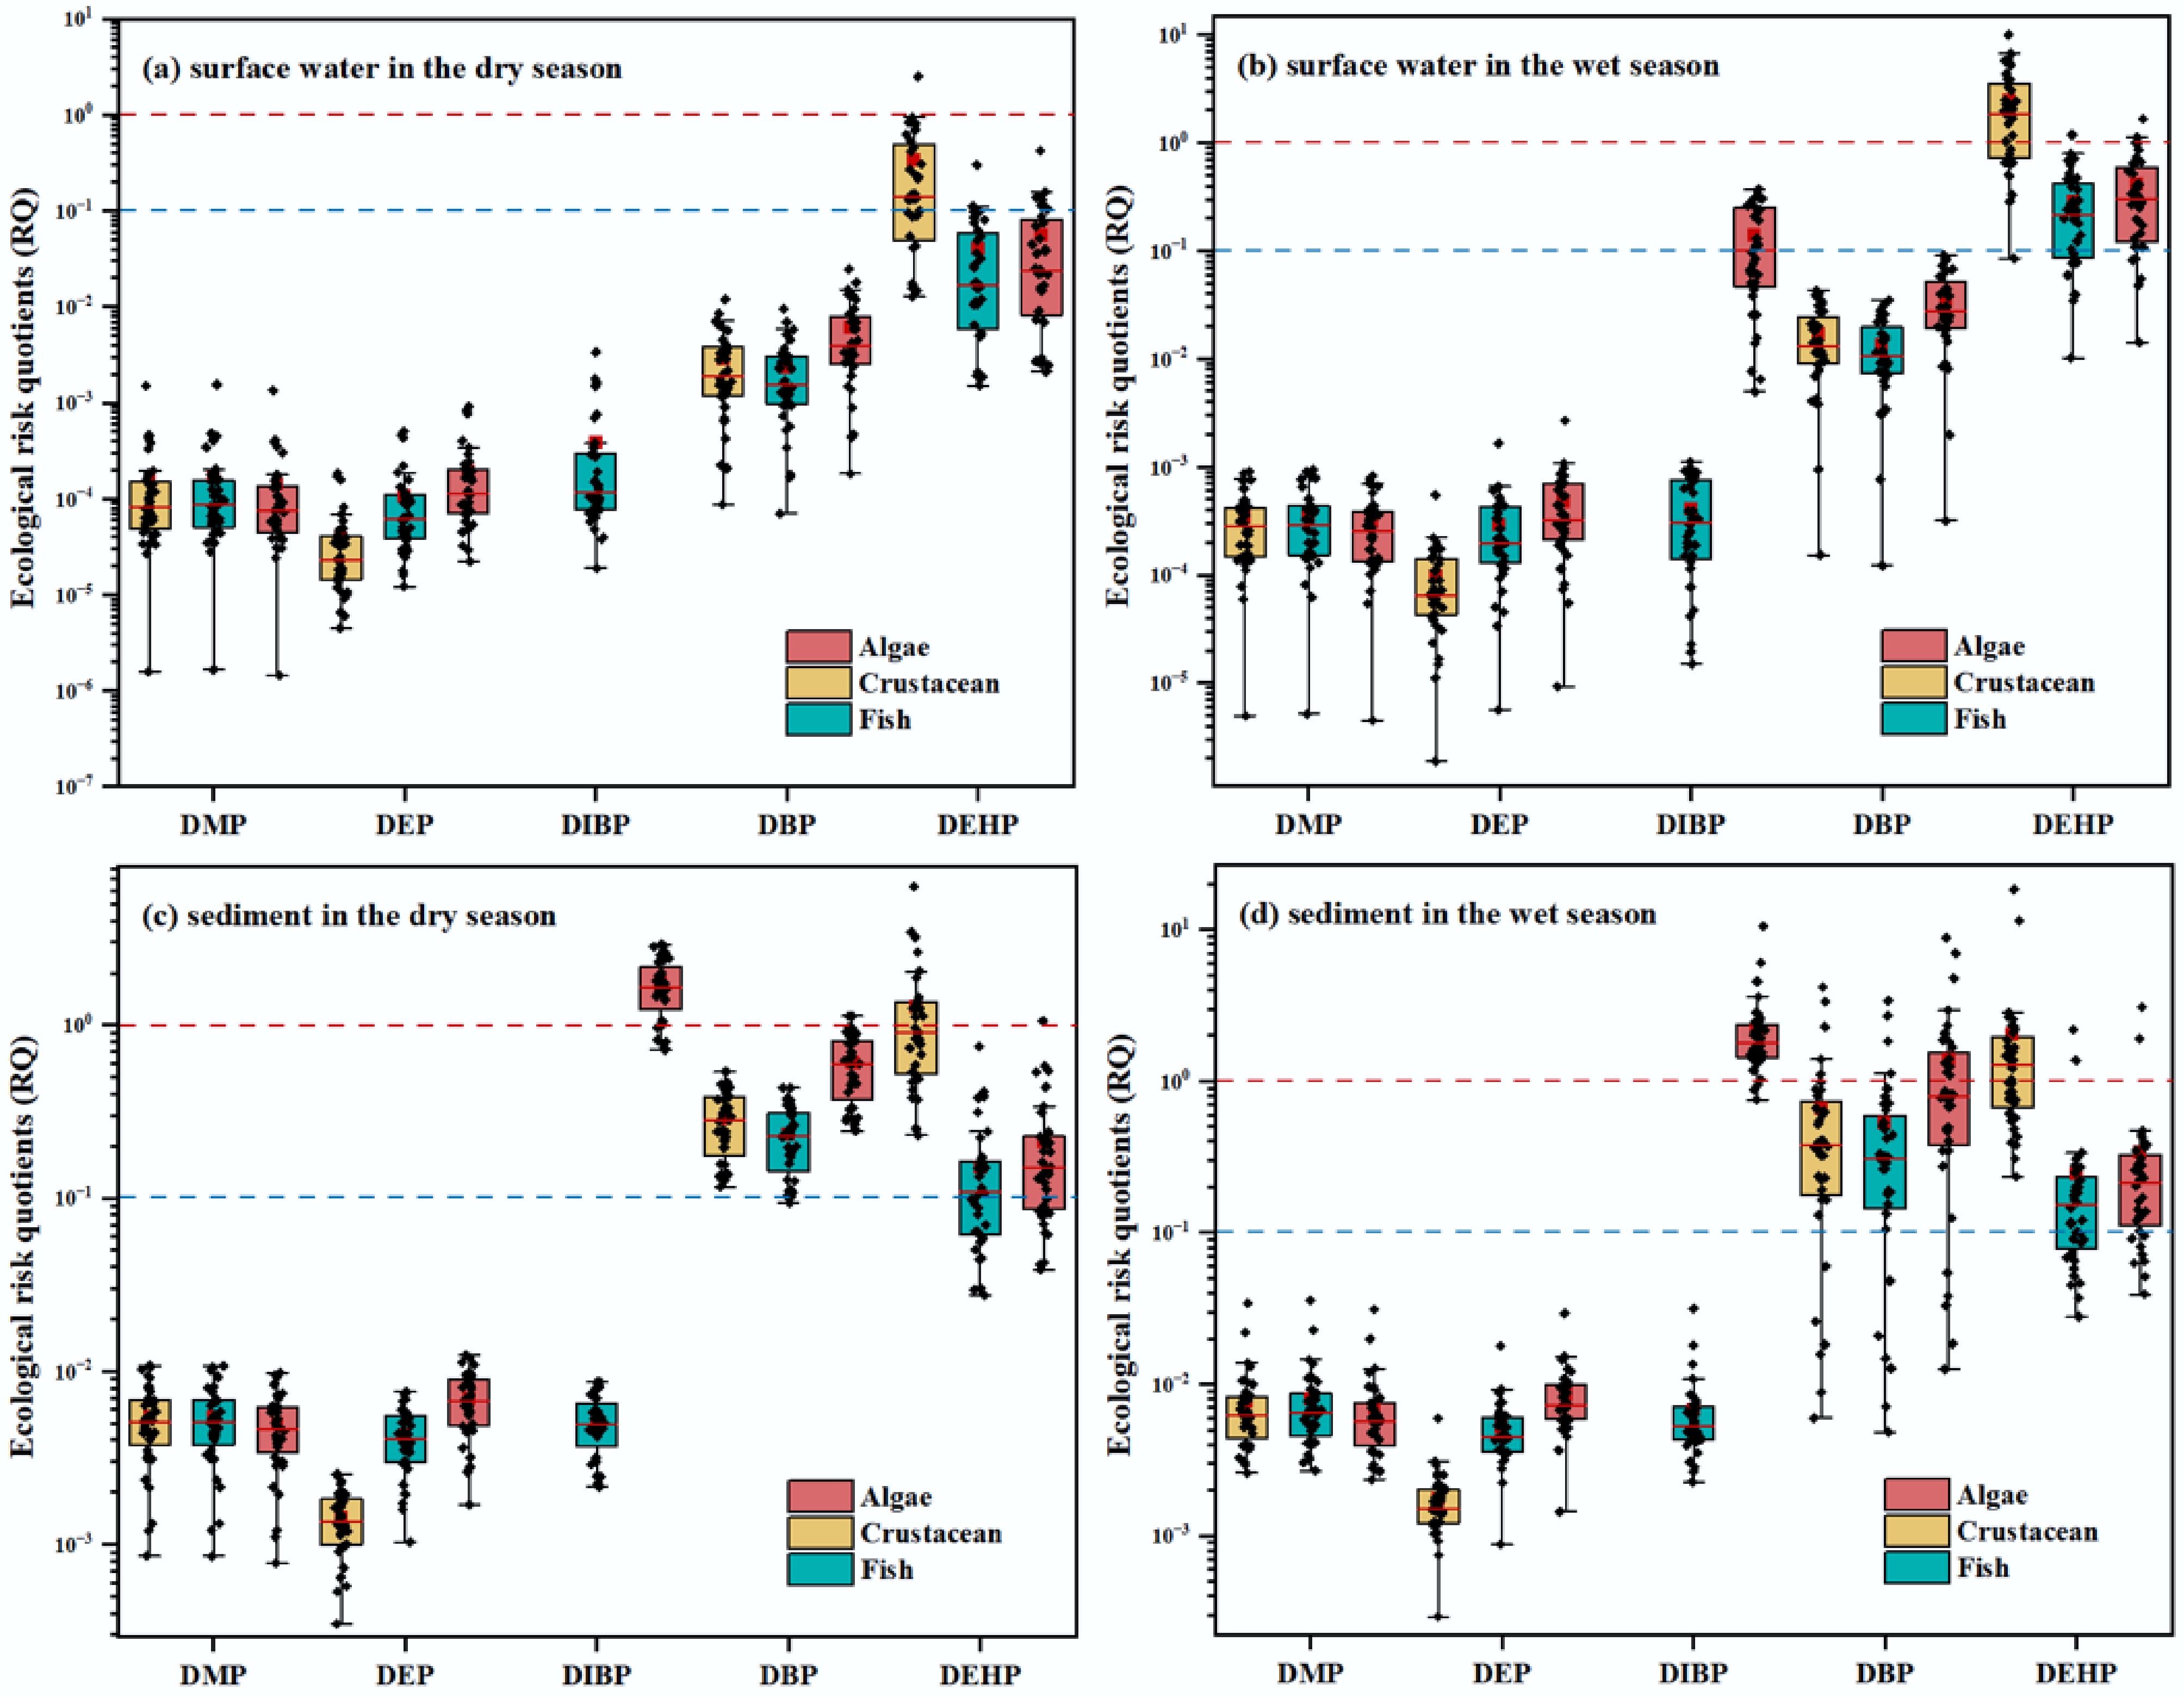
Figure 5.
Ecological risk quotients (RQ) of five predominant PAEs for three indicator species. The blue dashed line represents the threshold values between the low- and moderate-risk potential, while the red one denotes the threshold values between the moderate- and high-risk potential. (a) RQ results of predominant PAEs in river waters during the dry season; (b) RQ results of predominant PAEs in river waters during the wet season; (c) RQ results of predominant PAEs in river sediments during the dry season; (d) RQ results of predominant PAEs in river sediments during the wet season.
In sedimentary environments, the ecological risk assessment of PAEs revealed higher risk levels in the wet season, which was consistent with that in surface water (independent t-test, p < 0.5) (Fig. 5). The RQ values for the five target congeners ranged from 3.45 × 10⁻⁴ to 6.32 in the dry season, and from 2.92 × 10⁻⁴ to 18.4 in the wet season. The risk ranking of PAEs in sediments showed a trend of DEHP > DIBP > DBP > DMP > DEP in the dry season, and DEHP > DBP > DIBP > DMP > DEP in the wet season, consistent with previous findings from the Songhua River Basin[15]. Similarly, DEHP exhibited the highest risk among all congeners in both seasons, posing a high risk to fish and algae and a moderate risk to crustaceans. Interestingly, the risk levels of these five PAEs exhibited a consistent pattern across both seasons. Specifically, the RQ values of DBP for algae, crustaceans, and fish were generally within the range of 0.1–1, indicating a potential moderate risk to sensitive aquatic organisms in both seasons. Additionally, sedimentary DIBP posed a low risk to crustaceans but a high risk to fish. As for DMP and DEP, generally, no ecological risks were identified in this study.
Mixed ecological risk assessment
-
The mixed ecological risks (RQmix) of the targeted phthalates were calculated and illustrated in Fig. 6. All RQmix values in water samples surpassed the moderate-risk threshold (0.1), with 39% exceeding the high-risk threshold (1.0) during the dry season, indicating that PAEs posed a medium-high risk to sensitive aquatic organisms. In the wet season, the RQmix values of PAEs in water ranged from 1.08 to 10.64 (mean: 4.27), suggesting a consistently high risk of PAEs posed to sensitive aquatic organisms in urban rivers. In particular, the highest risk was observed at site S2 in the Sheshui River during the dry season (RQmix = 6.67) and at the site N2 in the Neijing River during the wet season (RQmix = 10.64). Furthermore, the average risk levels in the Sheshui River, Neijing River, and Fu River all exceed those in the mainstream of the Yangtze River during both seasons, while other tributaries exhibited comparably lower ecological risks. Industrial zones and dense residential areas along the Sheshui and Fu Rivers drove elevated PAE concentrations, and the pronounced risk in the Neijing River during the wet season reflected similar anthropogenic influences. Generally, this observation emphasized the unacknowledged contribution of tributary confluence to the overall pollutant load, especially during the wet season, and the urgent need for stringent management and control of pollutant discharge in these tributaries.
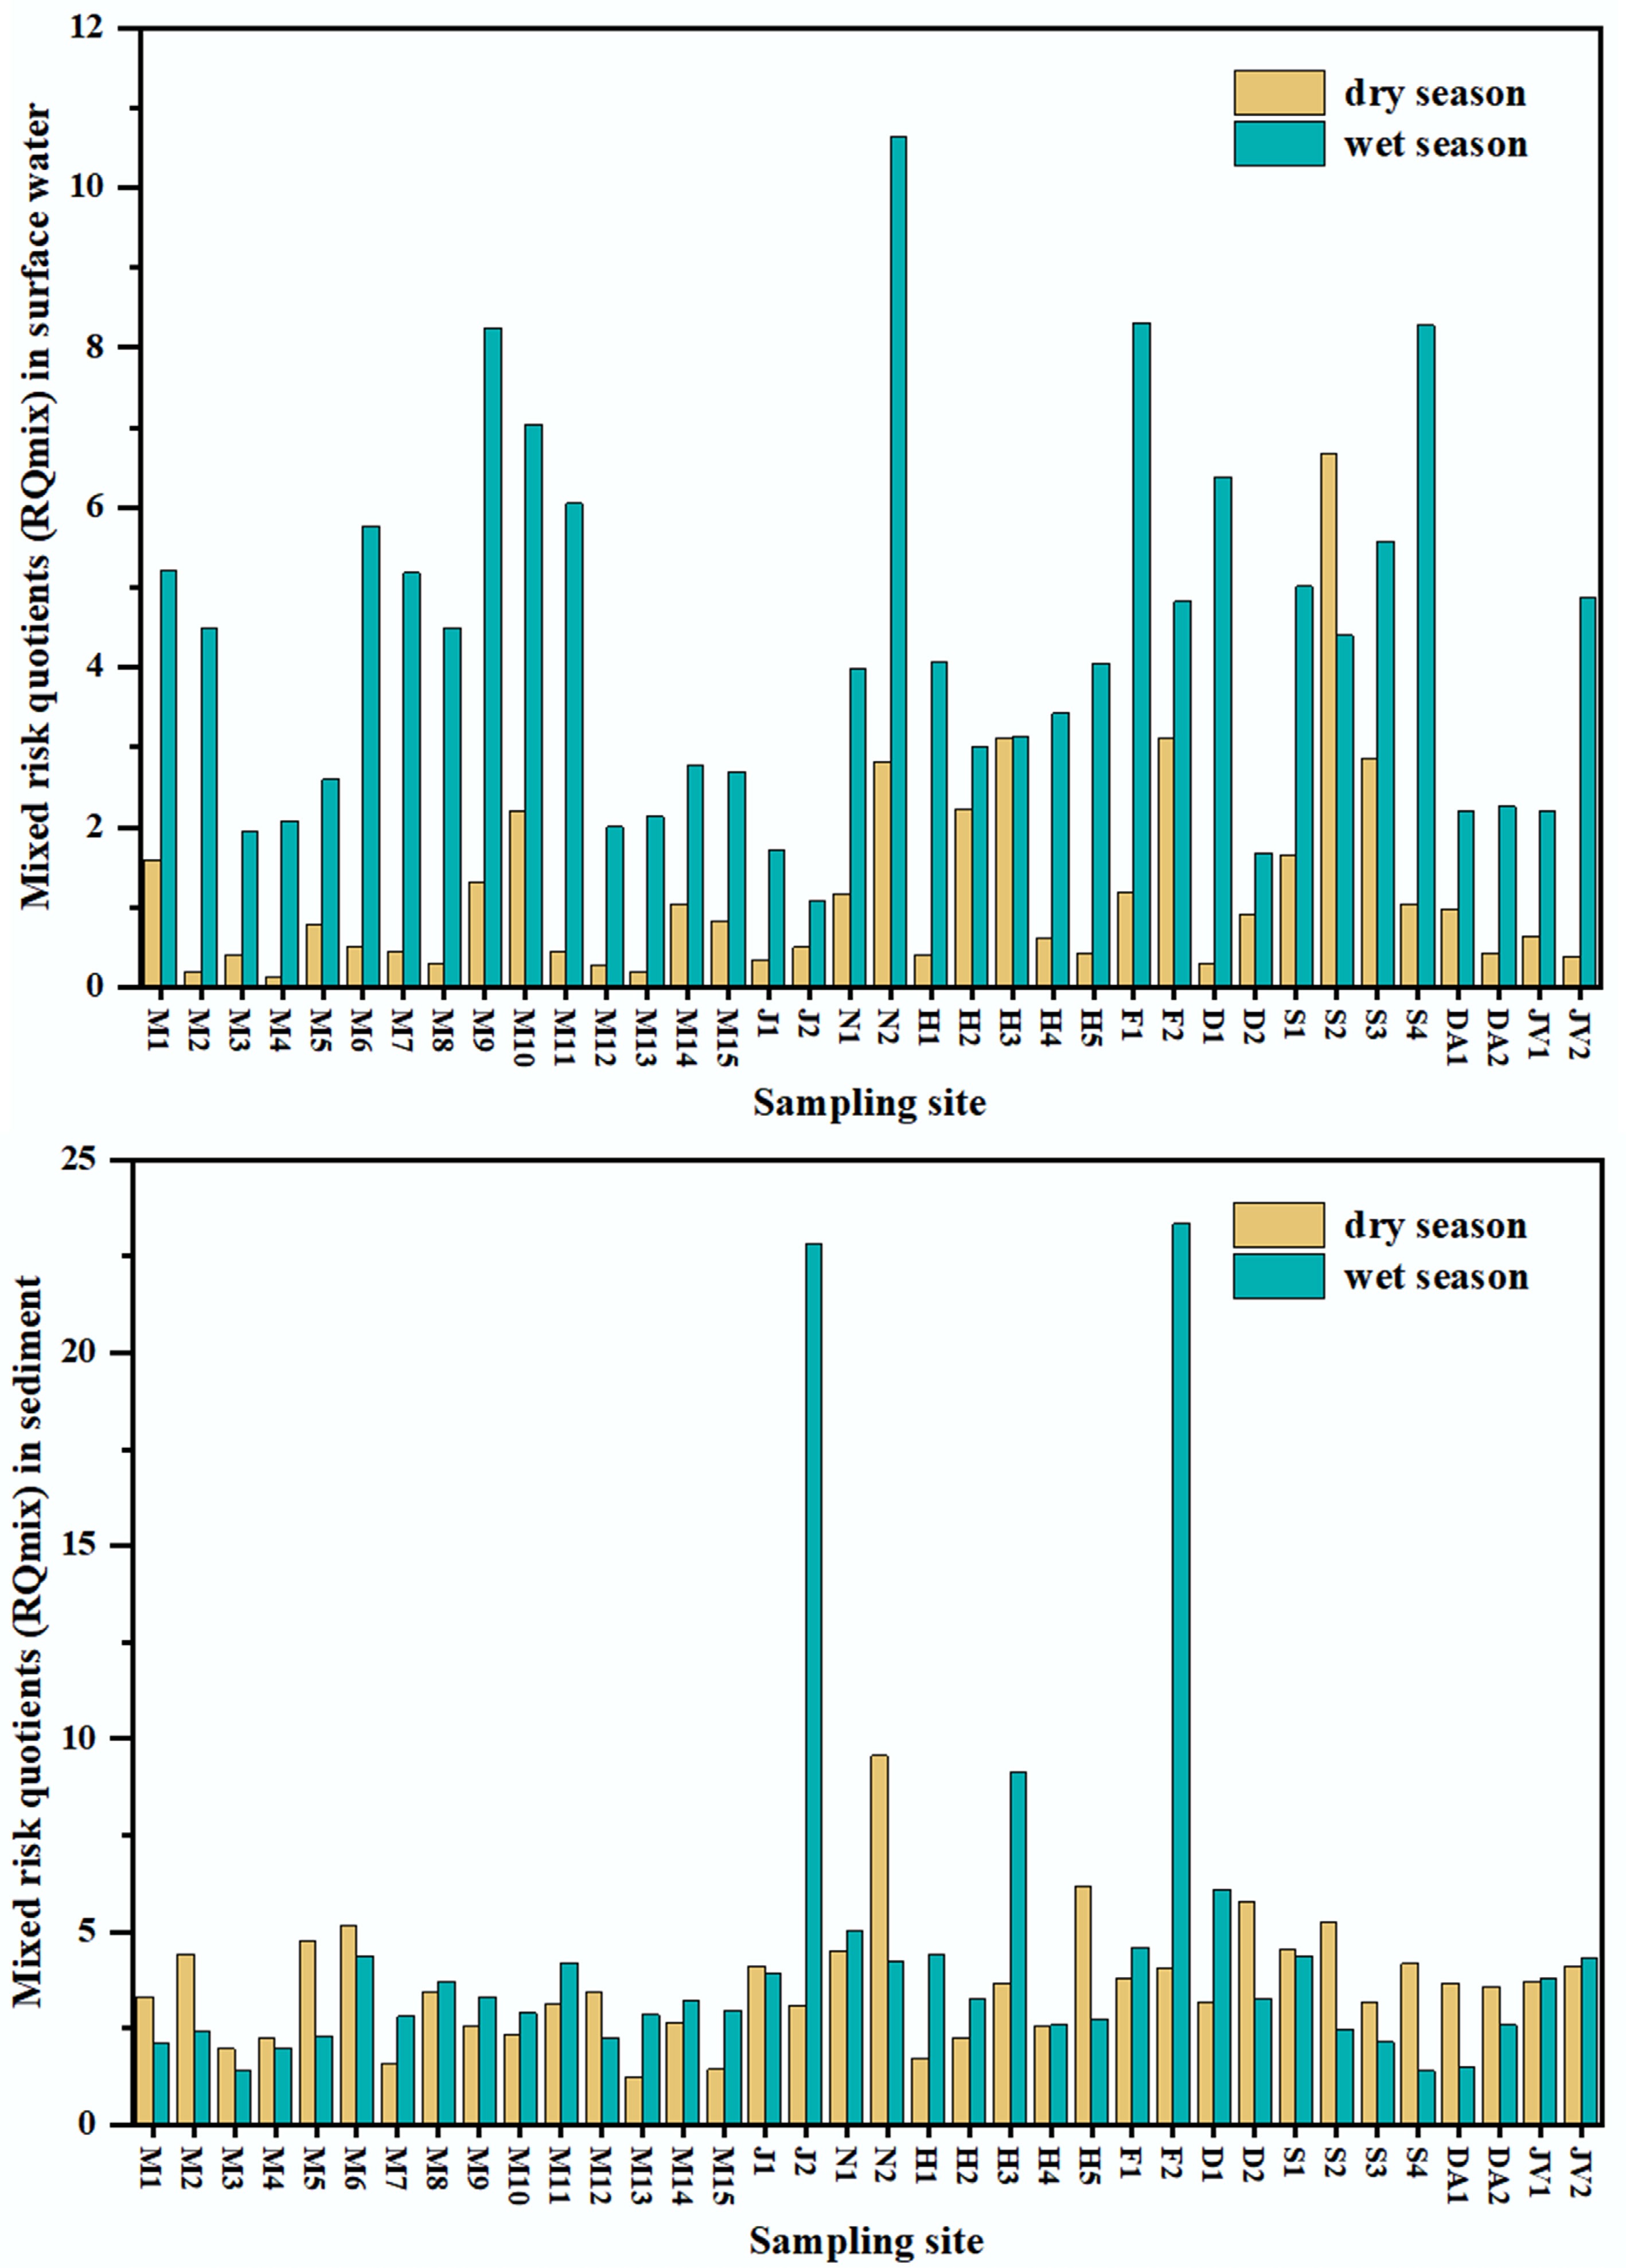
Figure 6.
Mixed risk quotients (RQmix) in surface water and sediment.
Severe PAE contamination was identified in sedimentary environments, with the RQmix values of all sediment samples exceeding the high-risk threshold (1.0) across nine rivers during both the dry and wet seasons (Fig. 6). In the dry season, the RQmix values of PAEs ranged from 1.24 to 9.55 (mean: 3.61), with the highest value recorded at the site N2 in the Neijing River. In the wet season, the RQmix ranges were higher (independent t-test, p < 0.5), ranging from 1.39 to 23.35 (mean: 4.46), and the site F2 of the Fu River (23.35) and site J2 of the Jinshui River (22.82) exhibited notably higher risks. Although the ecological risks from sedimentary PAEs were lower in the dry season than those in the wet season, all the studied tributaries still exhibited higher risks than the mainstream during the dry season (independent t-test, p < 0.1). Overall, these findings suggest that pollutant transport via water and sediment leaching, especially in tributaries, should be considered when assessing PAE contamination in the mainstream of the Yangtze River.
Health risk assessment of PAEs in urban rivers
-
The non-carcinogenic hazard indices (HIs) of PAEs for women, men, and children across 36 monitoring sites of nine urban rivers are illustrated in Supplementary Fig. S1. In line with international risk assessment standards, all calculated HIs for each demographic group during both the dry and wet seasons were substantially below the safety threshold of 1, indicating no significant non-carcinogenic risks to nearby residents at current exposure levels. Notably, the assessment results revealed population-specific sensitivities, with risk levels descending in the order of children (2.46 × 10⁻⁴ to 7.78 × 10⁻⁴ in the dry season, 2.03 × 10⁻⁴ to 2.07 × 10⁻³ in the wet season) > women (1.88 × 10⁻⁵ to 5.96 × 10⁻⁴ in the dry season, 1.62 × 10⁻⁴ to 1.66 × 10⁻³ in the wet season) > men (1.97 × 10⁻⁵ to 6.22 × 10⁻⁴ in the dry season, 1.62 × 10⁻⁴ to 1.66 × 10⁻³ in the wet season). Two factors may explain this phenomenon. On one hand, some key assessment parameters (e.g., intake rate, frequency of exposure) were adopted from the US Environmental Protection Agency (US EPA) recommendations due to incomplete local Chinese databases. These values, based on Western physiological characteristics and behavioral benchmarks, may introduce systematic biases when applied to Chinese residents here. On the other hand, children's developing immune systems and consequently reduced pollutant resistance likely amplify health impacts under equivalent exposure.
Additionally, the population sensitivity to the carcinogenic risk of DEHP followed as children (6.65 × 10⁻¹⁰ to 1.31 × 10⁻⁷ in the dry season, 4.46 × 10⁻⁹ to 5.21 × 10⁻⁷ in the wet season), women (5.31 × 10⁻¹⁰ to 1.05 × 10⁻⁷ in the dry season, 3.56 × 10⁻⁹ to 4.16 × 10⁻⁷ in the wet season), and men (5.09 × 10⁻¹⁰ to 1.01 × 10⁻⁷ in the dry season, 3.42 × 10⁻⁹ to 3.99 × 10⁻⁷ in the wet season) as well (Supplementary Fig. S2). This pattern was consistent with that of the non-carcinogenic risk, a similarity attributable to analogous physiological and exposure factors. All values remained substantially below the acceptable carcinogenic risk threshold of 1 × 10⁻⁶, demonstrating a negligible carcinogenic risk to residents during both seasons.
-
In this study, the Yangtze River mainstream (Wuhan section), and its eight tributaries were selected to investigate PAE contamination in water and sediment during both the dry and wet seasons. The total concentration of ∑16PAEs in urban rivers ranged from 40.57 to 2,465 ng/L in surface water and from 141.7 to 4,314 ng/g in sediments, predominated by DMP, DEP, DIBP, DBP, and DEHP. Notably, tributaries exhibited significantly higher levels of PAEs contamination than the mainstream of the Yangtze River, particularly during the dry season. This finding underscores the need to prioritize tributaries when it comes to PAEs contamination in large river systems, given their substantial roles as sources of PAEs across both seasons. Temporally, contamination levels were significantly higher during the wet season, a pattern potentially attributable to increased sediment leaching and precipitation-driven runoff. Based on risk assessment results from PAEs in urban rivers in this study, all sediment samples posed high ecological risks to sensitive aquatic organisms. In contrast, human health risks were below international risk thresholds for all demographic groups, with sensitivity descending in the order: children > women > men. Overall, this study identifies tributaries and sedimentary environments as critical sources of PAEs contamination in the Yangtze River. More comprehensive monitoring strategies, involving extended sampling sites, increased frequency, and sustained observation, are recommended to quantify the impact of tributary confluence in future research; therefore targeted approaches to eliminate PAE contamination in large rivers can be developed and implemented effectively.
-
It accompanies this paper at: https://doi.org/10.48130/ebp-0025-0015.
-
The authors confirm contributions to the paper as follows: Fuyu Xie: draft manuscript preparation, analysis and interpretation of results, visualization and investigation; Muze Wu: data collection, methodology, formal analysis, and conceptualization; Yulin Chen: methodology and investigation; Shang Gao: validation, supervision, and methodology; Chuang Yin: validation, methodology, and investigation; Yongfei Ma: validation and methodology; Zulin Zhang: review and editing, supervision, funding acquisition, and conceptualization. All authors commented on previous versions of the manuscript, reviewed the results, and approved the final version of the manuscript.
-
All data generated or analyzed during study are included in this published article and its supplementary information files.
-
This work was supported by the Joint Fund of Zhejiang Provincial Natural Science Foundation of China under Grant No. LLSSZ25B050001, 'Pioneer' and 'Leading Goose' R&D Program of Zhejiang (Grant No. 2024SSYS0103), and the Scottish Government's Rural and Environment Science and Analytical Services Division (RESAS).
-
All authors declare that there are no competing interests.
-
DMP, DEP, DIBP, DBP, and DEHP were dominant components in both surface water and sediments across both seasons.
Higher ∑16PAEs levels in environmental matrices were observed in the wet season.
Significant contaminant inputs from tributaries lead to higher concentrations in the mainstream, especially during the dry season.
Secondary release from sediment, particularly in tributaries, needs more attention in the wet season.
Human health risk was negligible across all demographic groups, but ecological risk to aquatic organisms was high under certain conditions.
-
# Authors contributed equally: Fuyu Xie, Muze Wu
Full list of author information is available at the end of the article. - The supplementary files can be downloaded from here.
- Copyright: © 2025 by the author(s). Published by Maximum Academic Press, Fayetteville, GA. This article is an open access article distributed under Creative Commons Attribution License (CC BY 4.0), visit https://creativecommons.org/licenses/by/4.0/.
-
About this article
Cite this article
Xie F, Wu M, Chen Y, Gao S, Yin C, et al. 2025. Spatiotemporal distribution, migration behaviors, and ecological risks of phthalate esters in tributaries and mainstream of the Yangtze River, Wuhan section. Environmental and Biogeochemical Processes 1: e015 doi: 10.48130/ebp-0025-0015 

Spatiotemporal distribution, migration behaviors, and ecological risks of phthalate esters in tributaries and mainstream of the Yangtze River, Wuhan section
- Received: 12 September 2025
- Revised: 17 November 2025
- Accepted: 02 December 2025
- Published online: 26 December 2025
Abstract: Phthalate acid esters (PAEs) are ubiquitous in the Yangtze River, primarily due to their widespread use. However, the contributions from tributaries, particularly those traversing urban areas, and associated seasonal impacts, remain poorly understood. This study demonstrates that eight tributaries in the Wuhan section exhibited higher PAEs contamination than the Yangtze River mainstream, especially during the dry season, highlighting their role as significant PAEs sources. Total concentrations of 16 PAEs in both water and sediments of urban rivers, including the mainstream and its tributaries, were elevated during the wet season. In addition, five predominant PAEs, namely dimethyl phthalate (DMP), diethyl phthalate (DEP), di-n-butyl phthalate (DBP), diisobutyl phthalate (DIBP), and bis(2-ethylhexyl) phthalate (DEHP), were inclined to secondary release from sediments into the water column. This phenomenon was more pronounced in tributaries, suggesting that sediments are a potential ongoing source of PAEs. Generally, PAEs in urban river water posed medium to high risks to sensitive aquatic organisms. In contrast, those in sediment consistently posed high risks, with DEHP being the most hazardous in both matrices. Nonetheless, no significant human health threat was identified, as all calculated non-carcinogenic and carcinogenic indices in this study fell below established safety thresholds. These findings underscore the critical role of tributaries in PAE contamination in large river systems, and comprehensive monitoring, as well as control strategies, are recommended to effectively mitigate contamination.
-
Key words:
- Phthalate acid esters (PAEs) /
- Tributary contribution /
- Sediment release /
- Ecological risk /
- Health risk