













-
Low-temperature stress is a major abiotic factor that limits plants' growth, geographic distribution, and yield, posing a serious threat to global crop production[1]. Over the course of evolution, plants have developed sophisticated cold acclimation mechanisms: Upon perceiving cold signals, they activate a cascade of physiological, biochemical, and molecular responses to enhance freezing tolerance[2]. Importantly, cold acclimation is not governed by a single signaling pathway but arises from the coordinated integration of multiple environmental and endogenous cues[3]. Among these, the crosstalk between light and low-temperature signals plays a particularly pivotal role.
Light supplies energy for photosynthesis and also serves as a critical environmental signal that regulates plants' growth, development, and stress resilience. Photoreceptors, such as phytochromes and cryptochromes, detect the quality, intensity, and duration of light, thereby modulating the activity and expression of downstream transcription factors[4,5]. Conversely, low-temperature signaling primarily triggers the expression of cold-responsive genes and promotes the accumulation of protective compounds through well-conserved pathways, including the C-repeat binding factor (CBF) regulatory module[6,7]. Growing evidence indicates extensive interactions between the light and cold signaling networks. For example, light signals enhance the efficiency of cold responses by regulating the circadian expression of key CBF pathway components; in turn, cold stress influences the expression and stability of photoreceptors and light-responsive genes[8]. This synergistic integration critically determines the effectiveness and amplitude of cold acclimation, representing a central regulatory hub that enables plants to precisely adapt to low temperatures.
Despite progress in understanding how light or cold signals independently contribute to cold tolerance, the transcriptional architecture underlying their integration remains poorly resolved. Most existing studies have focused on individual genes or limited pathway interactions, failing to systematically capture the hierarchy of core transcription factors, the network of gene–gene interactions, and the key signaling nodes that converge during light–cold signals' integration[9,10]. Consequently, the dynamic properties and regulatory logic of this integrated network are still elusive, limiting our ability to predict and manipulate cold acclimation in crops.
In this study, we developed a integrative computational model that unifies core light- and cold-responsive transcriptional modules in tomato (Solanum lycopersicum). By coupling the core INDUCER OF CBF EXPRESSION 1—C-REPEAT BINDING FACTOR 1—COLD REGULATED FACTORS (ICE1–CBF–COR) cold-signaling axis with light-sensitive cascades, namely, CONSTITUTIVE PHOTOMORPHOGENIC 1—ELONGATED HYPOCOTYL 5—MYB DOMAIN PROTEIN 15 (COP1–HY5–MYB15) and phytochromes—PHYTOCHROME INTERACTING FACTOR 4—GA-INSENSITIVE 4 (phytochromes-PIF4–GIA4), we established a systems-level platform for dissecting the regulatory logic by which light quality and photoperiod govern cold acclimation. Furthermore, this study identifief previously uncharacterized regulatory interactions and furnishes testable, predictive insights for improving cold tolerance via the rational engineering of network hubs.
-
A computational model was constructed to represent the coupled cold and light signaling pathways in tomato. The network integrates three experimentally validated regulatory modules: (1) the core cold response pathway, ICE1–CBF–COR; (2) the light-regulated COP1–HY5–MYB15 module; and (3) the light-quality-sensing phytochromes–PIF4–GAI4 module. These modules are interconnected through shared transcription factors and environmental inputs (light intensity, light quality, and temperature), enabling dynamic crosstalk between photomorphogenesis and cold acclimation. A detailed description of the derivation of the gene regulatory network is provided in the Supplementary Text 1.
Plant materials and growth conditions
-
All experimental data used for model parameterization and validation were derived from published studies on tomato. For parameter estimation, we obtained SlHY5 expression data from wild-type (Solanum lycopersicum cv. 'Ailsa Craig') seedlings, and SlMYB15 expression data from wild-type, hy5 mutant, and HY5-overexpressing lines[11]. These plants were grown under a 12-h light/12-h dark photoperiod with a photosynthetic photon flux density of 600 μmol m−2 s−1 and 85% relative humidity. For cold stress treatments, plants were exposed to 4 °C under the same light conditions. Model validation used SlCBF1 and SlCOR413 expression data from wild-type plants grown at 4 °C under either a 16-h light/8-h dark photoperiod or continuous light (LL) following a 16-h light period[12−14]. All experimental procedures and data collection followed the protocols described in the original publications.
Temperature signal transduction modelling
-
According to the temperature-sensing model[15,16], calcium enters the cytoplasm through channels whose activity is a function of the cooling rate
$ \left(\dfrac{\text{d}T}{\text{d}t}\right) $ $ \dfrac{\text{d}Iexmax}{\text{d}t}={P}_{0}\text{sgn}\left([\text{C}{\text{a}}^{2+}]-{\left[\text{C}{\text{a}}^{2+}\right]}_{0}\right)\dfrac{[\text{C}{\text{a}}^{2+}]}{{K}_{P}+[\text{C}{\text{a}}^{2+}]} , $ (1) where,
$ \text{sgn(}x) $ $ {\left[\text{C}{\text{a}}^{2+}\right]}_{0} $ $ {P}_{0} $ $ {K}_{P} $ $ \dfrac{\text{d}[\text{C}{\text{a}}^{2+}]}{\text{d}t}=Ii{n}_{0}+Iinmax\dfrac{{\left| \text{d}T\right| }^{3}}{KK_{1}^{3}+{\left| \text{d}T\right| }^{3}}-Iexmax{\text{e}}^{{{K}_{Q}}(T-{{T}_{0}})}\dfrac{[\text{C}{\text{a}}^{2+}]}{KK_{m}^{2}+\left[\text{C}{\text{a}}^{2+}\right]} , $ (2) where,
$ {K}_{Q}=\dfrac{\log Q}{10} $ $ Q=10 $ $ K{K}_{1}=1 $ $ K{K}_{m}=0.5 $ $ Ii{n}_{0}=0.005 $ $ Iinmax=0.108 $ Following cold treatment, calmodulin (CaM) is activated by binding with Ca2+. This activation follows a cooperative binding curve described by a Hill function with a coefficient of 4. The fraction of activated calmodulin is therefore given by Eq. (3):
$ \dfrac{\text{d}CaM}{\text{d}t}=\dfrac{{\left[\text{C}{\text{a}}^{2+}\right]}^{4}}{{K}_{Ca}+{\left[\text{C}{\text{a}}^{2+}\right]}^{4}} . $ (3) Downstream cold-light response modeling
-
The model consists of ordinary differential equations (ODEs) listed as Eqs (4)−(24). A description of each of the variables and parameters can be found in Supplementary Tables S1 and S2. The time evolution of the mRNA and protein levels are governed by the following differential equations.
(a) Inhibitor SlCOP1 and activator SlHY5
$ \dfrac{\text{d[SlCOP1]}}{\text{d}t}=({p}_{0}+{p}_{0D}D)-({d}_{0}+{d}_{0L}L\text{)[SlCOP1]} , $ (4) $ \dfrac{\text{d[MSlHY5]}}{\text{d}t}={v}_{1}\dfrac{1}{1+{\left(\dfrac{\left[\text{SlCOP1}\right]}{{K}_{1}}\right)}^{{{n}_{1}}}}-{k}_{1}\text{[MSlHY5]} , $ (5) $ \dfrac{\text{d[SlHY5]}}{\text{d}t}={p}_{1}\left[\text{MSlHY5}\right]-({d}_{1}-{d}_{1L}L+{d}_{1D}D\text{)[SlHY5]} , $ (6) (b) Positive transcription factors (TF): SlMYB15, SlICE1, and SlCAMTA and the negative TF SlZAT12
$ \dfrac{\text{d[MSlMYB15]}}{\text{d}t}={v}_{2}\dfrac{{\left(\dfrac{\left[\text{SlHY5}\right]}{{K}_{2}}\right)}^{{{n}_{2}}}}{1+{\left(\dfrac{\left[\text{SlHY5}\right]}{{K}_{2}}\right)}^{{{n}_{2}}}}-{k}_{2}\text{[MSlMYB15]} , $ (7) $\begin{split} \dfrac{\text{d[SlMYB15]}}{\text{d}t}=\;&{p}_{2}\left[\text{MSlMYB15}\right]-{v}_{\text{P1}}\left(1-\dfrac{1}{1+\dfrac{\left[\text{SlMYB15}\right]}{{K}_{\text{P1}}}+\dfrac{CaM}{{K}_{CaM1}}}\right)+\\&{v}_{\text{P2}}\dfrac{\left[\text{SlMYB15P}\right]}{{K}_{\text{P2}}+\left[\text{SlMYB15P}\right]}-{d}_{2}\text{[SlMYB15]} , \end{split}$ (8) $ \begin{split}\dfrac{\text{d[SlMYB15P]}}{\text{d}t}=\;&{v}_{\text{P1}}\left(1-\dfrac{1}{1+\dfrac{\left[\text{SlMYB15}\right]}{{K}_{\text{P1}}}+\dfrac{CaM}{{K}_{CaM1}}}\right)-\\&{v}_{\text{P2}}\dfrac{\left[\text{SlMYB15P}\right]}{{K}_{\text{P2}}+\left[\text{SlMYB15P}\right]}-{d}_{P2}\text{[SlMYB15P]} ,\end{split} $ (9) $ \begin{split}\dfrac{\text{d}\left[\text{SlICE1}\right]}{\text{d}t}=\;&p-{v}_{\text{P3}}\left(1-\dfrac{1}{1+\dfrac{\left[\text{SlICE1}\right]}{{K}_{\text{P3}}}+\dfrac{CaM}{{K}_{CaM2}}}\right)+\\&{v}_{\text{P4}}\dfrac{\left[\text{SlICE1P}\right]}{{K}_{\text{P4}}+\left[\text{SlICE1P}\right]}-d\text{[SlICE1]} , \end{split}$ (10) $ \begin{split}\dfrac{\text{d}\left[\text{SlICE1P}\right]}{\text{d}t}=\;&{v}_{\text{P3}}\left(1-\dfrac{1}{1+\dfrac{\left[\text{SlICE1}\right]}{{K}_{\text{P3}}}+\dfrac{CaM}{{K}_{CaM2}}}\right)-\\&{v}_{\text{P4}}\dfrac{\left[\text{SlICE1P}\right]}{{K}_{\text{P4}}+\left[\text{SlICE1P}\right]}-{d}_{P3}\text{[SlICE1P]} , \end{split}$ (11) $ \dfrac{\text{d}\left[\text{MSlCAMTA}\right]}{\text{d}t}={v}_{3}\dfrac{{\left(\dfrac{CaM}{{K}_{CaM3}}\right)}^{{{n}_{3}}}}{1+{\left(\dfrac{CaM}{{K}_{CaM3}}\right)}^{{{n}_{3}}}}-{k}_{3}\left[\text{MSlCAMTA}\right] , $ (12) $ \dfrac{\text{d}\left[\text{SlCAMTA}\right]}{\text{d}t}={p}_{3}\left[\text{MSlCAMTA}\right]-{d}_{3}\left[\text{SlCAMTA}\right] , $ (13) (c) Output: SlCBF1 mRNA, and phosphorylated and nonphosphorylated SlCBF1 protein
$\begin{split}& \dfrac{\text{d}\left[\text{MSlCBF1}\right]}{\text{d}t}={v}_{4}\dfrac{{\left(\dfrac{\left[\text{SlICE1}\right]}{{K}_{3}}\right)}^{{{n}_{5}}}}{1+{\left(\dfrac{\left[\text{SlICE1}\right]}{{K}_{3}}\right)}^{{{n}_{5}}}}\\&\left( 1+\dfrac{1}{1 +{\left(\dfrac{\left[\text{SlMYB15}\right]}{{K}_{4}}\right)}^{{{n}_{6}}} +{\left(\dfrac{\left[\text{SlHY5}\right]}{{K}_{5}}\right)}^{{{n}_{7}}} +{\left(\dfrac{\left[\text{SlPIF4}\right]}{{K}_{6}}\right)}^{{{n}_{8}}} +{\left(\dfrac{\left[\text{SlCAMTA}\right]}{{K}_{7}}\right)}^{{{n}_{9}}}} \right)\\& \dfrac{1}{1+{\left(\dfrac{\left[\text{ZAT12}\right]}{{K}_{8}}\right)}^{{{n}_{10}}}}-{k}_{4}\left[\text{MSlCBF1}\right] , \end{split}$ (14) $ \begin{split}\dfrac{\text{d}\left[\text{SlCBF1}\right]}{\text{d}t}=\;&{p}_{4}\left[\text{MSlCBF1}\right]-{v}_{\text{P5}}\dfrac{\dfrac{\left[SlCBF1\right]}{{K}_{P5}}+\dfrac{CaM}{{K}_{CaM5}}}{1+\dfrac{\left[SlCBF1\right]}{{K}_{P5}}+\dfrac{CaM}{{K}_{CaM5}}}+\\&{v}_{\text{P6}}\dfrac{\left[\text{SlCBF1P}\right]}{{K}_{\text{P6}}+\left[\text{SlCBFP}\right]}-{d}_{4}\text{[SlCBF1]} ,\end{split} $ (15) $ \begin{split}\dfrac{\text{d}\left[\text{SlCBF1P}\right]}{\text{d}t}=\;&{v}_{\text{P5}}\left(1-\dfrac{1}{1+\dfrac{\left[\text{SlCBF1}\right]}{{K}_{\text{P5}}}+\dfrac{CaM}{{K}_{CaM5}}}\right)-\\&{v}_{\text{P6}}\dfrac{\left[\text{SlCBF1P}\right]}{{K}_{\text{P6}}+\left[\text{SlCBF1P}\right]}-{d}_{\text{P4}}\left[\text{SlCBF1P}\right] , \end{split}$ (16) (d) Downstream of SlCBF1 and output: SlZAT12 mRNA and protein, and SlCOR413 mRNA and protein
$ \dfrac{\text{d[MSlZAT12]}}{\text{d}t}={v}_{5a}+{v}_{5}\dfrac{{\left(\dfrac{\left[\text{SlCBF1}\right]}{{K}_{9}}\right)}^{{{n}_{11}}}}{1+{\left(\dfrac{\left[\text{SlCBF1}\right]}{{K}_{9}}\right)}^{{{n}_{11}}}}-{k}_{5}\text{[MSlZAT12]} , $ (17) $ \dfrac{\text{d[SlZAT12]}}{\text{d}t}={p}_{5}\text{[MSlZAT12]-}{d}_{5}\left[\text{SlZAT12}\right] , $ (18) $ \begin{split}\dfrac{\text{d[MSlCOR413]}}{\text{d}t}=\;&{v}_{6}\left(1-\dfrac{1}{1+{\left(\dfrac{\left[\text{SlCBF1}\right]}{{K}_{10}}\right)}^{{{n}_{12}}}+{\left(\dfrac{\left[\text{SlZAT12}\right]}{{K}_{11}}\right)}^{{{n}_{13}}}}\right)\\&-{k}_{6}\left[\text{MSlCOR413}\right] , \end{split}$ (19) $ \dfrac{\text{d[SlCOR413]}}{\text{d}t}={p}_{6}\cdot\left[\text{MSlCOR413}\right]-{d}_{6}\left[\text{SlCOR413}\right] , $ (20) (e) The light-quality-induced proteins phyA and phyB and their expression
$\begin{split} \dfrac{\text{d}\left[\text{PHYA}\right]}{\text{d}t}=&{p}_{A}\dfrac{CaM}{{K}_{A}+CaM}+{p}_{BA}\left(1-\dfrac{{\text{[PHYB]}}^{{{n}_{14}}}}{K_{BA}^{{n}_{4}}+{\text{[PHYB]}}^{{{n}_{14}}}}\right)-\\&\dfrac{{d}_{A}}{1+{a}_{FR}\cdot\gamma }\left[\text{PHYA}\right] , \end{split}$ (21) $ \dfrac{\text{d}\left[\text{PHYB}\right]}{\text{d}t}={p}_{B}\dfrac{{K}_{B}}{{K}_{B}+CaM}\left(1-\dfrac{{\text{[PHYA]}}^{{{n}_{15}}}}{K_{AB}^{{n}_{5}}+{\text{[PHYA]}}^{{{n}_{15}}}}\right)-\dfrac{{d}_{B}}{1+{a}_{R}\cdot\gamma }\left[\text{PHYB}\right] , $ (22) (f) Negative feedback loop exerted by SlGAI4 on SlPIF4
$ \begin{split}\dfrac{\text{d}\left[\text{SlPIF4}\right]}{\text{d}t}=\;&{p}_{PIF}\dfrac{K_{p\text{h}yB}^{{n}_{16}}}{K_{p\text{h}yB}^{{n}_{16}}+{\text{[PHYB]}}^{{{n}_{16}}}}\dfrac{{\text{[PHYA]}}^{{{n}_{17}}}}{{{K_{p\text{h}yA}^{{n}_{17}}}\text{+[PHYA]}}^{{{n}_{17}}}}\\&\dfrac{K_{GAI}^{{n}_{18}}}{K_{GAI}^{{n}_{18}}+{\text{[MSlGAI4]}}^{{{n}_{18}}}}-{d}_{PIF}\left[\text{SlPIF4}\right] , \end{split}$ (23) $ \dfrac{\text{d}\left[\text{SlGAI4}\right]}{\text{d}t}={p}_{GAI}\dfrac{{\text{[SlPIF4]}}^{{{n}_{19}}}}{{{K_{PIF}^{{n}_{19}}}\text{+[SlPIF4]}}^{{{n}_{19}}}}-{d}_{GAI}\left[\text{SlGAI4}\right] . $ (24) In the model,
$ [\cdot ] $ Numerical simulation and statistical analysis
-
All computational and statistical analyses were performed in Python 3.10.4. The system of ODEs was numerically solved using the 'odeint' package. The period and phase were determined according to the methodology described in the Supplementary Text 2.
To evaluate the robustness of the cold response pathway model, we conducted a single-parameter sensitivity analysis (Supplementary Fig. S1). This analysis varied 10 parameters independently over a logarithmic range of 10−3 to 103 times their baseline values while keeping all other parameters fixed. The parameters that exhibited obvious differences in magnitude from H2025 were selected.
To quantitatively evaluate the agreement between simulated and experimental expression data, we calculated the coefficient of determination (R2) and the root mean square error (RMSE) for each gene in both the training (SlHY5, SlMYB15) and validation (SlCBF1, SlCOR413) datasets (Supplementary Table S3). For each gene, paired simulated and experimental values at identical time points were imported into OriginPro software (OriginLab Corporation, Northampton, MA, USA). The R2 value was obtained using the built-in linear regression analysis, which measures the proportion of variance in the experimental data explained by the simulations. The RMSE was computed as the square root of the average squared difference between paired simulated and experimental values, using the descriptive statistics or custom calculation function available in OriginPro. All metrics were directly extracted from the software's output.
-
Calcium (Ca2+) functions as a ubiquitous secondary messenger in plants, participating in diverse physiological processes including embryogenesis, immune responses, and fruit development[17−20]. Over the past two decades, research has extensively characterized Ca2+-responsive proteins and their downstream targets, elucidating their roles in plant adaptation to biotic and abiotic stresses, including cold. Upon cold shock, a transient influx of Ca2+ into the cytosol rapidly elevates cytoplasmic Ca2+ levels. This signal is perceived by calmodulin (CaM), a key Ca2+ sensor, which, in turn, activates a kinase cascade to induce the downstream genes essential for cold acclimation[21,22]. To maintain the model's simplicity, we retained the one-compartment Ca2+ formulations from the Arabidopsis thaliana cold-acclimation model (referred to as H2025[23]), enabling a comparative analysis of the system's dynamics under Ca2+ pulse. The temperature response in the model (Eqs [1]–[3]) is formulated on the bassis of established physiological mechanisms: Calcium influx into the cytoplasm occurs through calcium-permeable channels whose activity is modeled as a function of the cooling rate
$ \left(\dfrac{\text{d}T}{\text{d}t}\right) $ Figure 1 presents the principal scheme of the tomato cold-acclimation model incorporating light signaling. This model was structurally compared with the previously established H2025 model, highlighting newly integrated components and circuit architectures specific to tomato. As in the H2025 framework, the ICE1–CBF–COR pathway remains central to cold stress defense. The tomato model is formalized as a system of 21 variables (Supplementary Table S1) with the corresponding ordinary differential equations (Eqs [4]–[24]) and 80 parameters, which were optimized against the experimental time-series datasets via cost function minimization (see Supplementary Text 3).
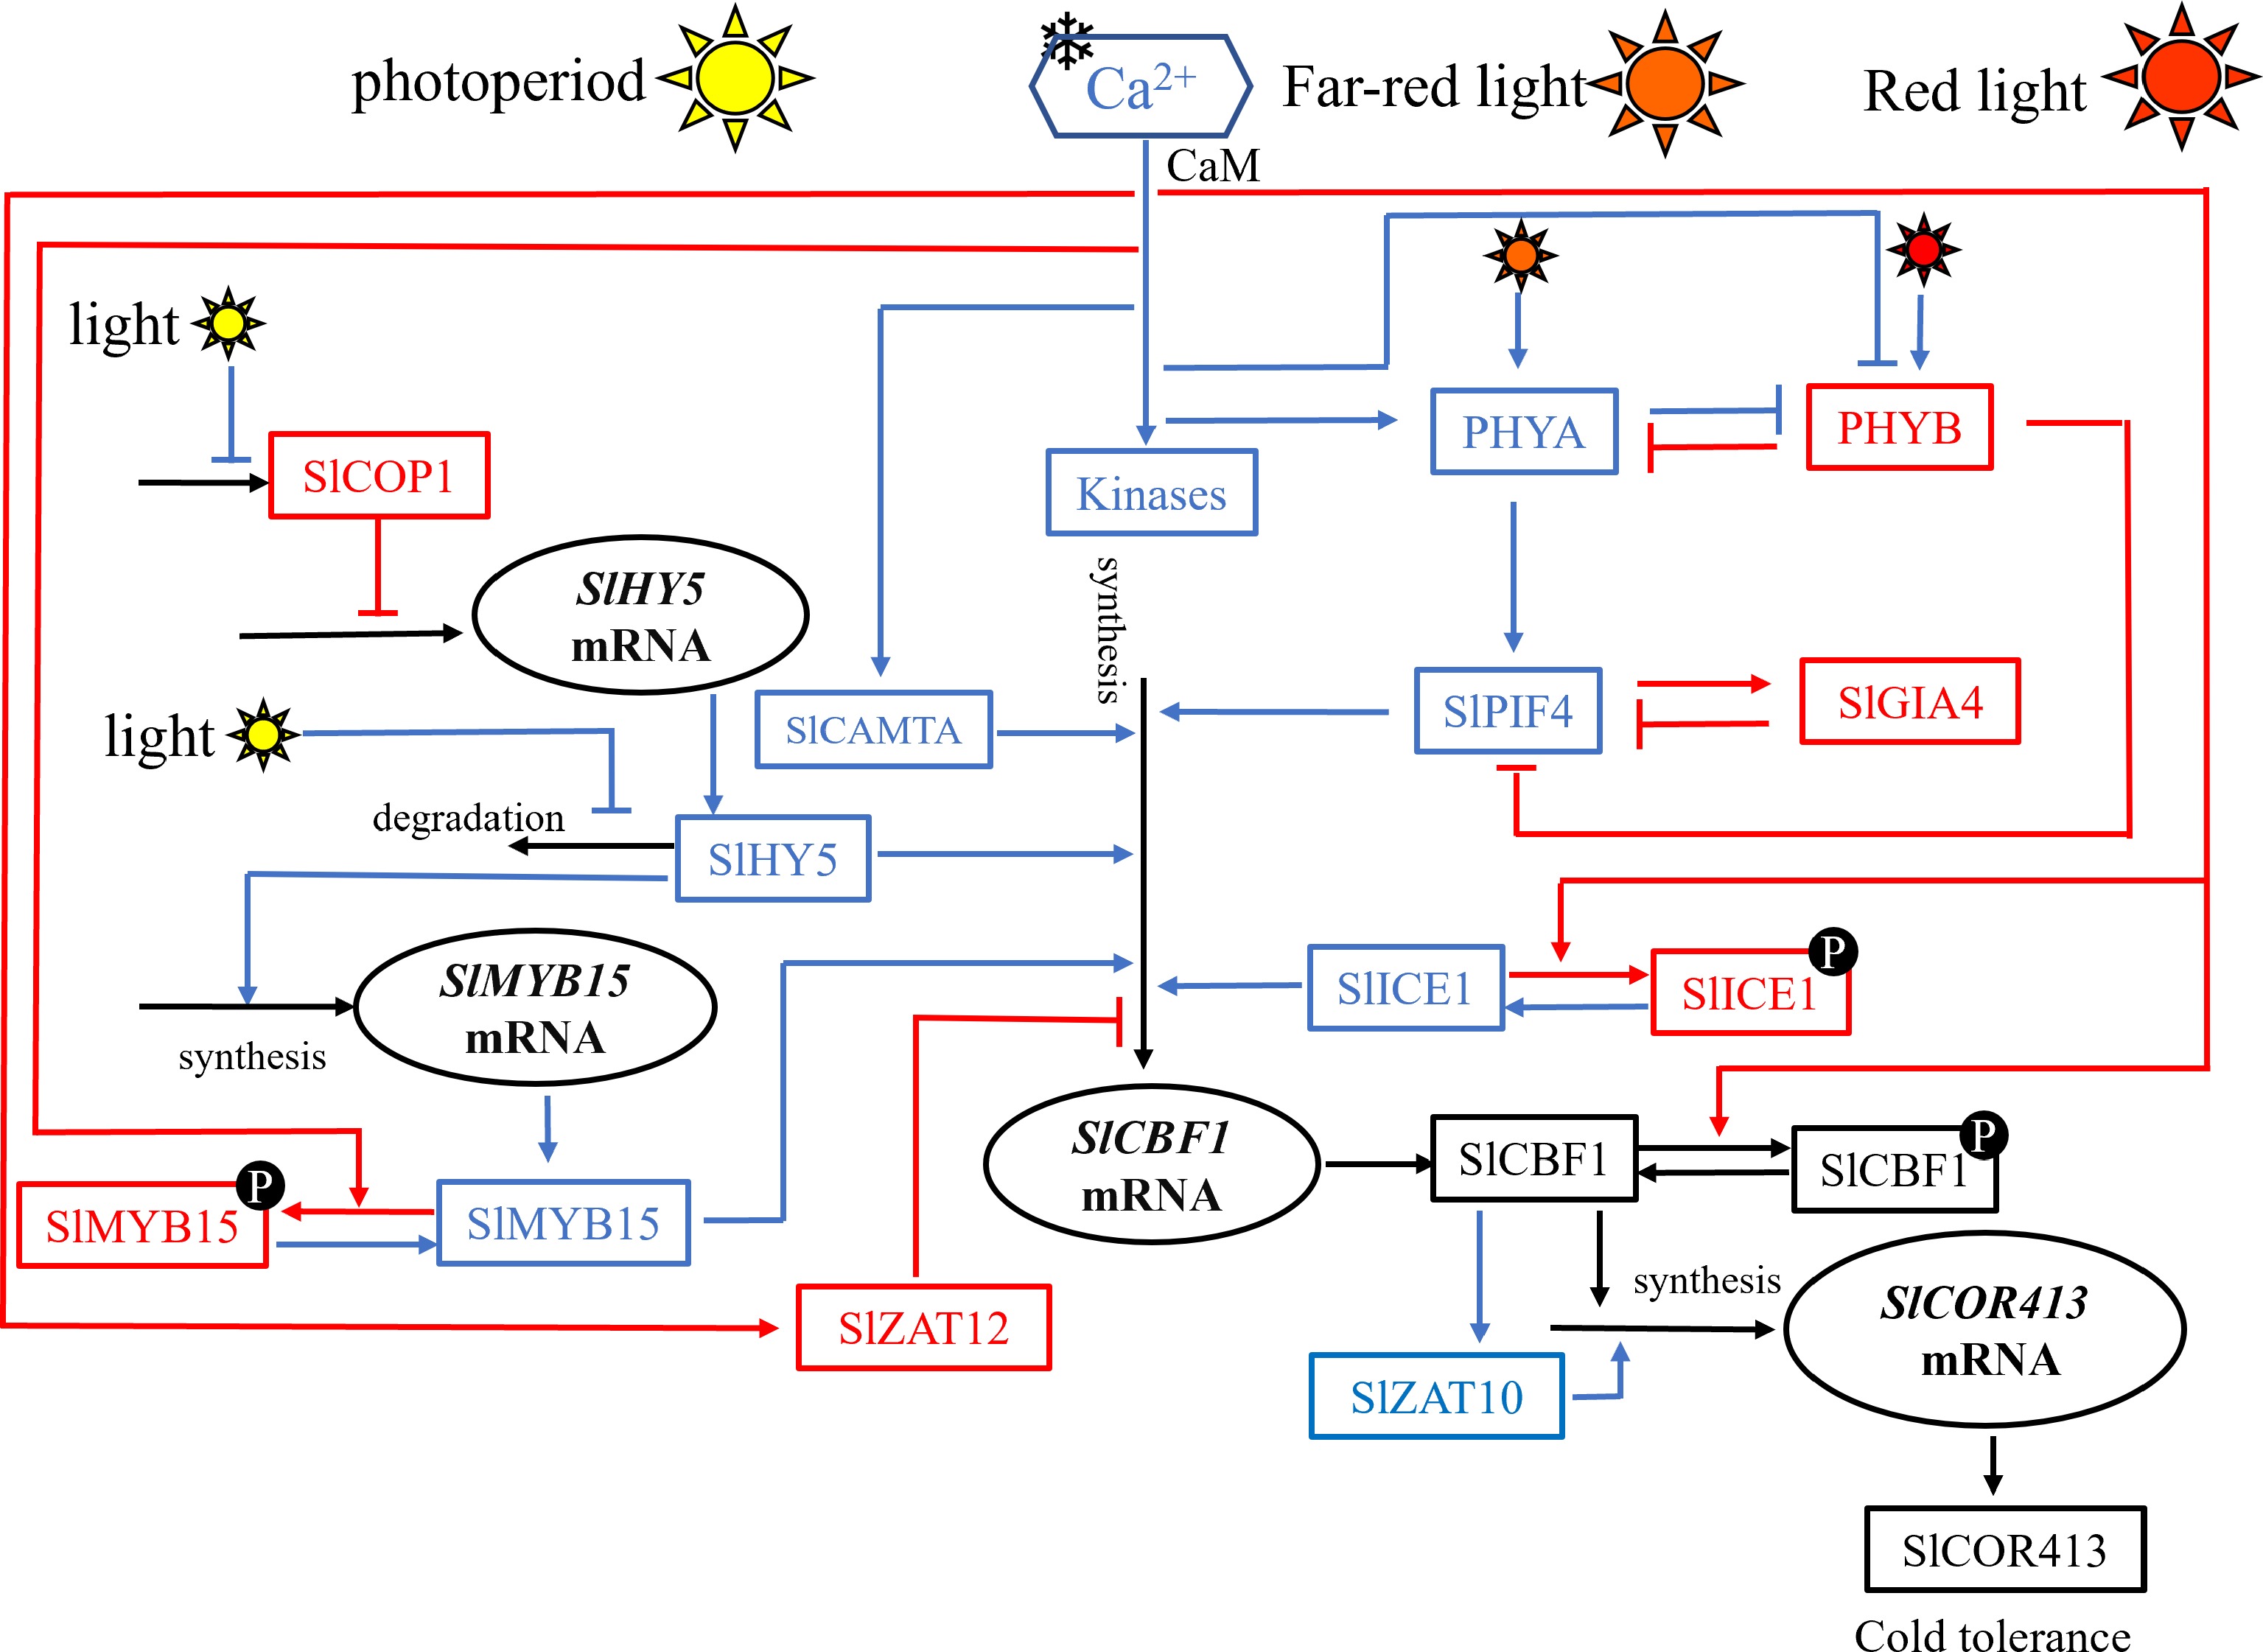
Figure 1.
Schematic model for light- and cold-responsive signaling transduction pathways in tomato. Signaling pathway were constructed only in light–dark cycles and red–far red (R:FR) light conditions. This pathway involves negative and positive regulators of the core genes—SlICE1, SlCBF1, and SlCOR413—which are linked with light-related genes and proteins. In order to clarify the regulatory relations in the network, the structure is artificially divided into four modules. The first module is COP1–HY5–MYB15, where HY5 acts as a light-influenced hub. Considering the role of light quality in the pathway, PHY–PIF4–GIA4 is proposed in the photochrome-dependent pathway. Upstream regulators (SlHY5, SlMYB15, SlPIF4, and SlCAMTA as activators and SlZAT12 as inhibitor) of CBF ultimately determine the expression profile of the cold-responsive components in the core ICE–CBF–COR module.
The molecular basis of chilling response differs between tomato and A. thaliana, leading to species-specific regulation within the cold signaling pathway. First, althoguh MYB15 acts as a repressor of CBF3 in the Arabidopsis-based H2025 model, it functions as an activator of SlCBF1 in tomato. Experimental evidence supports this role: Zhang et al. demonstrated through electrophoretic mobility shift assays (EMSAs) that SlMYB15 directly binds to SlCBF1 promoters in vitro[11], a finding later confirmed in vivo by chromatin immunoprecipitation coupled with quantitative polymerase chain reaction (ChIP-qPCR). Dual-luciferase assays also showed that SlMYB15 significantly activates SlCBF1's promoter activity under cold stress. Second, the regulation of CBF by ICE1 has been refined to reflect recent studies indicating that both phosphorylated and nonphosphorylated forms of ICE1 can bind to CBF promoters in both A. thaliana and tomato, as supported by genome-wide chromatin immunoprecipitation sequencing (ChIP-seq) data[24,25]. Third, to better integrate light and low-temperature signaling, the tomato model has been extended to include the COP1–HY5 regulatory axis and the PHY–PIF4–GIA4 module, capturing known photothermal crosstalk in cold acclimation. Figure 2 outlines the detailed procedure.
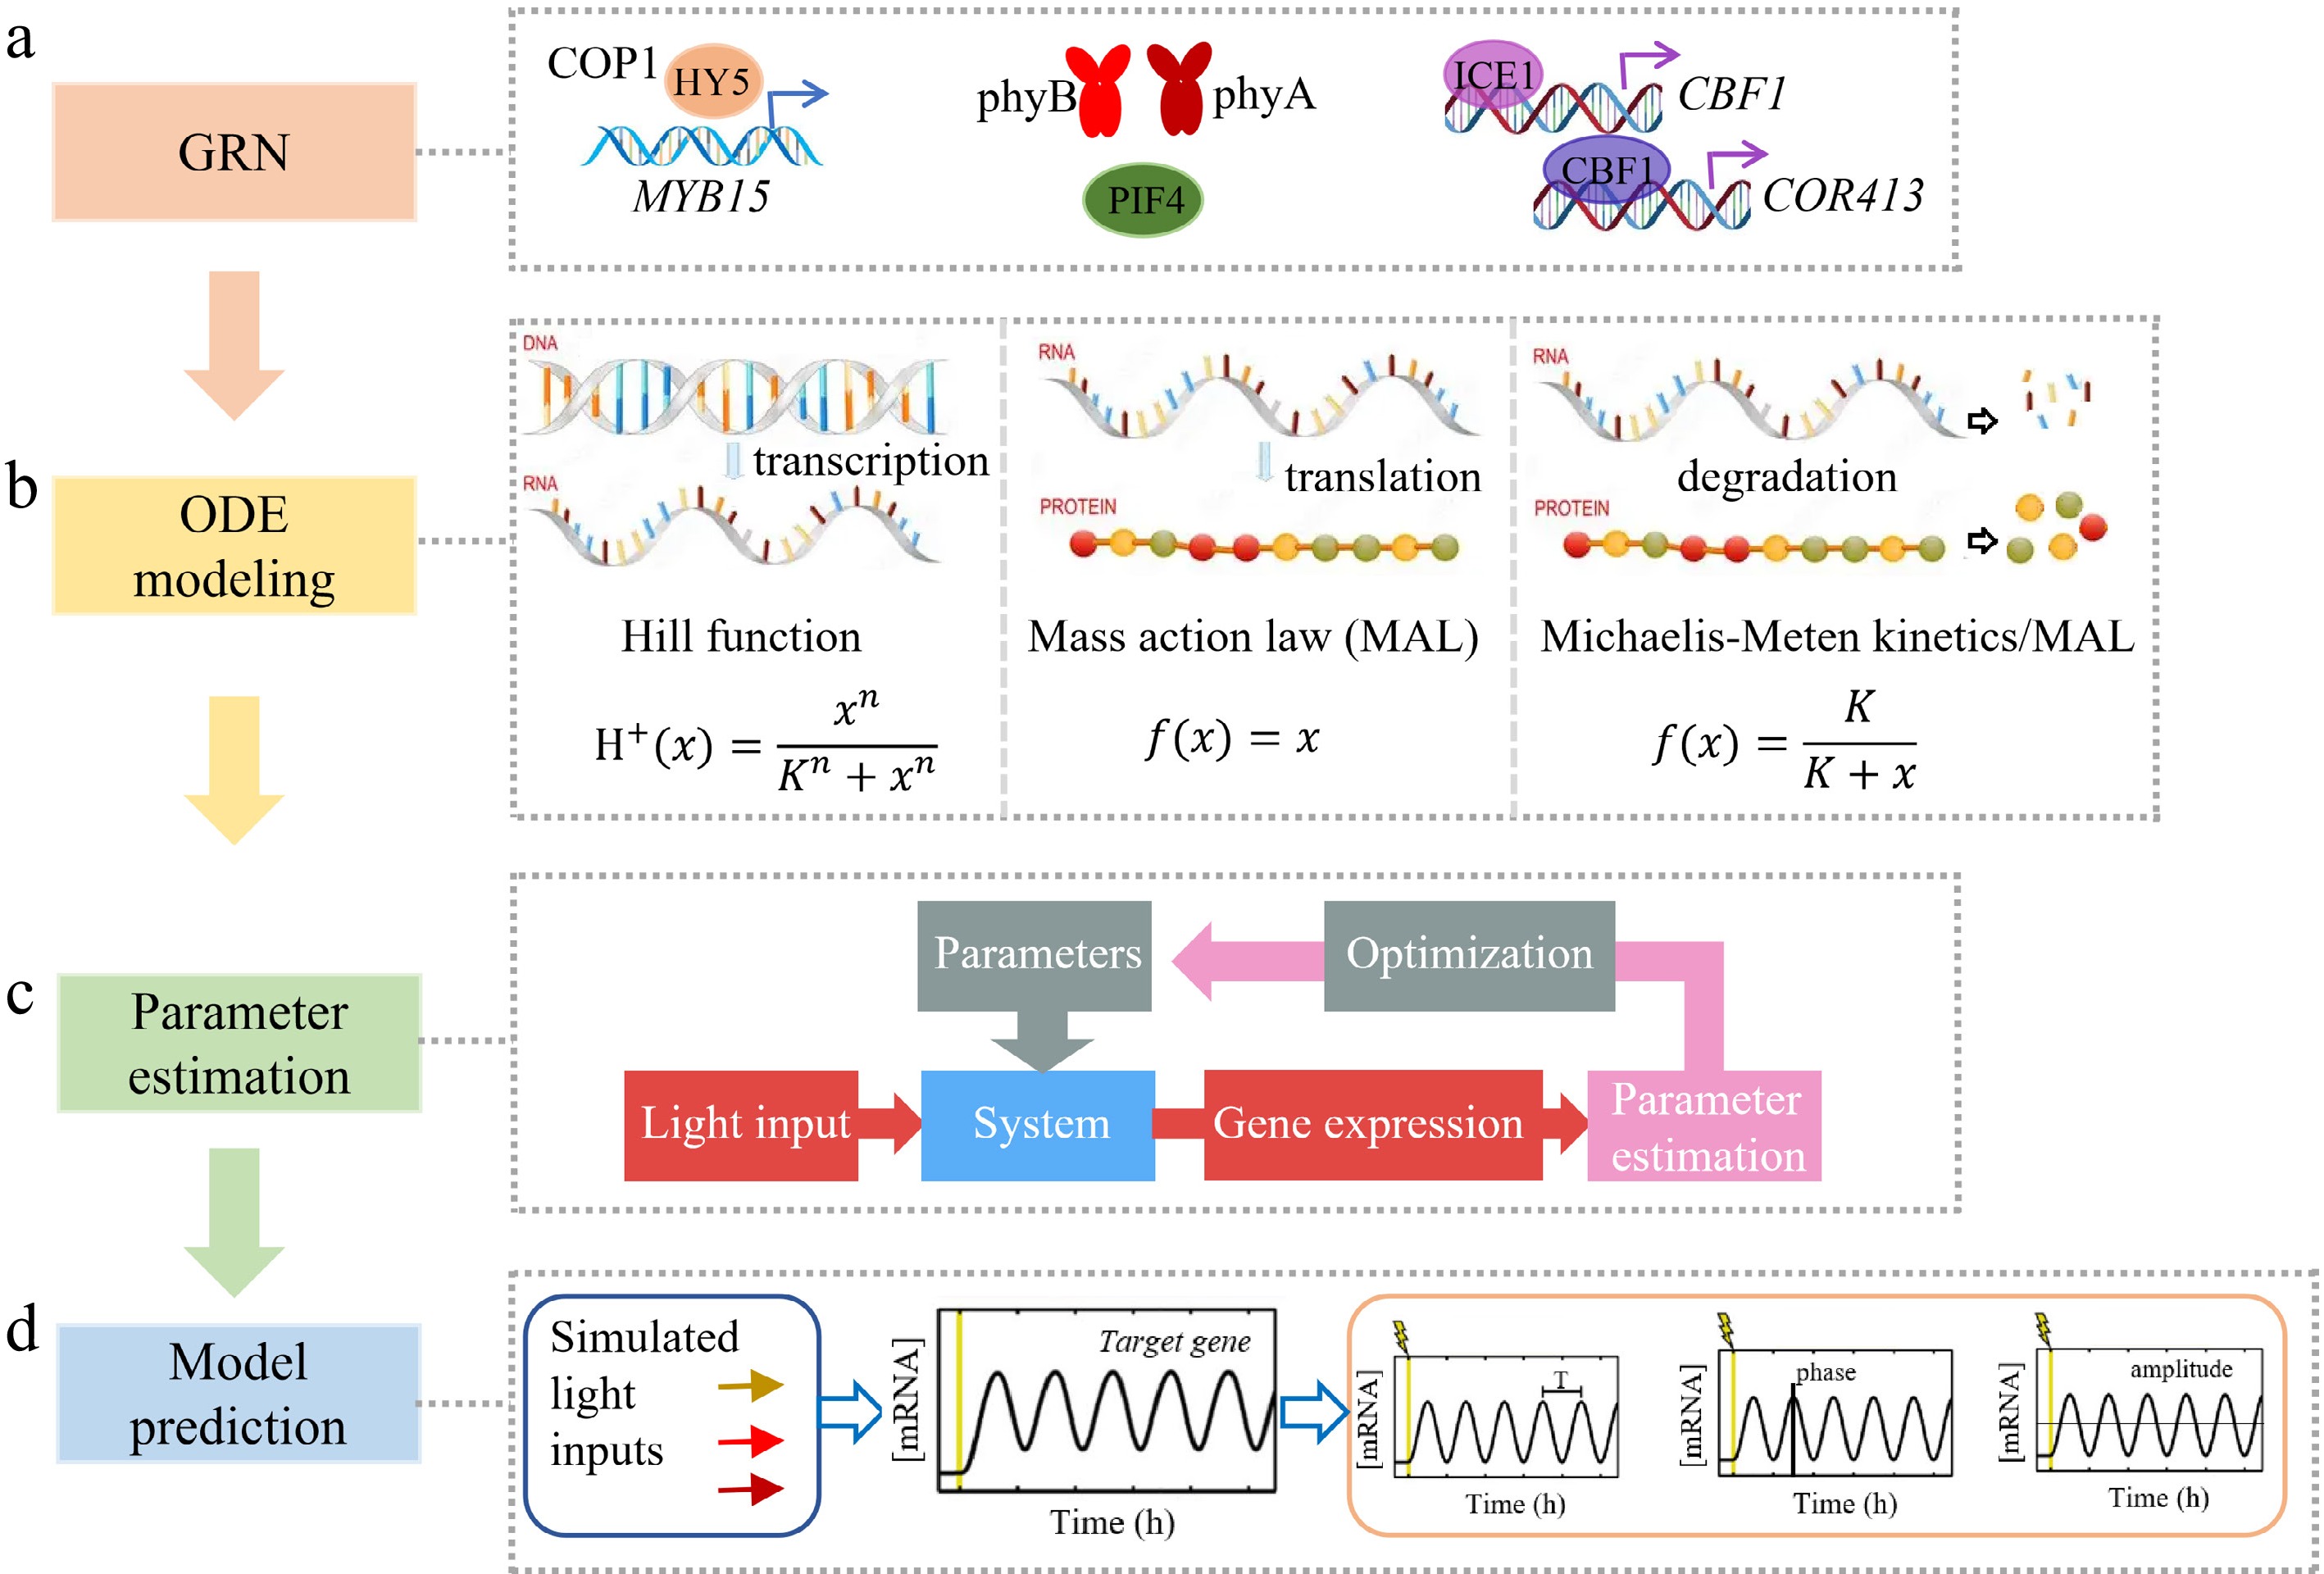
Figure 2.
Modeling and verification process of the integrated regulatory network for light and low temperature signals. (a) Construction of the gene regulatory network (GRN). A core GRN was assembled from molecular evidence, integrating key light- and cold-responsive components. The network includes phyA/phyB photoreceptors (inhibiting PIF4 and HY5), COP1-regulated SlMYB15 activation, ICE1-mediated induction of CBF1, and downstream regulation of COR413, establishing a mechanistic foundation for mathematical formulation. (b) The ODE model's formulation. Biological processes were translated into quantitative kinetic equations: Transcriptional regulation was modeled using Hill functions to capture transcription factors' (TFs') dose–response patterns. Translation was described by mass-action kinetics; protein degradation was followed Michaelis–Menten or first-order decay. These components were integrated into an ODE system for a dynamic analysis of signal integration. (c) Parameter estimation. Model parameters were optimized by minimizing the sum of squared errors between simulated and experimental expression data obtained under 12-h light–12-h dark photocycles at 4 °C, including SlHY5 (wild-type) and SlMYB15 (wild-type, hy5 mutant, and SlHY5-overexpression lines). Iterative least-squares fitting yielded a parameter set that accurately reproduces the observed dynamics. (d) Model prediction and experimental validation. Using the optimized parameters, the model was simulated under varied photoperiods. It successfully predicted the cycle length, phase, and amplitude changes of target genes, validating its capacity to simulate light–temperature signals' integration and providing a predictive tool for dissecting cold acclimation mechanisms under complex environmental scenarios.
To assess quantitative differences in dynamic behavior between the two models, we ran both the tomato model and the H2025 A. thaliana model under identical environmental inputs (constant light [LL] at 4 °C). The temporal expression dynamics of key cold-responsive genes were simulated and compared with experimental measurements across the two plant stress models (Supplementary Fig. S2). In the A. thaliana H2025 model, the simulated AtCBF3 transcript peaked at 1.87 h, compared with an experimental estimate of 3.19 h (Panel A). The simulated AtCOR15A levels gradually increased to a steady-state value of 2.63, mirroring the sustained upward trend observed experimentally (Panel B). For the tomato cold-acclimation model, the simulated SlCBF1 expression reached its maximum at 1.97 h, and the overall time course was consistent with the fluctuating experimental measurements (Panel C). The simulated SlCOR413 transcript abundance slowly approached a plateau at a steady-state value of 1.34 over the time course (Panel D). Overall, the model-derived kinetics, including peak timing and steady-state expression levels, showed better agreement with the experimental data for tomato than for Al thaliana, confirming that the constructed gene regulatory network models faithfully capture core cold-responsive transcriptional dynamics, with superior accuracy in the tomato system.
Simulation and experimental validation of gene expression in response to cold shock
-
On the basis of the expression data of SlHY5 and SlMYB15 across different genotypes[13], we first estimated the model parameters by minimizing the squared error between the simulated and experimentally measured relative expression values, obtaining an optimized parameter set (Supplementary Table S2). The simulation captured the induction of SlHY5's transcription after 3 h of cold exposure and its peak accumulation around 9 h under a 12-h photoperiod (Fig. 3a). Model-generated SlMYB15 dynamics showed the highest expression in SlHY5-overexpressing plants and the lowest in hy5 mutants, consistent with genotype-specific differences (Fig. 3b). These results confirm SlHY5 as an upstream transcriptional regulator of SlMYB15 during cold response. The model also accurately reproduced peak timing: SlMYB15 peaked at ~6 h and SlHY5 at 9–10 h after cold stress. As shown in Supplementary Table S3, the model exhibited high predictive accuracy for both training and validation datasets. The R2 values ranged from 0.836 to 0.918 for the training genes (SlHY5 and SlMYB15) and from 0.843 to 0.986 for the validation genes (SlCBF1 and SlCOR413), with correspondingly low RMSE values. These results confirm that the model simulations closely match the experimental observations across different genotypes and experimental conditions.
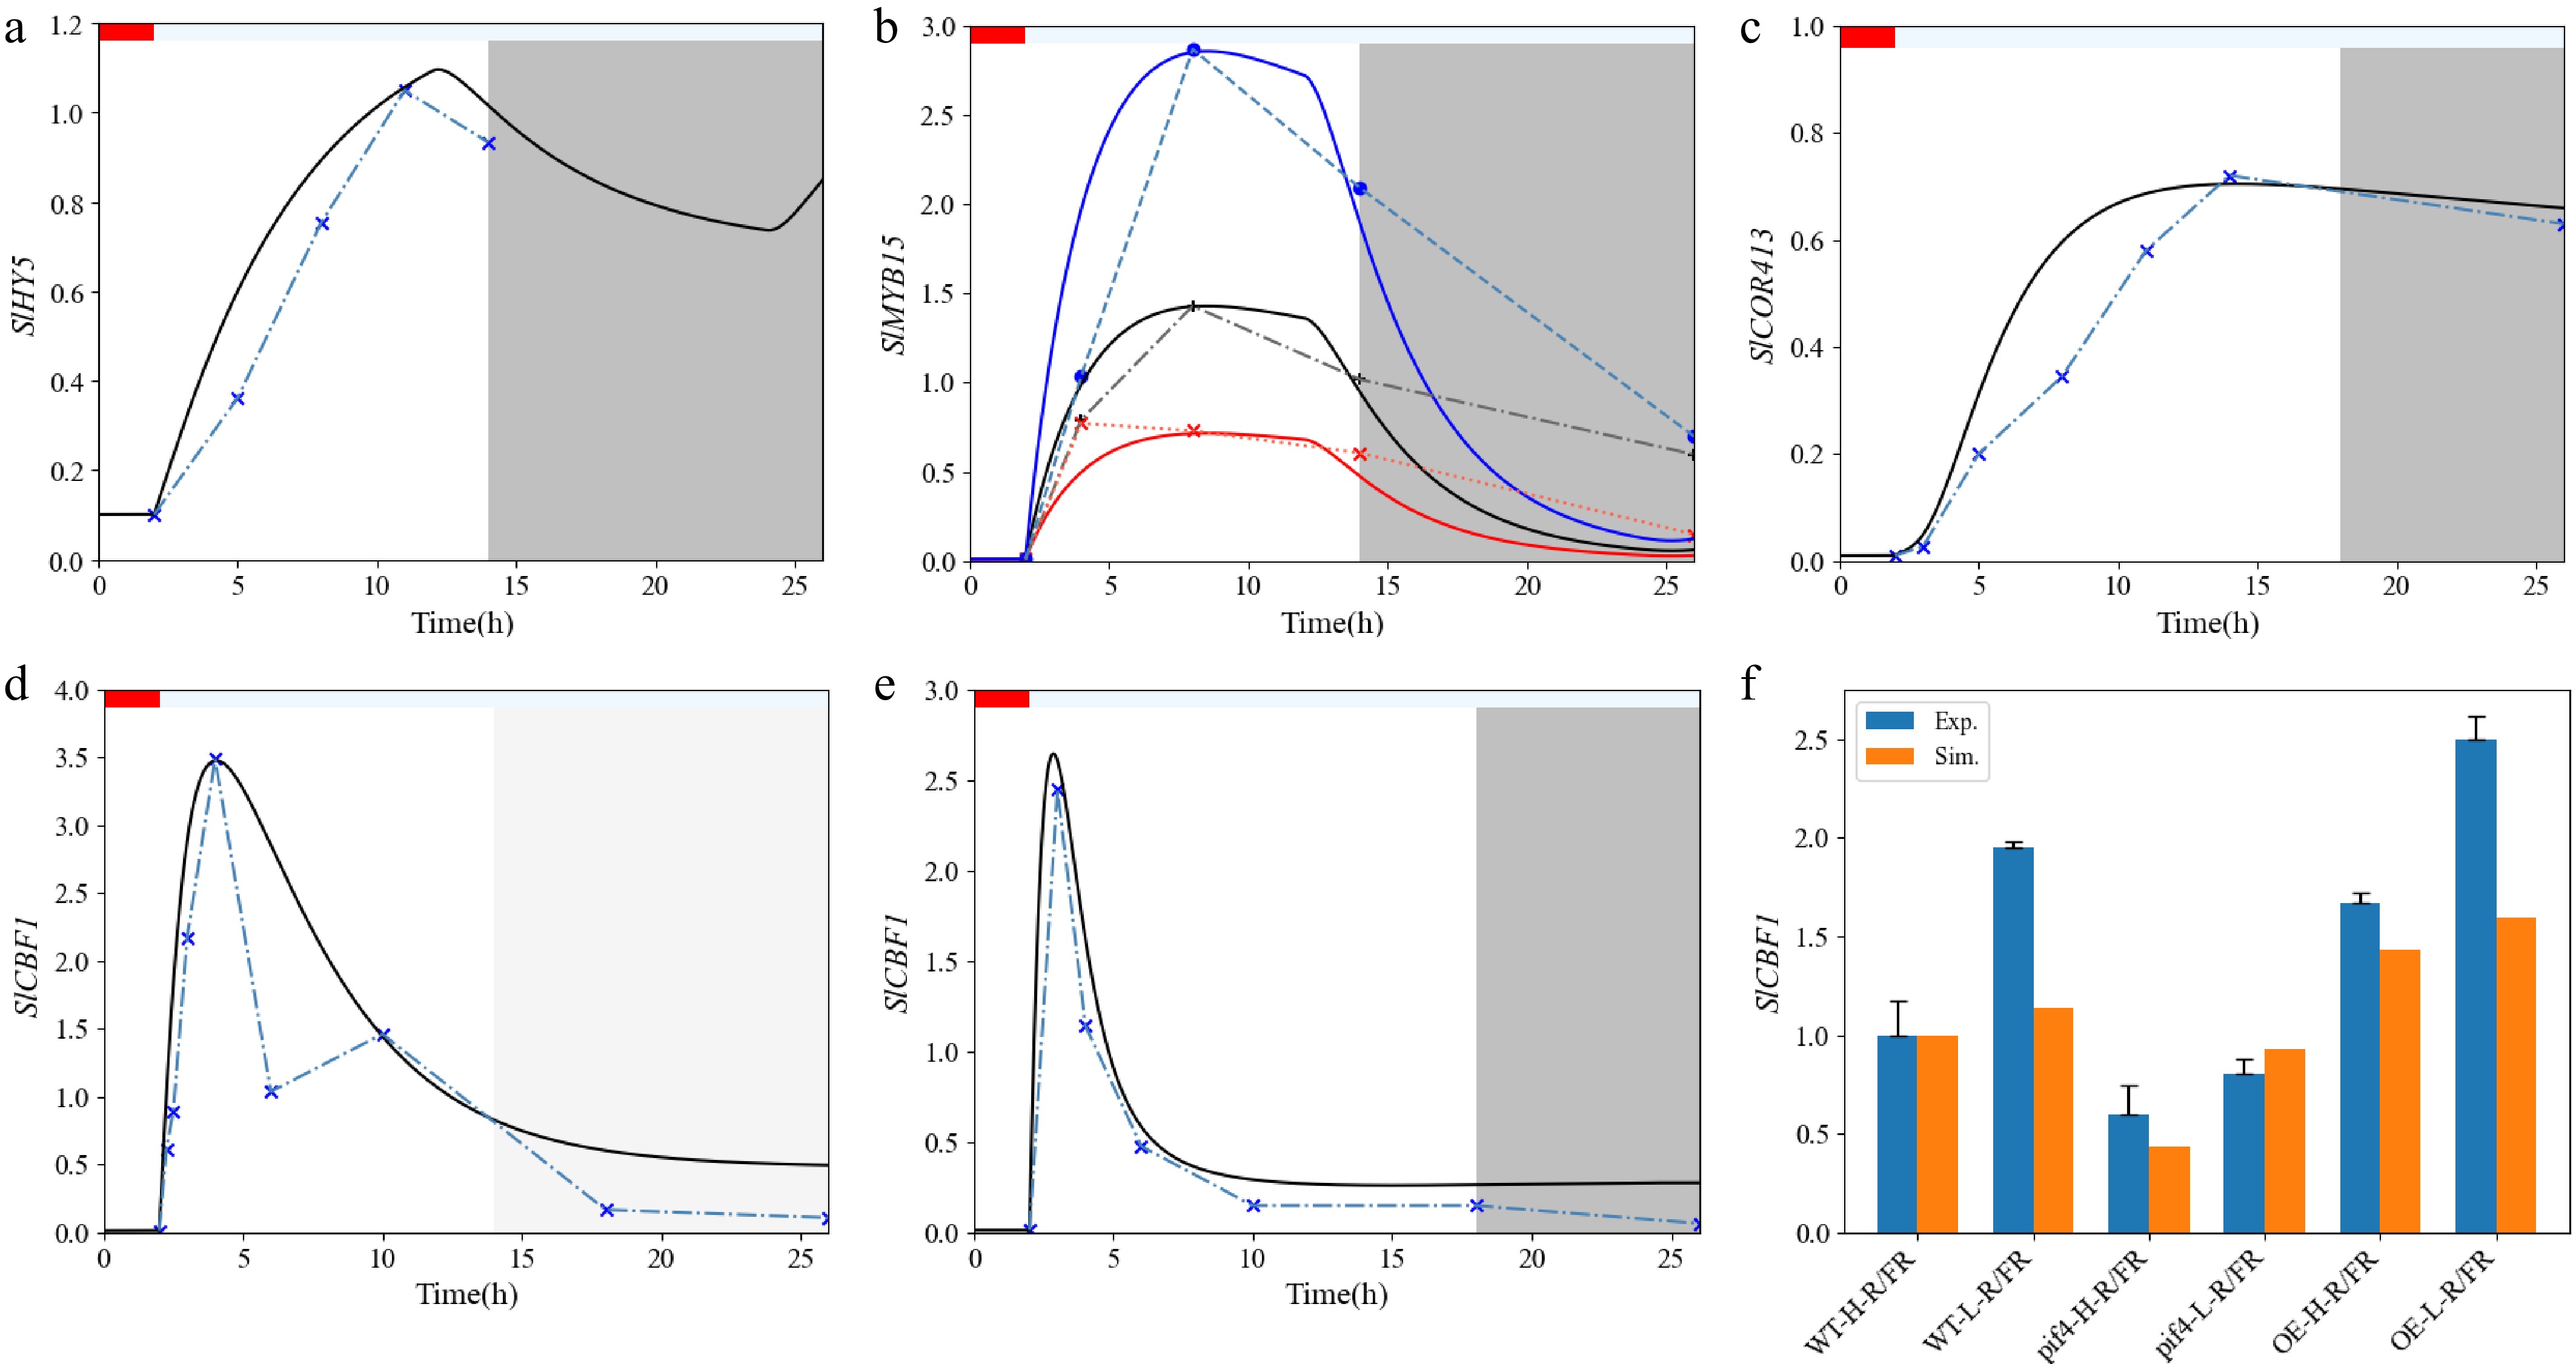
Figure 3.
Time series validation of the cold-related genes after cold shock. (a, b) The expression levels of SlHY5 and SlMYB15 for basic parameter estimation. (c–e) Model validation of SlCBF1 and SlCOR413 expression in under light–dark (LD) or in LL conditions. (f) Experimental and simulated SlCBF1 gene relative expression in tomato (wild-type [WT], pif4 mutant, and SlPIF4-overexpressing [OE]) plants after exposure to 4 °C under H-R:FR or L-R:FR conditions. Experimental data (blue crosses) were derived from Figure 6a in Wang et al.[14], from Figure 3b in Zhang et al.[13], from Figure 2a in Zhang et al.[12], and from Figure 2c in Wang et al.[29]. Black solid curves indicate the simulations, which were obtained by numerical integration of the kinetic equations (Eqs [1]–[24]), by the classical fourth-order Runge–Kutta method. The parameters are shown in Supplementary Table S2. The red and the blue bars represent warm and low temperature treatments, respectively.
To accurately simulate the low-temperature regulation of CBF and COR genes, the model must recapitulate cold-induced expression dynamics. Using the established framework, we simulated the SlCBF1 and SlCOR413 profiles under cold shock under light–dark (LD) and LL conditions (Fig. 3c–e). Upon a drop in temperature to 4 °C (t = 2 h), SlCBF1 rose rapidly under LD but more gradually under LL, whereas SlCOR413 increased steadily under both photoperiods. Additionally, the model reproduced low red/far red (R:FR)-induced upregulation of SlCBF1 and SlCOR413 in wild-type and SlPIF4-overexpressing plants, but not in pif4 mutants (Fig. 3f).
Simulations further showed that SlCBF1 transcription peaked about 1 h after cold onset under LD (1 h earlier than under LL) and declined after ZT10 to a stable level above the baseline, consistent with experimental observations of rapid, light-period-modulated SlCBF1 induction. The model also reproduced SlCOR413's expression dynamics, namely immediate cold-induced upregulation, a peak at ~12 h, and a gradual decline within 24 h, matching reported data[13]. Together, these simulations confirm that the tomato cold-acclimation model reliably predicts the photoperiod-dependent timing of SlCBF1's response and the sustained induction pattern of SlCOR413, validating its utility for dissecting light–temperature interplay in cold-responsive gene regulation.
To facilitate comparison of parameters between the two models, we screened 10 parameter pairs with large order-of-magnitude differences and conducted a parameter sensitivity analysis. As shown in the parameter sensitivity analysis (Supplementary Fig. S1), the model exhibited high sensitivity to certain parameters (particularly those related to transcriptional activation and protein synthesis), which could only maintain dynamic behavior within a narrow perturbation range to meet the criteria. In contrast, most other parameters had wider tolerance intervals, indicating that the model was generally insensitive to uncertainties in these parameters. This result clearly identifies the key regulatory nodes in the model that require precise experimental determination to ensure prediction accuracy.
Temperature, photoperiod, and light quality shape phytochromes' dynamics to modulate low R:FR-induced cold tolerance
-
Although Wang et al. reported the antagonistic roles of phyA and phyB in regulating cold tolerance in tomato[26], the dynamics of phytochrome activity and their direct interplay with CBF signaling at low temperatures remain unclear. In A. thaliana, recent studies have indicated that phyB enhances freezing tolerance through direct interaction with CBFs within a CBF–phyB–PIF regulatory module, where CBFs bind PIF3 to inhibit the co-degradation of PIF3 and phyB, thereby stabilizing phyB to promote stress-responsive gene expression[27,28].
In tomato, combined short-day (SD; 8 h) and low R:FR conditions optimally induce transcription of SlPHYA while suppressing SlPHYB, whereas light quality and photoperiod exert a minimal influence on SlCBF1's expression at 25 °C compared with cold acclimation[29]. To test these observations computationally, we simulated the phytochrome dynamics under varying R:FR ratios (γ = 0.5 for high R:FR, γ = 2.5 for low R:FR) and photoperiods defined by the light function L(t). Temperature transitions were modeled using a modified Plieth equation, decreasing gradually from 25 to 10 °C. Simulations confirmed that both at 25 and 10 °C, SD and low R:FR promote the accumulation of SlPHYA and reduce SlPHYB levels, with cold exposure further amplifying this trend, especially under SD and low R:FR conditions (Fig. 4).
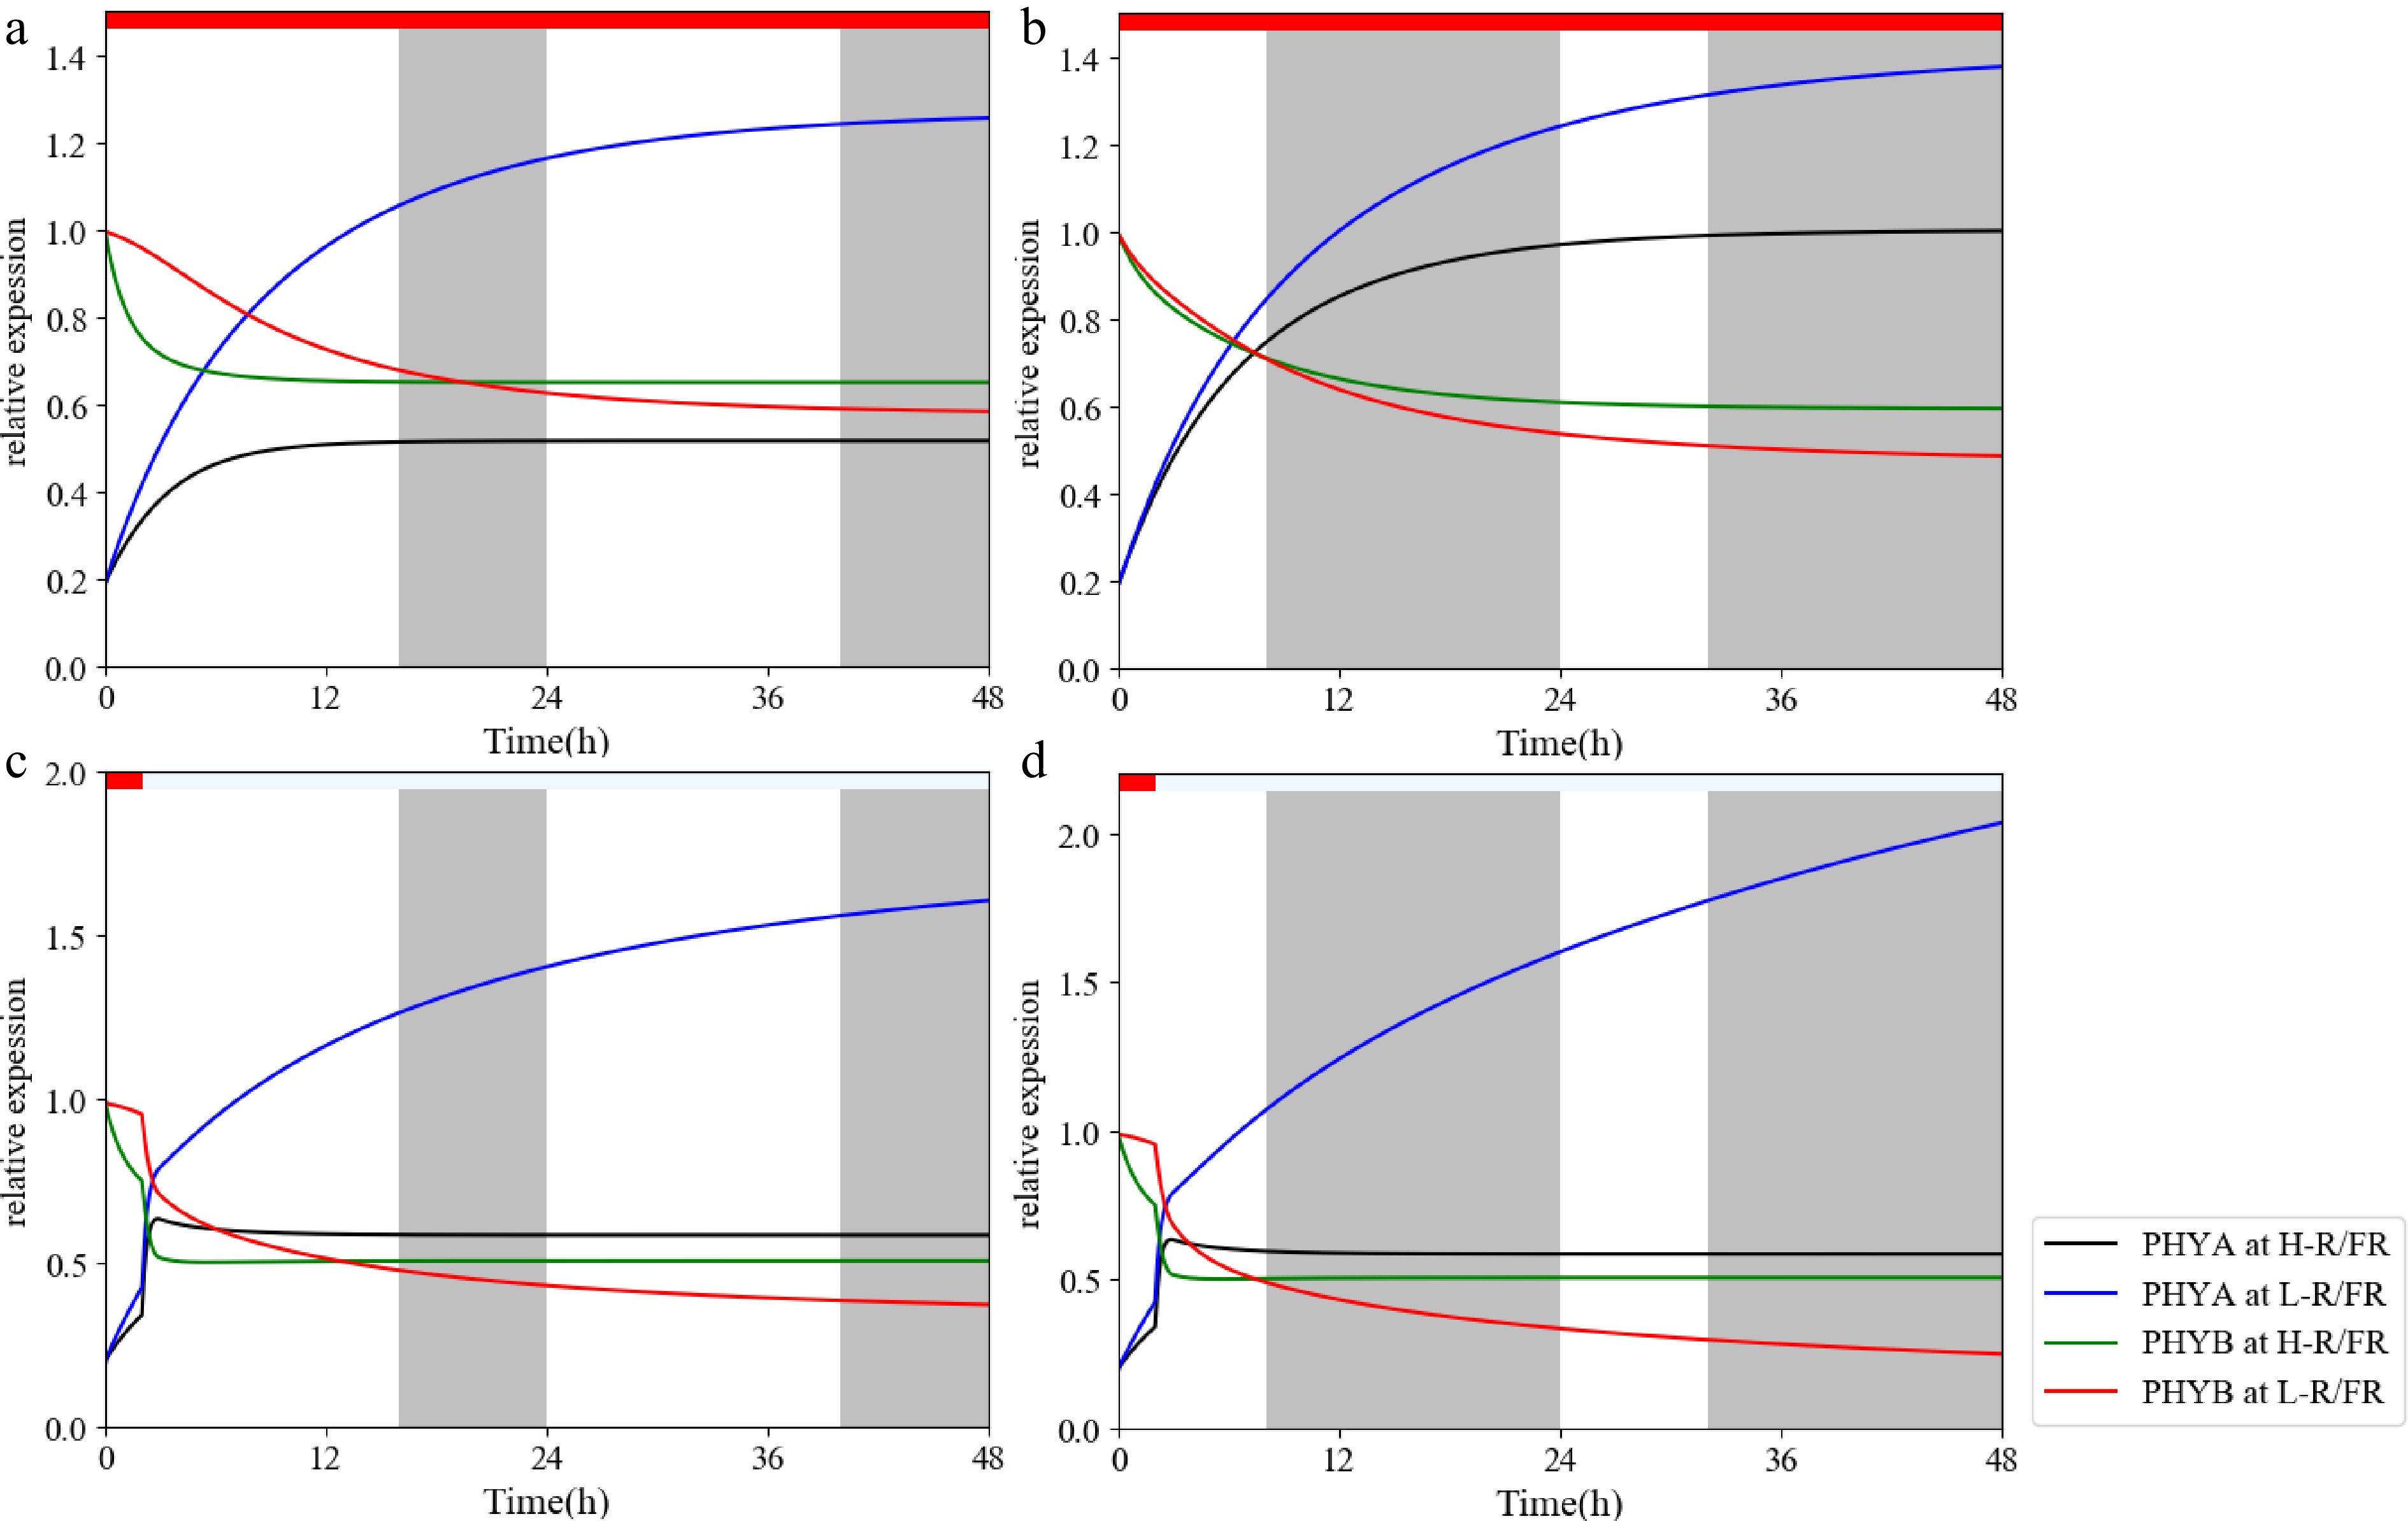
Figure 4.
Tomato phytochromes in response to variations in temperature, photoperiod, and light quality. (a–d) Accumulation of phytochrome proteins (SlPHYA; SlPHYB) as influenced by temperature, photoperiod and light quality in tomato plants. Plants were maintained at 25 or 10 °C under LD (16 h) or SD (8 h) conditions with a high R:FR ratio ($ \gamma =0.5 $) or a low R:FR ratio ($ \gamma =2.5 $). Numerical simulation was carried out with the light input function $ L(t) $, the cold signal input variable CaM, and the R:FR ratio $ \gamma $ in our mathematical model.
To assess phytochrome proteins' stability under cold stress, we simulated phyA and phyB levels using one- and two-compartment Ca2+ models (Supplementary Fig. S3), which are widely known[15,30,31]. Although both models predicted a slight post-cold decline in phyB before stabilization, phyA levels rose transiently and then settled at a steady state higher than that of phyB. These results align with experimental reports in A. thaliana, suggesting that cold treatment enhances phyA/phyB proteins' stability, thereby supporting improved cold tolerance.
Figure 5 further corroborates that SD and low R:FR collectively enhance cold tolerance in tomato. At 25 °C, neither photoperiod nor light quality substantially affected SlCBF1's transcription. In contrast, low temperature combined with SD and low R:FR strongly induced the expression of SlCBF1, with sustained cold leading to significantly higher steady-state SlCBF1 levels under SD/low R:FR than under long-day/high R:FR conditions.
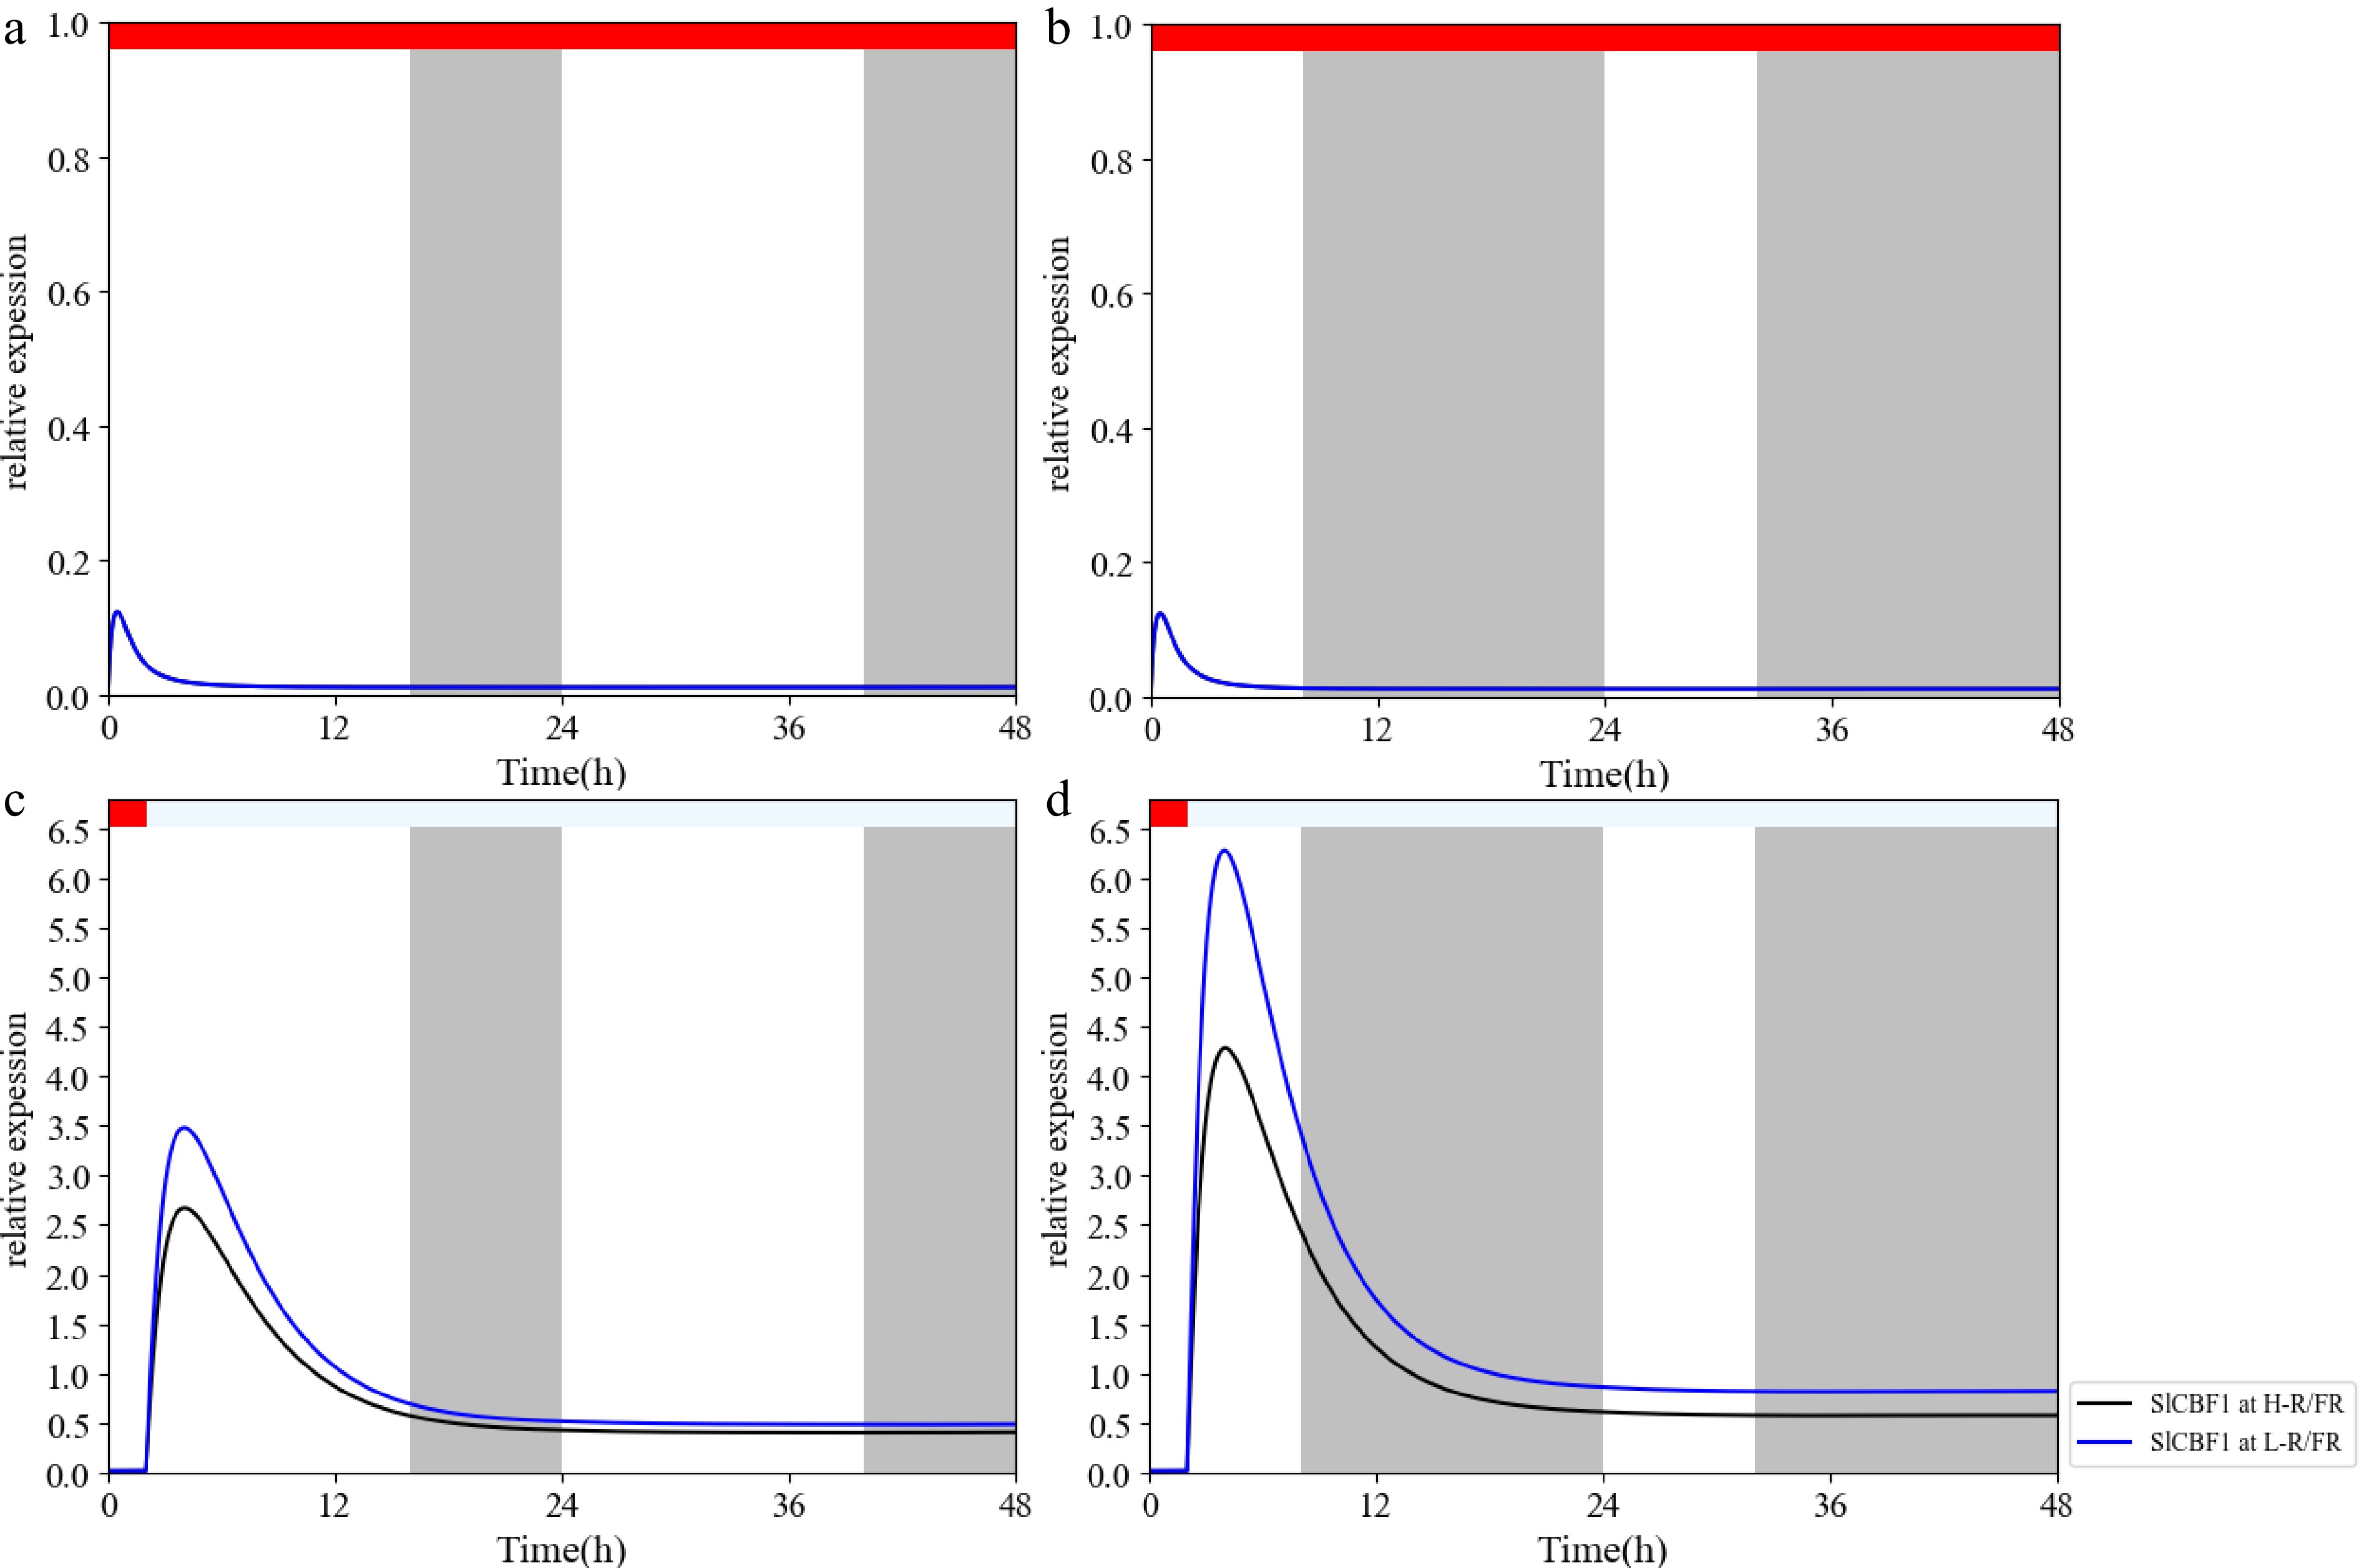
Figure 5.
Short-day (SD) and low R/FR-induced cold tolerance in tomato plants. (a–d) Transcripts of the cold-tolerant gene SlCBF1 as influenced by temperature, photoperiod, and light quality in tomato plants. Plants were maintained at 25 or 10 °C under LD (16 h) or SD (8 h) conditions with a high R:FR ratio ($ \gamma =0.5 $) or a low R:FR ratio ($ \gamma =2.5 $). Numerical simulation was carried out with the light input function $ L(t) $, the cold signal input variable CaM, and R:FR ratio $ \gamma $ in our mathematical model. Whereas light quality and photoperiod had little effect on the transcription of SlCBF1 in plants grown at 25 °C (see parts a and b), low temperature (10 °C) induced the transcription of SlCBF1, especially under SD and low R:FR conditions.
Oscillation of SlPIF4 is induced by the negative feedback loop of PIF4–GAI4
-
Through integrated modeling and experimental validation, we identified the PIF4–GAI4 negative feedback loop as the core mechanism driving the rhythmic expression of PIF4. Under a 12-h light:12-h dark photocycle, both experimental measurements and model simulations displayed closely matched diurnal oscillations of SlPIF4's transcript levels (Fig. 6a). After dawn, the expression of SlPIF4 rose rapidly and peaked near midday, then declined sharply after dusk to near-baseline levels, forming a stable periodic pattern. The simulated trajectory (black solid line) closely aligned with the experimental profile (blue dotted line and asterisks), confirming the model's accuracy in capturing this dynamic.
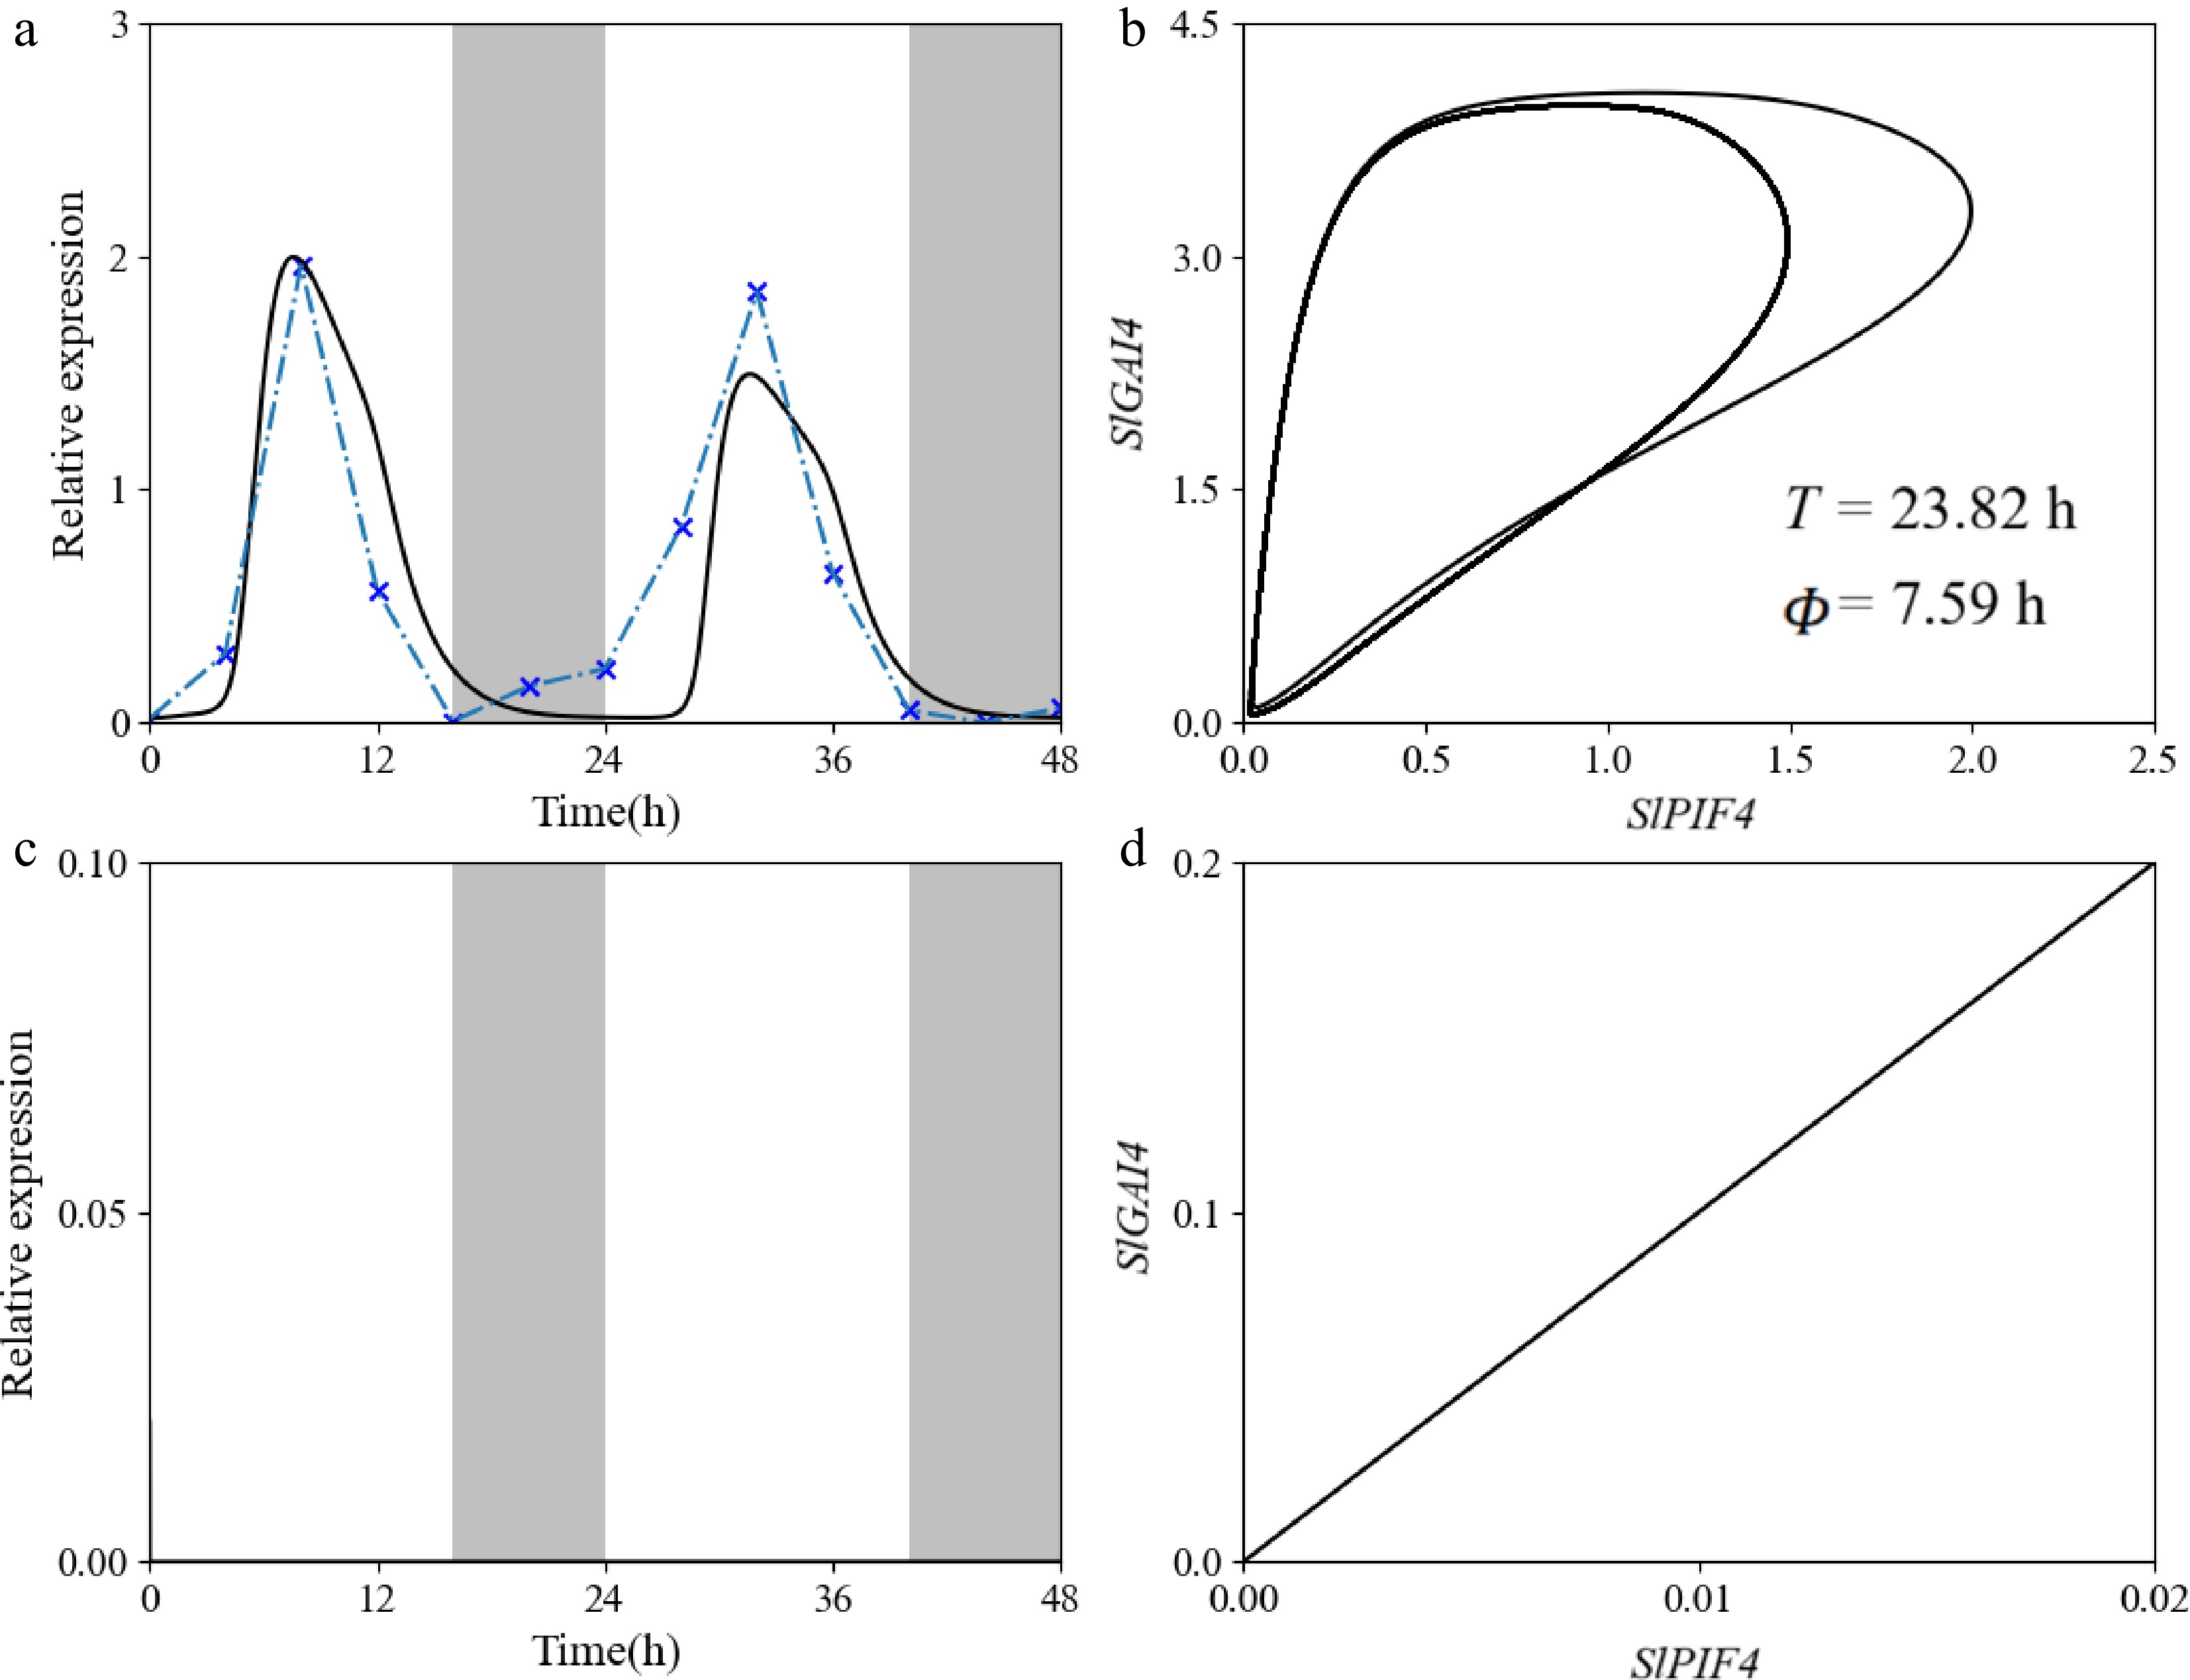
Figure 6.
The PIF4–GAI4 negative feedback loop regulates the oscillation of SlPIF4's expression. (a) Gray and white backgrounds denote dark (12 h) and light (12 h) periods, respectively. Blue dotted line with asterisks: Experimental relative expression of PIF4; black solid line: model simulation. (b) The closed orbit reflects a stable limit cycle generated by negative feedback between PIF4 mRNA and GAI4 protein, with a period of 23.82 h and a phase lag of 7.59 h. (c) When the negative feedback interaction is removed, the expression of PIF4 loses rhythmicity and remains near the baseline, failing to respond to light–dark transitions. (d) The system shifts from a closed orbit to a monotonically increasing linear path, indicating a transition from oscillatory to steady-state dynamics.
Phase-plane analysis of the dynamic relationship between SlPIF4 and SlGAI4 protein revealed a closed periodic orbit (Fig. 6b) with a period of 23.82 h and a phase delay of 7.59 h. This closed trajectory reflects the underlying regulatory logic: SlPIF4 activates the transcription and translation of SlGAI4, but increased SlGAI4 protein subsequently represses SlPIF4's expression. Degradation of GAI4 then releases this repression, allowing transcription of SlPIF4 to restart, thereby sustaining stable oscillations[32].
To test the functional necessity of this feedback loop, we removed the PIF4–GAI4 interaction from the model. In the absence of feedback, SlPIF4's expression lost all rhythmicity, remaining near zero throughout the light–dark cycle (Fig. 6c). The corresponding phase plot shifted from a closed orbit to a monotonically increasing linear path (Fig. 6d), indicating a transition from oscillatory to steady-state dynamics. These results directly demonstrate that the PIF4–GAI4 negative feedback circuit is essential for generating and maintaining rhythmic expression of SlPIF4; without it, the system fails to oscillate and exhibits only a simple, attenuated response.
Oscillation of SlCOR413 is induced by low temperature
-
COR genes are known to respond to cold stress, and their products play important roles in cold acclimation[33]. Enhanced chilling tolerance in transgenic lines is often associated with the induction of CBF and COR genes[33,34]. Fluctuating temperatures influence freezing tolerance, primarily through desensitization and resensitization mechanisms that involve the dynamic regulation of CBF's and COR's expression[35].
Beyond direct induction of cold-related genes, coupling between the circadian clock and cold response pathways may further support plants' growth and survival under low temperatures[36]. This raises the question of whether cold-related genes can generate self-sustained oscillations that enhance acclimation even in the absence of circadian input. To investigate this, we exposed tomato plants to repeated warm–cold cycles followed by continuous low temperature (4 °C) under a 12-h light/12-h dark photoperiod. We focused on SlCOR413's dynamics, modeled as driven by a sequence of Ca2+ pulses, and quantified its mRNA profiles under different warm–cold regimes: 1.5 h/1.5 h (Fig. 7a), 12 h/2 h (Fig. 7b), and 24 h/24 h (Fig. 7c).
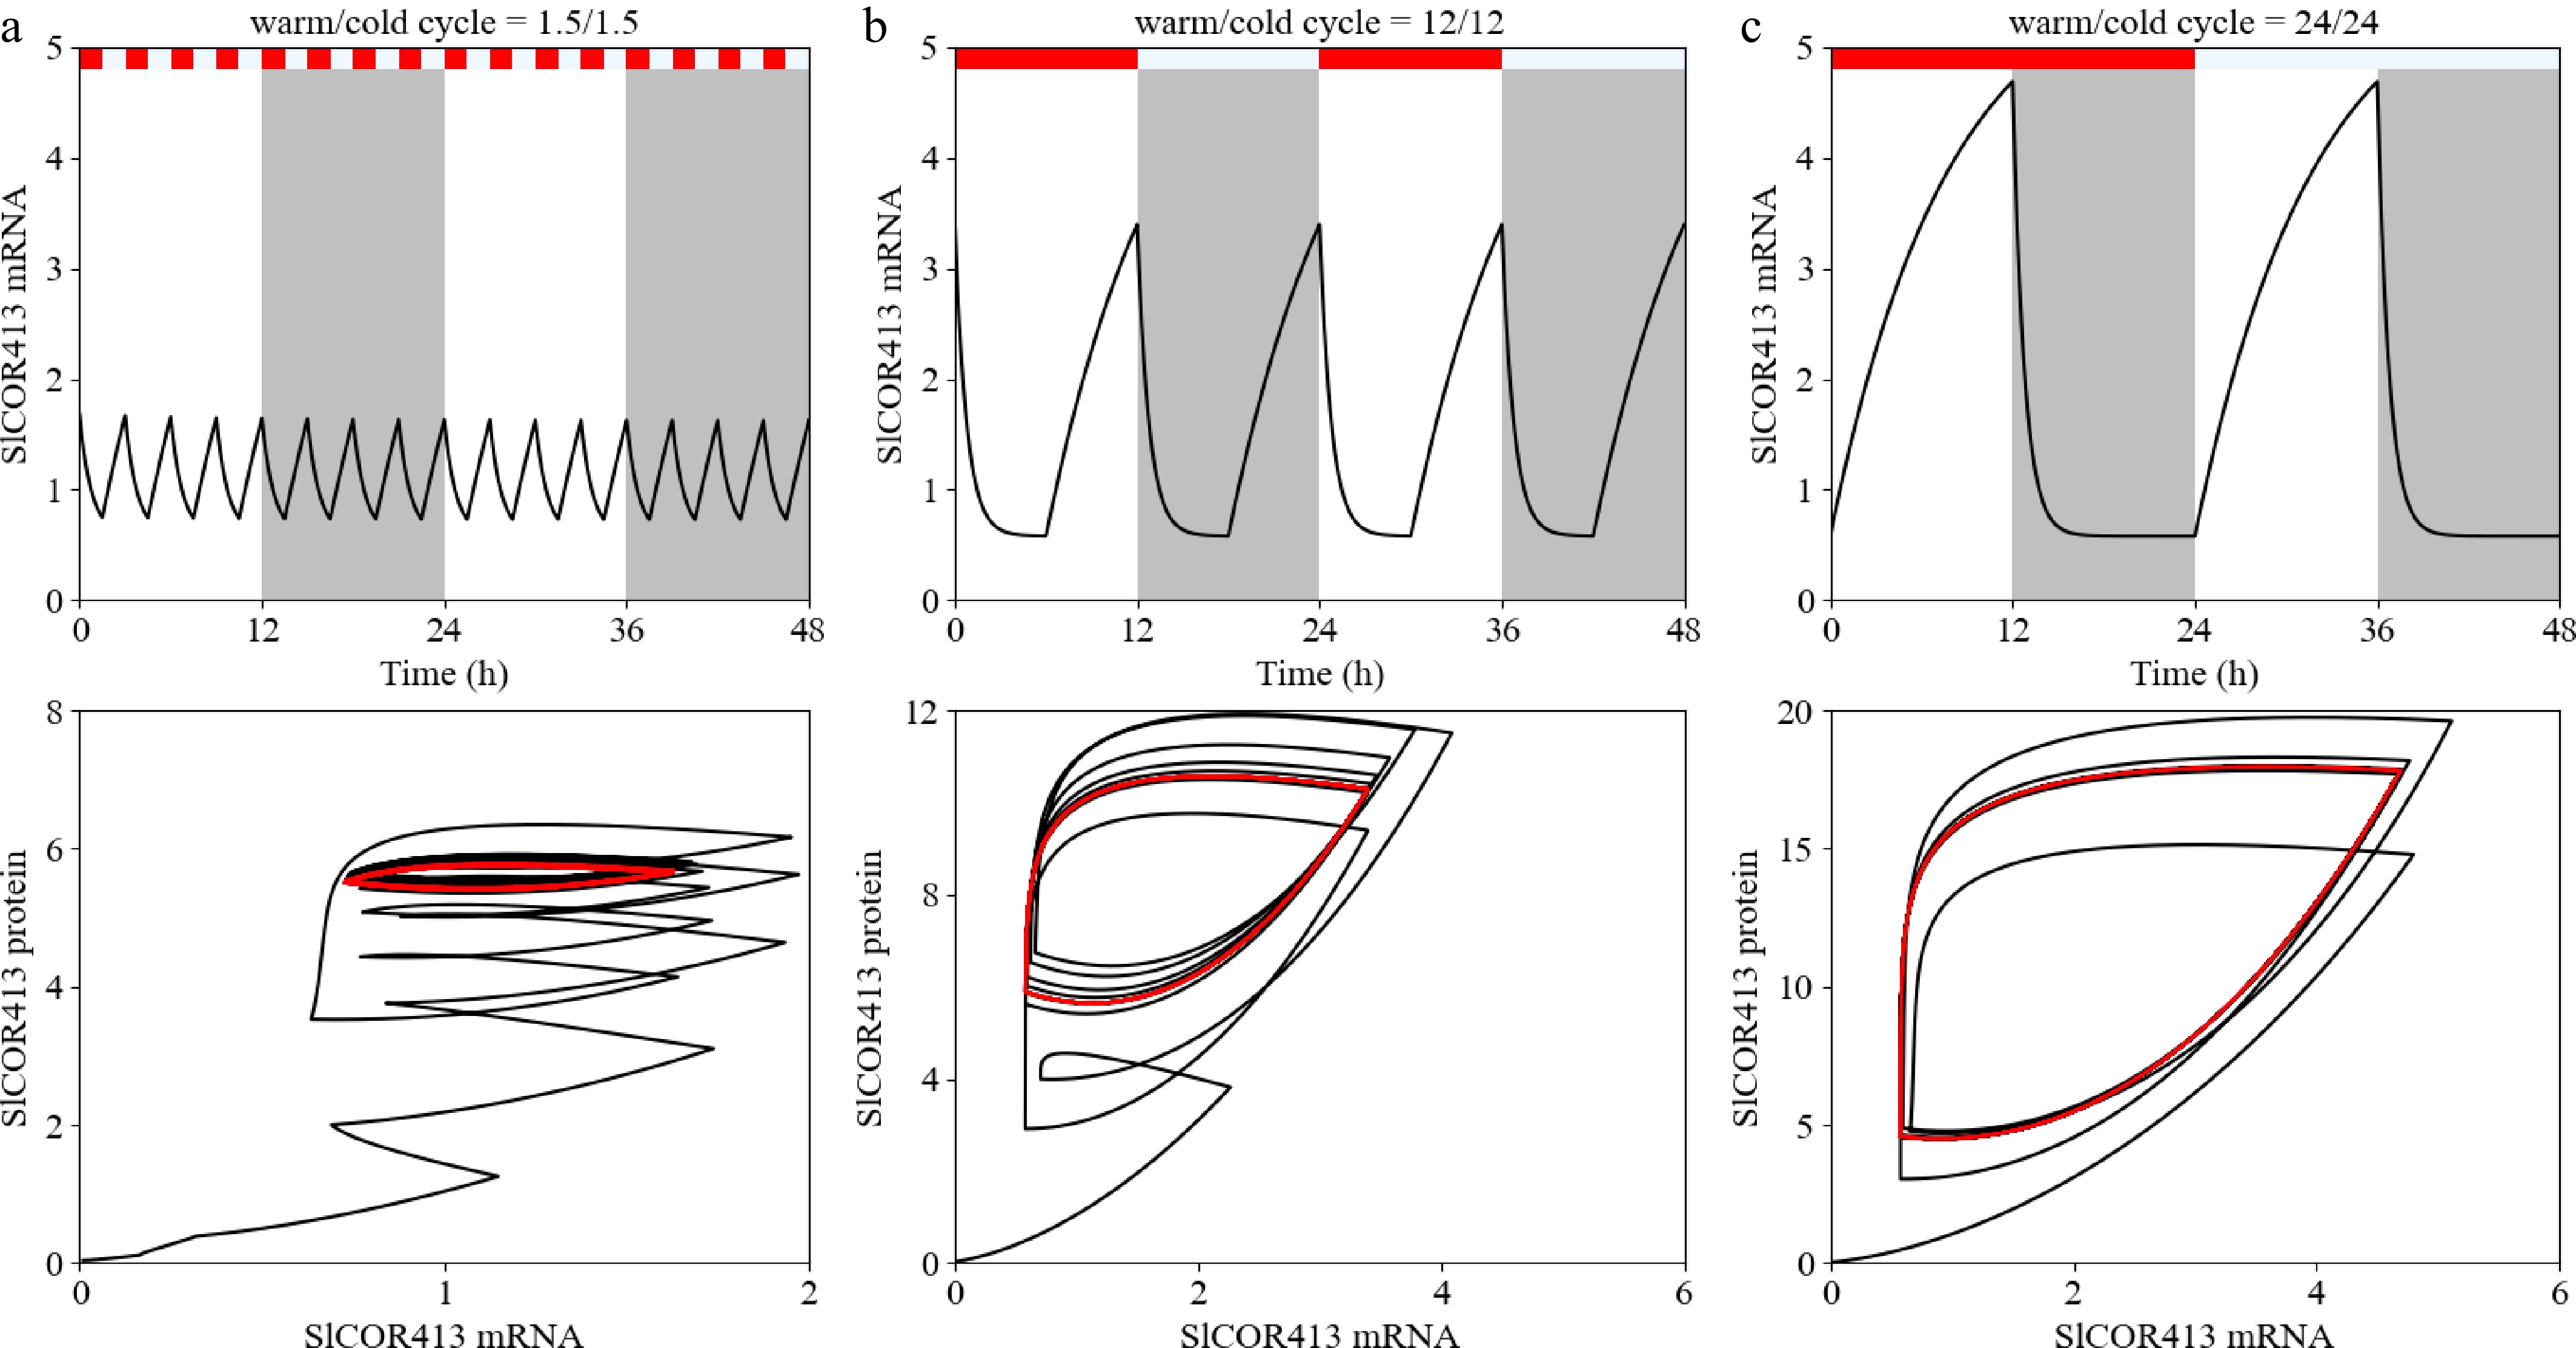
Figure 7.
Cold-induced oscillation of SlCOR413 in tomato plants. In order to investigate the oscillation of cold-related genes induced by low temperature, the dynamic behavior of plants subjectively simulated under continuous low temperature after five rounds of different cooling and warming cycles (warm:cold = 1.5:1.5 in Panel a; warm:cold = 12:12 in Panel b; warm:cold = 24:24 in Panel c).
Simulations showed that upon cessation of the temperature cycles, SlCOR413's transcript levels dropped to a steady state and then exhibited sustained, robust oscillations. The period and amplitude of these oscillations depended strongly on the duration of the preceding warm–cold cycles, with longer cycles resulting in higher amplitudes. Notably, under a 24 h/24 h regime, SlCOR413 mRNA displayed an intrinsic circadian-like rhythm with a period close to 24 h, indicating that temperature cycles alone can entrain a persistent oscillatory response in this cold-responsive gene.
The peak expression time of SlCOR413 exhibited a logarithmic increase with extension of the temperature cycle's duration (Supplementary Fig. S4). When the temperature cycle increased from 2 to 12 h, the peak time rapidly delayed from approximately 3 to 12 h; as the cycle extended further to 24 h, the rate of delay slowed down. The logarithmic fitting equation was
$ y=4.6269\ln (x)-1.5618 $ Meanwhile, the rhythmic period and amplitude of SlCOR413 showed an extremely strong linear positive correlation with the temperature cycle's duration (Supplementary Fig. S5), with the fitting equations
$ y=0.9349x+1.3136 $ $ y=0.0771x+1.0462 $ -
Plants perceive low temperatures and respond by integrating photoperiod, light quality, and thermal stimuli to ensure the correct induction of cold tolerance genes[37]. For nearly two decades, research has predominantly focused on dissecting the components and molecular mechanisms of the cold signaling pathway, particularly the CBF-dependent cascade[6,38,39]. However, the regulatory roles of phytochromes or cryptochromes in cold acclimation have received comparatively less attention. Recent work shows that PHYB is essential for the ability of trees to maintain growth under lower temperatures in permissive long days[40]. Most research was focused on A. thaliana, such as the reduced transcript levels of CBF and COR genes after exposure to blue light[41]. The TF SlWRKY2 was identified as a critical hub linking phytochrome-mediated light perception with cold stress adaptation in tomato[42]. Drawing on recent experimental data in tomato, we have refined the architecture of the cold and light signaling pathway and developed a mathematical model that demonstrates strong correspondence with a broad spectrum of both newly generated and previously published data. The model systematically recapitulates tomato's responses to diverse environmental perturbations and offers an integrated framework for understanding the cold-responsive gene regulatory network (Fig. 1).
The most significant advancement of our model relative to the the H2025 framework of A. thaliana lies in the explicit incorporation of light signals, both photoperiod and light quality, into the cold response system (Fig. 2). This integration is biologically meaningful because cold stress in natural environments rarely occurs in isolation; rather, it is accompanied by seasonal changes in daylength and light's spectral composition. Our simulations demonstrate that photoperiod profoundly modulates cold-induced gene expression, consistent with observations that cold tolerance varies across photoperiodic treatments[8]. Light signals, perceived through the phytochrome, cryptochrome, and phototropin photoreceptor families, are indispensable for cold acclimation[29]. By mimicking variations in daylength and photoreceptor activity, our model captures how plants coordinate multiple environmental cues to optimize cold tolerance—a feature that single-factor models cannot address.
The COP1–HY5–MYB15 module, incorporated as an upstream hub in our cold tolerance pathway, represents a mechanistically grounded innovation. Evidence indicates that the transcription levels of SlHY5 and SlCOP1 are strongly influenced by yjr photoperiod and light quality under low-temperature conditions[29]. HY5 has been shown to positively regulate the expression of MYB15 and CBF while co-regulating CBF-dependent cold tolerance with MYB15[11]. Our simulations confirm SlHY5 as an upstream transcriptional regulator of SlMYB15 during the cold response, and the model successfully reproduces the genotype-specific expression patterns observed in SlHY5-overexpressing and hy5 mutant plants. The functional divergence of MYB15 homologs across species was noted. AtMYB15 negatively regulates cold tolerance in A. thaliana[43], whereas SlMYB15 acts as a positive regulator in tomato[11], underscoring the importance of species-specific modeling and cautions against direct extrapolation of findings from A. thaliana to crop species. The COP1–HY5–MYB15 module, by accurately reflecting this positive regulatory role of SlMYB15, enriches our understanding of the molecular mechanisms underlying cold response in tomato and highlights the evolutionary plasticity of cold signaling networks.
To our knowledge, this study represents the first mathematical modeling effort to systematically examine how specific phytochromes regulate cold stress responses in tomato. By simulating time-series dynamics of photoreceptor proteins, we were able to monitor their behavior under varying environmental conditions. Our model successfully reproduces the experimentally observed increase in transcription of SlPHYA and the concomitant decrease in the transcription of SlPHYB in response to declining temperatures, shortened daylength, and reduced R:FR ratios, followed by elevated SlCBF1 expression and enhanced cold tolerance (Figs 3 and 4). These simulations suggest that mathematical modeling provides a robust approach for tracking phytochrome-dependent adaptive mechanisms that enable plants to cope with fluctuations in temperature, photoperiod, and light quality. The ability to predict phytochrome dynamics under multiple stress conditions represents a valuable tool for designing targeted experiments to validate specific regulatory nodes.
The PHY–PIF4 module, based on a proposed tomato cold-tolerance model integrating light and temperature signals[32], is a central structure of our network. In this module, low R:FR ratios and low temperatures act as positive factors inducing SlPIF4's expression, which, in turn, activates SlCBF1 and SlGIA4. However, the functional roles of PIF homologs vary considerably across plant species. In A. thaliana, PIF4 and PIF7 negatively regulate CBF transcription to prevent the unnecessary activation of cold acclimation pathways[44]. PIF3 directly represses the expression of CBF by binding to CBF promoters in a phyB-dependent manner (Jiang et al., 2017.10). PIF1, PIF4, and PIF5, which are destabilized under cold stress, negatively regulate freezing tolerance[28]. These interspecific differences caution against generalizing regulatory mechanisms across taxa and underscore the value of our tomato-specific model.
To better understand the regulatory logic governing the expression of SlCBF1, we summarized its known TFs, including its activators (SlICE1, SlHY5, SlMYB15, SlCAMTA, SlPIF4) and repressors (SlZAT). Though most of these factors have been discussed above, CAMTA and ZAT merit additional consideration. CAMTA proteins have been studied primarily for their roles in defense-related responses against pathogens and drought tolerance[45], but their involvement in cold stress responses remains incompletely understood. In A. thaliana, CAMTA proteins provide a positive link between Ca2+ signatures and cold acclimation[46]. We therefore incorporated the positive regulation of SlCBF1 by CAMTA in light of the precedent of A. thaliana, though direct experimental validation in tomato would strengthen this assumption. Regarding ZAT proteins, ZAT12 represses CBFs, whereas ZAT10 activates CORs[47]. Because zinc finger proteins are not core components of our network's architecture, we simplified the model by integrating ZAT12 and ZAT10 into a single variable. This simplification, though reducing the model's complexity, may obscure distinct regulatory roles and should be revisited if more detailed data become available.
The ICE1–CBF–COR module remains the central axis of the cold signaling network, with its components interacting cooperatively to induce cold resistance. The transcription levels of CBFs and CORs serve as quantitative markers of cold-responsive capacity. A series of activators and repressors positively or negatively regulate these genes, forming a complex cold signaling pathway. Cold tolerance in plants is a complex quantitative trait, typically occurring in response to combinations or successions of environmental stresses (Fig. 5). Therefore, the combined influences of multiple factors must be considered within a dynamic systems framework. Importantly, cold acclimation is not governed solely by the CBF-dependent pathway; CBF-independent pathways, including circadian clock regulation and hormone signaling, also exert significant influence[48]. The relative contributions of these parallel pathways to overall cold tolerance, and how they interact with the CBF core, remain open questions that our model can help address through further perturbation analyses.
A particularly intriguing finding from our modeling is the predicted oscillatory behavior of the expression of SlPIF4 (Fig. 6). Experimental data reveal a clear diurnal expression profile of SlPIF4 in leaves, with transcript levels exhibiting periodic oscillation. However, our baseline network, which incorporates light input and light quality signals but lacks an explicit circadian clock component, cannot generate sustained oscillations. To overcome this limitation, we appended a periodic sine function as a clock input signal to approximate the oscillatory dynamics. This approach, though functionally effective, represents a phenomenological rather than mechanistic treatment of circadian regulation. The circadian clock components ELF3 and TOC1 are known to regulate PIF4's expression. ELF3 represses mRNA levels of PIF4, and warm temperatures relieve this repression by inhibiting ELF3's binding to the PIF4 promoter, whereas TOC1 interacts with and suppresses PIF4[49]. Incorporating these clock components explicitly into future model iterations would provide a more mechanistically grounded representation of SlPIF4's oscillation and its coupling to cold signaling.
There are several intrinsic limitations to our modeling framework. First, the 80 parameters in our model were estimated from a relatively limited set of experimental data, which introduces uncertainty into certain predictions. Parameters' identifiability may be compromised by data sparsity, and some parameter values may not be uniquely determined. Future studies using more extensive time-series data under standardized conditions would improve parameter estimation and reduce the predictions' uncertainty. Second, the predicted oscillatory behavior of SlCOR413's transcript abundance (Fig. 7) has not yet been experimentally verified. Although our model generates this oscillation on the basis of the integrated regulatory structure, direct experimental confirmation through high-resolution time-series measurements under controlled conditions would substantially strengthen the robustness of this prediction.
Additionally, the comparability of datasets obtained under different experimental conditions deserves careful consideration. All tomato expression data used in this study were derived from experiments conducted under controlled environmental conditions with documented light and temperature regimes, which ensures a reasonable degree of reproducibility. Nevertheless, cross-dataset comparisons should be interpreted with caution, especially when experimental details such as photoperiod, cold treatment intensity, or tissue sampling time are not fully harmonized. The model is primarily designed to capture relative trends in cold-responsive genes' expression rather than to predict absolute expression values, so baseline differences between experiments have a relatively limited impact on the model's validation. However, future efforts to standardize experimental protocols across laboratories would greatly facilitate more rigorous model testing and cross-study comparisons.
-
In this study, our integrated computational model successfully recapitulates the dynamic crosstalk between light and cold signaling pathways in tomato, with experimental validation across distinct photoperiod regimes. Beyond reproducing documented gene expression patterns, the model generates testable predictions: Elevated CBF expression under low red/far-red light, the enhanced stability of phyA and phyB at low temperatures, and the oscillatory dynamics of SlPIF4 and SlCOR413 upon cold exposure. These findings identify phytochrome activity and the SlPIF4–SlGAI4 negative feedback loop as core regulatory hubs governing cold tolerance. This modeling framework serves as a predictive tool to dissect light–cold crosstalk, laying a rational foundation for engineering cold-tolerant horticultural varieties via targeted transcriptional manipulation. Future experimental validation of these predicted oscillatory kinetics will further improve the model's performance and expand its translational utility.
The authors gratefully acknowledge Prof. James Locke (University of Cambridge) and Dr. Ruqiang Zhang (Cornell University) for their valuable suggestions and constructive comments on our key results, which significantly enhanced the interpretation of this study.
-
Not applicable.
-
The authors confirm their contributions to the paper as follows: all authors contributed equally to this research work; study conception and design: Tao JP, Huang T; data collection: Hu ZH; analysis and interpretation of results: Chen C, Liu H, You X; draft manuscript preparation: Tao JP, Huang T, Xiong AS. All authors examined the findings and endorsed the final manuscript.
-
This study did not generate new experimental data. All data used in the analyses were obtained from previously published studies, which are cited in the manuscript. The original datasets are available from the corresponding authors of those studies upon reasonable request.
-
This work was supported by the Primary Research and Development Plan (Modern Agriculture) of Jiangsu Province (BE2023350) and the Priority Academic Program Development of Jiangsu Higher Education Institutions Project (PAPD).
-
The authors declare that they have no conflict of interest.
-
accompanies this paper online at https://doi.org/10.48130/els-0026-0007.
-
# Authors contributed equally: Jian-Ping Tao, Ting Huang
- Supplementary Table S1 Variables of the model for cold-light response pathway in tomato.
- Supplementary Table S2 Basic parameter values determined by long day (12L12D) and cold entrainment and parameter comparison between tomato model with Arabidopsis model (H2025).
- Supplementary Table S3 Goodness-of-fit indicators between experimental expressions and model simulations.
- Supplementary Fig. S1 Sensitivity analysis for the amplitude, phase and half peak-width of CBF mRNA exposed to cold stress under different plant stress models.
- Supplementary Fig. S2 Temporal dynamics of simulated versus experimental data under different plant stress models.
- Supplementary Fig. S3 Ca2+ signaling modes differentially shape phytochrome A/B homeostasis.
- Supplementary Fig. S4 The regression relationship between the domestication period and the peak expression time of the SlCOR413 gene under temperature cycles conditions.
- Supplementary Fig. S5 Linear regression of the temperature acclimation period with the expression period and amplitude of the SlCOR413 gene.
- Supplementary Text 1 Construction of the integrated light and cold signaling network.
- Supplementary Text 2 Period and phase calculation.
- Supplementary Text 3 Parameter estimation.
- Copyright © 2026 by the author(s). Engineering in Life Sciences published by Maximum Academic Press on behalf of John Wiley & Sons Ltd. This is an open access article under the terms of the Creative Commons Attribution License, which permits use, distribution and reproduction in any medium, provided the original work is properly cited.
-
About this article
Cite this article
Tao JP, Huang T, Hu ZH, Chen C, Liu H, et al. 2026. Integrative modeling of cold and light signaling in tomato: unraveling the transcriptional network governing cold acclimation. Engineering in Life Sciences 26: e007 doi: 10.48130/els-0026-0007 

Integrative modeling of cold and light signaling in tomato: unraveling the transcriptional network governing cold acclimation
- Received: 12 June 2026
- Revised: 10 July 2026
- Accepted: 21 July 2026
- Published online: 12 August 2026
Abstract: The integration of light and cold signaling is critical for cold acclimation in plants, but the regulatory complexity of the underlying transcriptional network remains poorly understood. To systematically dissect this interplay in tomato (Solanum lycopersicum), we constructed a computational model that merges the core cold-responsive inducer of CBF expression 1 (ICE1)–C-repeat binding factor (CBF)–cold regulated factors (COR) pathway with light-sensitive modules, including the constitutive photomorphogenic 1 (COP1)–elongated hypocotyl 5 (HY5)–MYB domain protein 15 (MYB15) cascade and the phytochrome–phytochrome interacting factor 4 (PIF4)–GA-INSENSITIVE 4 (GIA4) regulatory axis. Simulations successfully reproduced the experimentally observed gene expression dynamics across different photoperiods and revealed that phytochrome activity is co-modulated by both light quality and temperature. Our model predicts that a low red/far-red ratio enhances the expression of CBF, whereas cold treatment stabilizes phyA and phyB proteins, jointly promoting cold tolerance. Additionally, the PIF4–GAI4 negative feedback loop is shown to generate sustained oscillations in SlPIF4's expression, and the cold-responsive gene SlCOR413 is predicted to exhibit low-temperature-induced oscillatory behavior. This integrative framework provides a systems-level tool for dissecting light–cold crosstalk and offers a basis for rationally engineering cold tolerance in horticultural crops through targeted modulation of transcriptional networks.