












-
Bitter gourd (Momordica charantia L.) is a characteristic vegetable recognized as both a food and a medicinal material, rich in bioactive components such as charantin, polysaccharides, saponins, and vitamin C, which possess health-promoting effects including hypoglycemic, antioxidant, and immunomodulatory activities[1]. In recent years, the market scale of bitter gourd and its processed products has been expanding steadily, and its cultivation and processing play a significant role in promoting agricultural efficiency, increasing farmers' income, and facilitating rural revitalization[2]. However, during large-scale harvesting and postharvest circulation, the fruit surface is highly susceptible to external defects such as mechanical damage, lesions, deformities, and decay, caused by factors including climatic conditions, mechanical collisions, pest and disease infections, and storage and transportation environments. These defects not only directly degrade the appearance quality and commercial value of the fruit but also lead to a marked increase in postharvest loss rates, severely constraining the standardization and brand development of the bitter gourd industry[3,4]. Currently, although some production bases and processing enterprises have introduced automated inspection equipment, the detection accuracy of existing methods remains insufficient to meet the demands of actual production lines under the interference of dense tubercles and curved fruit shapes. Consequently, postharvest sorting still relies heavily on manual labor, which suffers from high labor intensity, low efficiency, and visual fatigue during prolonged operation, making it difficult to ensure the consistency and stability of sorting results[5,6]. Therefore, achieving rapid and accurate detection of external defects in bitter gourd is a fundamental prerequisite for automated postharvest sorting.
Early computer vision-based approaches relied on hand-crafted features, such as edge detection, color models, and texture descriptors. For instance, Leemans et al.[7] employed Mahalanobis distance to construct a color model for segmenting surface defects on apples. Blasco et al.[8] adopted region growing and merging algorithms to detect various defects in citrus peel. Lopez et al.[9] used the Sobel gradient operator to segment defect regions and extracted features including color moments and kurtosis for classification. The local binary pattern (LBP) proposed by Ojala et al.[10] provided a classic tool for texture analysis of fruit and vegetable surfaces. However, the densely distributed tubercles and ridges on bitter gourd surfaces exhibit high similarity in grayscale gradients to early-stage scratches and lesions, making it difficult for hand-crafted feature operators to stably capture genuine defect edges under such strong texture noise. Moreover, these methods are highly sensitive to variations in illumination and fruit pose, resulting in severely insufficient generalization capability, and thus face significant challenges when applied to bitter gourd defect detection.
To overcome the limitations of traditional hand-crafted features, researchers have introduced conventional machine learning methods into fruit and vegetable defect recognition. Moallem et al.[11] employed a multilayer perceptron and support vector machine to segment surface defects on apples. Arakeri et al.[12] adopted a three-layer feedforward neural network integrating color and texture features to discriminate tomato ripeness and defects. Sofu et al.[13] developed a real-time sorting system for apples using a C4.5 decision tree fused with multiple features. Mohi-Alden et al.[14] extracted color, texture, and geometric features from bell peppers and achieved five-class classification using a multilayer perceptron, with an online accuracy of 93.2%. However, the curved and elongated shape of bitter gourd fruits results in defects distributed across different curved surface regions, causing the global statistical features relied upon by these methods to fluctuate dramatically across different curved surfaces. Consequently, the models struggle to establish stable decision boundaries, and the transfer cost of feature engineering across different varieties remains extremely high.
The advent of deep learning has brought fundamental changes to fruit and vegetable quality inspection. Classification models, typified by CNNs, can automatically learn hierarchical features and have demonstrated excellent performance in quality inspection across a wide range of fruits and vegetables. Li et al.[15] achieved surface defect detection in fresh-cut cauliflower using MobileNet. Guo et al.[16] developed a lightweight CMNet based on MobileNetV2 with FPGA acceleration, enabling a low-cost mango inspection device. Ruan et al.[17] introduced the SE module to optimize CNN architecture, improving tomato quality grading accuracy. Valiente et al.[18] employed CNN for avocado defect recognition, achieving an accuracy of 93%. However, CNN-based classification models typically take as input a cropped image containing only a single object, and their output is a global class label for the entire image, essentially performing single-instance global category determination. In the practical scenario of bitter gourd quality inspection, an image often contains multiple fruits that may exhibit different quality conditions, such as one healthy fruit, another with surface damage, and a third with morphological deformity. Faced with such multi-instance images, a classification model can only output a single global label and is incapable of performing independent quality assessment for each individual fruit. The fundamental limitation stems from the architectural design of classification models, which inherently lack instance-level perception and localization capabilities. To further extend detection techniques to application scenarios such as postharvest sorting, it becomes imperative to introduce object detection models that can simultaneously accomplish multi-instance localization and quality status determination.
Among existing object detection frameworks, there are two main types: two-stage and one-stage detectors. Two-stage detectors, such as Faster R-CNN, first generate region proposals and then perform classification and regression, achieving high detection accuracy in agricultural defect detection[19]. Liu et al.[20] applied an improved Faster R-CNN to potato sprout and surface damage detection, achieving a mean average precision of 92.94%. Wei et al.[21] applied it to cherry surface defect detection. Gong et al.[22] achieved high-precision detection of apple leaf diseases. Alruwaili et al.[23] proposed a lightweight Faster R-CNN for real-time detection of tomato leaf diseases. However, two-stage models have complex structures and slow inference speeds, making Faster R-CNN difficult to meet real-time requirements. One-stage detectors, which achieve a favorable balance between speed and accuracy, have become a research hotspot in this field in recent years[24]. For instance, Hou et al.[25] applied an improved YOLOv5n to pepper disease detection, achieving a mean average precision of 89.2%. The SEDCN-YOLOv8 proposed by Xie et al.[26] achieved a mean average precision of 75.1% for cucumber leaf pests and diseases. The YOLO-SBWL model proposed by Che et al.[27] achieved high detection accuracy for maize seed variety and defect identification. The YOLO-RGDD model proposed by Liang et al.[28] achieved a mean average precision of 88.5% for tomato surface defect detection. The improved YOLOv5s proposed by Li et al.[29] achieved a mean average precision of 85.1% for potato external defect detection. YOLOPears proposed by Chen et al.[30] achieved a mean average precision of 73.20% for pear surface defect detection. Despite the significant progress made by the YOLO series, its detection framework, which relies on anchor boxes and non-maximum suppression (NMS), still suffers from inherent limitations in end-to-end optimization. For highly non-uniform targets such as bitter gourd, the preset anchor box sizes are difficult to adapt to annotation boxes that undergo substantial deformation under different degrees of curvature. Moreover, in dense defect scenarios where multiple prediction boxes highly overlap, the NMS post-processing step is prone to incorrectly filtering out correct overlapping predictions.
In recent years, the Transformer architecture has demonstrated strong potential in the field of object detection, giving rise to a range of high-performance end-to-end detection models. Among them, RT-DETR, proposed by Baidu, is the first real-time end-to-end detection Transformer model. By introducing an encoder-decoder structure and a query mechanism, it eliminates the reliance on NMS post-processing and achieves a superior accuracy-speed trade-off over YOLO on general-purpose benchmarks such as COCO[31]. Researchers have attempted to apply RT-DETR to insulator defect detection in transmission lines[32], casting surface defect detection[33], metal rod surface defect detection[34], and PCB defect detection[35], all of which have achieved significant optimization in the accuracy-efficiency trade-off. These studies indicate that RT-DETR possesses good generalizability in handling defect detection tasks under complex backgrounds. In recent years, RT-DETR has also been gradually introduced into the field of agricultural visual detection. Wang et al.[36] applied it to strawberry disease detection; Lin et al.[37] to grape leaf disease detection, Wu et al.[38] to fruit maturity detection; Huang et al.[39] achieved precise identification of citrus huanglongbing, and Lin et al.[40] applied it to detection of tipburn symptoms in leafy vegetables. The above studies cover various agricultural detection scenarios, including fruits and leaves, validating the broad applicability and promising improvement potential of the RT-DETR framework in agricultural vision tasks.
In the context of bitter gourd-related research, several studies have conducted preliminary explorations using deep learning. Li et al.[41] applied Faster R-CNN to object detection of bitter gourd leaf diseases. Liu et al.[42] proposed the YOLOv8-CEFC model for high-throughput phenotyping detection of bitter gourd fruit shape and tubercle characteristics. Jiang et al.[43] employed an improved YOLOv5-seg model to achieve fine-grained instance segmentation of bitter gourd maturity. The above studies have validated the feasibility of deep learning in bitter gourd vision tasks. However, their detection targets are primarily focused on leaf diseases, fruit shape classification, or maturity grading, and have not yet addressed automatic detection of external defects on bitter gourd fruits, which are precisely the critical indicators that most directly affect commercial value in postharvest sorting. On one hand, the densely distributed tubercles and ridges on the bitter gourd surface share certain similarities with early-stage scratches and lesions, and this inter-class confusion clearly increases the difficulty of accurate defect localization[44]. On the other hand, the curved and elongated shape of bitter gourd, coupled with large variations in defect scales and random distribution locations, imposes higher demands on the bounding box regression accuracy and scale adaptability of detection models. Currently, research on this task remains very limited, and existing methods cannot be directly transferred for application. To address the above challenges, this study takes RTDETR-R18 as the baseline model and proposes the CDS-RTDETR model through targeted improvements at three levels: feature encoding efficiency, upsampling quality, and bounding box regression accuracy. The main contributions of this paper are as follows:
(1) The Cascaded Group Attention (CGA) mechanism is introduced to replace the multi-head self-attention. Through feature splitting and cascaded aggregation, head redundancy is reduced, substantially improving inference efficiency while maintaining a global receptive field and preventing redundant attention distributions from amplifying noise interference caused by the tuberous texture on the bitter gourd surface.
(2) The DySample dynamic upsampler is adopted to replace nearest-neighbor interpolation. By leveraging content-aware sampling offsets, fine edge details of defects are recovered, improving boundary fidelity and effectively addressing the challenge of blurred boundaries between defect edges and tubercles on bitter gourd.
(3) The Shape-IoU loss function is introduced, which explicitly incorporates shape and scale weights of bounding boxes to strengthen short-edge regression constraints, thereby improving localization accuracy for elongated fruit and enhancing the alignment between detection boxes and the true contour of bitter gourd.
The experimental results demonstrate that CDS-RTDETR achieves a mAP50 of 90.35%, representing an improvement of 2.62 percentage points over the baseline, and an inference speed of 341.08 FPS, a 35.8% increase. These results validate the effectiveness of the proposed improvement strategies and provide an efficient and accurate detection solution for automated postharvest sorting of bitter gourd.
-
To enhance the generalization performance of the model in real-world production and circulation scenarios, this study collected bitter gourd image data from three types of scenes: field, indoor controlled environment, and fruit and vegetable wholesale market (Fig. 1). Field images were acquired at the Baisha Breeding Farm of Fujian Tianmei Seed Technology Co., Ltd, and the New Variety Demonstration, and Evaluation Base of Fujian Provincial Seed Industry Innovation Center (Langqi), to reflect the natural growth state of bitter gourd. Indoor images were captured by placing freshly harvested bitter gourd on a black light-absorbing background cloth, yielding standardized samples with prominent target subjects and minimal background noise. In addition, images were collected at the Strait Agricultural and Sideline Products Logistics Center Vegetable Wholesale Market (Fuzhou, China) to supplement samples covering various external defects occurring during fruit storage, transportation, and sale.
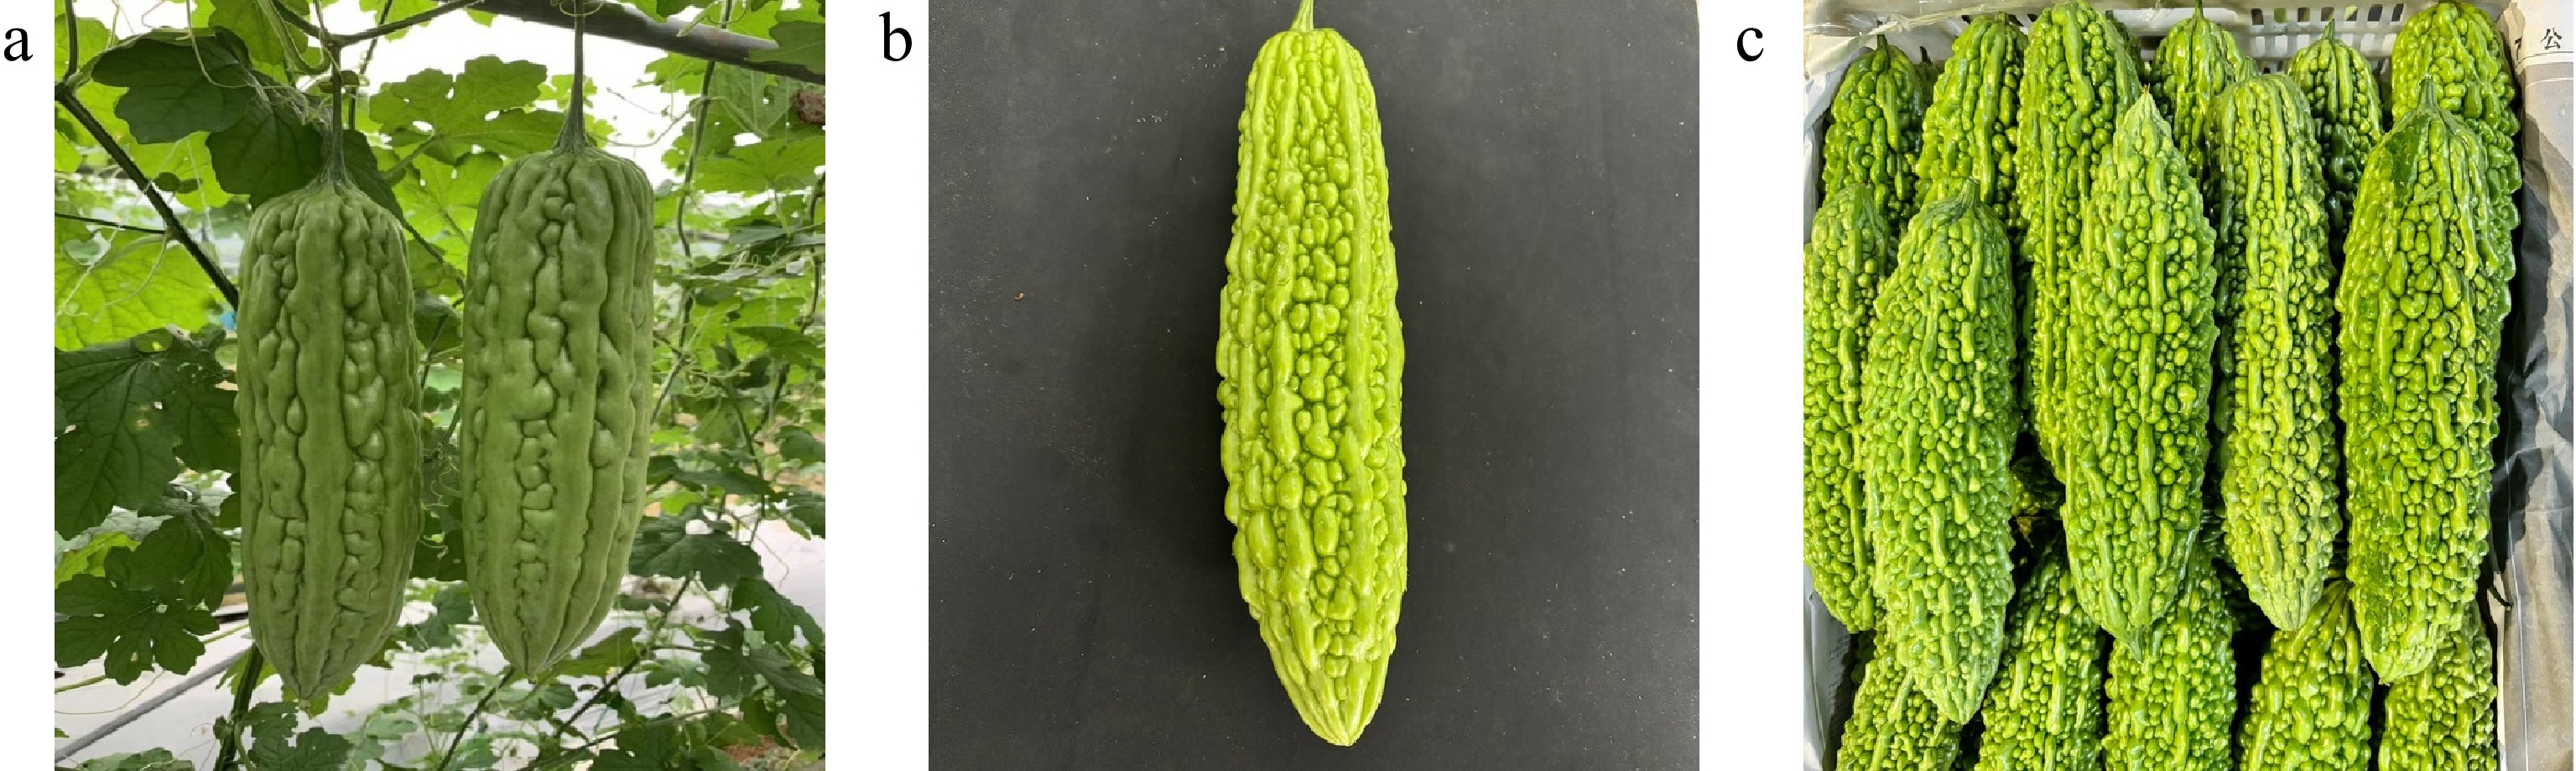
Figure 1.
Bitter gourd images captured in different acquisition scenarios. (a) Field scenes. (b) Indoor scenes. (c) Wholesale market scenes.
The collected samples covered fruits of varying health conditions to ensure sufficient representation of common external defects for subsequent model training and evaluation. All images were captured under natural lighting conditions, with acquisition times spanning two periods: 9:00–12:00 and 14:00–17:00, covering sunny, partly cloudy, and overcast weather conditions. The imaging devices included HUAWEI Mate 60 Pro+ (Huawei Technologies Co., Ltd, China) and iPhone 15 (Apple Inc., USA) to introduce imaging variability across devices. The shooting distance ranged from 0.3 to 1.0 m, with no restrictions on shooting angle or orientation, ensuring that the collected samples closely reflected the complexity and randomness of real natural scenes. A total of 1,400 RGB images were obtained.
Based on common quality issues encountered in actual production, the external conditions of bitter gourd were classified into five categories: (1) Surface Damage (SD), including mechanical scratches, dents, and fissures caused during harvesting or transportation; (2) Pests and Diseases (PD), referring to insect holes, lesions, and tissue decay caused by pathogenic microorganisms; (3) Morphological Deformity (MD), including abnormal overall fruit structure such as excessive curvature, deviation from the normal range of ridges, and abnormal enlargement of the head and tail; (4) Overripe (O), characterized by rind color transition from green to yellow, entering the senescence stage with substantially reduced commercial value; and (5) Healthy (H), representing normal fruits without any of the above abnormalities, serving as control samples for model training and evaluation.
Dataset construction
-
To enhance the robustness and generalization capability of the model in bitter gourd defect detection, and to mitigate the risk of overfitting caused by limited samples, this study employed offline data augmentation techniques, including brightness adjustment, mirror flipping, random translation, Gaussian blur, and random combinations[45−47]. The augmented images and the corresponding distribution of annotated instances across all five categories are presented in Fig. 2.
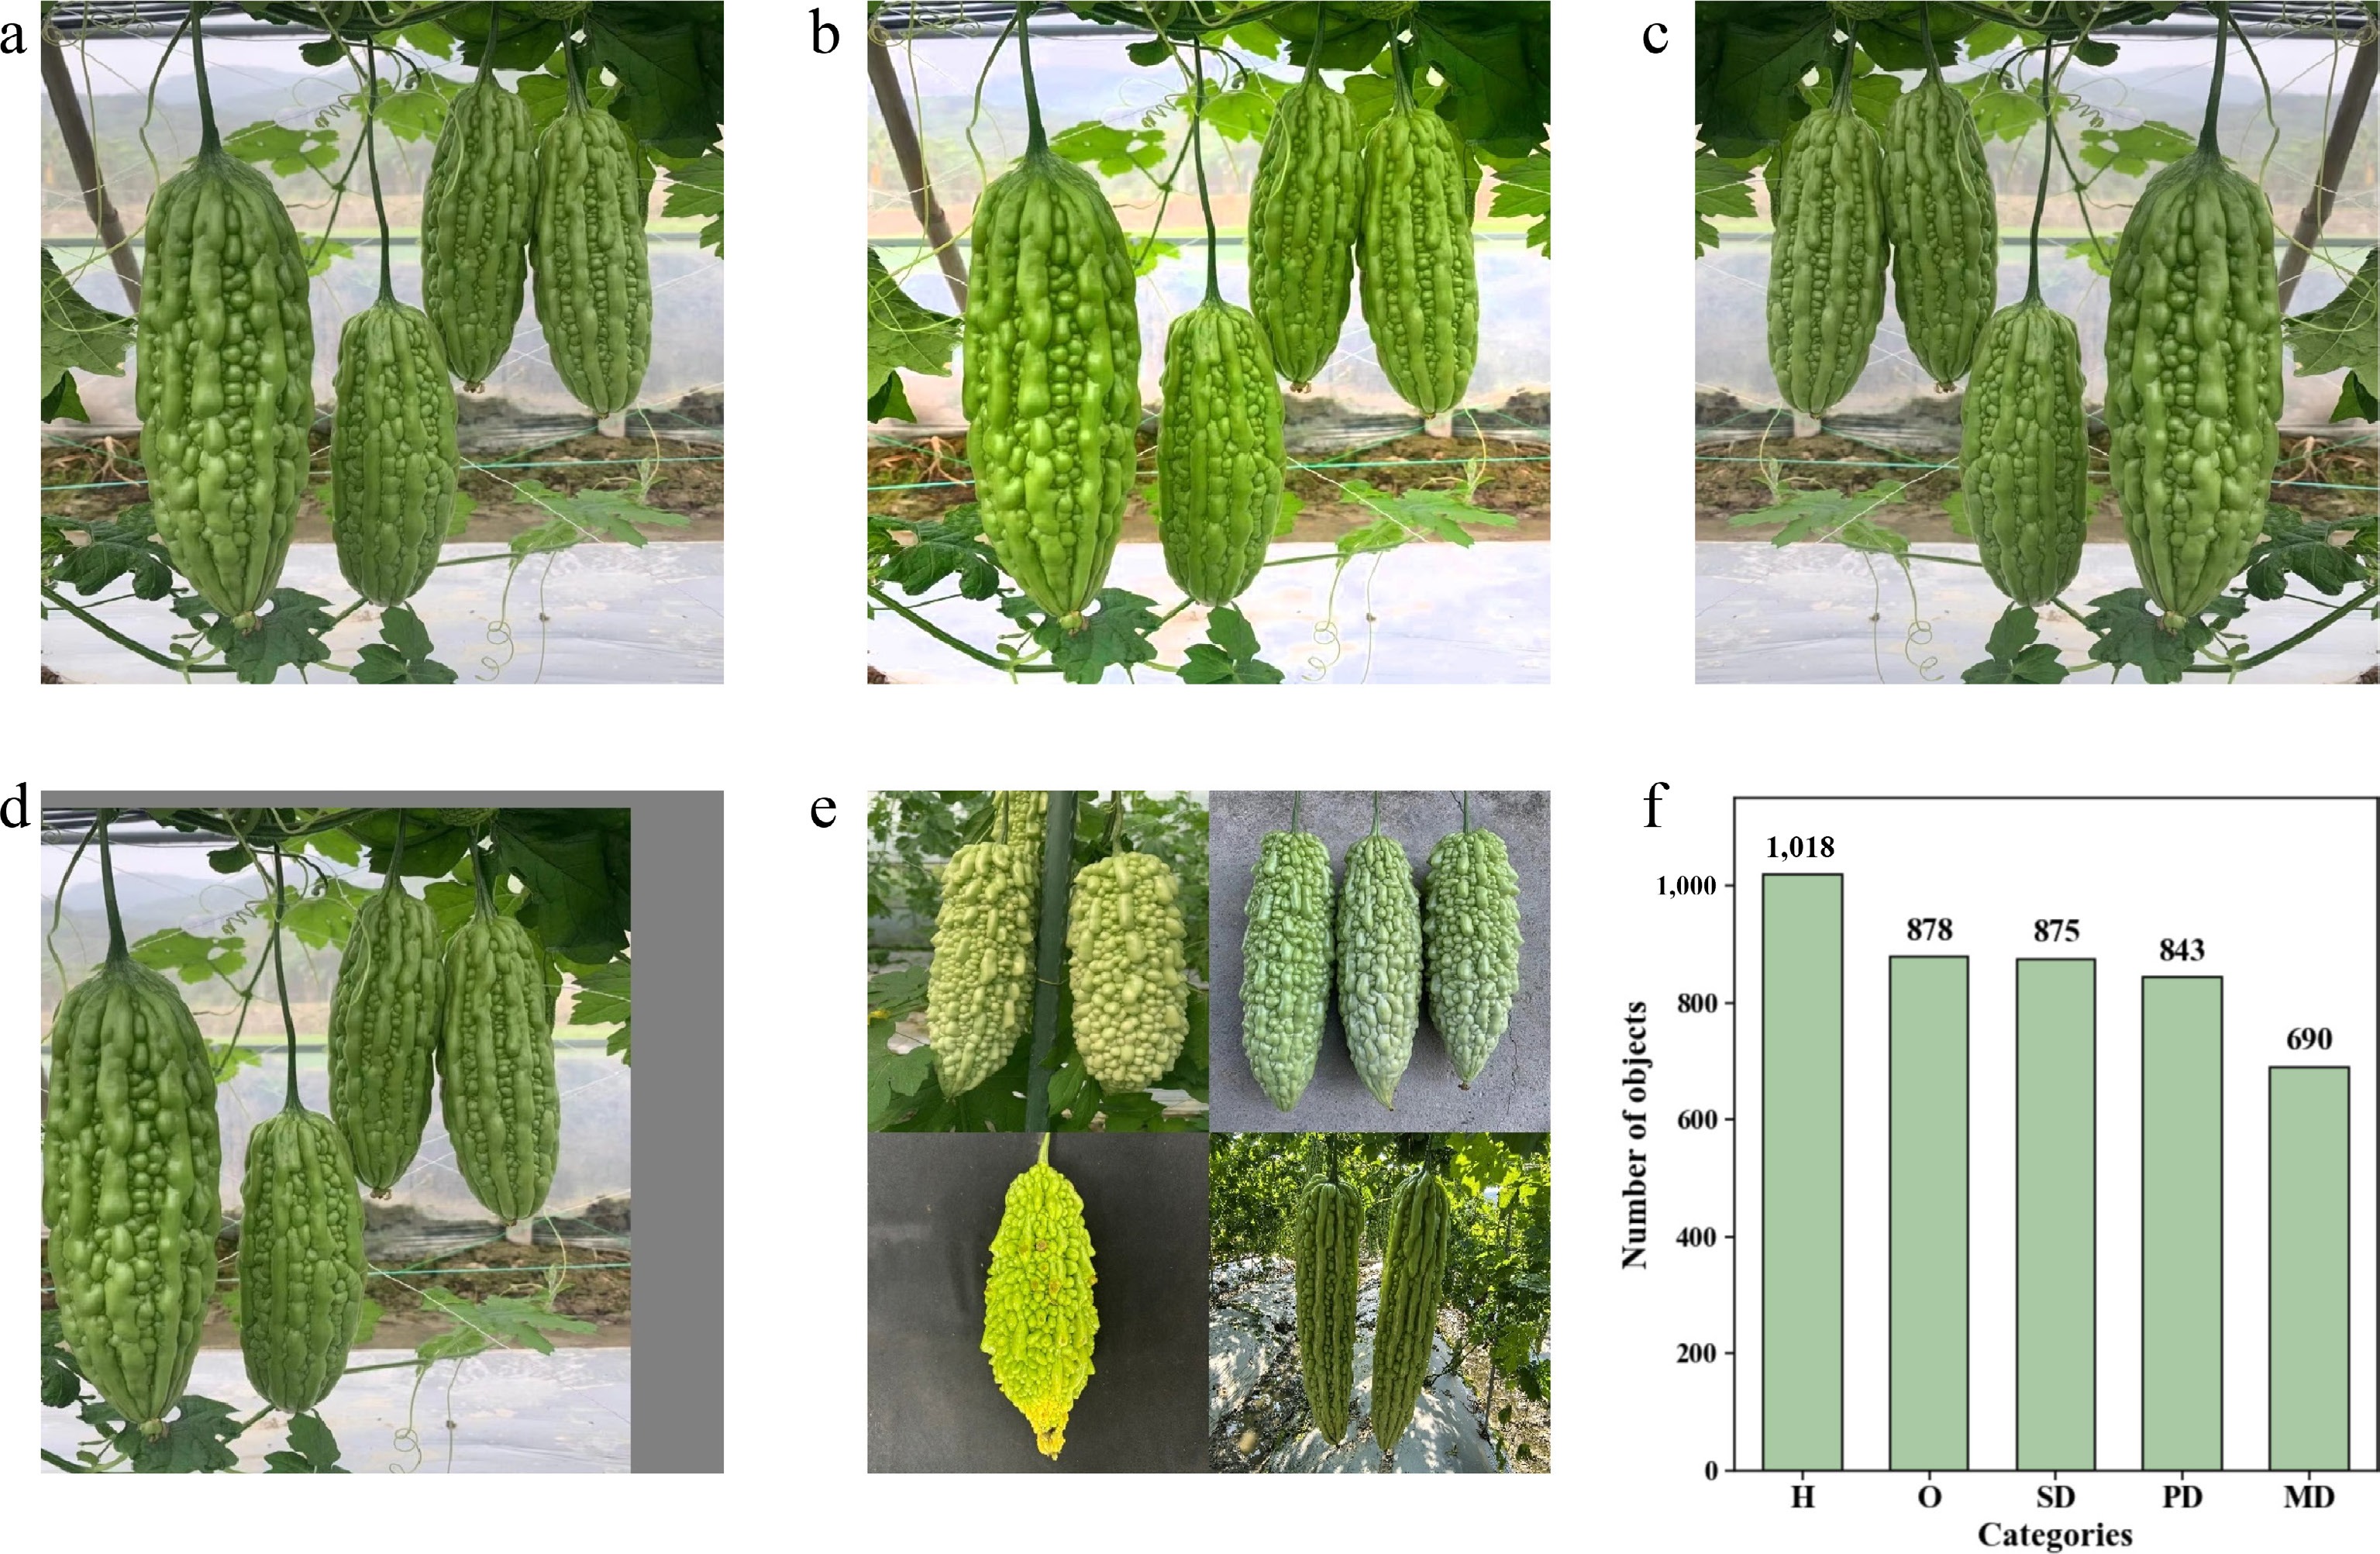
Figure 2.
Schematic diagram of data augmentation results and distribution of sample instances. (a) Original image. (b) Brightness adjustment. (c) Mirror flip. (d) Random translation. (e) Random combination. (f) Distribution of sample instances in the augmented dataset.
All images were manually annotated using the labelImg (1.8.6) annotation tool. The annotation work was independently completed by two researchers who had undergone unified training on label definitions and discrimination criteria. To ensure annotation consistency, a cross-check quality control strategy was adopted, wherein after the two annotators completed their independent annotations, they mutually reviewed all labels of the other party to minimize individual subjective bias. For samples with inconsistent annotations, a final consensus was reached through discussion and negotiation. During the annotation process, the principle of 'one instance, one bounding box' was strictly followed, with each target region completely enclosed. A total of 4,304 annotated bounding box instances were obtained from the 1,400 original images.
To prevent potential data leakage and ensure rigorous experimental design, the 1,400 original images were first divided into training, validation, and test sets at a ratio of 7:2:1 using stratified random sampling, ensuring consistent class and scene distributions across all subsets. Subsequently, data augmentation was applied exclusively to the training set, while the validation and test sets remained in their original state without any augmentation. The training set was used for iterative model training, the validation set was used for hyperparameter tuning and intermediate result validation during training, and the test set was used to evaluate the final generalization performance of the model on unseen data.
Algorithm design
RTDETR-R18 baseline model
-
The architecture of RTDETR-R18 consists of three components: a backbone network, an efficient hybrid encoder, and a Transformer decoder with auxiliary prediction heads. The backbone is based on the ResNet-18 structure[48] and performs progressive downsampling on the input image (640 × 640), outputting feature maps at three scales, namely S3, S4, and S5, with downsampling factors of 8×, 16×, and 32×, respectively. This provides multi-level feature representations ranging from fine-grained texture to global semantics for the subsequent encoder. The efficient hybrid encoder is composed of two cascaded modules: AIFI and CCFM. The AIFI module (Attention-based Intra-scale Feature Interaction) performs multi-head self-attention modeling on the high-level semantic feature map (S5) to capture long-range dependencies within the feature map. The CCFM module (CNN-based Cross-scale Feature Fusion) fuses the AIFI-enhanced high-level semantics with low-level detail features (S3 and S4) through convolution operations, enabling the final encoded features to possess both precise localization capability and robust global discriminative ability. The decoder employs an uncertainty-minimizing query selection mechanism to select a fixed number of object queries from the encoder output, and iteratively optimizes them through self-attention and cross-attention mechanisms, ultimately outputting each category and its corresponding bounding box in parallel, achieving end-to-end accurate prediction.
In practical agricultural inspection scenarios, detection models need to achieve a balance between accuracy and computational efficiency. Although deeper backbones such as ResNet-50 and ResNet-101 can provide stronger feature representation capabilities, they inevitably introduce increased parameters, computational complexity, and inference latency, which may limit real-time deployment in agricultural inspection systems. Moreover, compared with some heavier DETR-based models, lightweight RT-DETR variants provide better efficiency for edge-oriented applications. Considering the requirements of real-time bitter gourd defect detection and hardware resource constraints, this study selects RTDETR-R18 as the baseline model because it achieves an appropriate balance between detection performance and deployment efficiency (Fig. 3a).
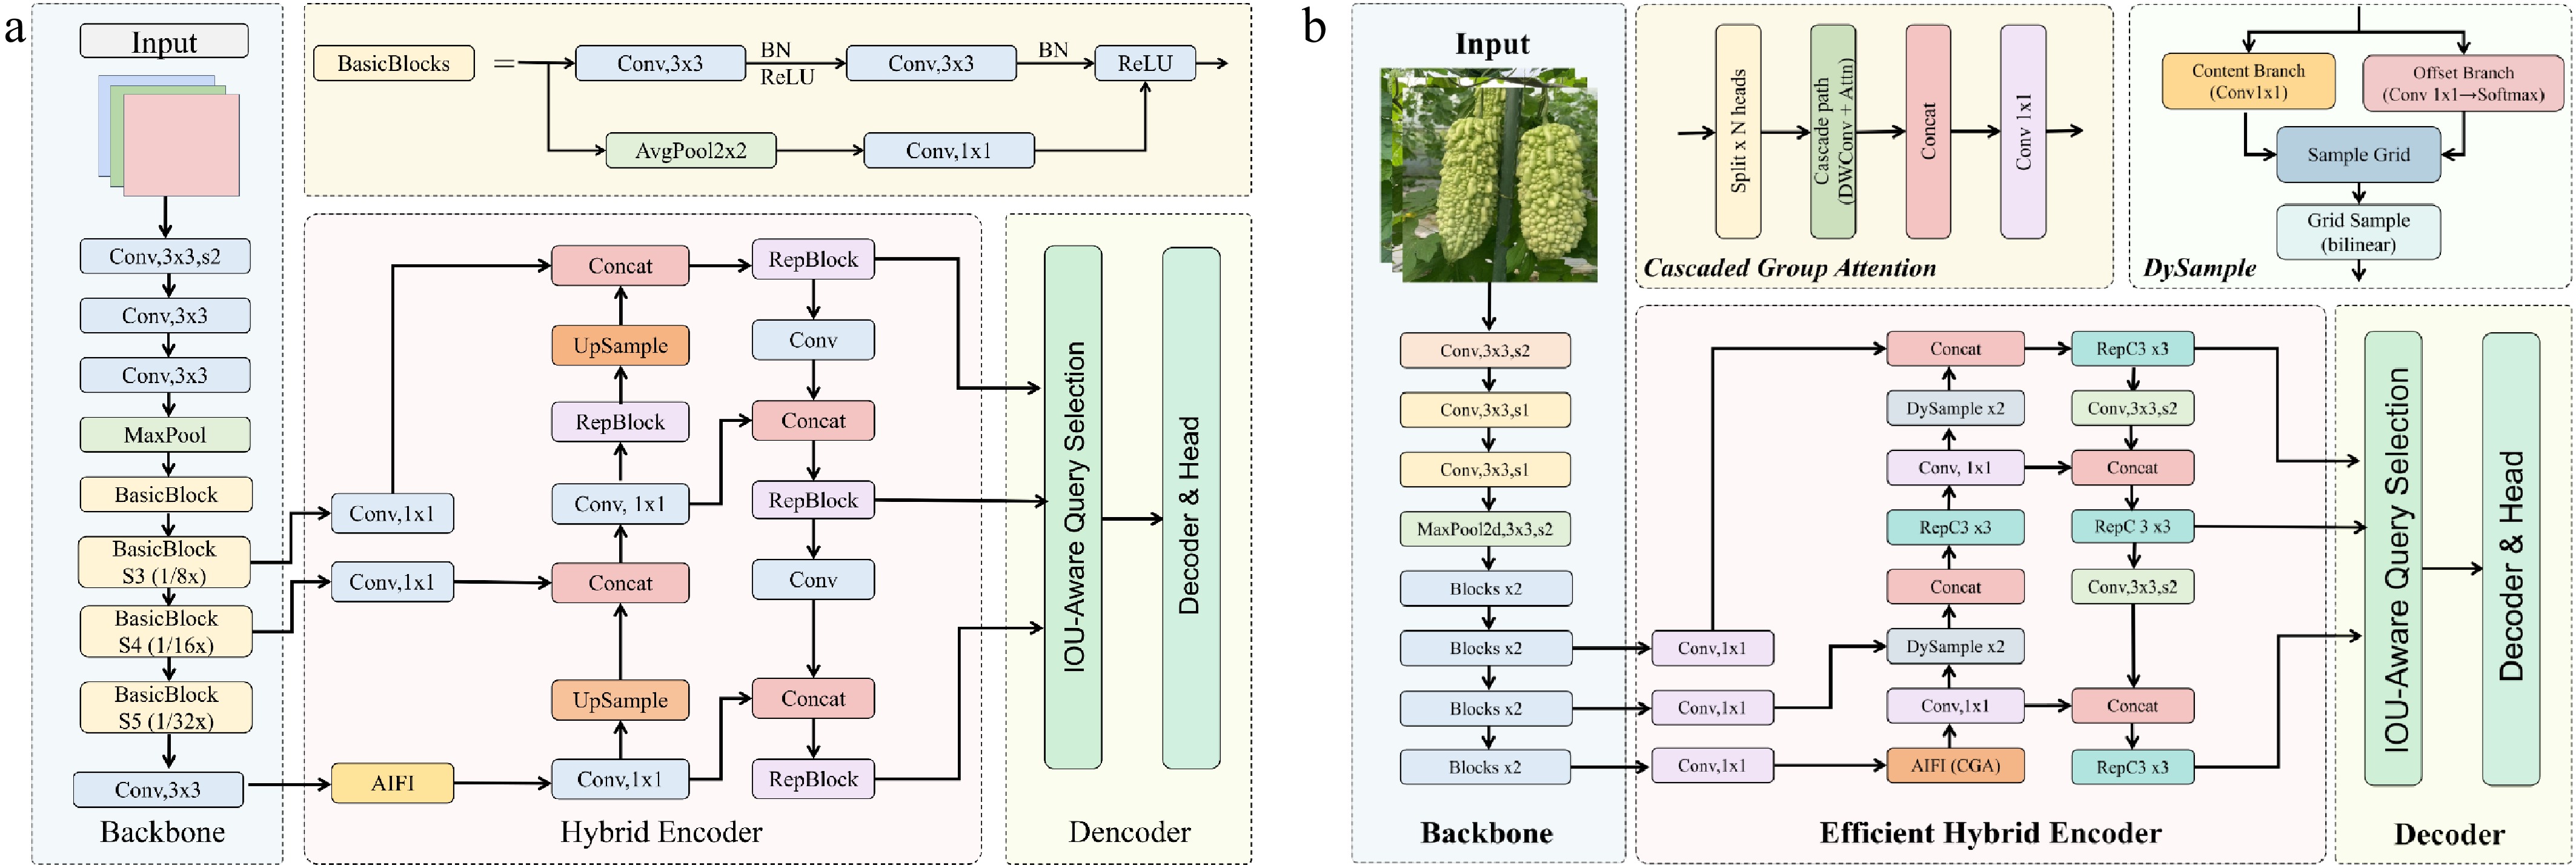
Figure 3.
Architecture comparison between the baseline and proposed models. (a) RTDETR-R18: the baseline network with ResNet-18 backbone, MHSA-based AIFI encoder, and GIoU loss. (b) CDS-RTDETR: the improved network integrating CGA in the AIFI module, DySample dynamic upsampler in the CCFM module, and Shape-IoU loss for bounding box regression.
CDS-RTDETR model
-
To improve the detection accuracy and inference efficiency of external defect detection in bitter gourd, this study proposes an improved detection network named CDS-RTDETR based on RTDETR-R18. First, to address the issues of head redundancy and low computational efficiency in the multi-head self-attention mechanism within the AIFI module, the CGA mechanism is introduced to replace the original multi-head self-attention. Through feature splitting and cascaded aggregation, each attention head is forced to learn differentiated feature projections, thereby reducing computational complexity while maintaining a global receptive field. Second, in the upsampling stage, the DySample dynamic upsampler is adopted to replace the original nearest-neighbor interpolation. By leveraging content-aware sampling offsets, the sampling points are adaptively aggregated along the directions of target boundaries, effectively recovering defect edge details and improving boundary fidelity. Regarding the loss function, Shape-IoU is introduced to replace the original GIoU loss. By explicitly incorporating shape and scale weights of bounding boxes, the regression constraints along the short-edge direction are strengthened, thereby improving the alignment localization accuracy for elongated fruit (Fig. 3b).
Cascaded group attention
-
In RT-DETR, the AIFI (Attention-based Intra-scale Feature Interaction) module employs Multi-Head Self-Attention (MHSA) to achieve global feature interaction[49], which is used to model long-range dependencies among different regions within the image. In the bitter gourd defect detection task of this study, defective regions typically manifest as local texture anomalies or color variations on the fruit surface, and their discriminative features often require contextual information from surrounding normal regions to be accurately identified. Therefore, a global receptive field is crucial for distinguishing genuine defects from surface interferences such as fruit spots and uneven illumination. However, when the multi-head self-attention mechanism processes high-resolution feature maps, the attention maps generated by different attention heads exhibit high similarity. This head redundancy leads to substantial computational waste and increases the inference latency of the model. As the resolution of feature maps increases, the computational complexity of self-attention scales quadratically, and this trade-off becomes particularly prominent in real-time detection scenarios.
To address the above issues, this study adopts the CGA mechanism proposed in EfficientViT to replace the multi-head self-attention mechanism in the original AIFI module[50]. The core idea of CGA is to feed different splits of the complete features to each attention head, rather than having all heads share the same complete features as in traditional multi-head self-attention, thereby explicitly decomposing the attention computation across individual heads. Formally, the attention computation in each head is performed independently:
$ {\tilde{\tilde{\text{X}}}}_{\text{ij}}=\text{Attn}\left({\text{X}}_{\text{ij}}\text{W}_{\text{ij}}^{\text{Q}},{\text{X}}_{\text{ij}}\text{W}_{\text{ij}}^{\text{K}},{\text{X}}_{\text{ij}}\text{W}_{\text{ij}}^{\text{V}}\right) $ (1) where,
$\rm {X}_{ij} $ $ j $ $ i $ $ {\tilde{\text{X}}}_{\text{i+1}}=\text{Concat}{\left[{\tilde{\tilde{\text{X}}}}_{\text{ij}}\right]}_{\text{j=1:h}}\text{W}_{\text{i}}^{\text{P}} $ (2) Building upon this, CGA further introduces a cascaded design. The output of each head is added to the input of the subsequent head, progressively refining the feature representation in a stage-wise manner (Fig. 4a). This design offers three advantages. First, different heads receive different feature splits, compelling each head to learn differentiated feature projections, which effectively enhances the diversity of attention maps. Second, since both the input and output channel dimensions in the QKV layers are reduced to 1/h of their original sizes, the FLOPs and parameter count of CGA are correspondingly reduced to 1/h, significantly decreasing computational overhead. Third, the cascaded structure increases the depth of the network without introducing additional learnable parameters, thereby further enhancing model capacity, and the use of smaller QK channel dimensions in each head incurs only marginal latency overhead. Based on the above advantages, this study integrates CGA into the AIFI module of RTDETR-R18, effectively alleviating the computational redundancy of MHSA while maintaining global feature interaction capability.
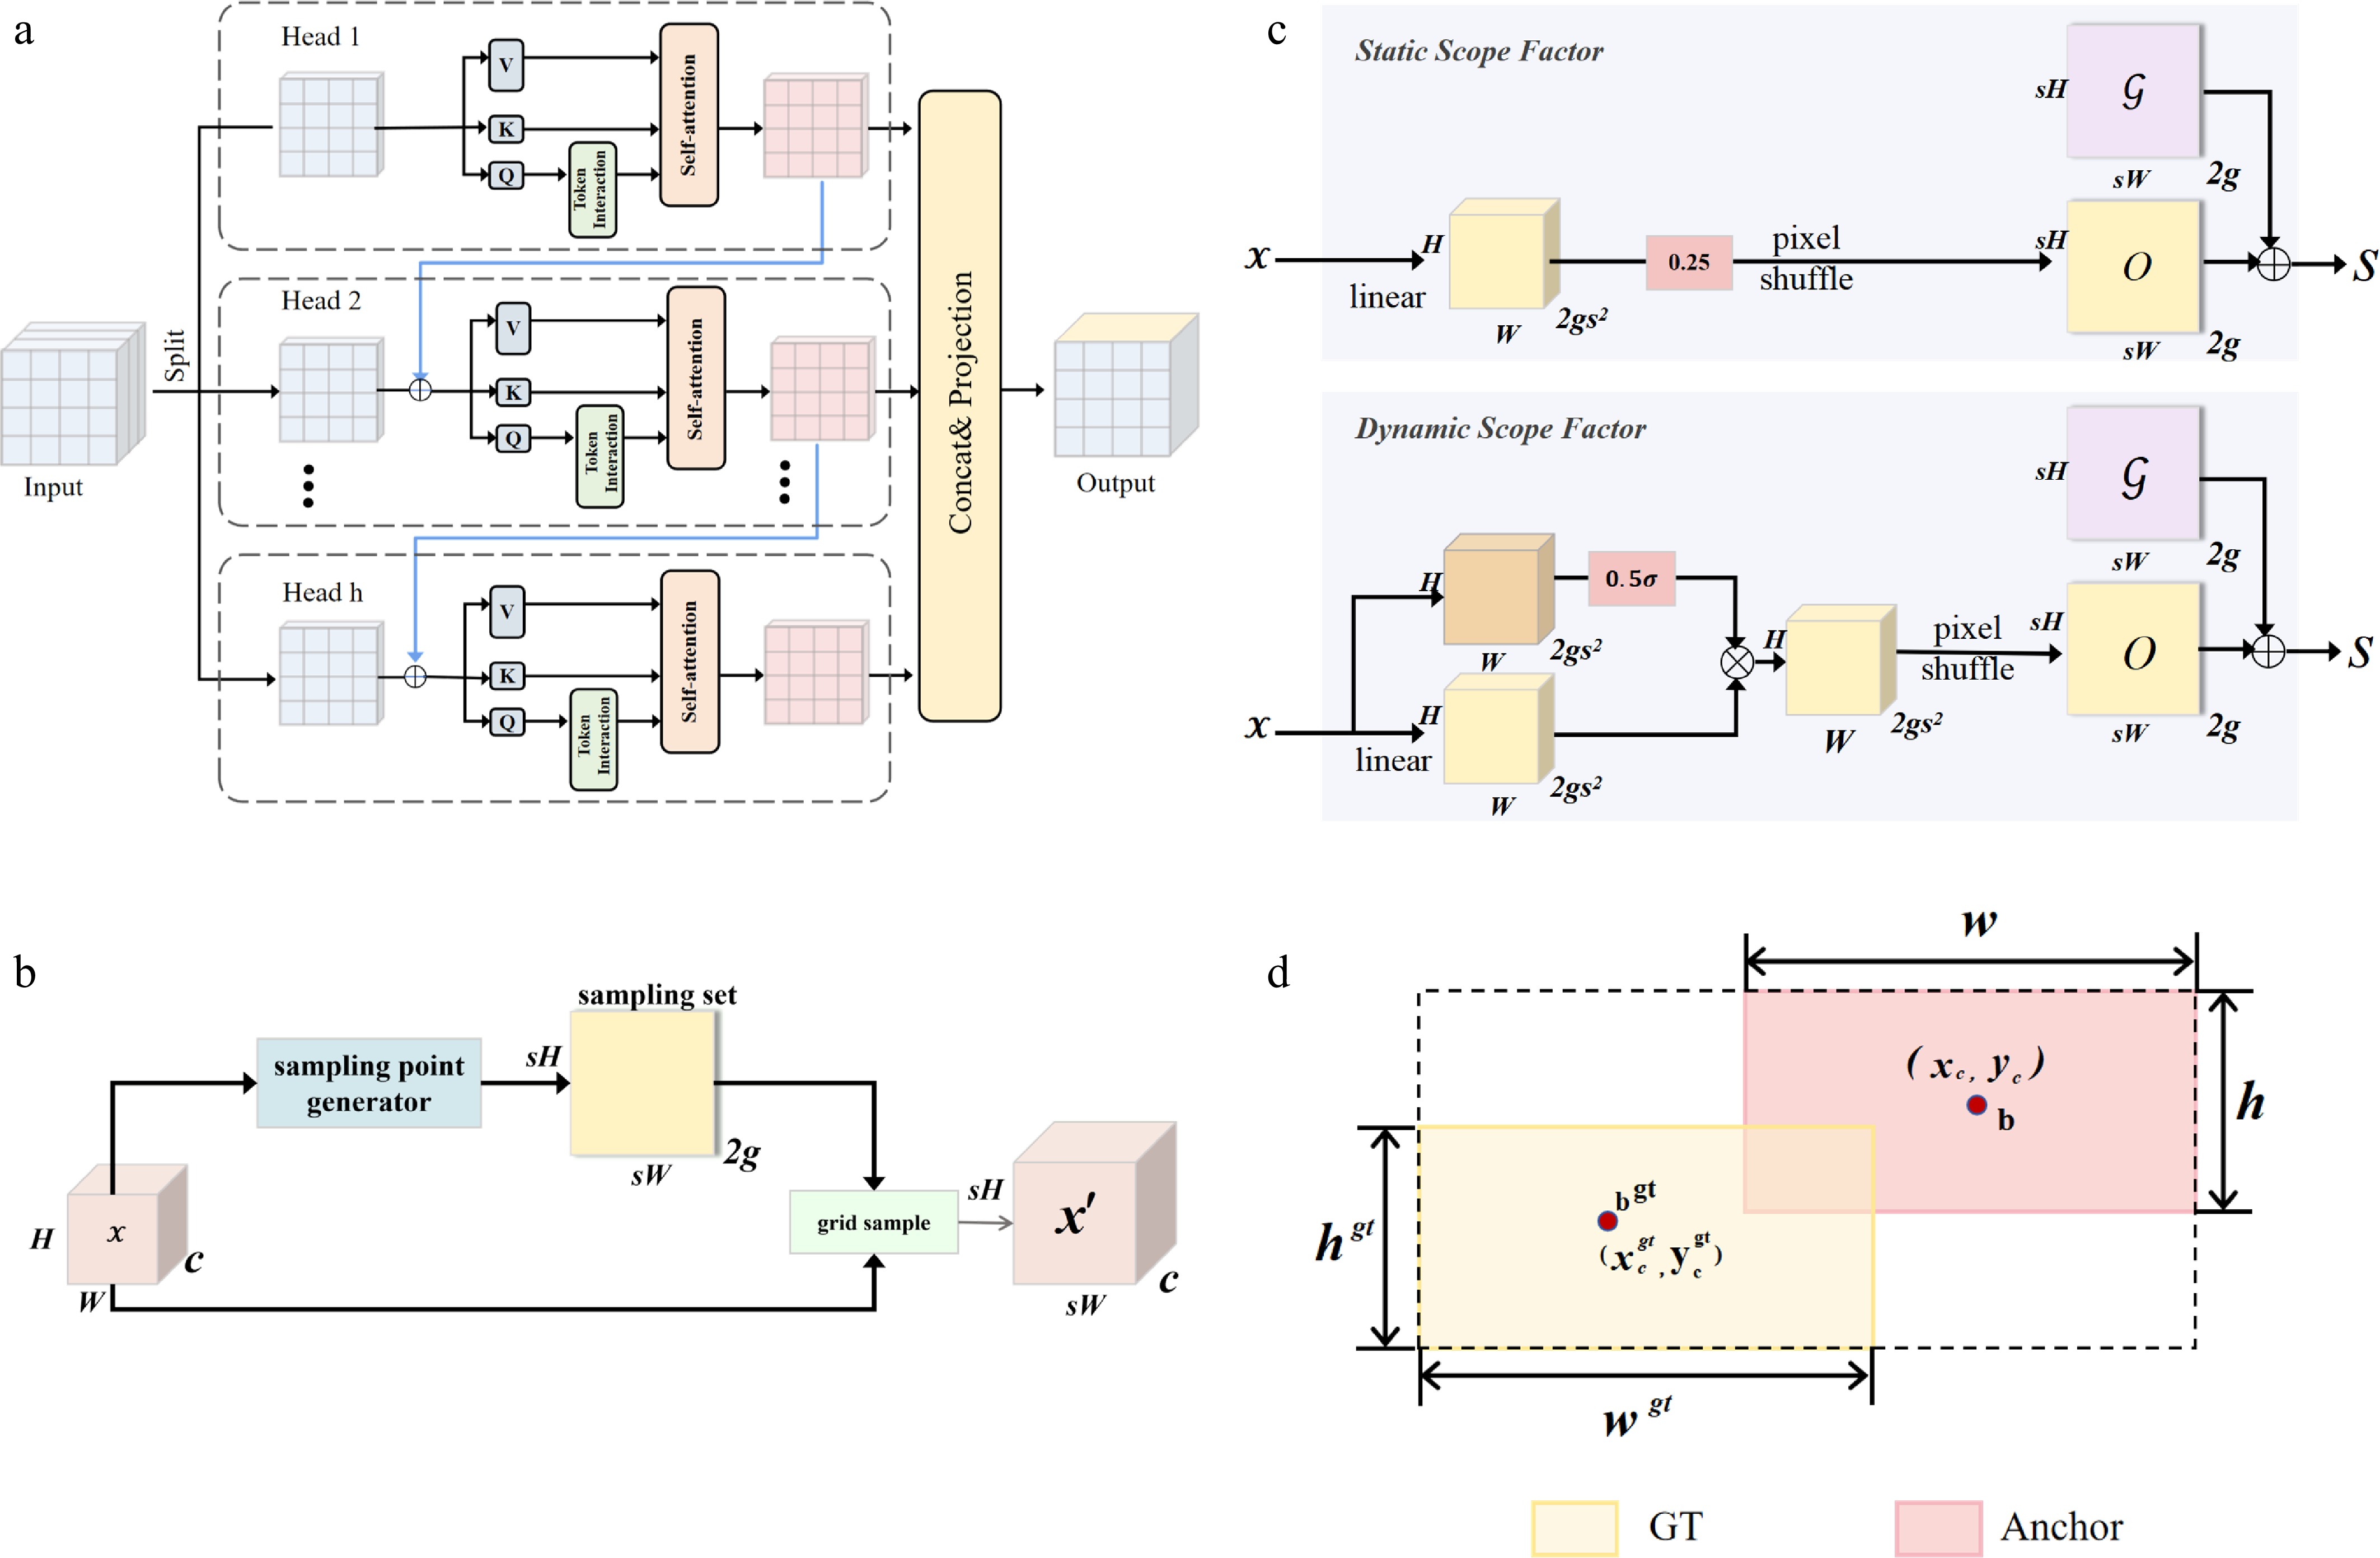
Figure 4.
Schematic diagrams of the key improvement modules in CDS-RTDETR. (a) Cascaded Group Attention (CGA). (b) Sampling-based dynamic upsampling in DySample. (c) Sampling point generator in DySample. (d) Shape-IoU loss function.
DySample dynamic upsampling
-
In the cross-scale feature fusion process of the CCFM (Cross-scale Feature Fusion Module) in RT-DETR, the original module employs nearest-neighbor interpolation for upsampling. In the bitter gourd defect detection task of this study, defective regions are typically localized on the fruit surface, and their edge details have a critical impact on final detection accuracy. The boundary blurring introduced during the upsampling stage is directly propagated to the subsequent decoder, weakening the ability of the detection head to accurately localize defective regions. However, nearest-neighbor interpolation simply expands the feature map size by replicating adjacent pixel values, neglecting smooth transitions and semantic information between pixels, resulting in jagged artifacts and semantic misalignment at object boundaries in the recovered feature maps. While kernel-based dynamic upsamplers, such as CARAFE[51], can improve upsampling quality through content-awareness, the substantial computational overhead introduced by their dynamic convolutions and auxiliary sub-networks is detrimental to real-time detection deployment.
To address the above issues, this study introduces the DySample dynamic upsampler to replace nearest-neighbor interpolation in the CCFM module[52]. DySample reconstructs the upsampling process from the perspective of point sampling. Its core principle lies in generating content-aware adaptive sampling offsets, enabling sampling points to aggregate along object boundary directions, thereby preserving edge details while restoring resolution (Fig. 4b). Given a feature map X, a linear layer first generates the sampling offset O, which is then added to the original sampling grid G to obtain the sampling set S. The upsampled feature map X′ is subsequently generated via the grid_sample function for resampling. The entire process can be formally expressed as:
$ \text{O}={\text{linear(X)}} $ (3) $ \rm S = G + O $ (4) $ \text{X}'=\rm {grid}\_\text{sample(X,S)} $ (5) where, the offset O is reshaped to 2g × sH × sW through pixel shuffling, with s denoting the upsampling factor. The sampling point generator generates the sampling set based on the input features, which is subsequently used by grid_sample to complete feature resampling. The sampling set is obtained by adding the learned offset to the original sampling grid, with the upper branch representing the static range factor mechanism and the lower branch representing the dynamic range factor mechanism (Fig. 4c).
Compared with nearest-neighbor interpolation, DySample offers three advantages. First, through content-aware dynamic offset learning, sampling points can be adaptively adjusted according to feature distribution, enabling the upsampling process to perform offset compensation along target boundary directions and effectively improving edge recovery quality. Second, the offset range is controlled via static/dynamic range factors, preventing sampling point overlap that could otherwise generate boundary artifacts. Third, offsets are generated by grouping features along the channel dimension, enhancing sampling diversity while maintaining computational efficiency.
Based on the above advantages, DySample effectively preserves edge details and local texture information of defective regions in bitter gourd during high-resolution feature map recovery, providing higher-quality feature inputs for cross-scale fusion in CCFM and thereby enhancing the localization accuracy and recognition capability of the detection head for surface defects on bitter gourd.
Shape-IoU loss function
-
In object detection, the bounding box regression loss plays a critical role in determining detection accuracy. The original RTDETR-R18 adopts GIoU as the bounding box regression loss function[53]. In the bitter gourd defect detection task of this study, the size and posture of bitter gourd vary across different images, and the scales and aspect ratios of the annotation boxes correspondingly exhibit a wide range of variations, imposing higher demands on the alignment accuracy between detection boxes and fruit contours. However, although GIoU resolves the gradient vanishing issue when the predicted box and the ground-truth box do not overlap by introducing the minimum enclosing box, it only focuses on the geometric relationship between the predicted and ground-truth boxes, failing to adequately account for the influence of inherent attributes such as the shape and scale of the bounding boxes themselves on the regression results. For elongated targets such as bitter gourd, even minor deviations along the short-edge direction can lead to a significant decrease in IoU, whereas GIoU lacks a differentiated penalty mechanism for such deviations.
To address the above limitations, this study introduces Shape-IoU (Shape Intersection over Union) to replace the default GIoU loss[54]. Through in-depth analysis of bounding box regression samples, Shape-IoU reveals that the shape and scale factors of bounding boxes substantially affect regression results. For bounding boxes of the same scale, deviations along the short-edge direction cause more drastic changes in IoU values; while for bounding boxes with the same shape, smaller-scale regression samples are more noticeably influenced by the shape of the ground-truth box. Based on these findings, Shape-IoU explicitly incorporates the shape and scale of the bounding boxes themselves as weighting factors when computing the loss, enabling the loss function to adaptively adjust the regression penalty according to the aspect ratio and scale of the annotation box and imposing greater penalty weights on deviations along the short-edge direction, making it particularly suitable for the alignment localization of elongated targets such as bitter gourd (Fig. 4d). The loss function computation process is expressed in Eqs (6)–(12). Here,
$ \rm B $ $ \rm {B}^{gt} $ $\rm {w}^{gt} $ $ \rm{{h}}^{gt} $ $ \gamma $ $ {\text{x}}_{\text{c}} $ $ {\text{y}}_{\text{c}} $ $ \text{x}_{\text{c}}^{\text{gt}} $ $ \text{y}_{\text{c}}^{\text{gt}} $ $ \text{IoU}=\dfrac{|\text{B}\cap{\text{B}}^{\text{gt}}|}{|\text{B}\cup{\text{B}}^{\text{gt}}|} $ (6) $ \text{ww}=\dfrac{2 \times({\text{w}}^{\text{gt}}{)}^{\text{scale}}}{({\text{w}}^{\text{gt}}{)}^{\text{scale}}+({\text{h}}^{\text{gt}}{)}^{\text{scale}}} $ (7) $ \text{hh}=\dfrac{2\times({\text{h}}^{\text{gt}}{)}^{\text{scale}}}{({\text{w}}^{\text{gt}}{)}^{\text{scale}}+({\text{h}}^{\text{gt}}{)}^{\text{scale}}} $ (8) $ \text{distanc}{\text{e}}^{\text{shape}}=\text{hh×}\dfrac{({\text{x}}_{\text{c}}-\text{x}_{\text{c}}^{\text{gt}}{)}^{2}}{{\text{c}}^{2}}+\text{ww}\times\dfrac{({\text{y}}_{\text{c}}-\text{y}_{\text{c}}^{\text{gt}}{)}^{2}}{{\text{c}}^{2}} $ (9) $ {\text{Ω}}^{\text{shape}}={\sum}_{\text{t=w,h}}(1-{\text{e}}^{{{\text{ω}}_{\text{t}}}}{)}^{\text{θ}}\text{, θ}=4 $ (10) $ \begin{cases} {\text{ω}}_{\text{w}}=\mathrm{hh}\times \dfrac{|\text{w-}{\text{w}}^{\text{gt}}|}{\underset{}{\max } \text{(w,}{\text{w}}^{\text{gt}})}\\ {\text{ω}}_{\text{h}}=\mathrm{ww}\times \dfrac{|\text{h-}{\text{h}}^{\text{gt}}|}{\underset{}{\max } \text{(h,}{\text{h}}^{\text{gt}})} \end{cases} $ (11) $ \rm {{L}}_{{Shape{\text -}IoU}}={1-IoU}+{distanc}{\text{e}}^{\text{shape}}+0.5\times{\text{Ω}}^{\text{shape}} $ (12) Based on the above mechanism, this study integrates Shape-IoU into RTDETR-R18 to replace the default GIoU loss, thereby enhancing the localization accuracy of the model for surface defects on bitter gourd and improving the alignment between detection boxes and the true fruit contours, while maintaining the original lightweight inference efficiency.
Evaluation metrics
-
To comprehensively evaluate the performance of the proposed CDS-RTDETR model in the task of external defect detection for bitter gourd, this study selects evaluation metrics from two dimensions: detection accuracy and computational efficiency.
The accuracy-related metrics include Precision, Recall, F1-Score, and mean Average Precision (mAP). Precision denotes the proportion of correctly predicted positive instances among all instances predicted as positive, reflecting the reliability of the model predictions. Recall denotes the proportion of correctly predicted positive instances among all actual positive instances, indicating the model's capability to cover the targets. The F1-Score is the harmonic mean of Precision and Recall, providing a comprehensive measure of both the accuracy and completeness of the model. The specific calculation formulas are as follows:
$ \text{Precision}=\dfrac{\text{TP}}{\text{TP}+\rm{FP}}\times 100{\text{%}} $ (13) $ \text{Recall}=\dfrac{\text{TP}}{\text{TP}+\rm{FN}}\times 100{\text{%}} $ (14) $ \text{F1}=\dfrac{\rm{2\times Precision\times Recall}}{\rm{Precision+Recall}}\times 100{\text{%}} $ (15) $ \text{AP}=\dfrac{\sum\nolimits_{\text{k=1}}^{\text{n}}{\text{P}}_{\text{k}}\times\Delta{\text{R}}_{\text{k}}}{\text{K}}\times 100{\text{%}} $ (16) $ \text{mAP}=\dfrac{{{\sum\nolimits_{\text{i=1}}^{\text{K}}}\text{AP}}_{\text{i}}}{\text{K}}\times100{\text{%}} $ (17) where, TP (True Positive) denotes the number of correctly detected targets, FP (False Positive) denotes the number of incorrectly detected backgrounds or objects, and FN (False Negative) denotes the number of missed targets. Average Precision (AP) is defined as the area under the precision-recall curve, and mean Average Precision (mAP) is the average of AP across all categories. Higher values of Precision, Recall, F1-Score, and mAP, approaching 1, indicate better detection accuracy of the model in the task of external defect detection for bitter gourd.
In terms of computational efficiency, Giga Floating-Point Operations Per Second (GFLOPs), the number of parameters (Params), and model size (MB) are employed to evaluate the computational complexity and storage requirements of the model, while Frames Per Second (FPS) is used to assess the real-time inference speed. The corresponding calculation formulas are as follows:
$ \text{Params}={\text{K}}_{\text{w}}\times{\text{K}}_{\text{h}}\times{\text{C}}_{\text{out}}\times{\text{C}}_{\text{in}} $ (18) $ \rm FLOPs = H \times W\times Params $ (19) $ \rm{Weight\; Size}=\dfrac{\text{Params}\times{\text{B}}_{\text{Params}}}{102{4}^{2}} $ (20) where,
$ {\text{C}}_{\text{in}} $ $ {\text{C}}_{\text{out}} $ $ {\text{K}}_{\text{w}} $ $ {\text{K}}_{\text{h}} $ $ {\text{H}}_{\text{out}} $ $ {\text{W}}_{\text{out}} $ -
All training and testing procedures were conducted on the same server equipped with an AMD EPYC 7352 (14 vCPU) processor, 60 GB of RAM, and an NVIDIA GeForce RTX 4090 GPU with 24 GB of memory. The software environment comprised Ubuntu 22.04, CUDA 12.1, PyTorch 2.3.0, and Python 3.10.15.
In the experiments, all input images were uniformly resized to 640 × 640 pixels. The AdamW optimizer was adopted with an initial learning rate of 0.0001 and a cosine annealing learning rate schedule. The weight decay coefficient was set to 0.0001, the momentum parameter was 0.9, and the batch size was set to 24. All experiments were conducted with a fixed random seed (seed = 42) and under identical hyperparameter settings to ensure reproducibility and fair comparison across models. The reported results were obtained from a single training run, as preliminary experiments with different random seeds showed negligible performance variance. For inference speed evaluation, all models were tested with FP32 numerical precision on the same GPU, and the reported FPS represents the pure model inference speed, excluding image loading time.
Model training results
Model performance before and after improvement
-
To validate the detection performance of the CDS-RTDETR model, comparative experiments were conducted on the bitter gourd external defect test set (Fig. 5a). The improved CDS-RTDETR outperformed the original RTDETR-R18 baseline model across all evaluation metrics. It achieved a Precision of 89.31%, a Recall of 86.80%, and an F1-Score of 88.04%. The mAP50 and mAP50-95 reached 90.35% and 76.15%, respectively, representing improvements of 1.01%, 1.89%, 1.47%, 2.62%, and 1.87% over the baseline model, which achieved 88.30%, 84.91%, 86.57%, 87.73%, and 74.28%, respectively. In terms of inference speed, CDS-RTDETR achieved 341.08 FPS, a 35.8% improvement over the baseline (251.25 FPS). These results indicate that the improved model significantly enhances detection accuracy and inference efficiency while maintaining real-time performance, and can effectively meet the real-time detection requirements in postharvest sorting scenarios of bitter gourd.
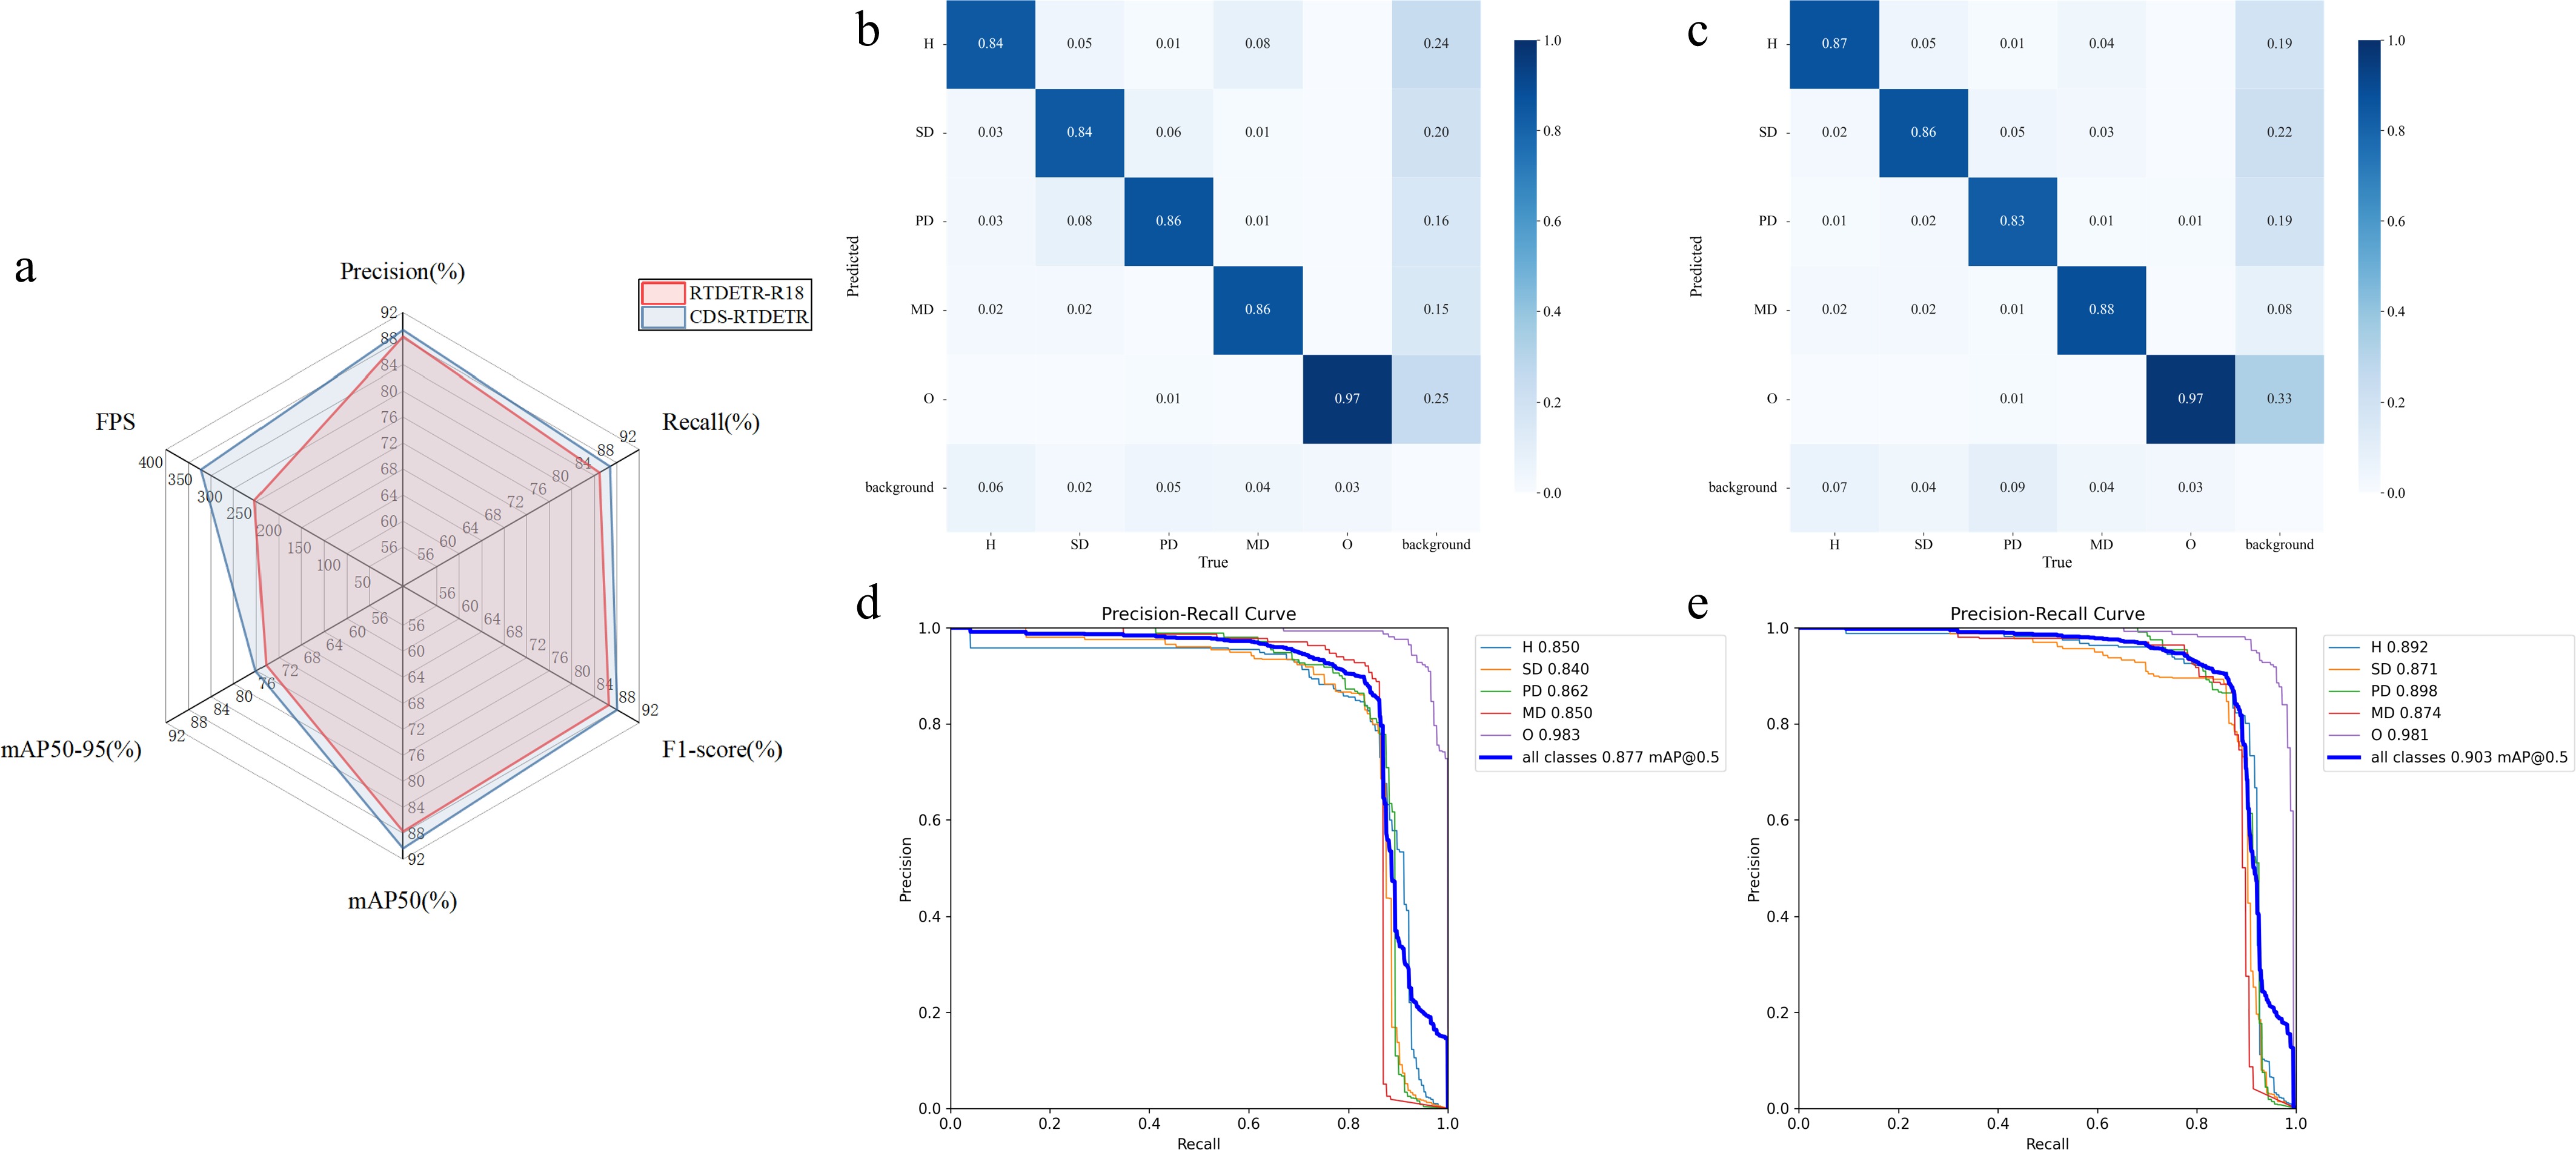
Figure 5.
Comprehensive performance evaluation of RTDETR-R18 and CDS-RTDETR. (a) Radar chart of model performance before and after improvement. (b) Normalized confusion matrix of RTDETR-R18. (c) Normalized confusion matrix of CDS-RTDETR. (d) Precision-Recall curves of RTDETR-R18. (e) Precision-Recall curves of CDS-RTDETR.
Confusion matrix analysis
-
The confusion matrix provides an intuitive illustration of the model's recognition and misclassification performance across different detection categories. In this study, normalized confusion matrices of the original RTDETR-R18 and the improved CDS-RTDETR on the bitter gourd test set were plotted (Fig. 5b, c).
The original model achieved relatively high detection accuracy for Overripe (O) and Morphological Deformity (MD). However, notable confusion was observed between Healthy (H) fruits and Surface Damage (SD), with some healthy fruits being misclassified as surface damage or morphological deformity. This is primarily attributed to the high visual similarity between the tubercles on healthy bitter gourd surfaces and early-stage mechanical scratches under specific lighting conditions. In addition, a considerable proportion of Pests and Diseases (PD) samples were misclassified as background, and background regions were frequently misclassified as various target categories, reflecting insufficient anti-interference capability of the original model in complex backgrounds.
The improved CDS-RTDETR exhibited overall performance enhancement across all categories. The accuracy for H fruits improved, and confusion with Morphological Deformity was notably reduced. The recognition accuracy for both SD and PD increased, and mutual misclassification between these two categories decreased considerably, indicating that the model's discriminative capability for texture-similar defects has been strengthened. For the PD category, the recognition accuracy showed improvement compared to the baseline, but the gain was relatively modest compared to other categories, with some lesion regions still being misclassified as background. We attribute this to three main factors: (1) the visual similarity between early-stage lesions and normal fruit surfaces or background regions under varying illumination; (2) the considerable intra-class variability of PD samples in terms of lesion size, shape, and color; and (3) the relatively small and localized nature of PD lesions compared to other categories, which imposes higher demands on fine-grained feature extraction. These factors collectively contribute to the occasional misclassification of PD samples as background, suggesting that further optimization is still needed for this category. The accuracy for MD and O categories remained stable and consistently high. In terms of background suppression, the proportion of background regions misclassified as various target categories decreased overall, indicating improved anti-interference capability of the model in complex backgrounds.
In summary, the improved model markedly reduces inter-class confusion and background misclassification while maintaining high detection accuracy, validating the effectiveness of the improvement strategies in CDS-RTDETR.
PR curve analysis
-
The Precision-Recall (PR) curve provides a comprehensive representation of the model's detection performance under different confidence thresholds, with the area under the curve corresponding to the Average Precision (AP) for each category. In this study, PR curves of the original RTDETR-R18 and the improved CDS-RTDETR on the bitter gourd test set were plotted (Fig. 5d, e).
The original model achieved relatively high AP values across all five categories, with the Overripe (O) category reaching 98.3%, demonstrating the most outstanding performance. The AP values for Morphological Deformity (MD) and Healthy (H) were 85.0% and 85.0%, respectively. The AP for Surface Damage (SD) was 84.0%, which was relatively lower, indicating that this category is more challenging to detect and more prone to confusion with other categories. The overall mAP50 of the model was 87.7%, demonstrating generally satisfactory detection performance.
The improved CDS-RTDETR exhibited varying degrees of improvement in PR curves across all categories. The AP values for Healthy (H), Surface Damage (SD), Pests and Diseases (PD), and Morphological Deformity (MD) increased to 89.2%, 87.1%, 89.8%, and 87.4%, respectively, among which Pests and Diseases showed the most significant improvement, indicating that the enhanced model effectively strengthens the discriminative capability for defects with similar textures. The AP for Overripe (O) remained at a high level of 98.1%, and the overall mAP50 reached 90.3%, representing a 2.6% improvement over the baseline model.
In summary, the PR curve coverage area of CDS-RTDETR is notably expanded, with improved AP values across all categories, indicating that the improved model effectively enhances recall while maintaining high precision, and demonstrates superior comprehensive performance in the task of external defect detection for bitter gourd.
Ablation experiments
-
To evaluate the contribution of each improved module to the performance of the baseline model, ablation experiments were conducted by adding and combining each module sequentially under the same dataset split and training parameter settings. The results are presented in Table 1, where '–' denotes that the original structure was retained without modification, and '✓' indicates that the corresponding module was adopted.
Table 1. Results of ablation experiments.
ID CGA DySample Shape-IoU GFLOPs Params
(M)Precision
(%)Recall
(%)F1-Score
(%)mAP50
(%)mAP75
(%)mAP50-95
(%)FPS Size
(MB)1 – – – 57.0 19.9 88.30 84.91 86.57 87.73 82.70 74.28 251.25 77.0 2 ✓ – – 57.0 19.7 88.57 85.79 87.16 89.02 83.22 74.73 362.32 76.4 3 – ✓ – 57.0 19.9 89.76 86.68 88.19 88.22 83.55 74.25 287.30 77.0 4 ✓ ✓ – 57.1 19.7 88.63 86.47 87.53 89.39 84.29 75.56 370.14 76.5 5 – – ✓ 57.0 19.9 88.27 87.96 88.12 89.48 83.14 75.09 264.18 77.0 6 ✓ – ✓ 57.0 19.7 90.62 83.97 87.17 89.31 84.19 74.76 359.96 76.4 7 – ✓ ✓ 57.0 19.9 88.92 87.10 88.00 88.29 84.02 74.68 299.77 77.0 8 ✓ ✓ ✓ 57.1 19.7 89.31 86.8 88.04 90.35 84.99 76.15 341.08 76.5 where '–' denotes that the original structure wasretained without modification, and '✓' indicates that the correspond-rhhzhyphening module was adopted. The first group is the baseline model RTDETR-R18, which achieved a Precision of 88.30%, a Recall of 84.91%, an F1-Score of 86.57%, a mAP50 of 87.73%, a mAP50-95 of 74.28%, and an inference speed of 251.25 FPS. The second group introduced the CGA module on top of the baseline, improving Precision, Recall, and mAP50 to 88.57%, 85.79%, and 89.02%, respectively, with mAP50 increasing by 1.29% over the baseline and inference speed reaching 362.32 FPS, a 44.2% improvement. CGA improves feature interaction efficiency through feature splitting and cascaded aggregation, enabling faster inference while maintaining detection accuracy. It is worth noting that the introduction of CGA significantly improves inference speed (from 251.25 to 362.32 FPS), while the GFLOPs remain nearly unchanged. This phenomenon indicates that theoretical computational complexity and actual inference efficiency are not always directly correlated. GFLOPs mainly reflect the theoretical number of floating-point operations, whereas practical inference speed is affected by multiple factors, including memory access efficiency, operator implementation, and hardware parallelism. Therefore, the improvement in FPS is mainly attributed to the optimized execution efficiency of CGA rather than a reduction in theoretical computational complexity. The third group introduced the DySample module, achieving a precision of 89.76% and a recall of 86.68%, representing improvements of 1.46% and 1.77% over the baseline, respectively. DySample improves the recovery quality of defect edges during upsampling through content-aware dynamic sampling point generation, validating its positive effect on boundary localization accuracy. The fourth group simultaneously introduced CGA and DySample, achieving a mAP50 of 89.39% and a mAP50-95 of 75.56%, with an inference speed of 370.14 FPS. CGA reduces computational redundancy in the encoding stage, while DySample improves upsampling quality in the feature fusion stage, achieving complementary enhancement across different stages. The fifth group introduced the Shape-IoU loss function, with Recall increasing to 87.96%, a 3.05% improvement over the baseline, and mAP50 reaching 89.48%, a 1.75% increase. By explicitly incorporating shape and scale weights of bounding boxes, Shape-IoU imposes greater regression penalties on deviations along the short-edge direction, effectively strengthening the alignment localization constraints for elongated bitter gourd fruit. The sixth group simultaneously introduced CGA and Shape-IoU, achieving a precision of 90.62%, the highest among all experimental groups, with mAP50 reaching 89.31%. However, recall decreased compared to the fifth group, indicating a precision–recall trade-off. Although CGA enhances feature discrimination and Shape-IoU strengthens bounding box regression constraints, the stricter localization requirements may cause some difficult samples with unclear boundaries or irregular shapes to be missed, resulting in reduced recall. The seventh group simultaneously introduced DySample and Shape-IoU, achieving a Recall of 87.10%, with relatively limited overall performance improvement. The eighth group integrated all three modules simultaneously, achieving the best balance across all metrics, with mAP50 reaching 90.35% and mAP50-95 reaching 76.15%, representing improvements of 2.62% and 1.87% over the baseline, respectively, and an inference speed of 341.08 FPS, a 35.8% improvement. Although the Precision of the eighth group was slightly lower than that of the sixth group, the highest mAP50 and mAP50-95 demonstrate that the integrated model achieves a better balance between precision, recall, and localization accuracy.
In summary, the ablation experiment results demonstrate that the CGA module contributes most notably to inference speed improvement, Shape-IoU contributes most to recall and localization accuracy, and DySample enhances edge detail preservation through improved upsampling quality. The joint application of the three modules exhibits mutual compatibility and complementary advantages, validating the effectiveness and rationality of the improvement strategies in this study.
Comparative experiments
-
To comprehensively evaluate the detection performance of the CDS-RTDETR model, this section presents a comparative analysis with current mainstream object detection models, including the baseline RTDETR-R18, the YOLO series (YOLOv5m, YOLOv8m, YOLOv10m, YOLOv11m, YOLOv12m, YOLOv13s, YOLOv26m), Hyper-YOLO[55], and Mamba-YOLO[56]. All models were trained on the same dataset and under identical training configurations (Table 2).
Table 2. Comparative experimental results.
ID Model Precision (%) Recall (%) F1-score (%) mAP50 (%) mAP75 (%) mAP50-95 (%) 1 CDS-RTDETR 89.31 86.80 88.04 90.35 84.99 76.15 2 RTDETR-R18 88.30 84.91 86.57 87.73 82.70 74.28 3 Hyper-YOLO 81.28 77.89 79.5 84.41 71.42 61.66 4 Mamba-YOLO 81.35 74.01 77.35 82.19 70.01 58.83 5 YOLOv5m 88.69 81.71 85.00 88.82 82.34 69.04 6 YOLOv8m 86.89 81.59 84.08 89.12 81.17 69.93 7 YOLOv10m 67.45 57.63 61.77 67.33 57.82 49.71 8 YOLOv11m 82.93 80.92 81.87 87.98 78.28 67.00 9 YOLOv12m 88.66 81.98 85.08 90.04 82.12 70.49 10 YOLOv13s 82.20 74.94 78.09 83.23 72.38 62.42 11 YOLOv26m 75.27 68.75 71.80 77.14 69.27 58.80 All models were trained onthe same dataset and under identical training configurations. CDS-RTDETR achieved a mAP50 of 90.35%, ranking the highest among all compared models, with a 2.62% improvement over the baseline RTDETR-R18. Meanwhile, CDS-RTDETR attained optimal values across all evaluation metrics, with Precision and Recall reaching 89.31% and 86.80%, respectively, and an F1-Score of 88.04%, comprehensively balancing detection accuracy and coverage capability. On the more stringent mAP50-95 metric for localization accuracy, CDS-RTDETR achieved 76.15%, significantly outperforming all compared models, indicating a distinct advantage in bounding box regression precision. This advantage primarily stems from the inherent superiority of the end-to-end Transformer architecture of RT-DETR in bounding box regression over the anchor-based YOLO series, as well as the three improvements in this study that effectively address texture interference, edge loss, and alignment difficulties in bitter gourd defect detection from the perspectives of feature encoding, upsampling quality, and bounding box regression, respectively.
In comparison, YOLOv12m, the best-performing model in the YOLO series, approached CDS-RTDETR in performance, yet the gap in mAP50-95 between the two reached 5.66%, reflecting that while the YOLO series can detect targets under loose IoU thresholds, their bounding box regression capability is notably insufficient under more stringent localization requirements. The remaining YOLO models exhibited similar trends.
The comprehensive comparison results demonstrate that CDS-RTDETR achieves high detection accuracy and bounding box localization precision in the task of external defect detection for bitter gourd, validating the effectiveness and superiority of the improvement strategies proposed in this study.
Grad-CAM++ heatmap visualization analysis
-
To intuitively evaluate the feature extraction capability and spatial perception mechanism of the CDS-RTDETR model for surface defects on bitter gourd, this study employs Grad-CAM++ (Gradient-weighted Class Activation Mapping Plus Plus) for visual analysis of high-level feature responses[57]. Grad-CAM++ generates spatial attention heatmaps corresponding to feature maps by backpropagating gradient information of the target class, thereby revealing the image regions that the model focuses on when making detection decisions. Compared with standard Grad-CAM, Grad-CAM++ can more precisely assign class-related weights in multi-target scenarios, produce more stable activation responses for overlapping instances and dense targets, and generate higher-resolution spatial response maps, making it suitable for the complex scenes of bitter gourd images where multiple fruits coexist, and defective regions exhibit high visual similarity to normal areas.
In this study, typical images containing different defect types and healthy fruits were selected to compare the class activation response differences between the baseline RTDETR-R18 and CDS-RTDETR (Fig. 6). The baseline RTDETR-R18 exhibited relatively scattered activation responses, with some high-response regions distributed along fruit edges and background areas, indicating that the model is susceptible to interference from non-target regions during defect localization, and the attention mechanism fails to effectively focus on the defective parts of the fruit itself. In contrast, the activation regions of CDS-RTDETR are more concentrated within the contour of the bitter gourd fruit, highly consistent with the actual defect locations, and the response distribution is more continuous and compact, indicating that the model can more accurately establish contextual associations between defective regions and surrounding normal tissues, thereby achieving stable focus on defect targets in complex backgrounds. In addition, for fruit regions where defect features are less pronounced, the baseline model produced scattered activations across the fruit surface, whereas the activation responses of CDS-RTDETR were overall weaker and more uniformly distributed, without significant false activation regions, indicating that the improved model possesses better discriminative capability for normal tissues. In summary, CDS-RTDETR outperforms the baseline RTDETR-R18 in target region focusing, background suppression, and false activation inhibition, demonstrating that the improved model has stronger feature extraction and spatial perception capabilities for bitter gourd surface targets. The above visualization results provide intuitive support for the quantitative experimental conclusions.
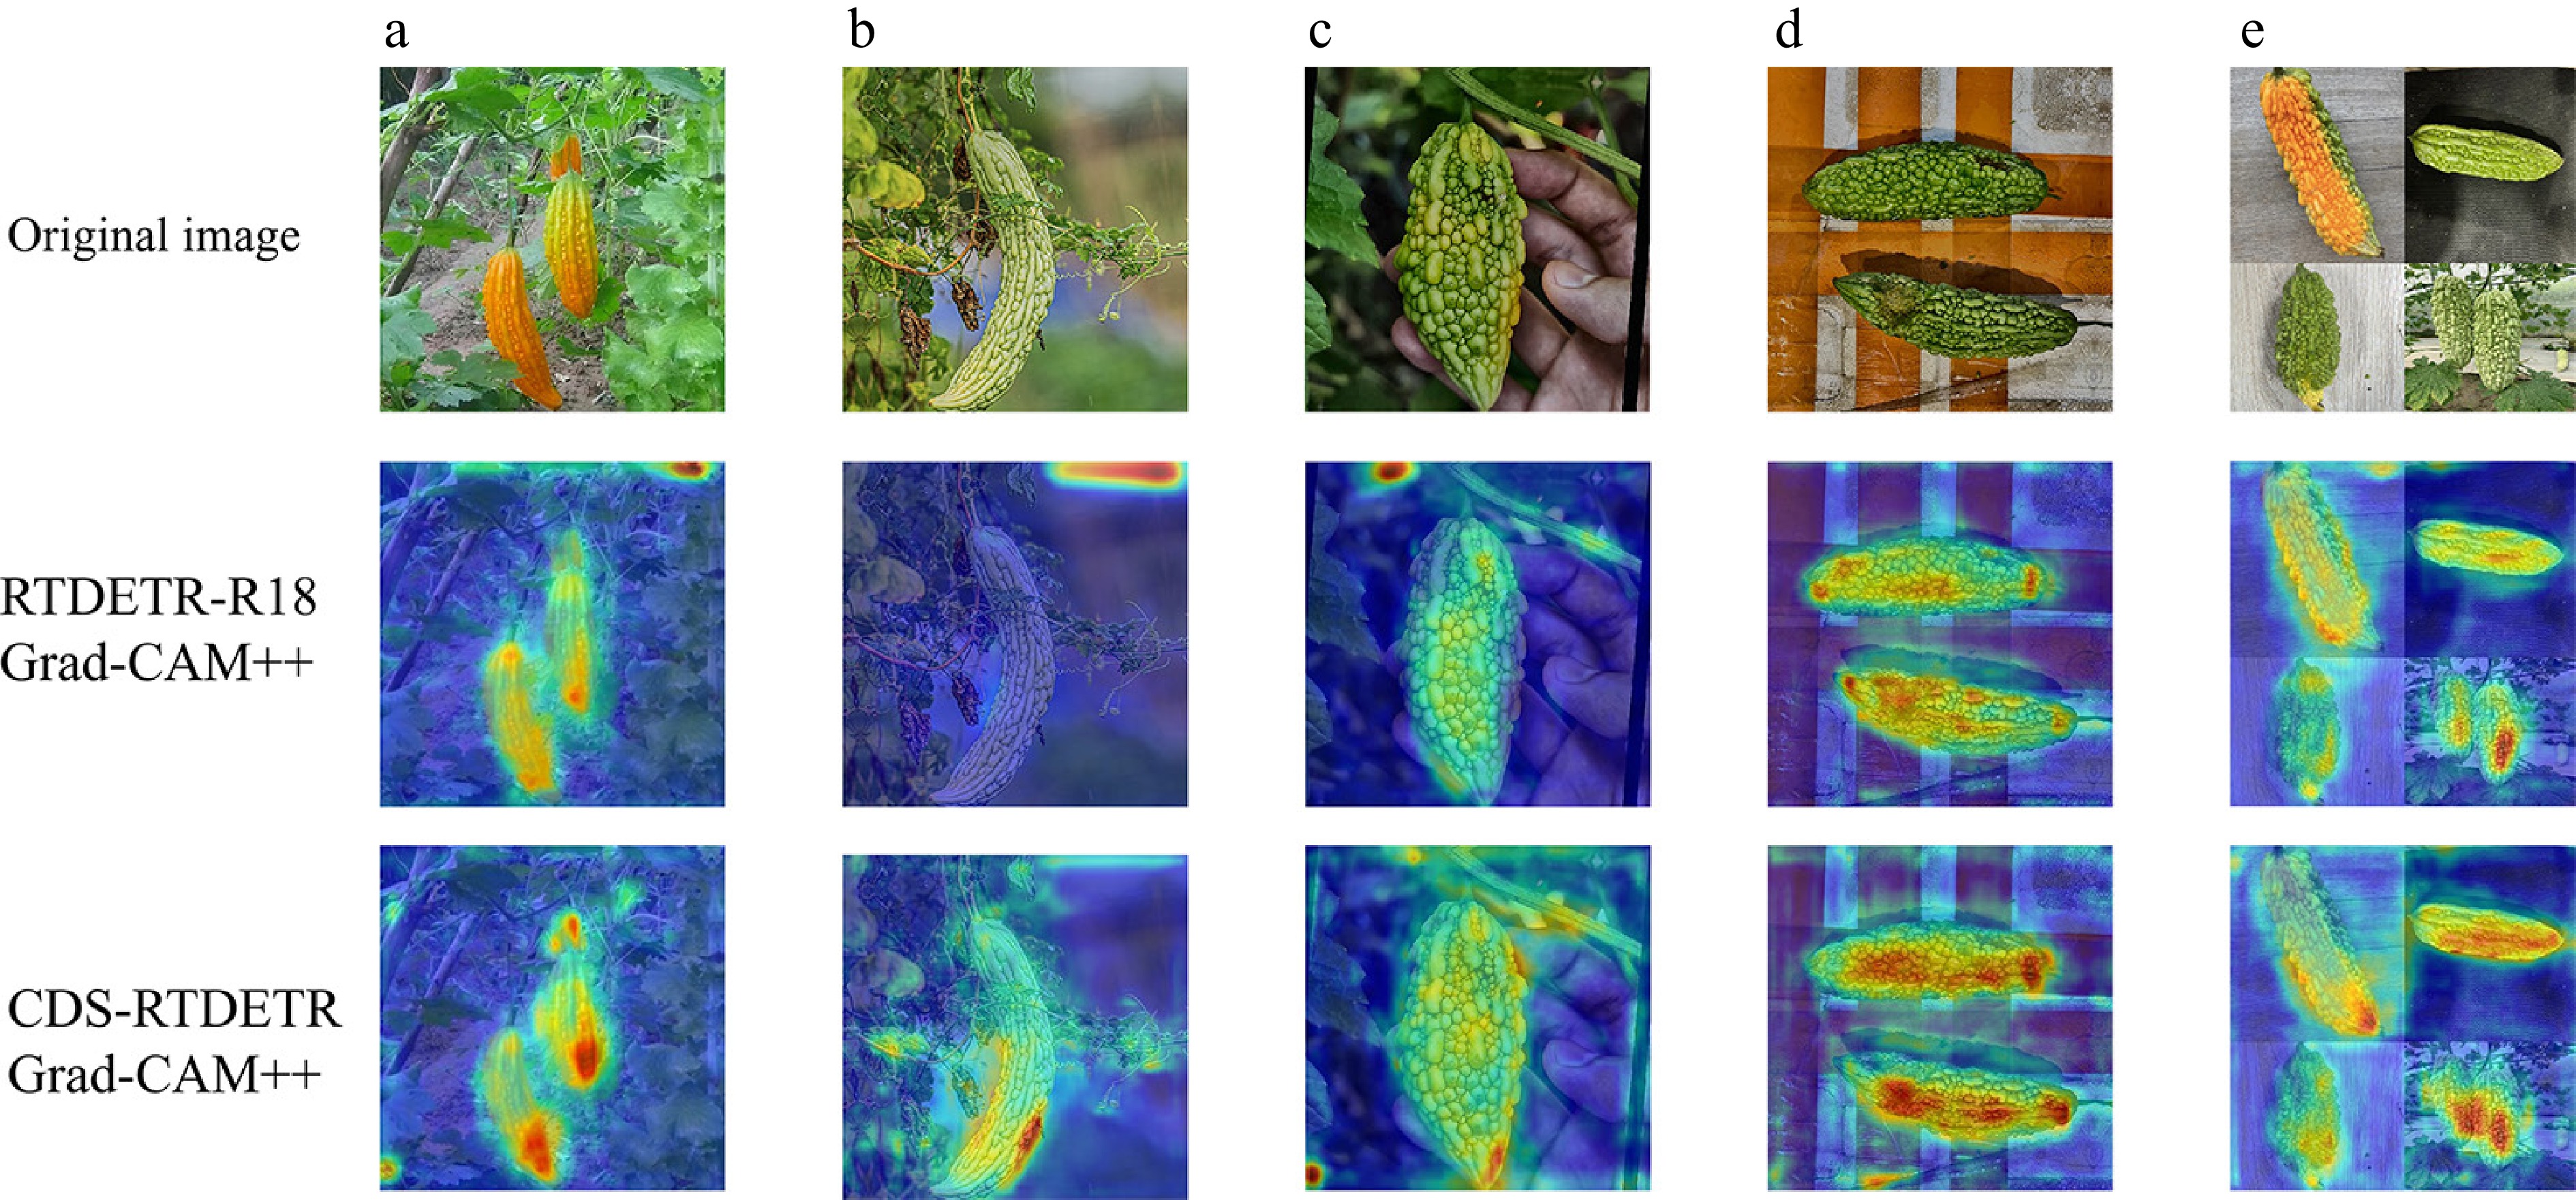
Figure 6.
Comparison of Grad-CAM++ heatmaps. (a)–(e) Five independent representative samples selected from the test set, with each column corresponding to a different bitter gourd image. The top row shows the original images, the middle row presents the activation maps generated by RTDETR-R18, and the bottom row presents the activation maps generated by CDS-RTDETR. The color scale ranges from blue (low attention) to yellow (medium attention) to red (high attention), representing the attention intensity of the models on defect-related regions. Warmer colors indicate stronger activation and more precise localization.
-
The core challenge in external defect detection of bitter gourd lies in the fact that the fruit surface is densely covered with tubercles and ridge structures, where normal regions and early-stage defects exhibit high visual similarity. Meanwhile, the fruit presents a curved, elongated shape with large variations in defect scales and random distribution locations, imposing high demands on the fine-grained discriminative capability and multi-scale feature representation of the detection model. This study takes RTDETR-R18 as the baseline and proposes the CDS-RTDETR model, which introduces the CGA and DySample, dynamic upsampler, and a Shape-IoU loss function to achieve targeted improvements at three levels: feature encoding efficiency, upsampling quality, and bounding box regression accuracy, respectively. Experimental results demonstrate that the proposed model outperforms the baseline in both detection accuracy and inference efficiency, validating the effectiveness of the improvement strategies. The following sections further analyze the key differences observed in the comparative experiments and discuss the limitations and future directions of this study.
Certain limitations remain in this study, and future work will be carried out in the following aspects. First, the current dataset is still insufficient in terms of bitter gourd variety and scene diversity. Subsequent efforts will collect images of more varieties and from different geographical regions to enhance the model's generalization capability. Second, the detection accuracy for Pests and Diseases (PD) still has room for improvement. Future work will explore mechanisms such as fine-grained classification or prototype learning to strengthen the model's feature response to subtle lesions. Finally, although CDS-RTDETR achieves excellent inference speed on GPU platforms, its deployment performance on edge devices such as Jetson Nano remains to be verified. Subsequent work will complete model quantization and deployment testing to evaluate its operational performance in actual production lines.
The high precision and real-time performance demonstrated by CDS-RTDETR in external defect detection of bitter gourd provide technical support for automated postharvest sorting of bitter gourd. The model can be integrated into postharvest sorting pipelines to enable real-time online inspection and grading of bitter gourd fruit appearance quality. Its technical framework can also be transferred to defect detection tasks for other fruits and vegetables with complex surface textures, such as cucumber and loofah, demonstrating good potential for generalization. In summary, this study provides an efficient and accurate detection method for intelligent postharvest sorting of bitter gourd, and holds positive significance for promoting the digital transformation of quality control for specialty agricultural products.
-
This study addresses the challenges in external defect detection of bitter gourd, including severe interference from surface tuberous texture, large variations in defect scales, and resource constraints for edge deployment. Taking RTDETR-R18 as the baseline, a CDS-RTDETR model is proposed. By introducing CGA to reduce the computational redundancy of multi-head self-attention, adopting the DySample dynamic upsampler to improve defect edge localization accuracy, and introducing the Shape-IoU loss function to strengthen the alignment regression constraints for elongated fruit, the model achieves simultaneous improvements in detection accuracy and inference efficiency. Experimental results demonstrate that CDS-RTDETR achieves a mAP50 of 90.35%, representing a 2.62% improvement over the baseline, and an inference speed of 341.08 FPS, a 35.8% increase over the baseline. The model meets real-time requirements while maintaining high detection accuracy, providing an efficient and accurate detection solution for automated postharvest sorting of bitter gourd. Future work will focus on expanding the dataset with diverse varieties, optimizing the recognition accuracy for the Pests and Diseases category, and completing quantization deployment validation on edge devices, to promote the practical application of this technology in real-world sorting scenarios.
We thank all colleagues and peers who provided assistance during this work, and we sincerely appreciate the reviewers' constructive comments that helped improve this manuscript.
-
Not applicable.
-
The authors confirm contribution to the paper as follows: study conception and design: Deng Y, Zhong F, Cai Y; data collection: Deng Y, Cai Y, Jin W, Zhong X, Xu H, Tian J, Ma L, Xue C, Wang J, Li H, Huang Z, Zhang Q; analysis and interpretation of results: Deng Y, Cai Y, Jin W, Zhong F; draft manuscript preparation: Deng Y, Cai Y, Jin W; writing – review & editing: Zhong F, Lin Z, Xu H; supervision: Zhong F; funding acquisition: Zhong F. All authors reviewed the results and approved the final version of the manuscript.
-
All data generated and analyzed during this study are available from the corresponding author on reasonable request.
-
Honglong Li and Zedong Huang are affiliated with Fujian Tianmei Seed Industry Technology Co., Ltd, which provided the image collection sites for this research. The authors declare that the research was conducted in the absence of any commercial or financial relationships that could be construed as a potential conflict of interest.
-
Copyright © 2026 by the author(s).
Engineering in Life Sciences published by Maximum Academic Press on behalf of John Wiley & Sons Ltd. This is an open access article under the terms of the Creative Commons Attribution License, which permits use, distribution and reproduction in any medium, provided the original work is properly cited. -
About this article
Cite this article
Deng Y, Cai Y, Jin W, Zhong X, Xu H, et al. 2026. CDS-RTDETR: a real-time detection model for bitter gourd surface defects. Engineering in Life Sciences x: e014 doi: 10.48130/els-0026-0011 

CDS-RTDETR: a real-time detection model for bitter gourd surface defects
- Received: 08 July 2026
- Revised: 29 July 2026
- Accepted: 27 August 2026
- Published online: 29 September 2026
Abstract: Bitter gourd, as an important vegetable with both edible and medicinal value, has its external quality directly determining commercial value and postharvest loss rates. However, the fruit surface is densely covered with tubercles and ridge structures, and the fruit presents a curved, elongated shape, which imposes significant limitations on the conventional RT-DETR model. Specifically, its multi-head self-attention mechanism is prone to head redundancy in dense texture regions; the nearest-neighbor interpolation upsampling fails to recover fine edge details of defects; and the standard GIoU loss provides insufficient constraint on the minor axes of elongated targets. To address these limitations, this paper proposes the CDS-RTDETR detection model. In the feature encoding stage, Cascaded Group Attention (CGA) is introduced to replace the multi-head self-attention, suppressing the interference of tuberous texture on defect features. In the upsampling stage, the DySample dynamic upsampler is adopted instead of nearest-neighbor interpolation, recovering edge details of defects and improving boundary fidelity. In the bounding box regression stage, the Shape-IoU loss function is introduced to replace GIoU, strengthening short-edge constraints and enhancing localization accuracy for elongated fruit. Experimental results demonstrate that CDS-RTDETR achieves a mAP50 of 90.35%, which is 2.62% higher than that of the baseline model, and an inference speed of 341.08 FPS, representing a 35.8% improvement over the baseline, providing an efficient and accurate technical solution for intelligent postharvest sorting of bitter gourd.
-
Key words:
- Bitter gourd /
- External defect detection /
- Postharvest sorting /
- Deep learning /
- CDS-RTDETR