


-
With the rapid development of tunnel technology, the urban metro has become the preferred means of travel for residents due to its speed and convenience. It is a critical aspect of daily life[1−4]. In addition to the increasing number of subway lines and hubs, the scale of subway stations is also expanding. Some interchange stations have been merged with the surrounding commercial buildings, forming a large-scale transportation and commercial complex. However, the pedestrian pressure on subways is increasing year by year. A fire may result in large casualties because pedestrians must navigate complex evacuation routes in a smoky environment[3,5]. Therefore, multiple exits are required for evacuation. Investigating the factors influencing pedestrians' exit selections during an evacuation is crucial for designing exits that ensure a safe and effective evacuation.
Previous studies have extensively explored pedestrian evacuation behaviors, including group dynamics[6], buffer zone effects[7], and leader-follower interactions[8]. However, these works primarily focus on unguided evacuations or static signage, leaving a critical gap in understanding how dynamic lighted guidance signs—capable of reflecting real-time exit congestion—influence exit re-selection, especially for heterogeneous pedestrian groups (e.g., sensitive vs insensitive individuals). To bridge this gap, animal experiments (e.g., mice[9], and ants[10]) have been used to simulate panic-induced behaviors, yet their applicability to human decision-making under lighted guidance remains untested. This study uniquely integrates real-time density-driven lighted signs with pedestrian classification (sensitive/insensitive) to quantitatively evaluate their joint impact on exit choices, leveraging both controlled experiments and social force modeling. Wang & Song[11] studied the effect of the exit location on the evacuation efficiency of ants. Zhang et al.[12] used additional stimuli to investigate the effect of room exit design on the evacuation efficiency of mice. Qiao et al.[13] used AnyLogic, based on the Social Forces Model, to simulate the impact of dedicated exits on the evacuation of vulnerable populations. It also provides a basis for the need for dedicated egress in different situations by calculating the OPS value.
Due to the complexity and instability of evacuation experiments, simulations have been increasingly used for evacuation experiments[14,15]. The social force model (SFM) has been widely used to study pedestrian evacuation, describing the pedestrian movement using a combined force approach[7,16]. Zhou et al.[17] improved the SFM by incorporating pedestrian classification into three categories: weight-bearing, ordinary, and panicked pedestrians. It was found that weight-bearing and panicked pedestrians caused difficulties in evacuation. Evacuation guidance is crucial in pedestrian evacuation; thus, evacuation signs have been studied by many scholars. Yuan et al.[18] analyzed the effect of two types of escape signs on evacuation efficiency and found that wall signs were more efficient and ground signs were safer. Hou et al.[19] improved the model and found that strategically setting well-trained leaders results in higher evacuation efficiency compared to randomly assigning 20 leaders. Huang et al.[20] proposed an evacuation model based on information transfer and rerouting and found that panic propagation intensifies information flow, improving evacuation efficiency.
Evacuation exits are a critical aspect of pedestrian evacuation research. Zhang et al.[21] proposed a multi-exit evacuation model based on a continuous model that considered the exit width, evacuation distance, and exit density as the primary factors for exit selection. They also analyzed the impact of the exit density and width on pedestrian evacuation efficiency. Wang et al.[22] considered the impact on pedestrian interaction in the SFM and combined the revised model with the multi-exit utility model, improving evacuation decision-making. Cai et al.[1] used the SFM with pedestrian classification and proposed an improved exit selection model based on the utility model. They analyzed the effect of different distance weighting coefficients and density weighting coefficients on the evacuation time. Zainuddin & Shuaib[23] considered the distance to the exit and the congestion at the exits and proposed a method that allows for changing the exit depending on congestion.
We explore the factors influencing pedestrians' choice of exits during an evacuation process and propose a strategy of lighted guidance signs based on the pedestrian density at the exit. The aim is to achieve a rational distribution and guidance of pedestrians, maximizing the efficiency of exit usage, and thereby reducing evacuation time.
This study is grounded in theories of herd behavior and information dissemination during emergencies. Herd behavior, where individuals mimic collective actions rather than independent decisions[10], is critical in high-density evacuations. Our lighted guidance signs counteract this by providing decentralized, real-time information, reducing reliance on crowd mimicry[15].
Furthermore, the signs align with information dissemination models[20], where panic propagation intensifies information flow. By dynamically signaling exit densities, our system optimizes information transfer, enabling pedestrians to make rational rerouting choices[18]. This theoretical integration ensures our experimental design captures both behavioral and informational dynamics in evacuations.
-
Huang et al.[20] found that the H-shape is a common shape of subway stations. However, since the concourse is quite lengthy, horizontal changes in exits are uncommon in practical situations. Therefore, a part of a subway station was selected to conduct a small-scale evacuation experiment, as shown in Fig. 1. Three evacuation scenarios were investigated:
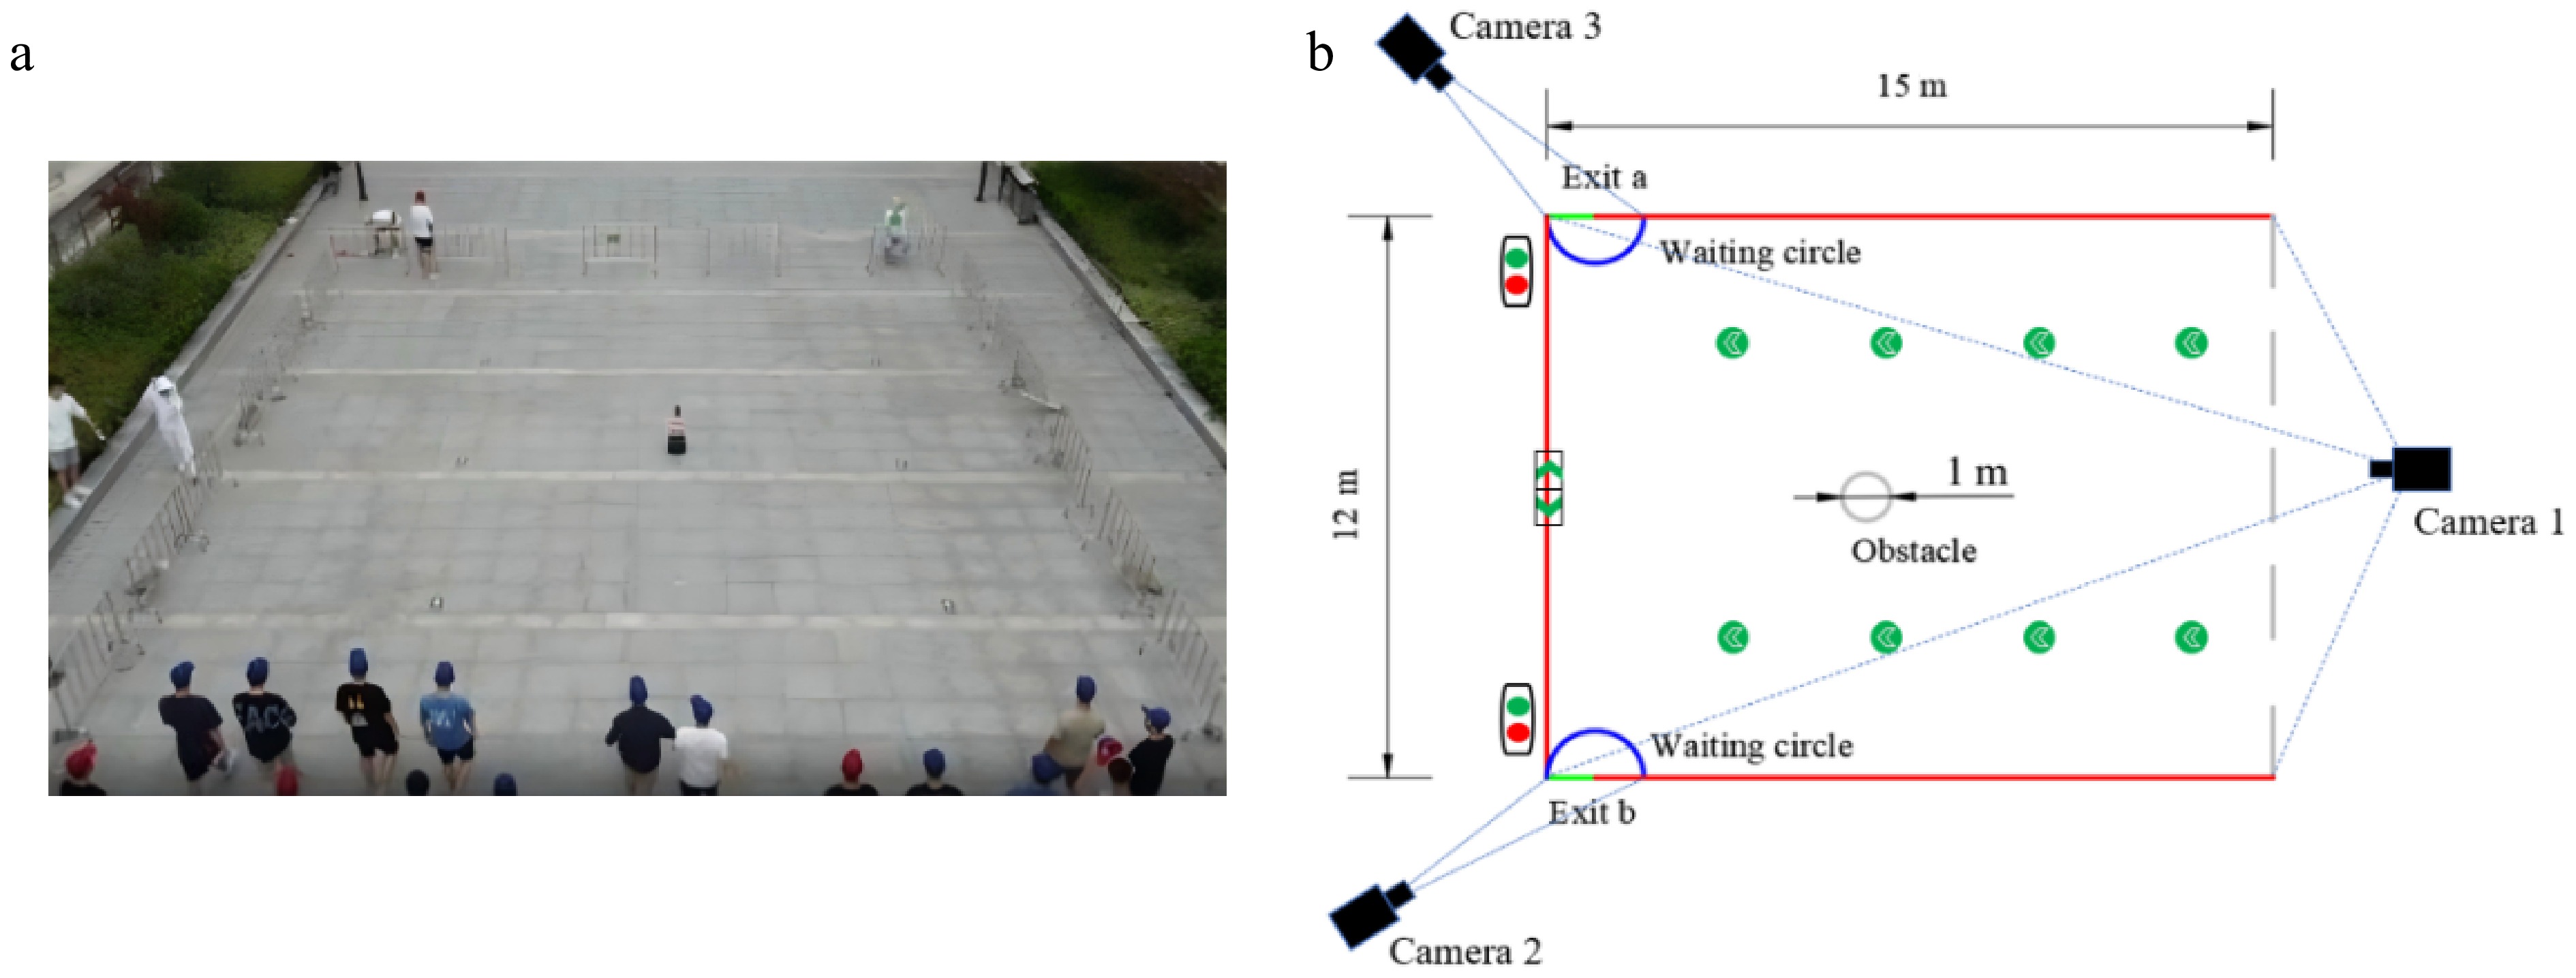
Figure 1.
Experimental scene: (a) real view, (b) schematic diagram.
(1) Evacuation with no lighted guidance signs. Two factors are considered: the number of pedestrians, and the exit width. The experimental conditions are listed in Table 1.
Table 1. Scenario 1 experimental conditions.
Number of pedestrians Exit width 60 a: 1 m, b: 1 m 60 a: 1.5 m, b: 1 m 80 a: 1 m, b: 1 m 80 a: 1.5 m, b: 1 m 100 a: 1 m, b: 1 m 100 a: 1.5 m, b: 1 m (2) Evacuation with lighted guidance signs. The pedestrian density near the exit was considered in addition to the distance and width. Therefore, we established a waiting area according to the exit width and used lighted guidance signs that indicated when pedestrians could enter the exit based on the density (Fig. 2). When the density was sufficiently low, the experimental staff turned on a green light sign to indicate that the exit could be entered. A red light was used to warn volunteers that the exit was blocked. At this time, the pedestrians were divided into two categories: 1) sensitive pedestrians who exhibited a normal response to the lighted guidance signs; and 2) insensitive pedestrians who were less affected by the lighted guidance signs (Table 2).
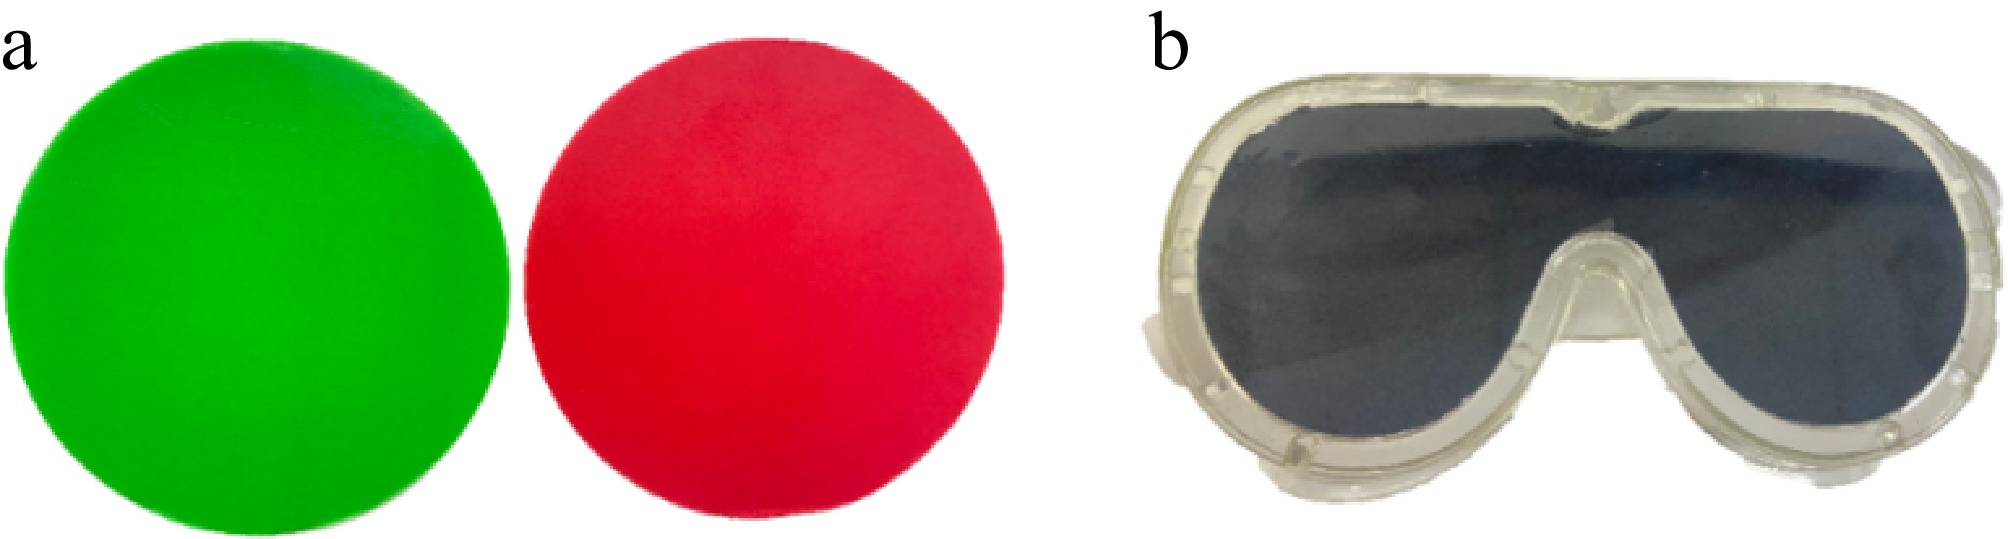
Figure 2.
Experimental equipment: (a) lighted guidance signs, (b) 50% opacity glasses.
Table 2. Scenario 2/3 experimental conditions.
Number of sensitive pedestrians Number of insensitive pedestrians Exit width 70 10 a: 1 m, b: 1 m 70 10 a: 1.5 m, b: 1 m 60 20 a: 1 m, b: 1 m 60 20 a: 1.5 m, b: 1 m 50 30 a: 1 m, b: 1 m 50 30 a: 1.5 m, b: 1 m 40 40 a: 1 m, b: 1 m 40 40 a: 1.5 m, b: 1 m (3) Evacuation with lighted guidance signs in a low-view environment. This scenario represented the low-view environment during a fire. The volunteers wore glasses with 50% opacity (Fig. 2b) to investigate the effect of illuminated guidance signs on pedestrian exit selection under low visibility conditions. The experimental conditions are listed in Table 2.
The experiment was conducted on June 27, 2022, at Nanjing Tech University (Nanjing, China) with 100 graduate and undergraduate students, whose average height was 171.25 cm and whose age range was 22−25 years.
Figure 1 shows the schematic diagram of the experiment. The evacuation lane was 15 m * 12 m, with two exits (exit a and exit b). There is no railing at the bottom to facilitate volunteers entering the evacuation lane. Three cameras were installed near and in the evacuation tunnel to record the experimental process. The experiments with different working conditions were repeated three times to improve the accuracy of the experimental data.
The volunteers were randomly located in the evacuation lane. The evacuation timing was initiated by the whistle, and the process concluded once the last volunteer had exited the tunnel.
The hats worn by the volunteers during the experiment were used to detect and track them using Tracker software, which utilizes automatic recognition with manual adjustment in extracting coordinates. The tracking data were captured at 5 frames per second. However, the tilt angle between the camera and the horizontal plane resulted in image distortion. Direct linear transformation (DLT) was used for calibration, converting trajectories from image coordinates to real-world coordinates to minimize image distortion[24].
The rationale for classifying pedestrians into 'sensitive' and 'insensitive' categories is based on their responsiveness to lighted guidance signs. Sensitive pedestrians are defined as those who actively adjust their evacuation paths in response to real-time density signals (green/red lights), while insensitive pedestrians are those who ignore such signals and adhere to their initial exit choices. This classification reflects real-world evacuation scenarios where individuals exhibit varying levels of compliance with guidance systems[10].
Additionally, the experimental design accounts for potential herd behavior and panic-induced disorientation by simulating dynamic density thresholds[16]. The lighted signs serve as a mechanism to mitigate panic by providing clear, real-time information, thereby reducing chaotic decision-making[20]. The low-view environment further tests the robustness of these signs under impaired visibility, mimicking smoke-filled conditions during emergencies[5].
Mathematical model
Density threshold
-
Pedestrian exit selection is dynamic and complex[21]. Pedestrians cannot choose the nearest exit during a disaster because factors other than the distance to the exit affect pedestrians' exit selection, such as the exit width and the pedestrian density at the exit. If pedestrians have sufficient time to consider different factors, they prefer a moderate exit distance, a wide exit width, and low pedestrian density.
Based on the effect of the relative pedestrian density at the exit on the pedestrians' choice of exit, a density threshold was set to classify the pedestrian density at the exit into two cases: (1) the pedestrian density is below the threshold, and the exit is clear; (2) the pedestrian density is above the threshold, and the exit is blocked.
We define pedestrian density as the number of pedestrians in the exit waiting area, which is a semicircle with radius λwm. The relative pedestrian density is den, and the density function g(den) is defined as follows:
$ {de}_{n}=\dfrac{2{\text π} {i}^{2}}{{\text π} {\left(\mathrm{\lambda }{\mathrm{w}}_{n}\right)}^{2}} $ (1) $ g\left(de_n\right)\left\{\begin{array}{l}de_n^{max}\, ,\, \quad de_n\le de_n^{max}\, ,\, \quad flagsign=1 \\ de_n\ ,\ \quad de_n \gt de_n^{max}\ ,\ \quad flagsign=0\end{array}\right. $ (2) where, den denotes the density of pedestrians in the exit waiting area, λ represents the adjustment factor of the exit waiting area, wn represents the width of exit n, i represents the pedestrian clearance radius, denmax represents the density threshold of the exit waiting area, which is 0.5 based on initial density experiments. Flagsign represents the lighted guidance signs, 1 represents a green light (the exit is clear); 0 represents a red light (the exit is blocked).
The likelihood of a pedestrian choosing an exit is expressed as a probability. The distance from that pedestrian to the exit, the relative density of pedestrians in the exit waiting area, and the exit width are three factors affecting the probability. The final exit selection model is defined based on the weighted sum of the three factors.
The exit choice model by Zhang et al.[21] was used, and the density-influencing factors were modified (setting the density threshold). The modified model was combined with the SFM, and the three factors affecting the pedestrians' exit choice were defined as follows:
$ {P}_{n}\left(s\right)=\dfrac{{{s}_{n}}^{-{k}_{s}}}{{\sum }_{n=1}^{N}{{s}_{n}}^{-{k}_{s}}} $ (3) $ {P}_{n}\left(w\right)=\dfrac{{{w}_{n}}^{{k}_{w}}}{{\sum }_{n=1}^{N}{{w}_{n}}^{{k}_{w}}} $ (4) $ {P}_{n}\left(de\right)=\dfrac{{g\left({de}_{n}\right)}^{-{k}_{de}}}{{\sum }_{n=1}^{N}{g\left({de}_{n}\right)}^{-{k}_{de}}} $ (5) where, N denotes the number of exits, Pn(s) denotes the probability of pedestrians choosing an exit when only the exit distance is considered, Pn(w) denotes the probability of pedestrians choosing an exit when only the exit width is considered, and Pn(de) denotes the probability of pedestrians choosing an exit when only the density of pedestrians in the exit waiting area is considered; sn represents the distance from the pedestrians to exit n, wn denotes the width of exit n, and ks, kw, and kde denote the distance index, width index, and density index, respectively, affecting the influence degree of the factors on the exit choice.
The weights of the three factors are defined as follows:
$ \alpha =\dfrac{1}{N}{\textstyle\sum _{n=1}^{N}\bigg|\dfrac{N{s}_{n}}{S}\bigg|}^{{k}_{\alpha }} $ (6) $ \beta =\dfrac{1}{N}{\textstyle\sum _{n=1}^{N}\bigg|\dfrac{N{w}_{n}}{W}\bigg|}^{{k}_{\beta }} $ (7) $ \gamma =\dfrac{1}{N}{\textstyle\sum _{n=1}^{N}\bigg|\dfrac{N{de}_{n}}{D}\bigg|}^{{k}_{\gamma }} $ (8) where, α, β, and γ represent the weights of the three factors, respectively:
$ ={\sum }_{n=1}^{N}{s}_{n} $ $ W={\sum }_{n=1}^{N}{w}_{n} $ $ D={\sum }_{n=1}^{N}{de}_{n} $ $ {P}_{n}=\dfrac{\alpha {P}_{n}\left(s\right)+\beta {P}_{n}\left(w\right)+\gamma {P}_{n}\left(de\right)}{\alpha +\beta +\gamma } $ (9) where, Pn denotes the probability of pedestrians choosing exit n. The parameters of the pedestrian exit selection model are listed in Table 3.
Table 3. Parameters' value of multi-exit selection model.
λ denmax ks kw kde kα kβ kγ 1 0.5 1 1 1 1 1 1 Consider the social force model of lighting guidance
-
The SFM is a multi-factor model based on Newtonian mechanics[7,16]. The model considers the driving force of pedestrians, the interaction force between pedestrians, and the interaction force between pedestrians and obstacles. We incorporated the effect of lighted guidance signs on pedestrians based on the modified SFM proposed by Cai et al.[25]. Thus, the SFM in this study is defined as:
$ \dfrac{d{{\boldsymbol v}}_{i}}{dt}={m}_{i}\dfrac{{{\boldsymbol v}}_{i}^{0}\left(t\right){{\boldsymbol e}}_{i}^{0}\left(t\right)-{{\boldsymbol v}}_{i}\left(t\right)}{{\tau }_{i}}+\textstyle\sum _{j}{{\boldsymbol f}}_{ij}+\textstyle\sum _{W}{{\boldsymbol f}}_{iw}+{{\boldsymbol f}}_{il} $ (10) $ {{\boldsymbol f}}_{il}={C}_{i}{e}^{\left.{\left(r\right.}_{i}-{d}_{il}\right)/{D}_{i}}{\boldsymbol{h}}_{il} $ (11) $ {\boldsymbol{h}}_{il}=\dfrac{{\boldsymbol{r}}_{l}-{\boldsymbol{r}}_{i}}{\left|{\boldsymbol{r}}_{l}-{\boldsymbol{r}}_{i}\right.|} $ (12) where, i, j, and w represent pedestrians, surrounding pedestrians, and obstacles, respectively, mi is the mass of pedestrian i, vi0(t) represents the desired velocity of pedestrian i, ei0(t) is the desired velocity direction, vi(t) is the real-time velocity of pedestrian i at time t, and τi denotes the interval of the pedestrian response time; fil denotes the attraction force of the lighted guidance signs on pedestrians, Ci represents the coefficient of attraction strength, which is a negative value, Di denotes the constant describing the effect of distance on the attraction force, hil denotes the unit vector from the lighted guidance signs to pedestrian i; rl denotes the position of the lighted guidance signs, and the remaining parameters are the same as in the study by Cai et al.[25].
In the original SFM, pedestrian categories and expected speeds are quite uniform. However, during an evacuation, pedestrians can be divided into two categories (sensitive and insensitive pedestrians) according to their sensitivity to the lighted guidance signs. Besides, small-scale experiments have shown that an exit with a green signal is more attractive to pedestrians when there is a secondary exit. Therefore, the original SFM was modified by considering the pedestrian classification and the attractiveness of the green signal to pedestrians. The following pedestrian classification strategy was used: (1) Sensitive pedestrians respond positively when they see the color signal of the lighted guidance signs during an evacuation. When the light at one exit turns red and the light at the other exit is green, sensitive pedestrians choose the exit with the green light. When the lights at both exits are red, pedestrians choose the exit according to the exit width, distance, and other factors; (2) Insensitive pedestrians do not respond positively to the color signal of the lighted guidance signs and always choose the initially planned exit during an evacuation.
Simulation setup
-
The simulation framework was implemented in C language on a Linux platform, leveraging the modified Social Force Model and exit choice model to replicate experimental conditions. Key parameters include:
Software: tracker for pedestrian trajectory extraction, with manual calibration via Direct Linear Transformation (DLT) to correct image distortion[24].
Independence analysis: each simulation was run five times with randomized pedestrian initial positions; results showed < 5% variance in evacuation times, confirming reproducibility.
Scenario mapping: the simulation geometry (Fig. 3) mirrored the experimental H-shaped station (Fig. 1), with lighted signs placed at coordinates (0,6), (3,4), (3,7), (3,10), (3,13), (9,4), (9,7), (9,10), and (9,13) to match real-world positions.
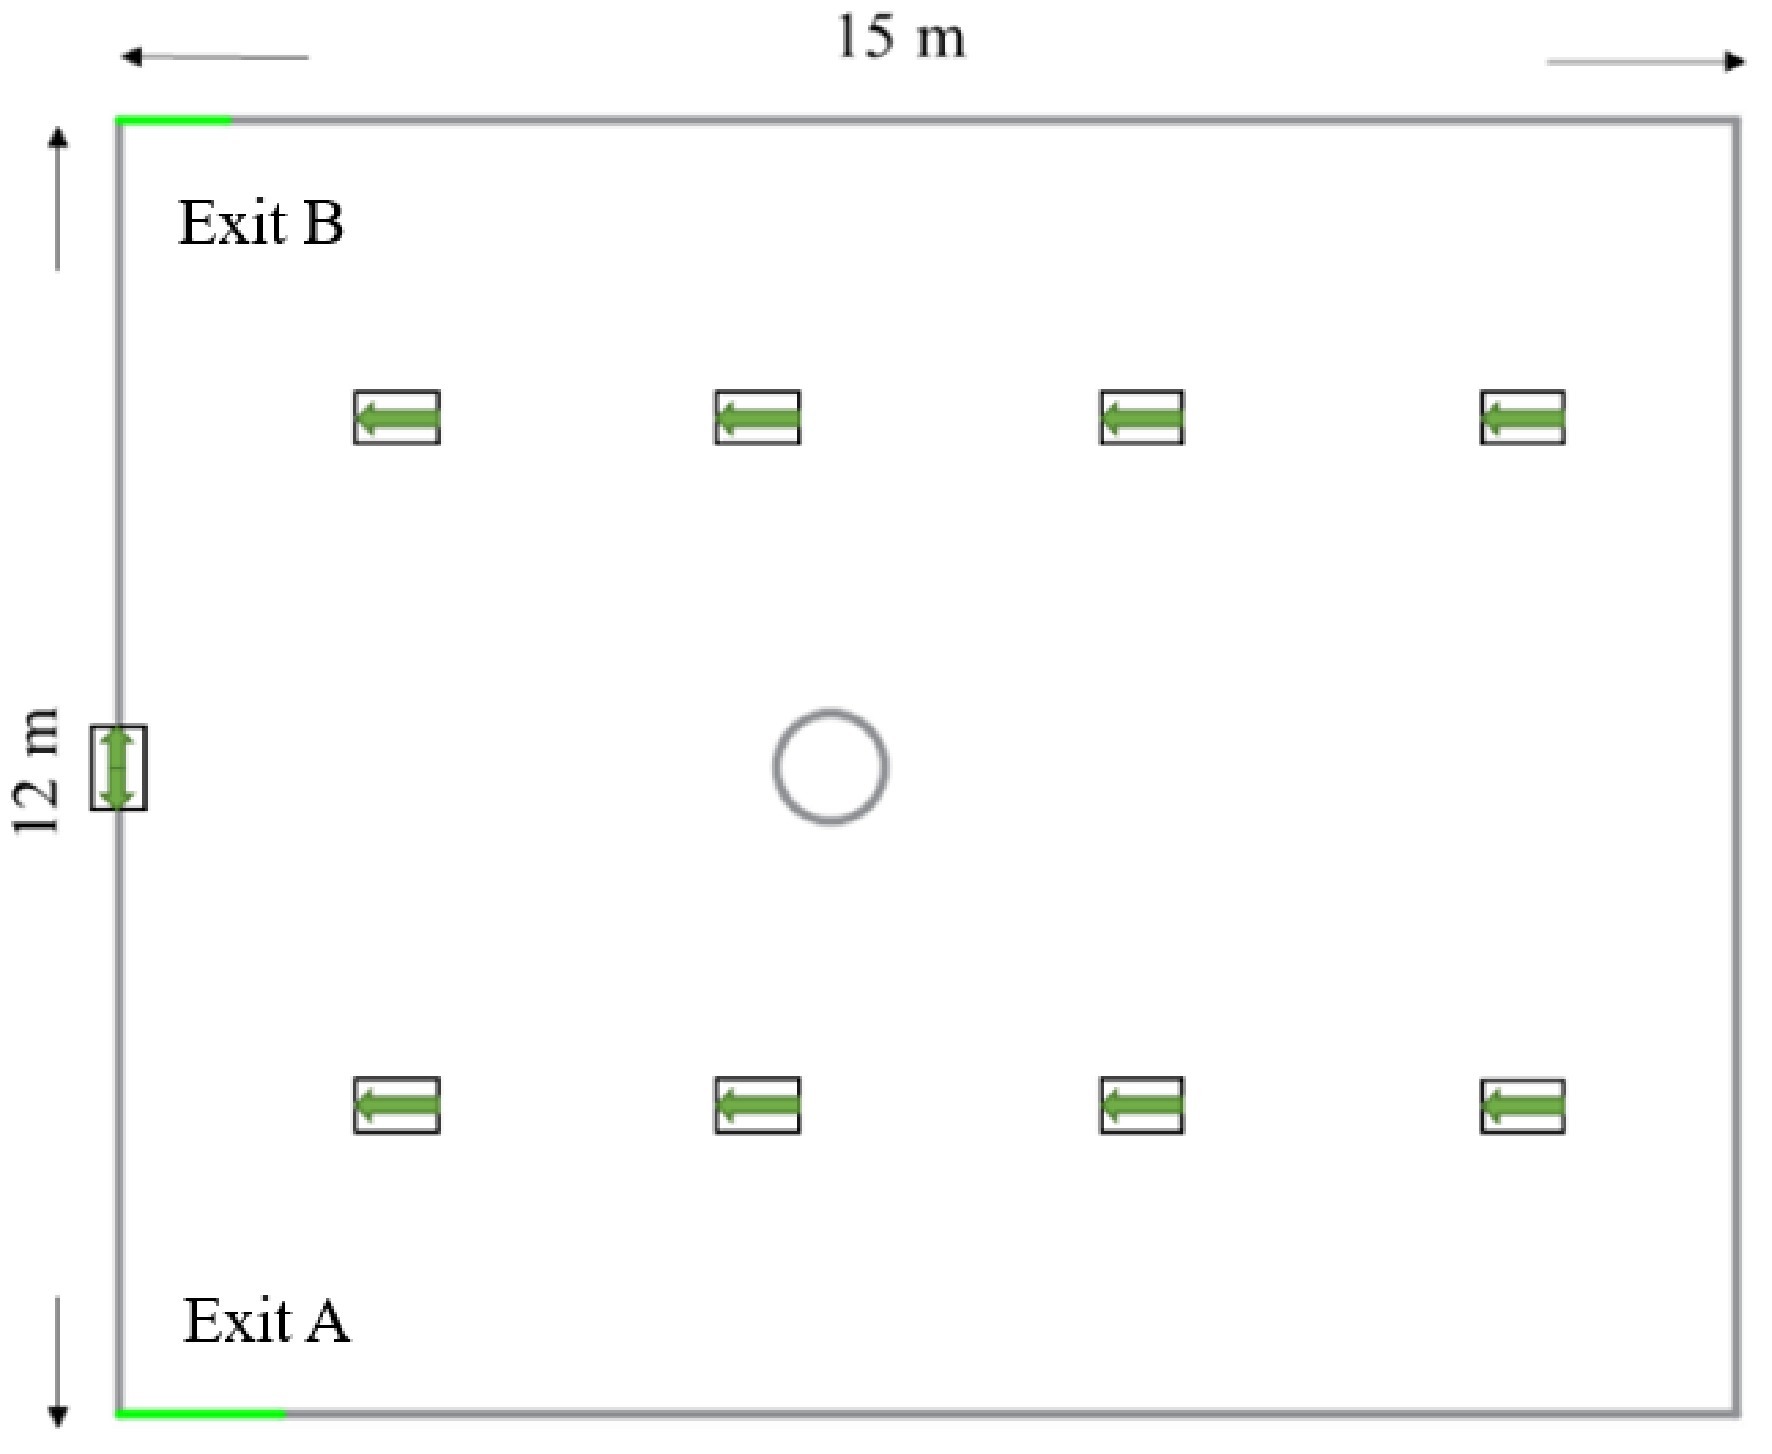
Figure 3.
Multi-exit simulation scenario.
Pedestrian agents: sensitive/insensitive pedestrians were assigned behavioral rules.
This setup aligns with our previous work[25], where identical models and parameters were validated against empirical data.
-
The average speed of the volunteers in the experiment was manually extracted from the video due to unpredictable situations, such as volunteers' lack of concentration or short evacuation distances. Only 90% of the total data was utilized (Fig. 4). The definitions of A~E are described in Table 4.
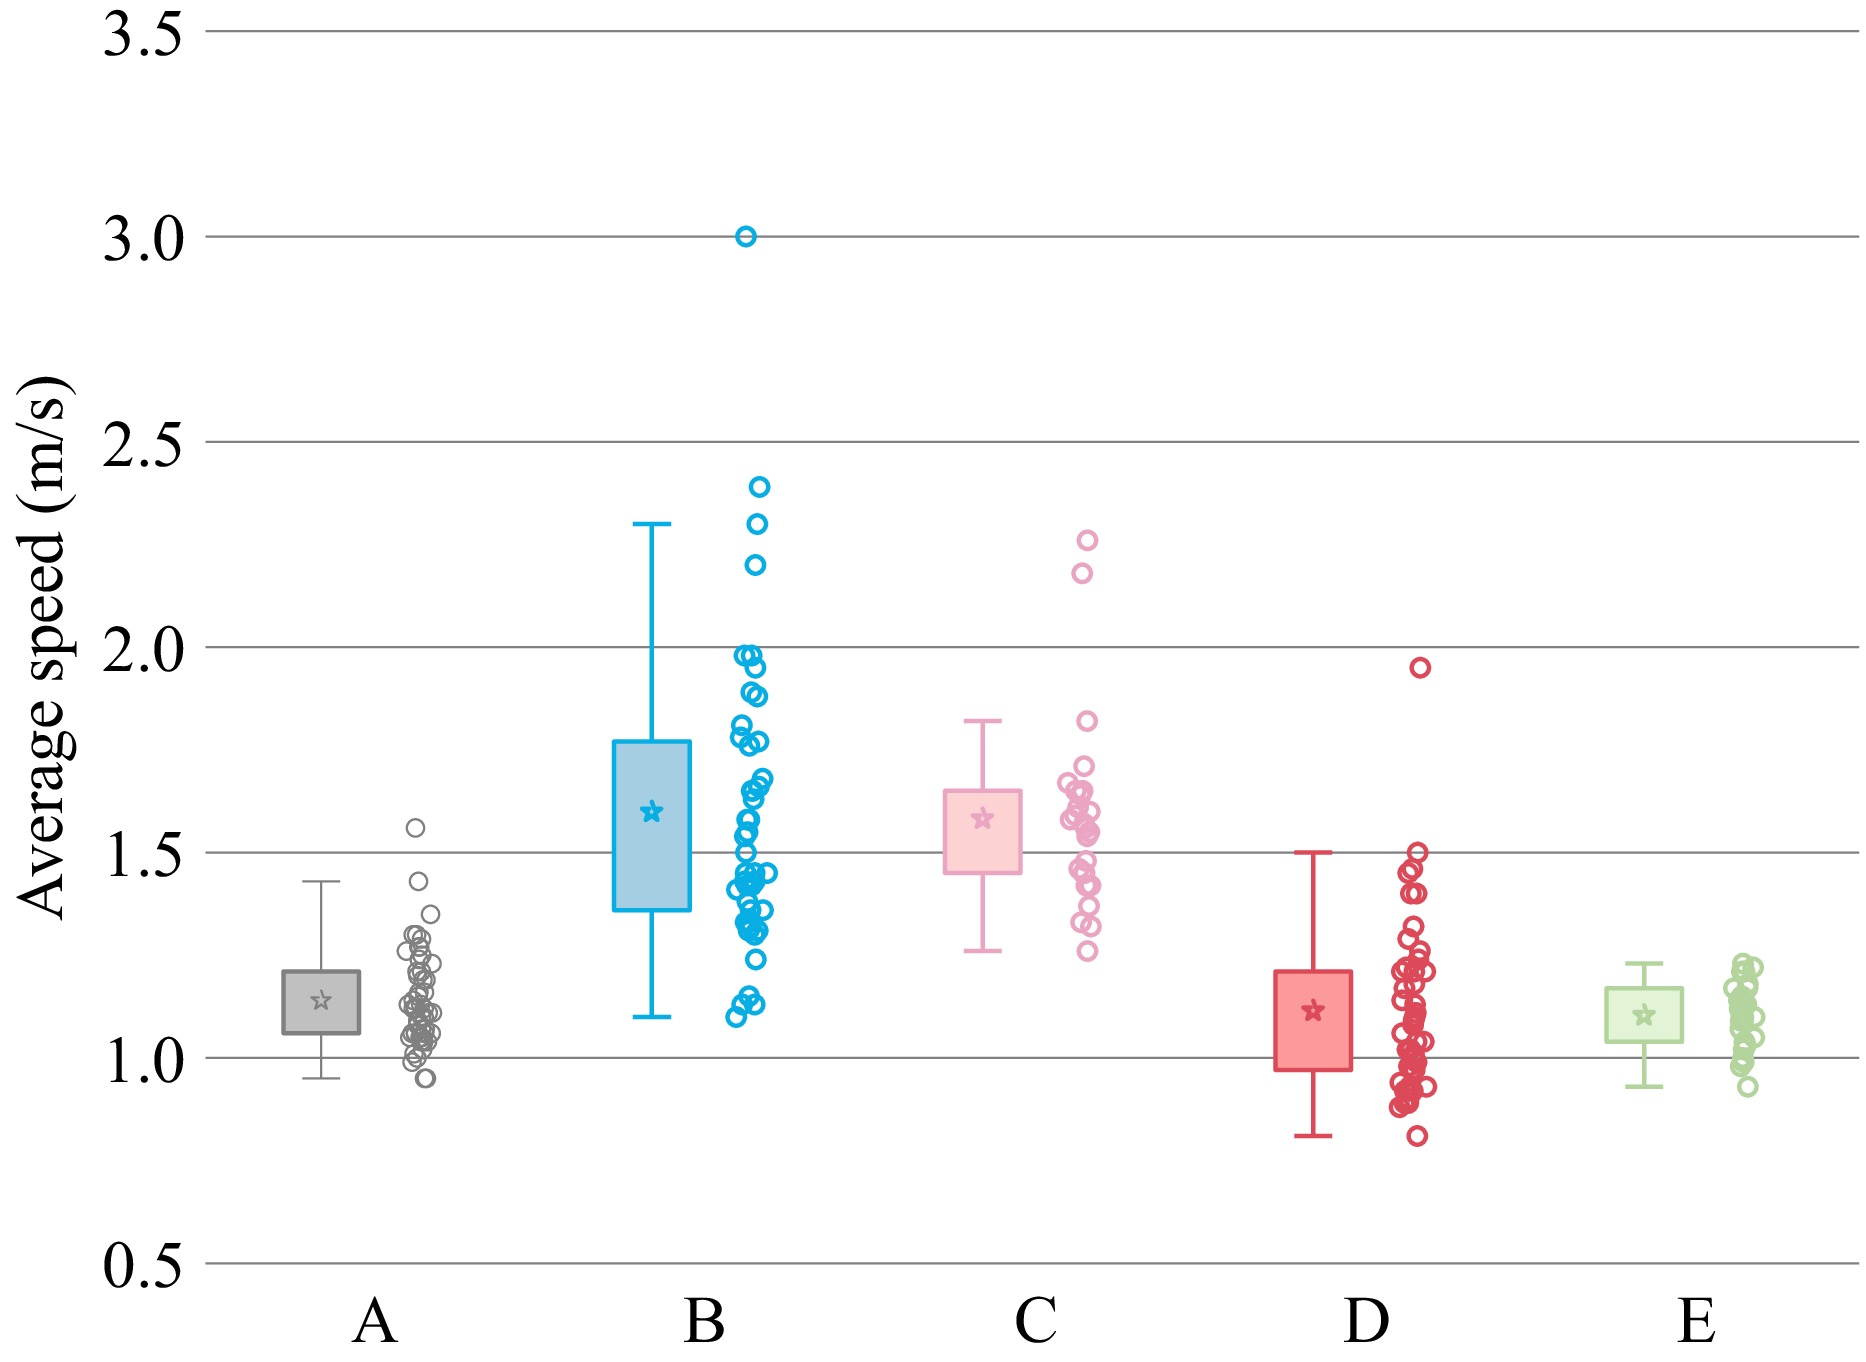
Figure 4.
Box diagram of average pedestrian speed, ☆ represents the average value, the upper part of the whisker line represents an abnormal value.
Table 4. Definition of ABCDE in Fig. 4.
Meaning A Average speed of pedestrians without lighted guidance signs B Average speed of sensitive pedestrians under lighted guidance signs C Average speed of insensitive pedestrians under lighted guidance signs D Average speed of sensitive pedestrians under lighted guidance signs in the low view E Average speed of insensitive pedestrians under lighted guidance signs in the low view In A, pedestrians choose the exit according to the distance and exit width, and the pedestrian path does not change significantly during the evacuation. The pedestrian speed is relatively concentrated at this time. B and C represent the average speed of sensitive and insensitive pedestrians, respectively. At this time, lighted guidance signs are added to the scene, and the average speed of pedestrians increases significantly because they are attracted by the lighted sign. Sensitive pedestrians change their exit choices because of the lighted sign. Therefore, their average speed is relatively dispersed. Insensitive pedestrians are less affected by the lighted sign, and their speed is less variable. D and E, respectively, represent the average speed of pedestrians wearing glasses with 50% opacity. The speed distribution of the two types of pedestrians is similar to that of B and C, but the overall speed decreases due to the limited field of vision. The speed of the pedestrians was used in a simulation written in C language and implemented on a Linux platform. The simulation scenario in Fig. 3 is based on the experimental scenario in Fig. 1, where the position of the evacuation signs has been replaced by coordinates. We used nine evacuation signs with coordinates of (0,6), (3,4), (3,7), (3,10), (3,13), (9,4), (9,7), (9,10), and (9,13). When the pedestrians leave the exit, they are automatically removed by the system. Each working condition was simulated five times, and the average value was used.
Evacuation with no lighted guidance signs (distance and exit width)
-
The average pedestrian speed in the box plot was used in the simulation of Scenario 1. The comparison of the simulation and experimental results is shown in Fig. 5. The results of experiments and simulations show similar trends. The evacuation time increases with the number of pedestrians from 60 to 80 to 100. Increasing the exit width reduces the evacuation time. The evacuation time difference between the two exit widths is the largest for 80 pedestrians. The evacuation time at the two exits under these conditions was analyzed to investigate the reasons.
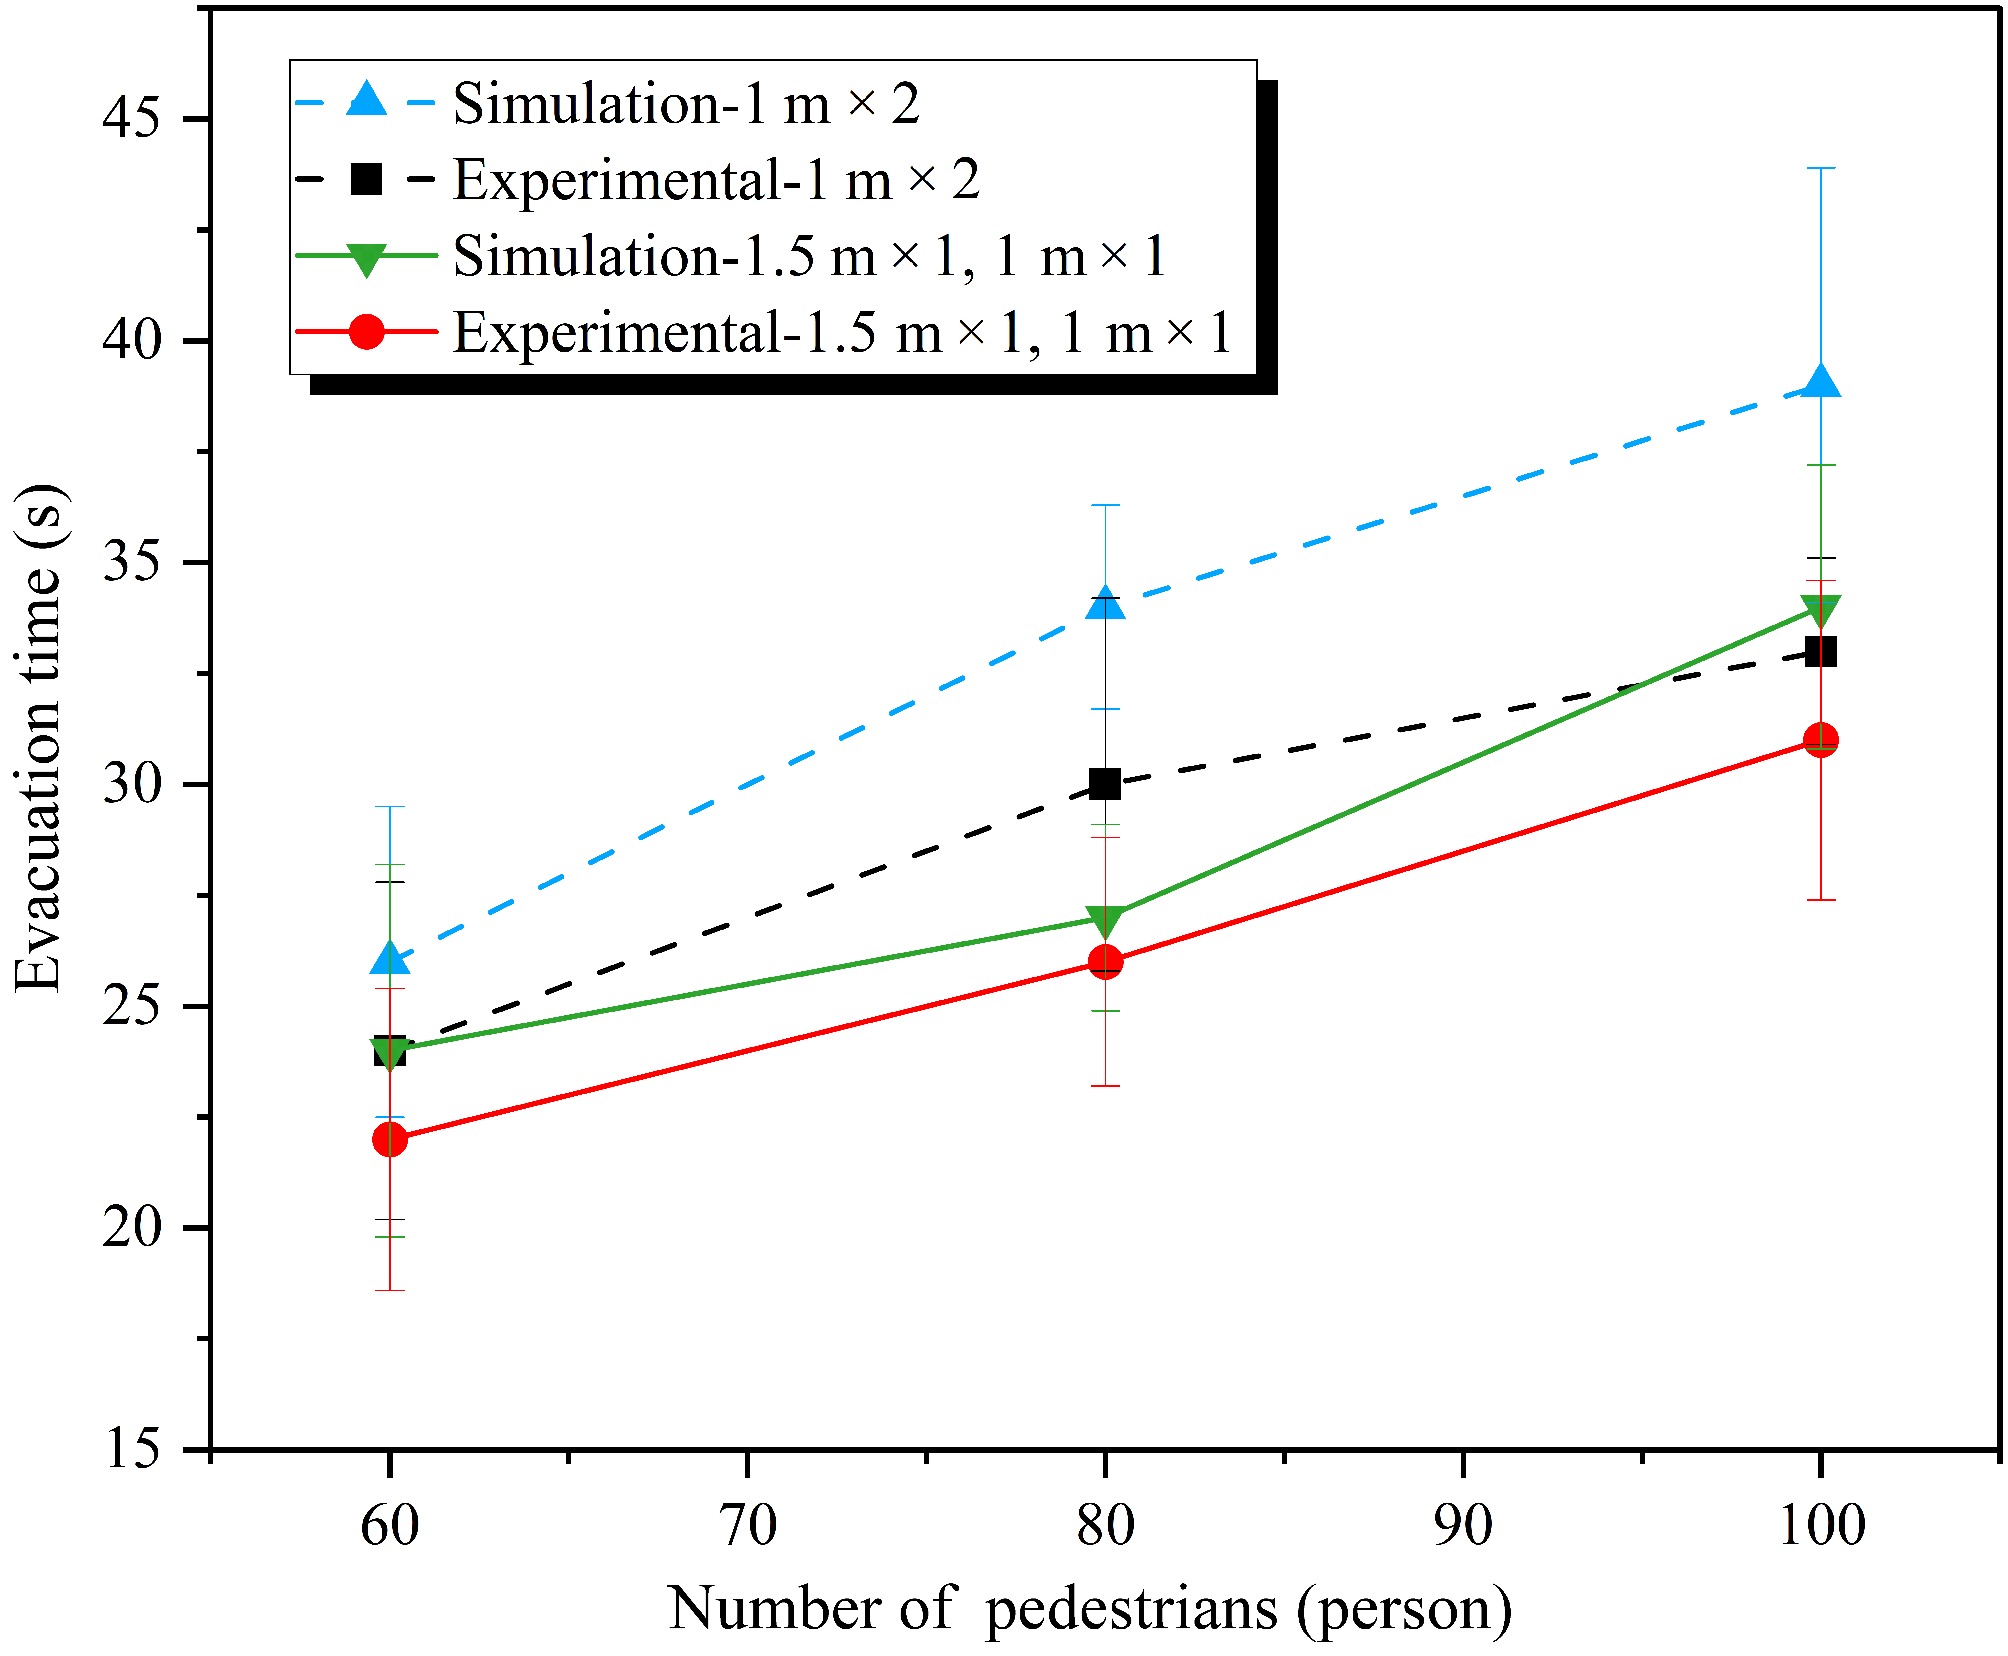
Figure 5.
Scenario 1 simulation results.
Figure 6 shows the evacuation of pedestrians at different time points at two exits under different operating conditions. Figure 7 shows the dynamic distribution of pedestrians at different time points in the simulation results. Figure 6a indicates that the number of pedestrians evacuated from exits a and b is similar for different exit widths, although the width of exit a increases to 1.5 m, the overall difference in the number of evacuated pedestrians between the two exits is not significant. Comparing Figs 4−7a and b, which show the dynamic changes in the first 20 s of the pedestrian evacuation process, it can be seen that even though both exits A and B are 1 m wide, there is no congestion at the exits due to the low number of pedestrians. However, the difference between Fig. 6b and c is the following. As the number of pedestrians increases and reaches 80 and 100, the width of exit a is adjusted. The utilization rate of exit a is much higher than that of exit b. As shown in Fig. 7c−f, when the width of exit a and exit b is 1 m, congestion occurs due to an increase in the number of evacuees. When the width of exit a is expanded, more pedestrians choose it due to its width. Therefore, when the width of exit a is expanded, the number of pedestrians choosing it for evacuation far exceeds that of exit b (Fig. 6b & c). However, it is worth noting that the difference in the evacuation time for the two exits is significantly greater for 80 than for 60 and 100 pedestrians (Figs 5 & 6). Figure 7 shows that the widths of exit a and exit b (1 m) are sufficient for the smooth evacuation of 60 pedestrians. Expanding the width to 1.5 m does not have a significant effect, although it shortens the evacuation time. Significant congestion occurs at exit a and exit b for 100 pedestrians, who move slowly through the exit. When the width of exit a is expanded to 1.5 m, congestion still occurs at exit a and exit b due to the large number of pedestrians.
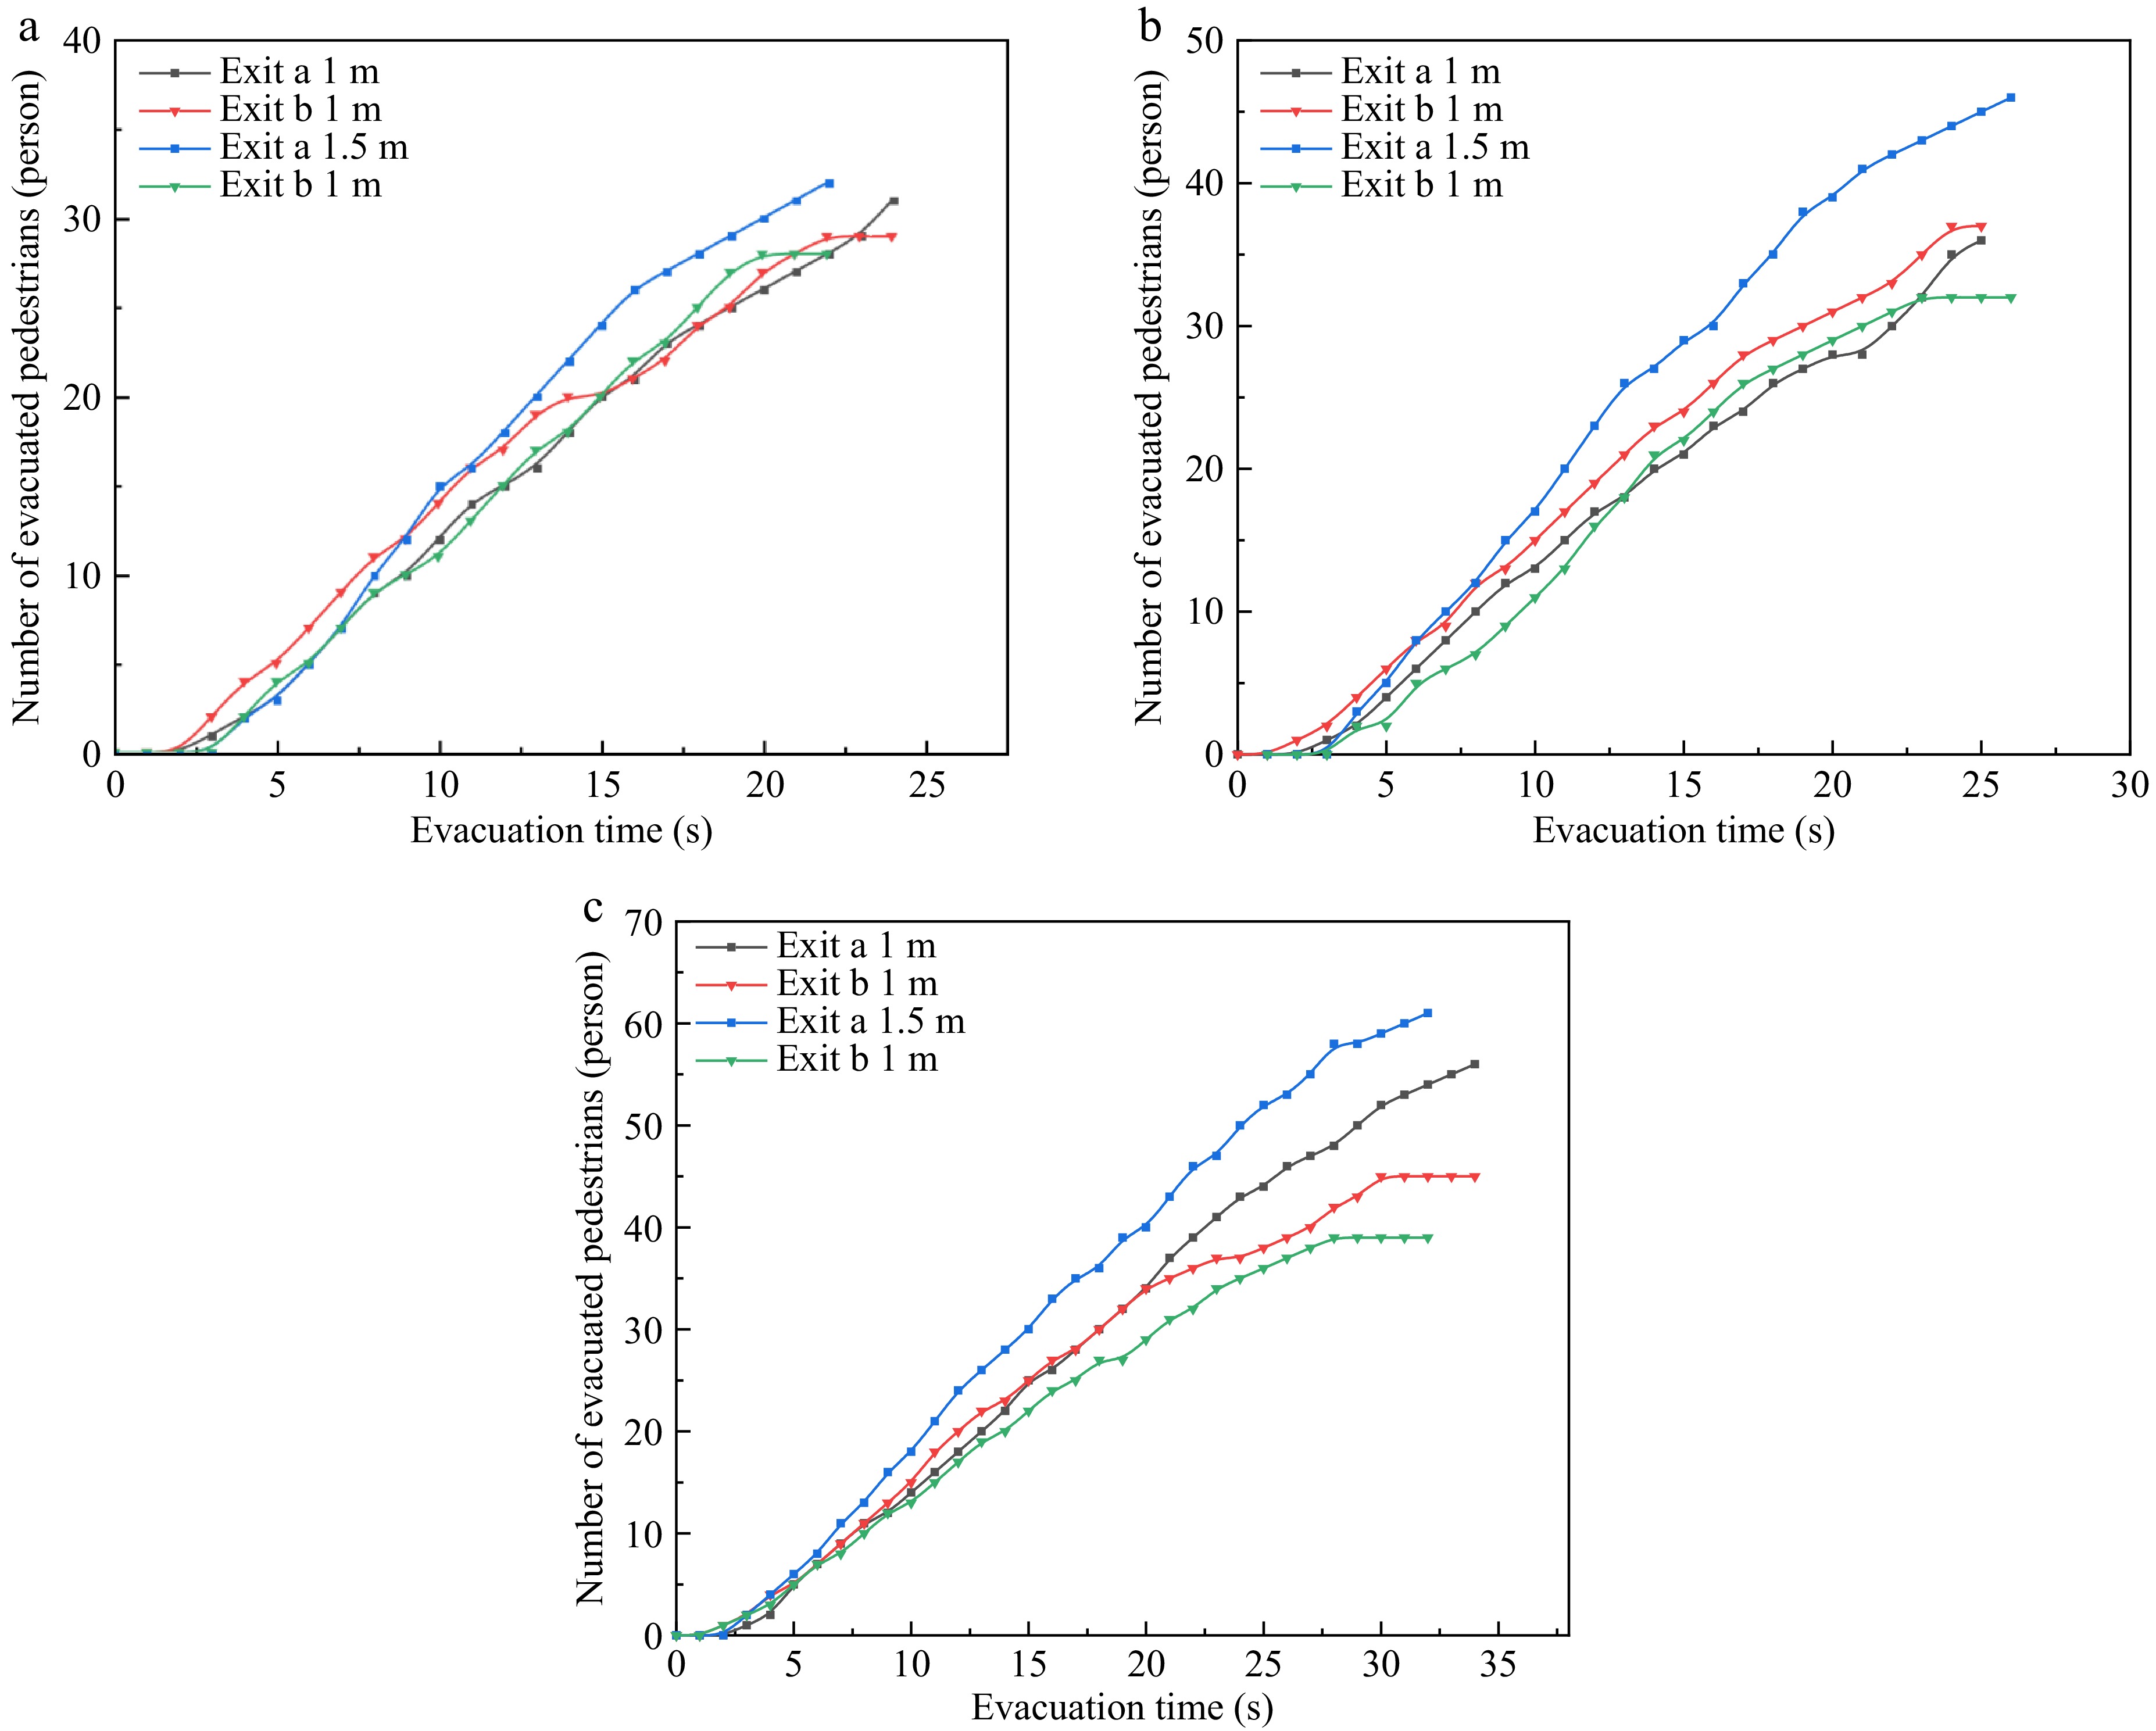
Figure 6.
Number of pedestrians ((a) 60, (b) 80, (c) 100) evacuated with varying numbers of pedestrians at two exits under Scenario 1.
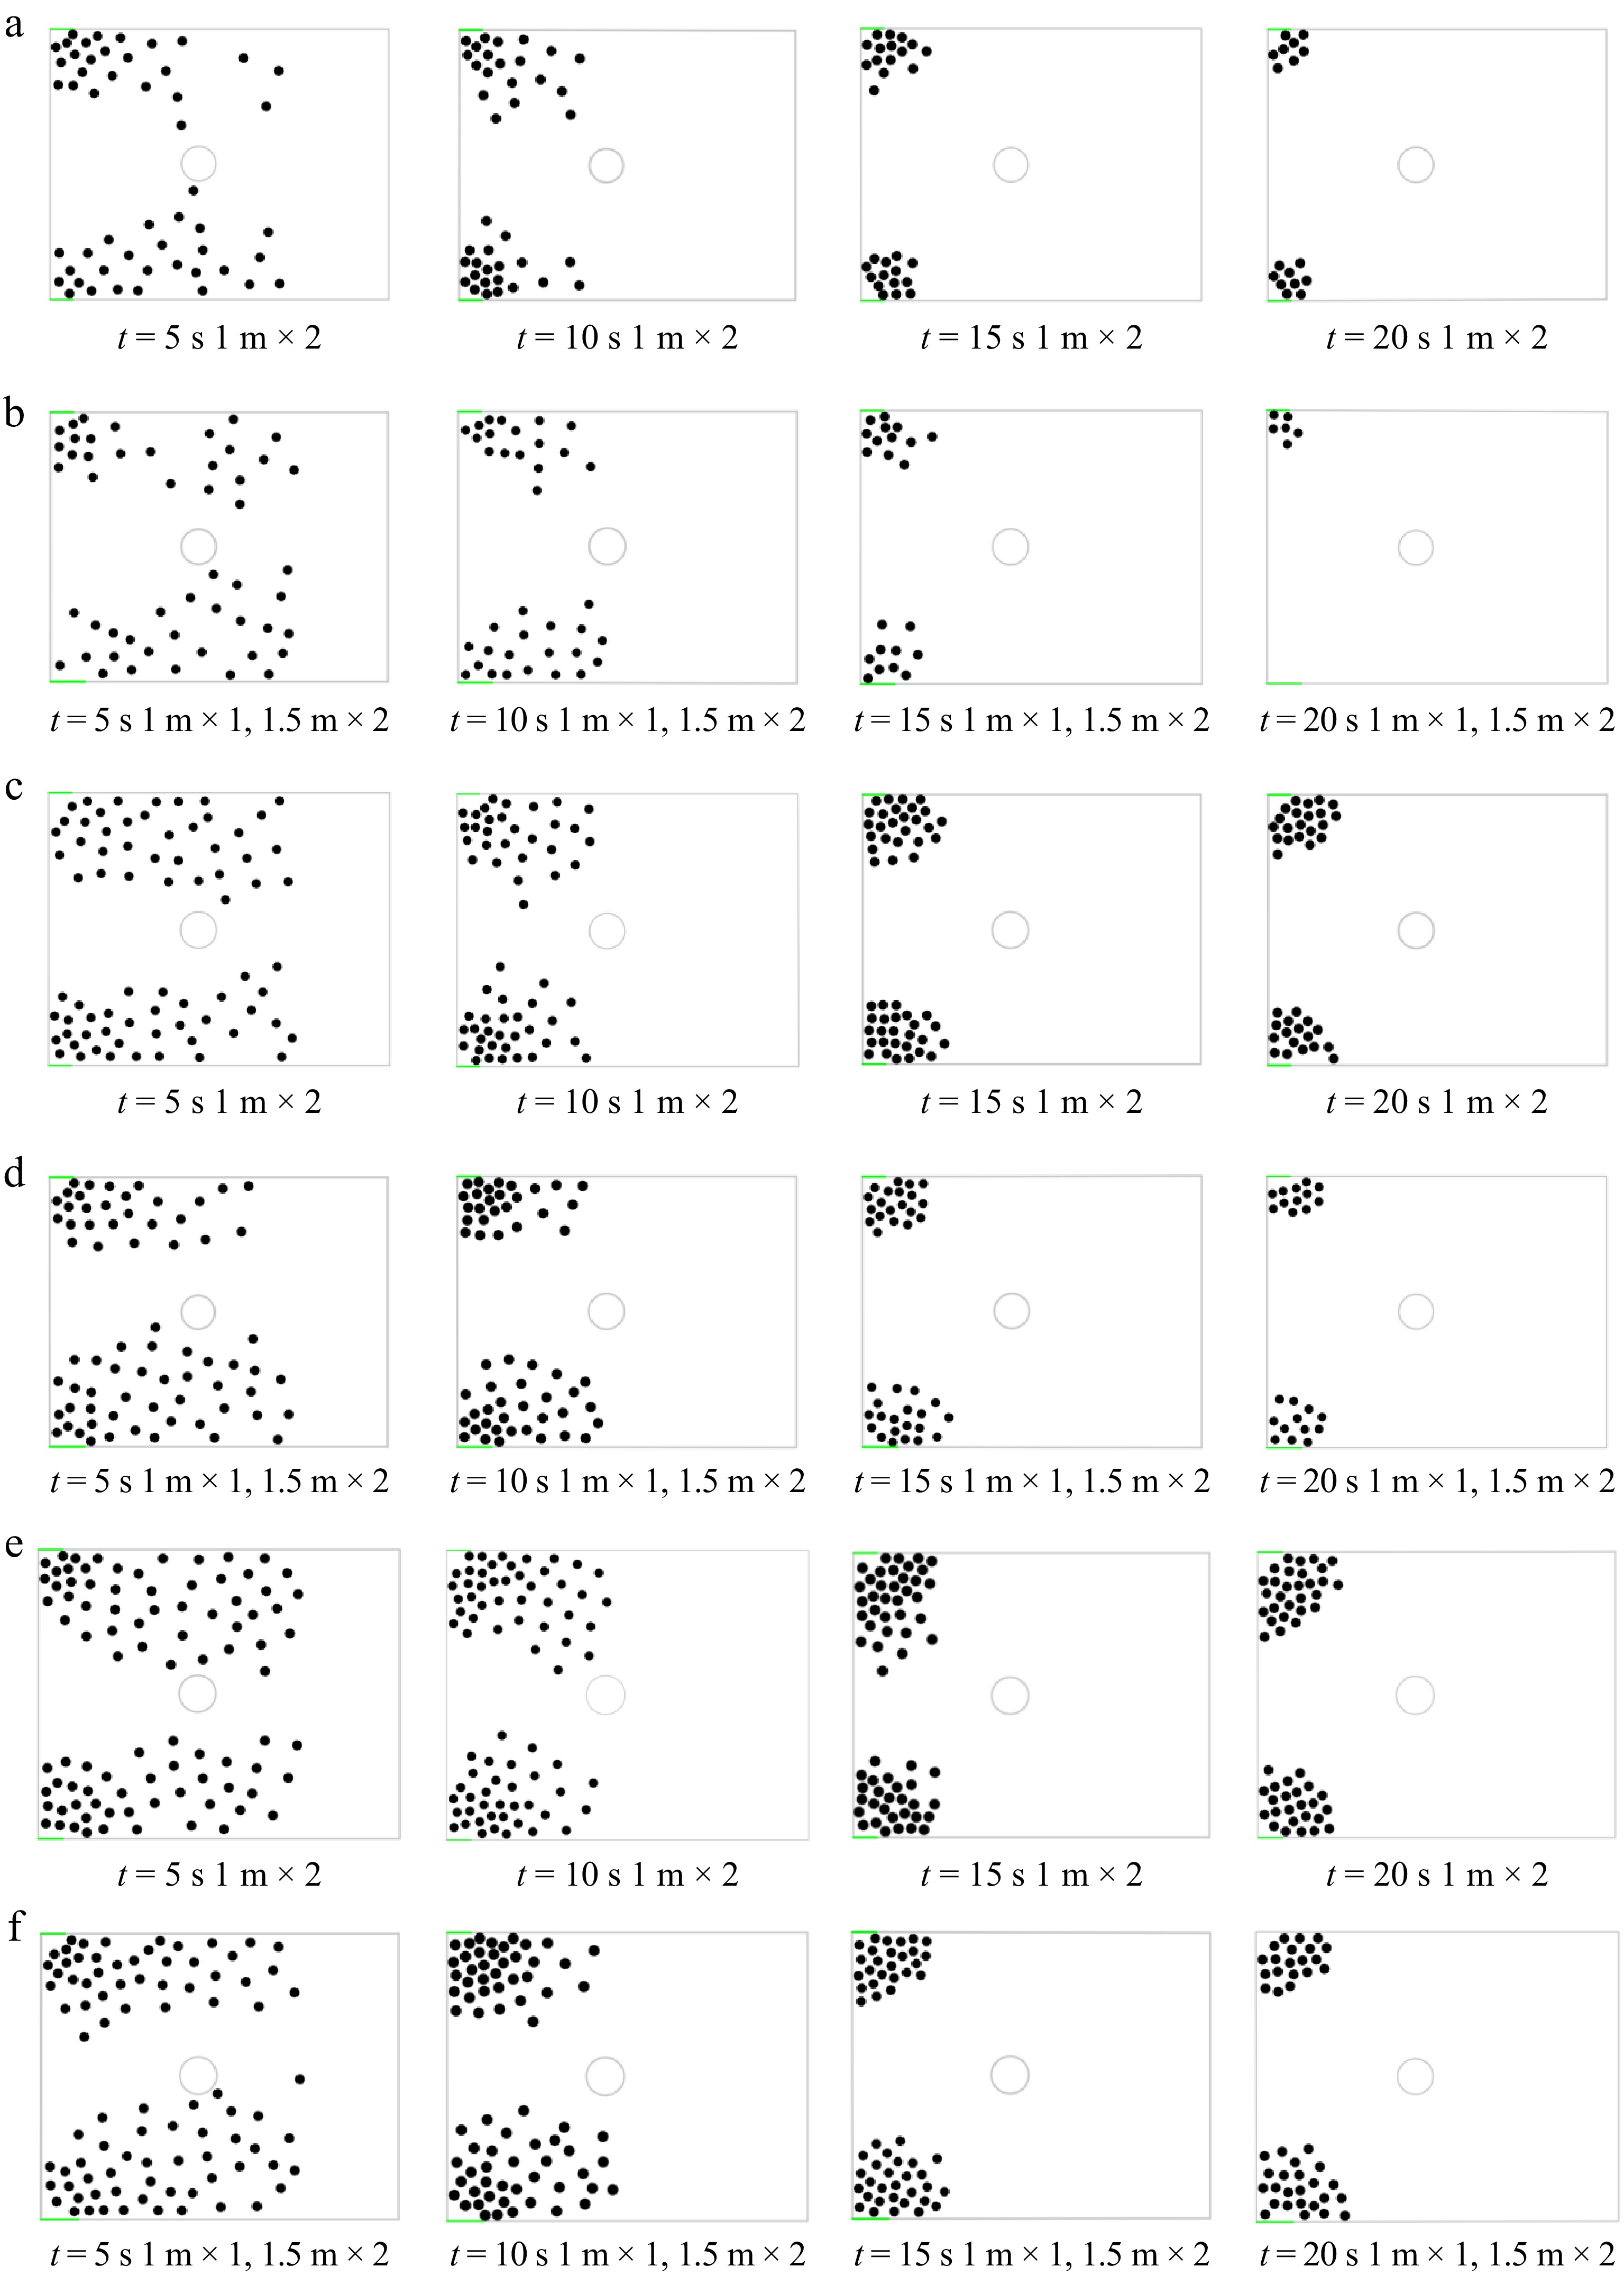
Figure 7.
Screenshot of pedestrian dynamic evacuation with varying numbers of pedestrians ((a, b) 60; (c, d) 80; (e, f) 100) at four time nodes.
However, when the number of pedestrians is 80 and the width of exit a and exit b is 1 m, congestion occurs at the exit for 10−15 s (Fig. 7c & d). When the width of exit a is expanded to 1.5 m, the pedestrian density at the exit for 10−15 s is significantly lower than when the exit width is 1 m, under this circumstance, expanding the exit width substantially improves evacuation efficiency, so the difference in the evacuation time for the two exit widths is larger for 100 than for 60 pedestrians. Figure 8 shows screenshots of 80 pedestrians at 5 and 15 s. The former is obtained in the early evacuation stage, most of the pedestrians do not reach the exit. The pedestrian density at the exit is similar for the two working conditions. At 15 s, the exit width of a is 1.5 m, and the pedestrian density at the exit is lower, indicating a higher efficiency in pedestrian evacuation.
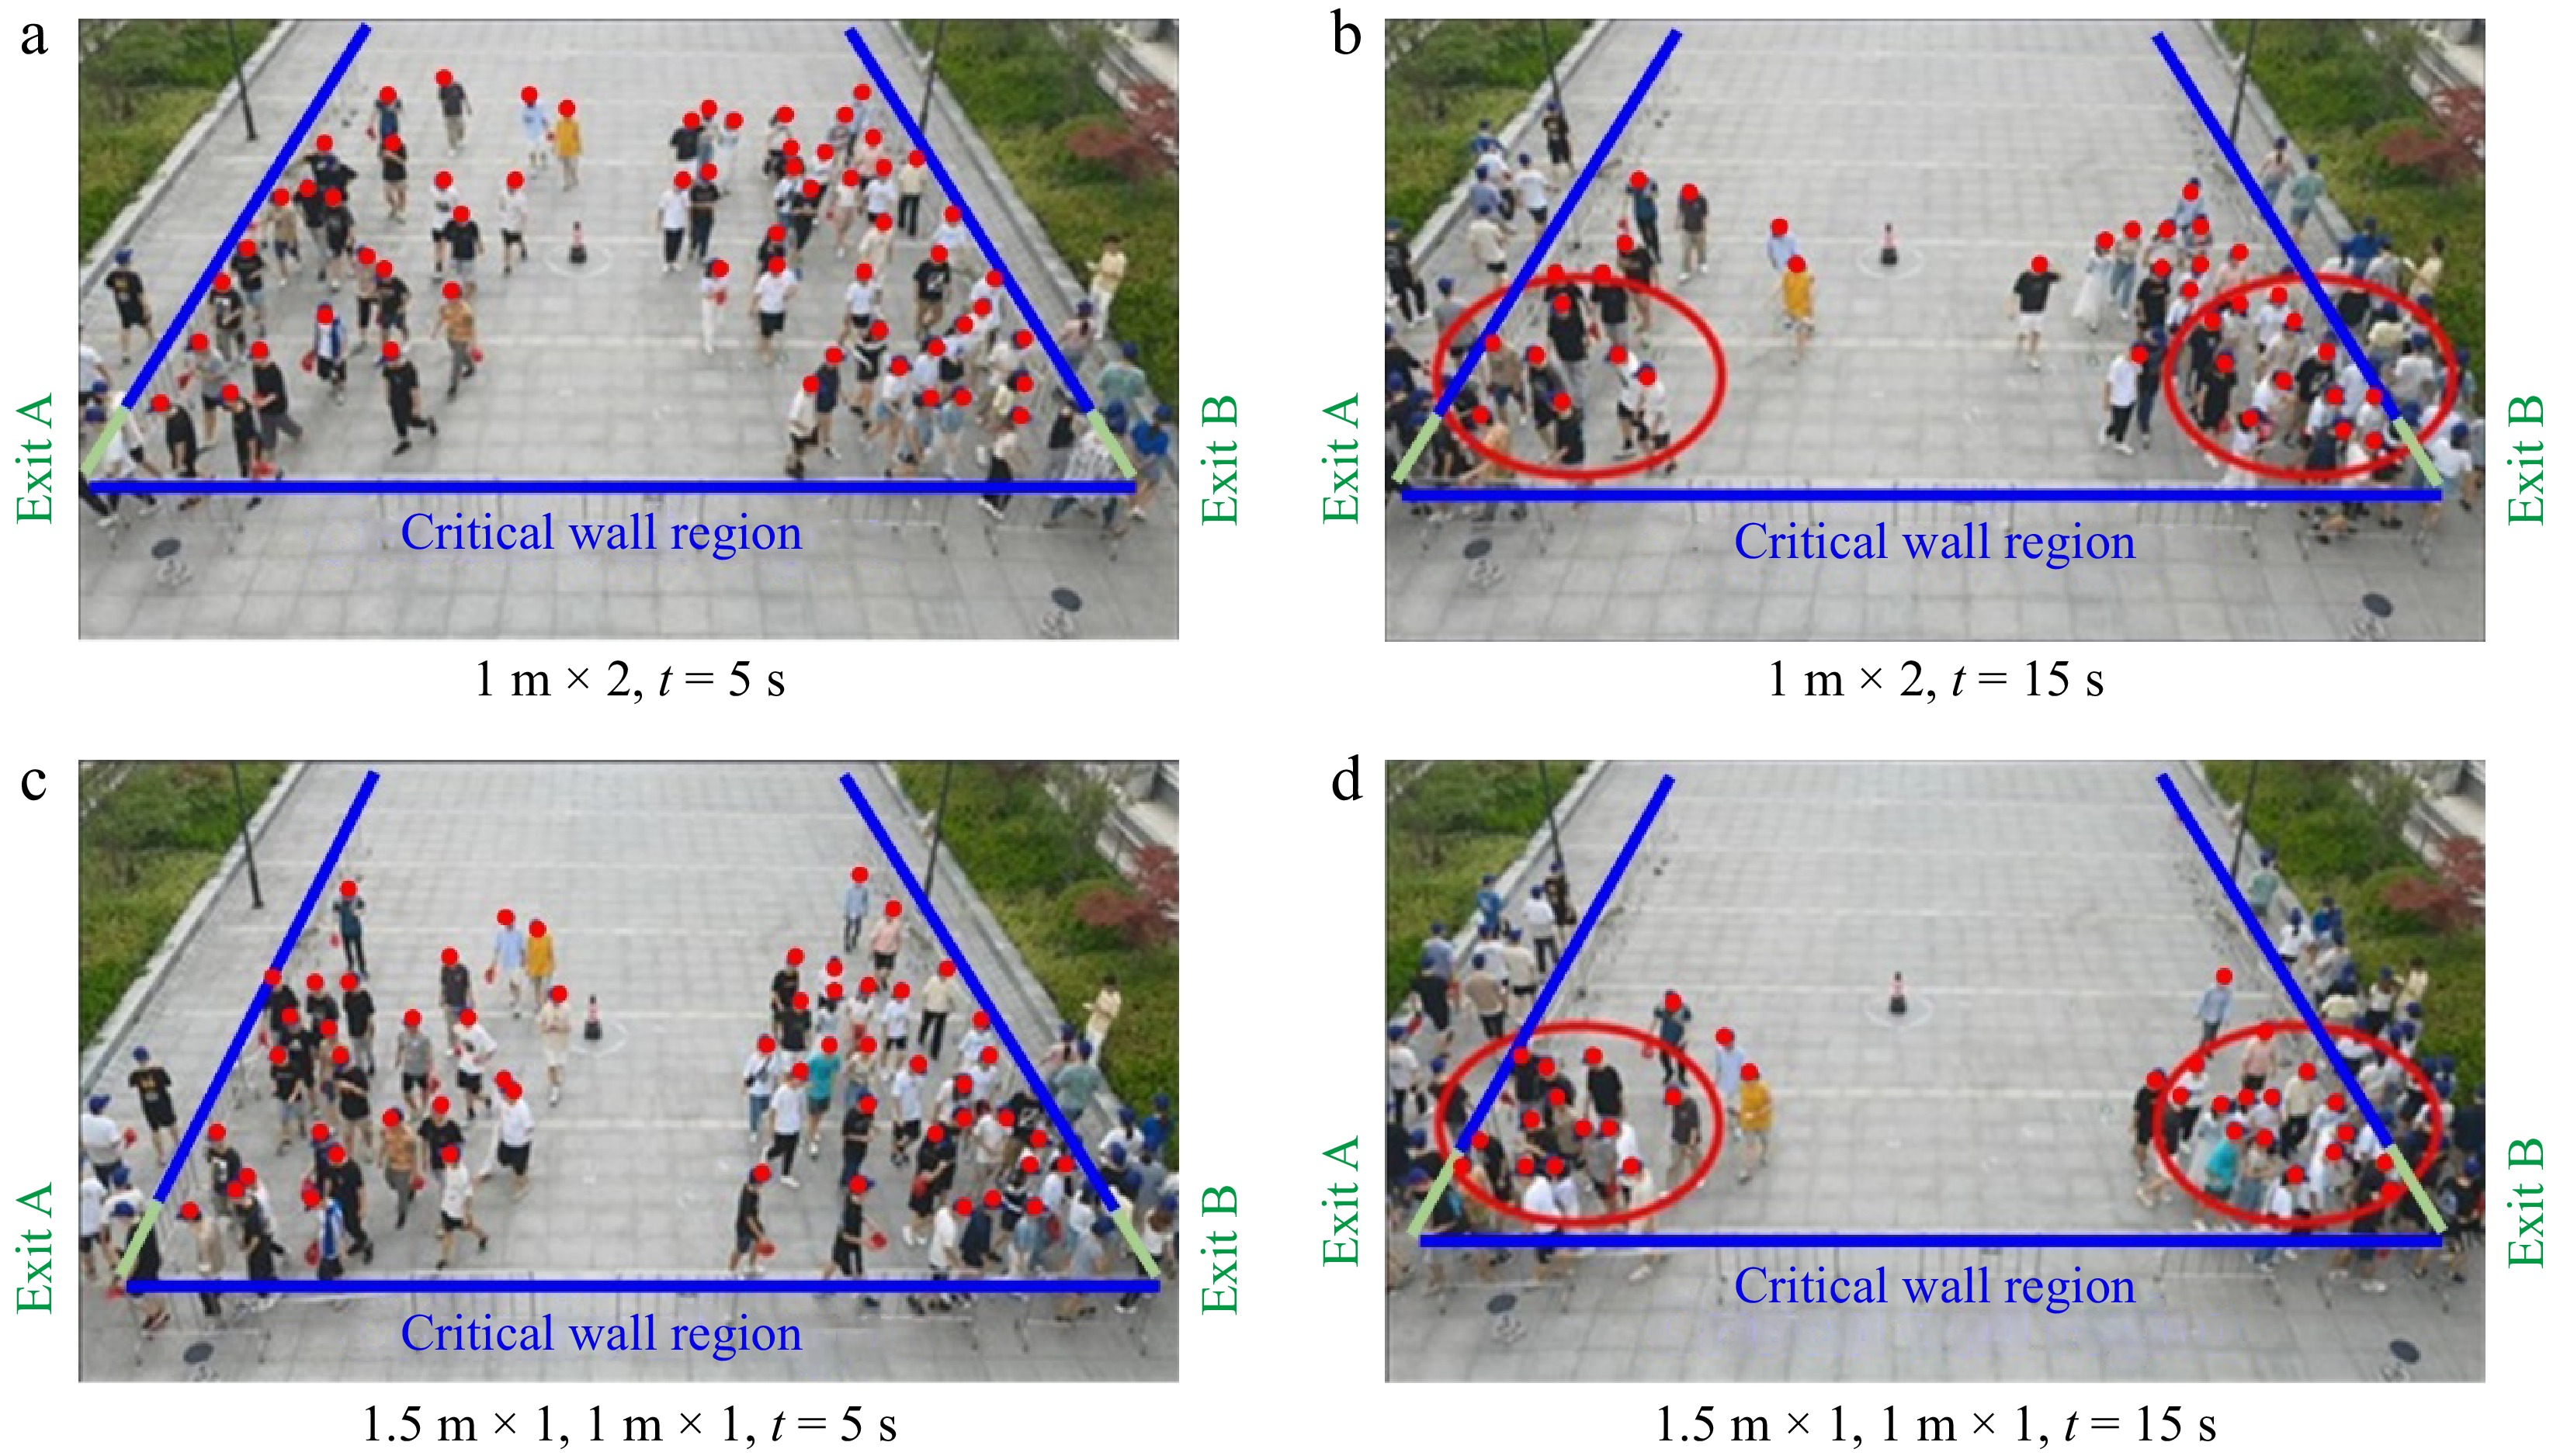
Figure 8.
Picture of the experimental site in motion (with 80 pedestrians, 5 and 15 s screenshots), the critical wall regions, exits, and non-evacuated personnel are indicated by solid blue lines, solid green lines, and red dots, respectively.
Therefore, it can be concluded that the evacuation time is directly proportional to the number of pedestrians and inversely proportional to the exit width. When the widths of exit a and exit b are 1 m, the number of pedestrians evacuated from both exits is similar. However, when the width of exit a is increased to 1.5 m, more pedestrians choose exit a than exit b. Increasing the exit width has a greater effect on reducing the evacuation time for 80 pedestrians than for 60 and 100 pedestrians. Analysis revealed that widening exit A from 1 to 1.5 m reduced the average evacuation time by 18.3% for 80 pedestrians (from 54.2 to 44.3 s), whereas the reduction was only 9.7% for 60 pedestrians (38.1 to 34.4 s). This demonstrates diminishing returns of exit width expansion at lower densities.
Evacuation with lighted guidance signs (normal view environment)
-
At a density threshold of 0.5 Eqn (2), 5 (9) people were required to reach the density threshold when the exit width was 1 m (1.5 m). As described, the effect of changing the exit width on the evacuation time is greater for 80 than for 60 and 100 pedestrians. Therefore, we used 80 pedestrians for simulating Scenario 2. The working conditions are listed in Table 2. The number of insensitive pedestrians is 10, 20, 30, and 40, and two exit widths are used. The simulation results are shown in Fig. 9.
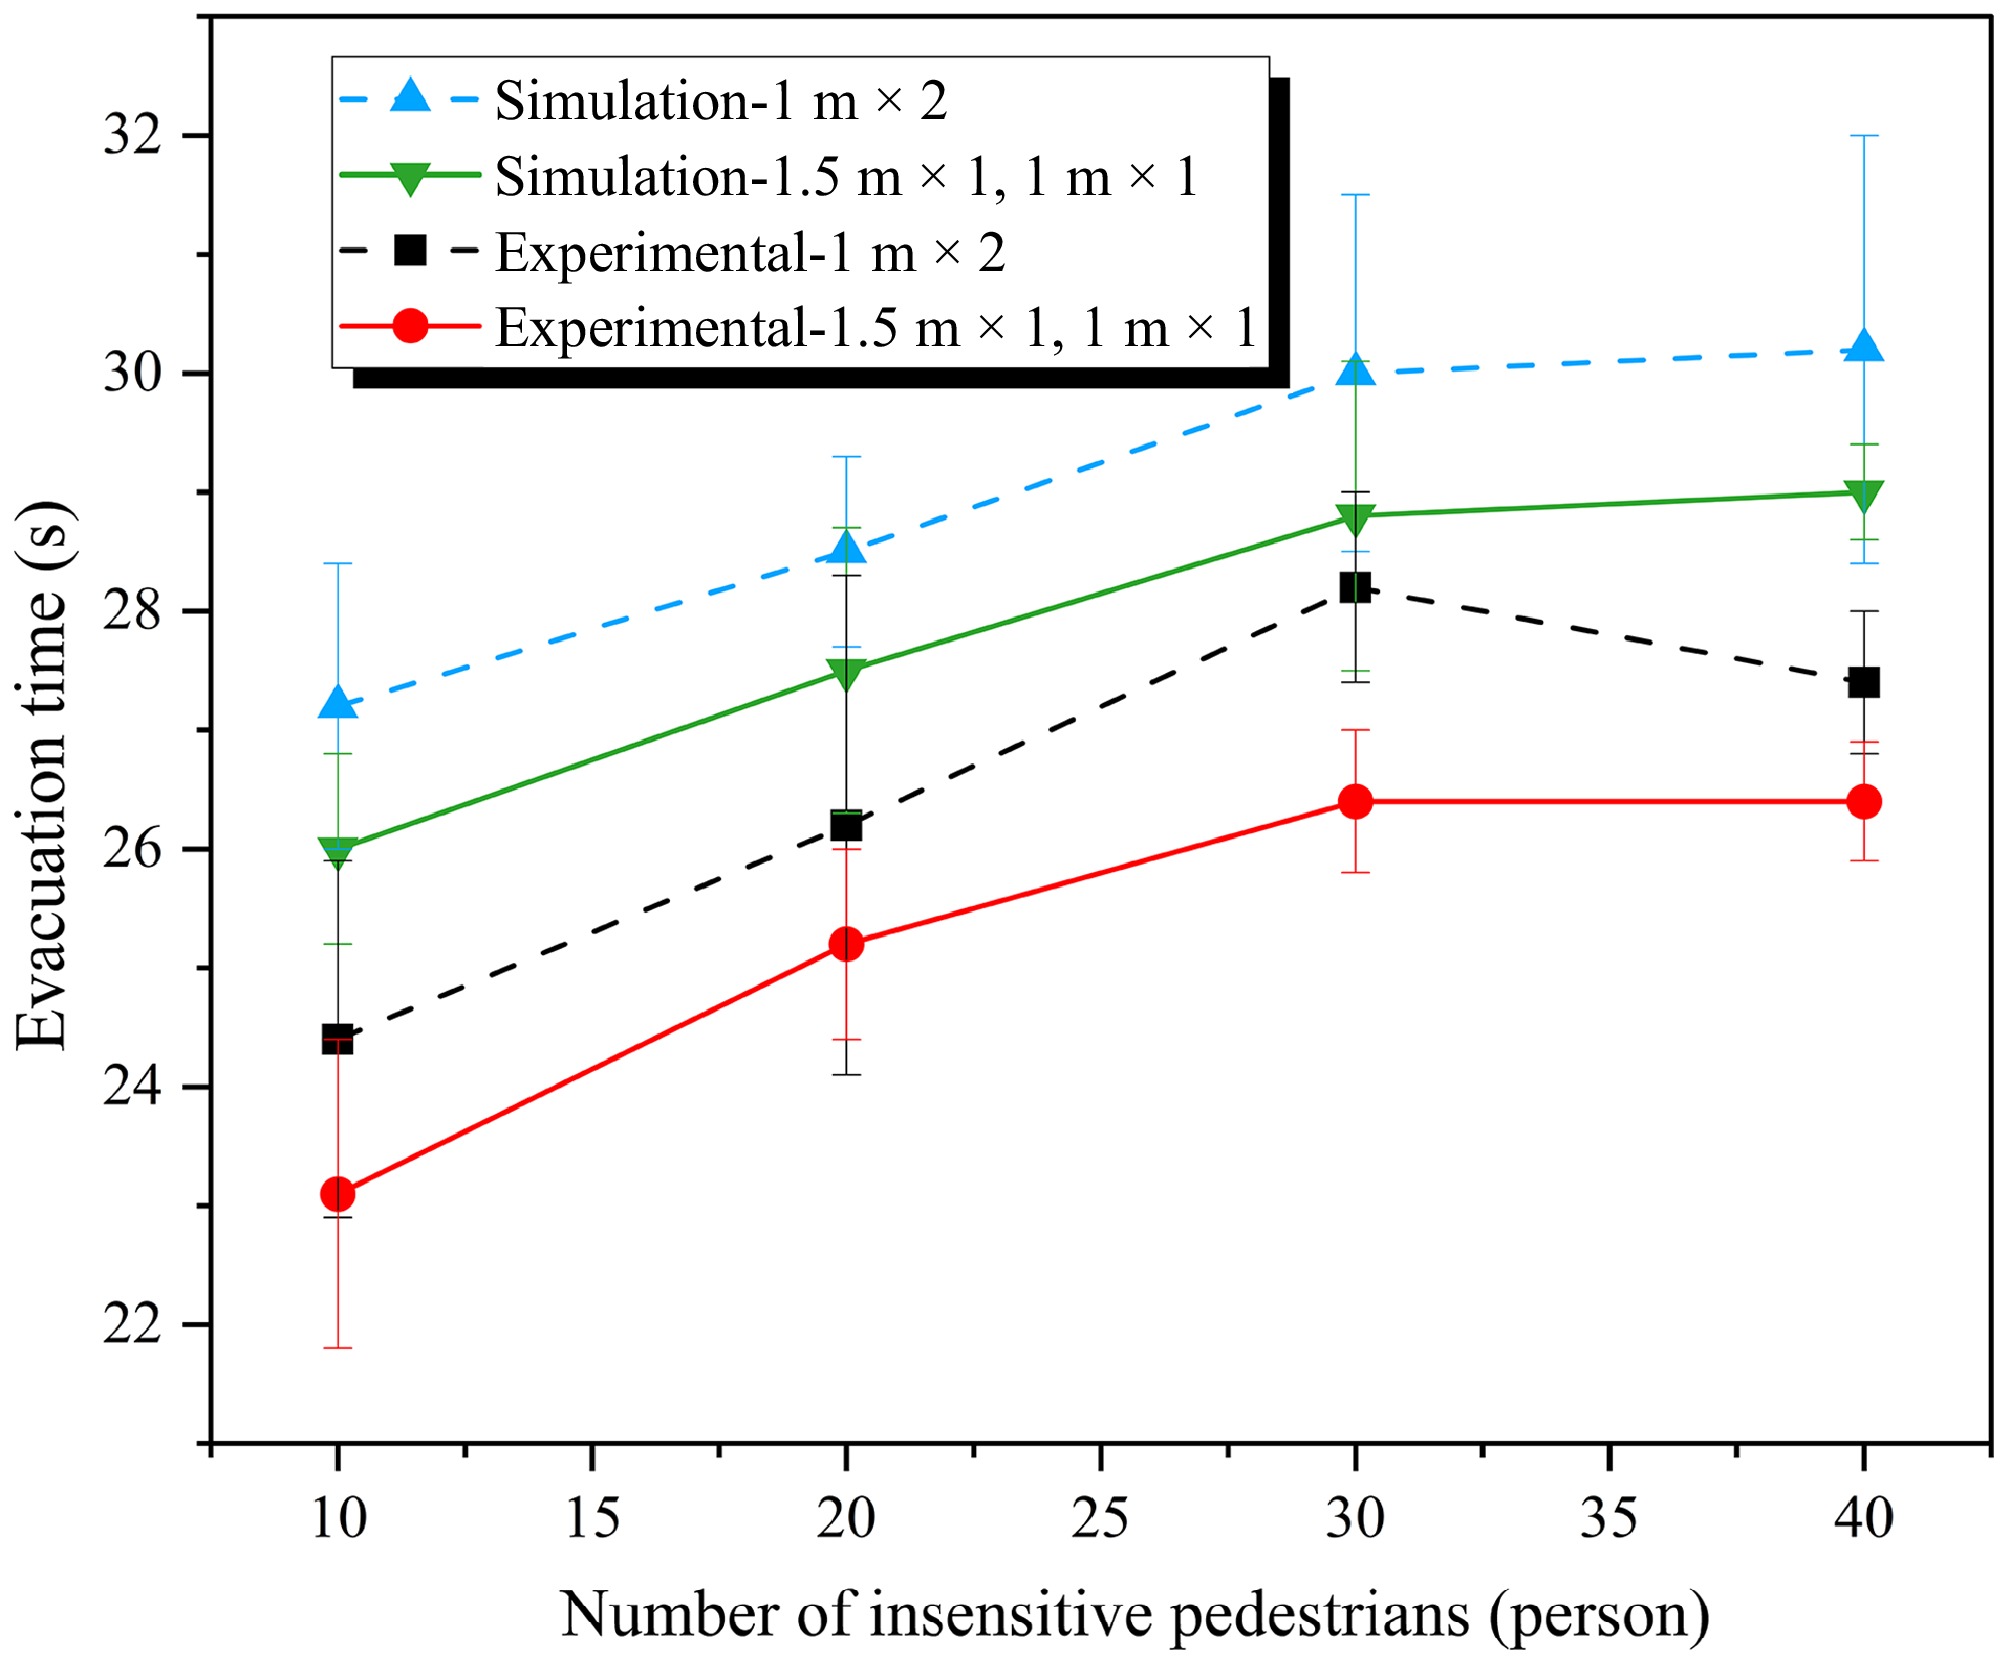
Figure 9.
Scenario 2 experimental and simulation results.
The evacuation time is significantly shorter than in the scenario without a lighted guidance sign because people are attracted to the sign. Increasing the number of insensitive pedestrians increases the evacuation time initially, but the evacuation time stabilizes after reaching 30 pedestrians. The effect of expanding the exit width on the evacuation time is significantly smaller in this scenario than in the one without a lighted sign (Figs 5 & 9). To investigate the effect of different pedestrian densities represented by lighted signs, we analyzed the number of pedestrians evacuated and the relative density at two exits.
As shown in Fig. 10, the results are the same as for the scenario without a lighted sign. When the width of both exits is 1 m, the number of pedestrians using the two exits is similar. However, when the width of exit a is expanded to 1.5 m, a different result is observed. When the number of insensitive pedestrians is small (10 or 20), few people choose exit a because it is wider than exit b. This result differs from that of the scenario with no lighted sign. However, when the number of insensitive pedestrians is 30 or 40, more pedestrians choose exit a with a 1.5 m width.
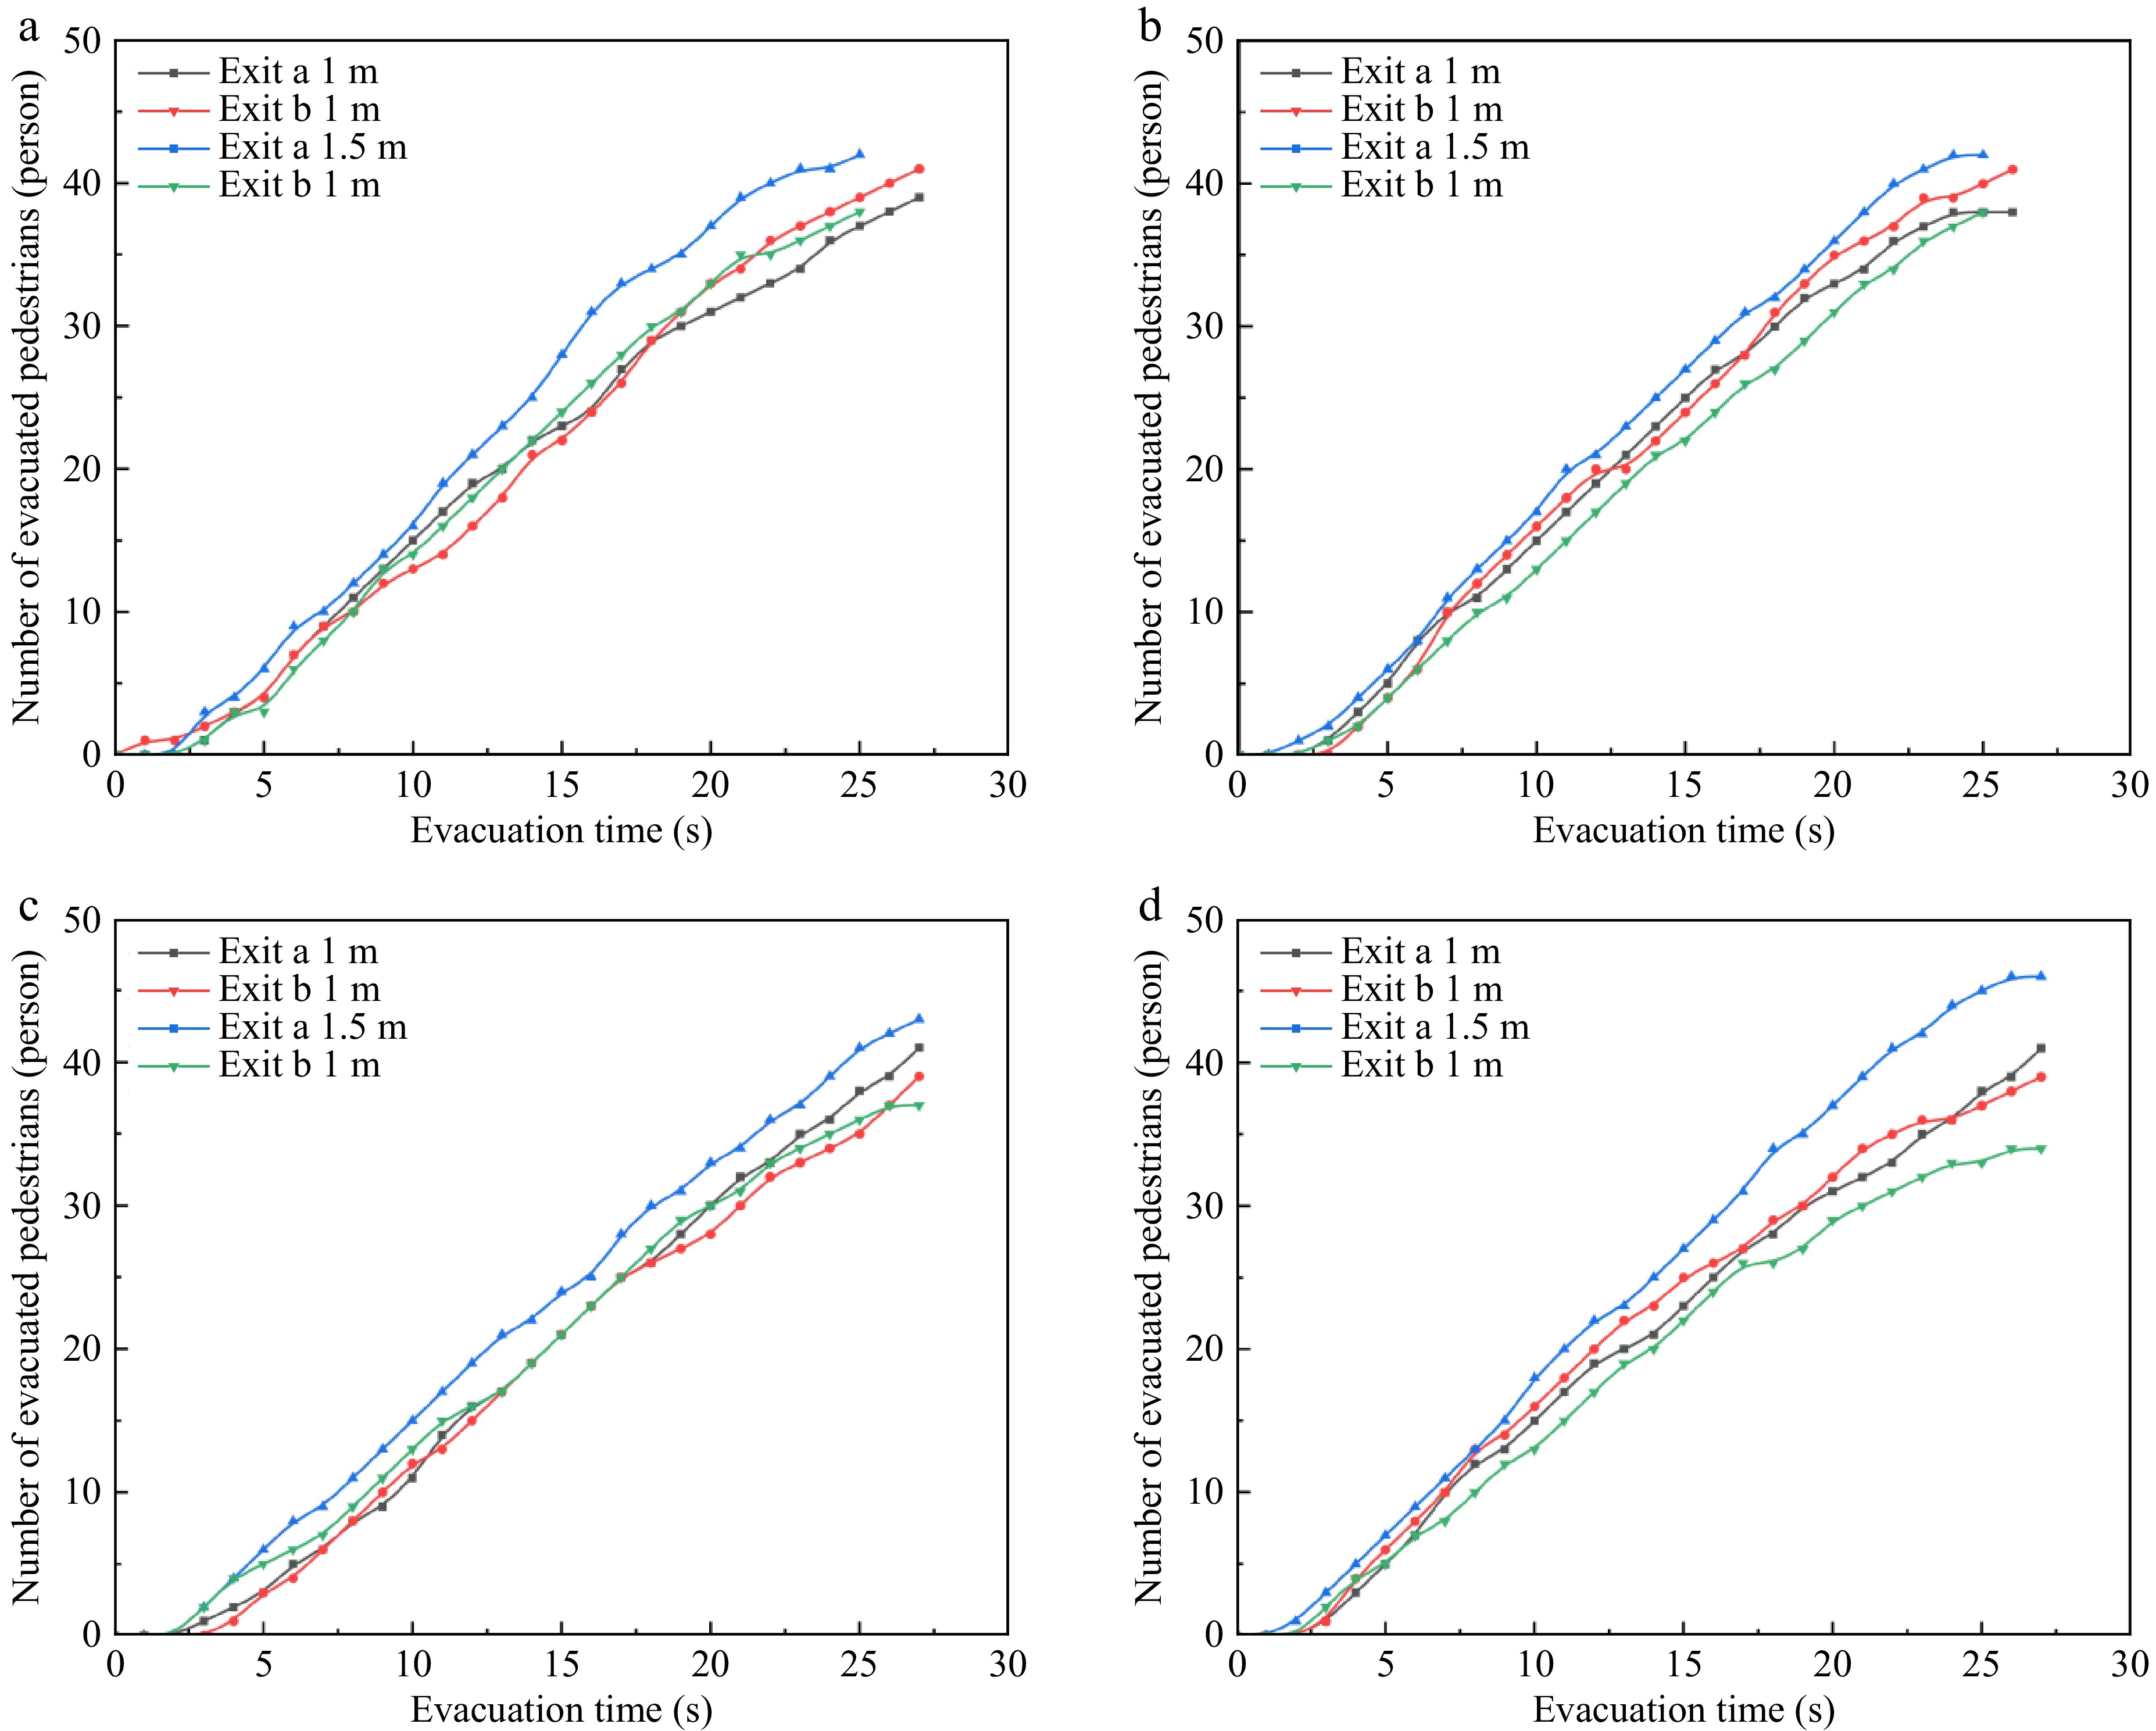
Figure 10.
Number of pedestrians evacuated with varying numbers of insensitive pedestrians ((a) 10, (b) 20, (c) 30, (d) 40) at two exits under Scenario 2.
Figure 11 shows the relative density at the two exits. The relative density exceeds the threshold during the first half of the evacuation process. However, the relative density is different when the number of insensitive pedestrians changes. When the number of insensitive pedestrians is small (10, 20), the relative density at the exit fluctuates during the evacuation and exceeds the density threshold multiple times. However, when the number of insensitive pedestrians is high (30 and 40), the overall trend of relative density shows an upward trend followed by a downward trend, reaching the density threshold at consecutive time points and lasting for a longer period.
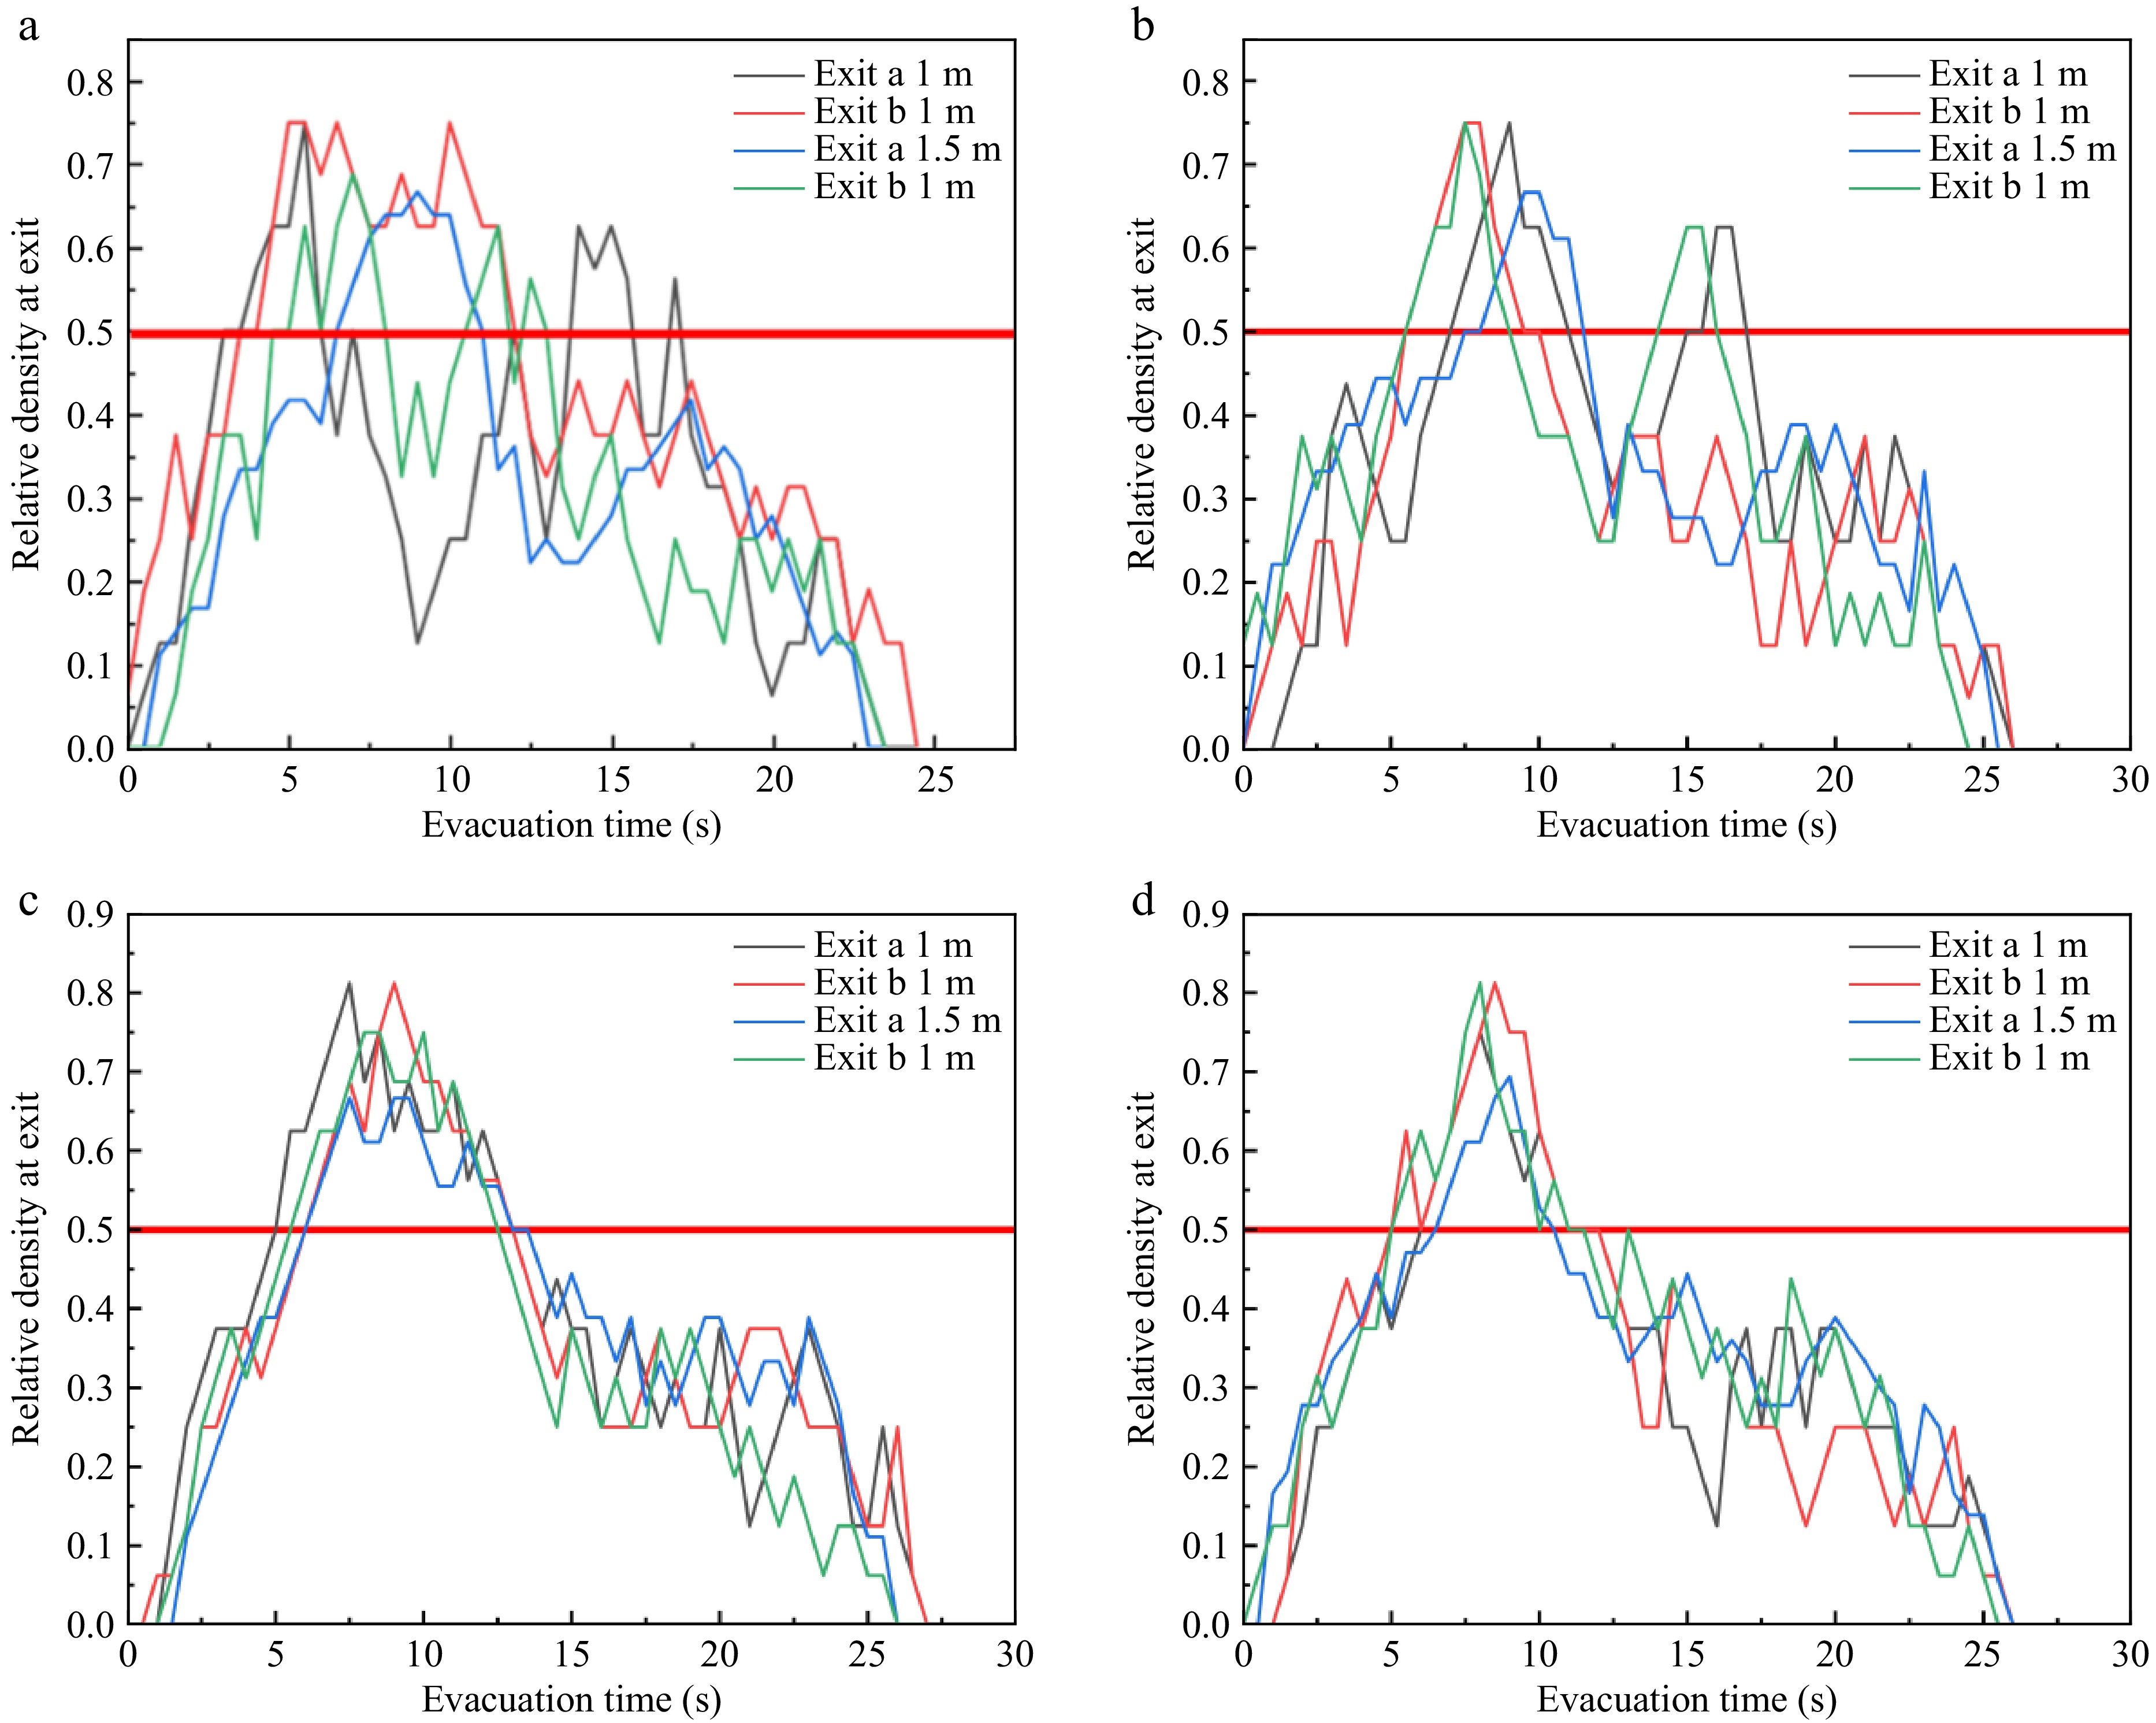
Figure 11.
Relative pedestrian density with varying numbers of insensitive pedestrians ((a) 10, (b) 20, (c) 30, (d) 40) at two exits under Scenario 2.
The pedestrian dynamics during the evacuation were analyzed to determine the reasons. A trajectory map of pedestrians and their speed during the experiment was created for the study focused on scenarios with 20 and 40 insensitive pedestrians and the width of exit a is 1.5 m, as shown in Fig. 12. Due to the large number of experimental samples, only samples with exit re-selection intentions of sensitive pedestrians were selected for the trajectory extraction. It can be found that when the number of insensitive pedestrians is 20, more pedestrians re-selected at the exit, reaching 12. But when the number of insensitive pedestrians reaches 40, only five pedestrians re-selected at the exit. The density threshold of exit b is reached earlier than for exit a because it is narrower. When the pedestrians see the signal that exit b is congested, some pedestrians choose exit a. However, exit a soon reaches the density threshold due to the many pedestrians. At this time, there are significantly more pedestrians who choose exit a than exit b. The relative density at exit b decreases below the density threshold, and pedestrians waiting at exit a see the signal and move towards exit b. The density at the exit has a larger effect on the pedestrians' exit choice than the exit width, resulting in a similar number of pedestrians evacuated from both exits and improving the evacuation efficiency of both exits. However, more pedestrians choose exit a due to its width at the beginning of the evacuation when 40 insensitive pedestrians participate in the experiment. The time when the density threshold is reached at the two exits is similar. Even sensitive pedestrians will give up their idea of changing the exit since the pedestrian density of both exits is higher than the threshold. Many insensitive pedestrians are located at exit a, affecting evacuation efficiency. Therefore, the evacuation time increases with the number of insensitive pedestrians. When the number of insensitive pedestrians is small (10 or 20), most sensitive pedestrians respond to changes in the color of the lighted signs and choose the exit with a green light. Therefore, the relative density at the two exits fluctuates. The reason is that sensitive pedestrians repeatedly exceed the density threshold due to relative density fluctuations caused by the exit choices; However, the duration is relatively short. The number of pedestrians who rely on the color of the lighted signs to change the exit is fewer for a larger number of insensitive pedestrians. The relative density at the exit shows an upward trend followed by a downward trend, and the peak density is concentrated. After the start of the evacuation experiment, the pedestrian speed increases and then stabilizes at 1.5 ± 0.25 m/s. However, when the exit choice changes, the pedestrian speed drops to 1.00 ± 0.25 m/s. At this time, the pedestrians evaluate the pedestrian density at the two exits according to the color of the lighted sign and choose an exit. This process affects the pedestrian speed. However, after the exit light changes, pedestrians accelerate toward the exit because they are attracted by the light, and the speed increases to 1.75 ± 0.25 m/s.
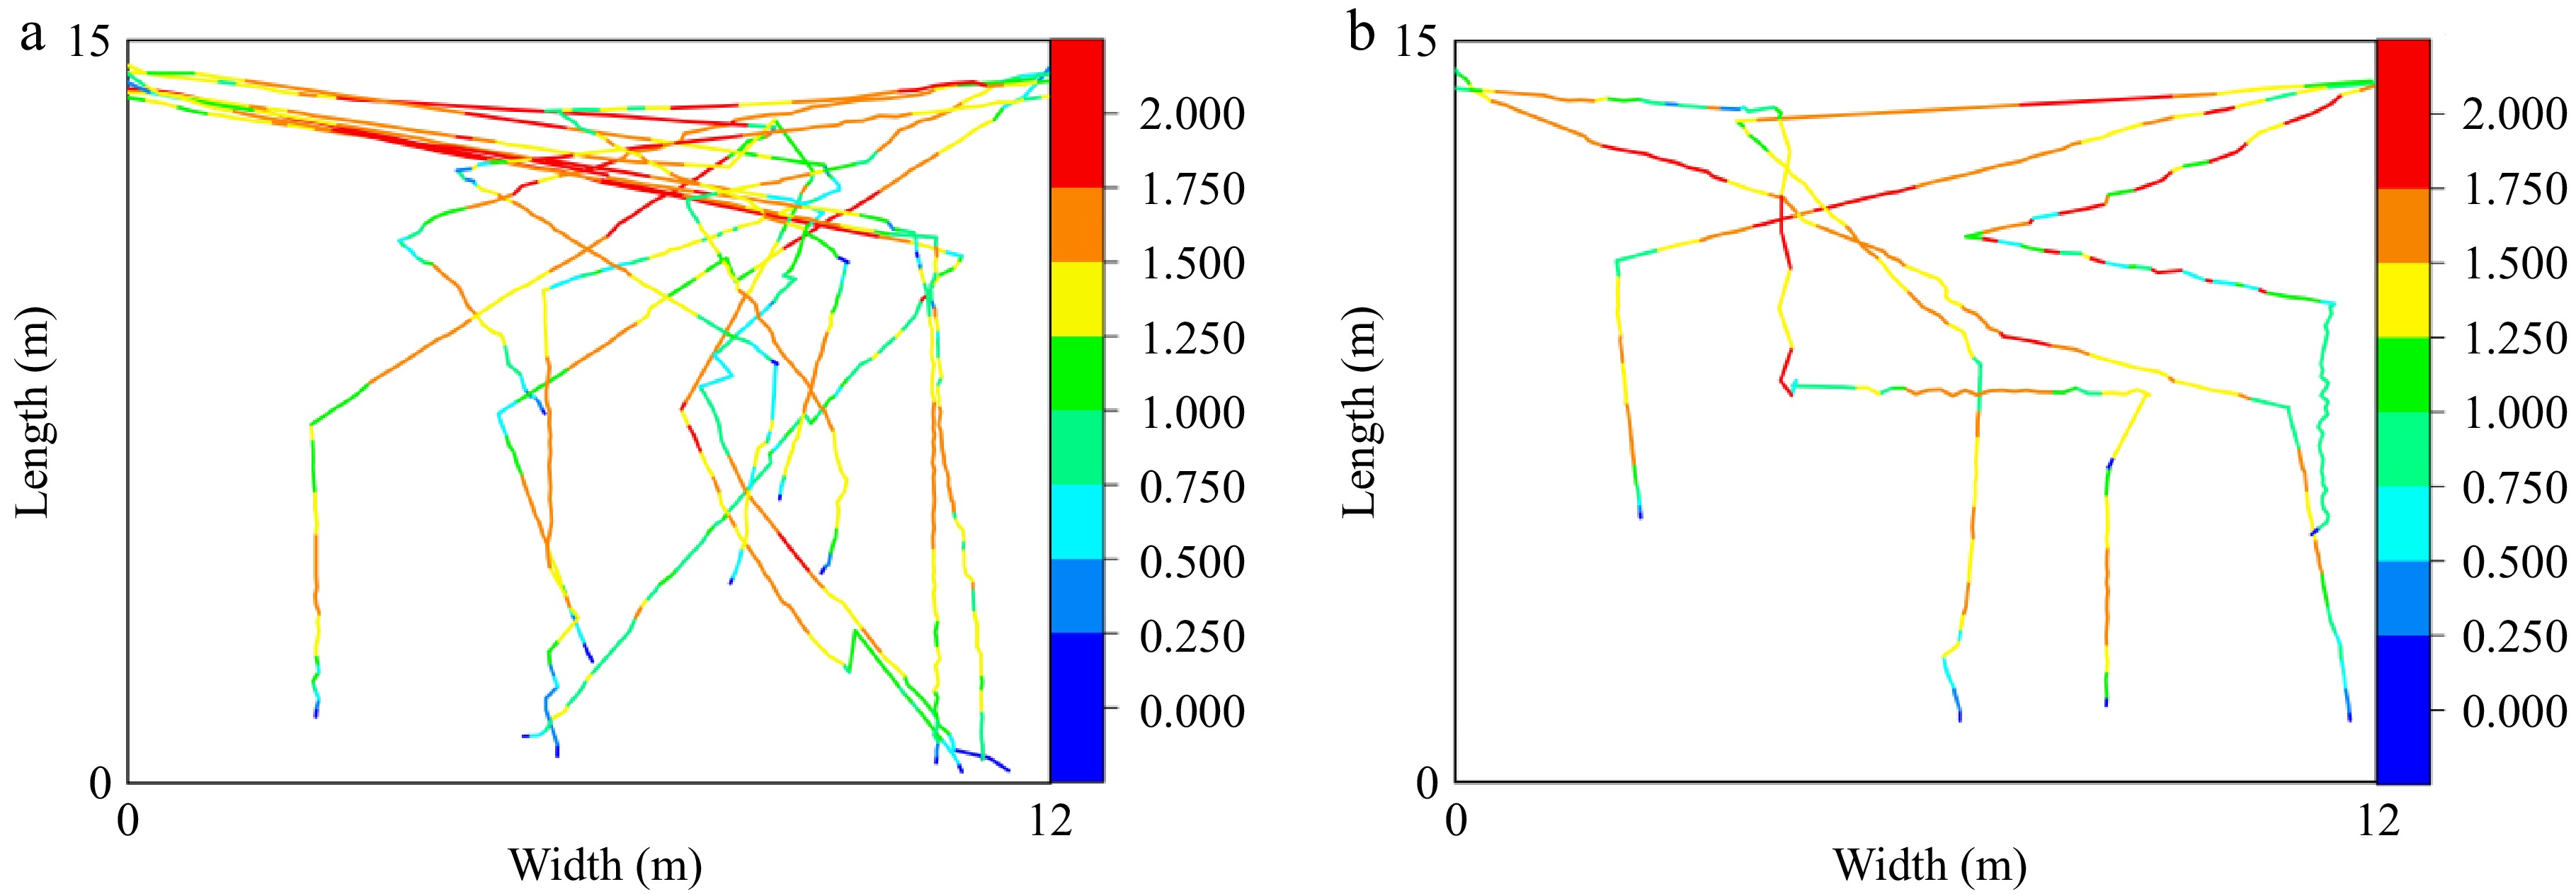
Figure 12.
The trajectory map of the exit re-selection for sensitive pedestrians under varying numbers of insensitive pedestrians ((a) 20, (b) 40) at two exits under Scenario 2.
A simulation was conducted with 20 and 40 insensitive pedestrians and exit widths of 1.5 m for exit a and 1 m for exit b. The dynamic distribution of pedestrians is shown in Fig. 13. Figure 13a−d shows the pedestrian distribution at four time points for 20 insensitive pedestrians, and Fig. 13e−h shows the respective results for 40 insensitive pedestrians. As shown in Fig. 13c and d, at 10 s, some sensitive pedestrians choose exit a because exit b is too congested. At 15 s, the number of pedestrians is significantly larger at exit a than at exit b. Some sensitive pedestrians choose exit b. In contrast, when there are 40 insensitive pedestrians (Fig. 13g, h), the number of pedestrians who change their exit choice is lower at 10 s, although the number of pedestrians is fewer at exit a than at exit b. At 15 s, the number of pedestrians at exit b is still higher, and fewer pedestrians are attracted to the lighted signs.
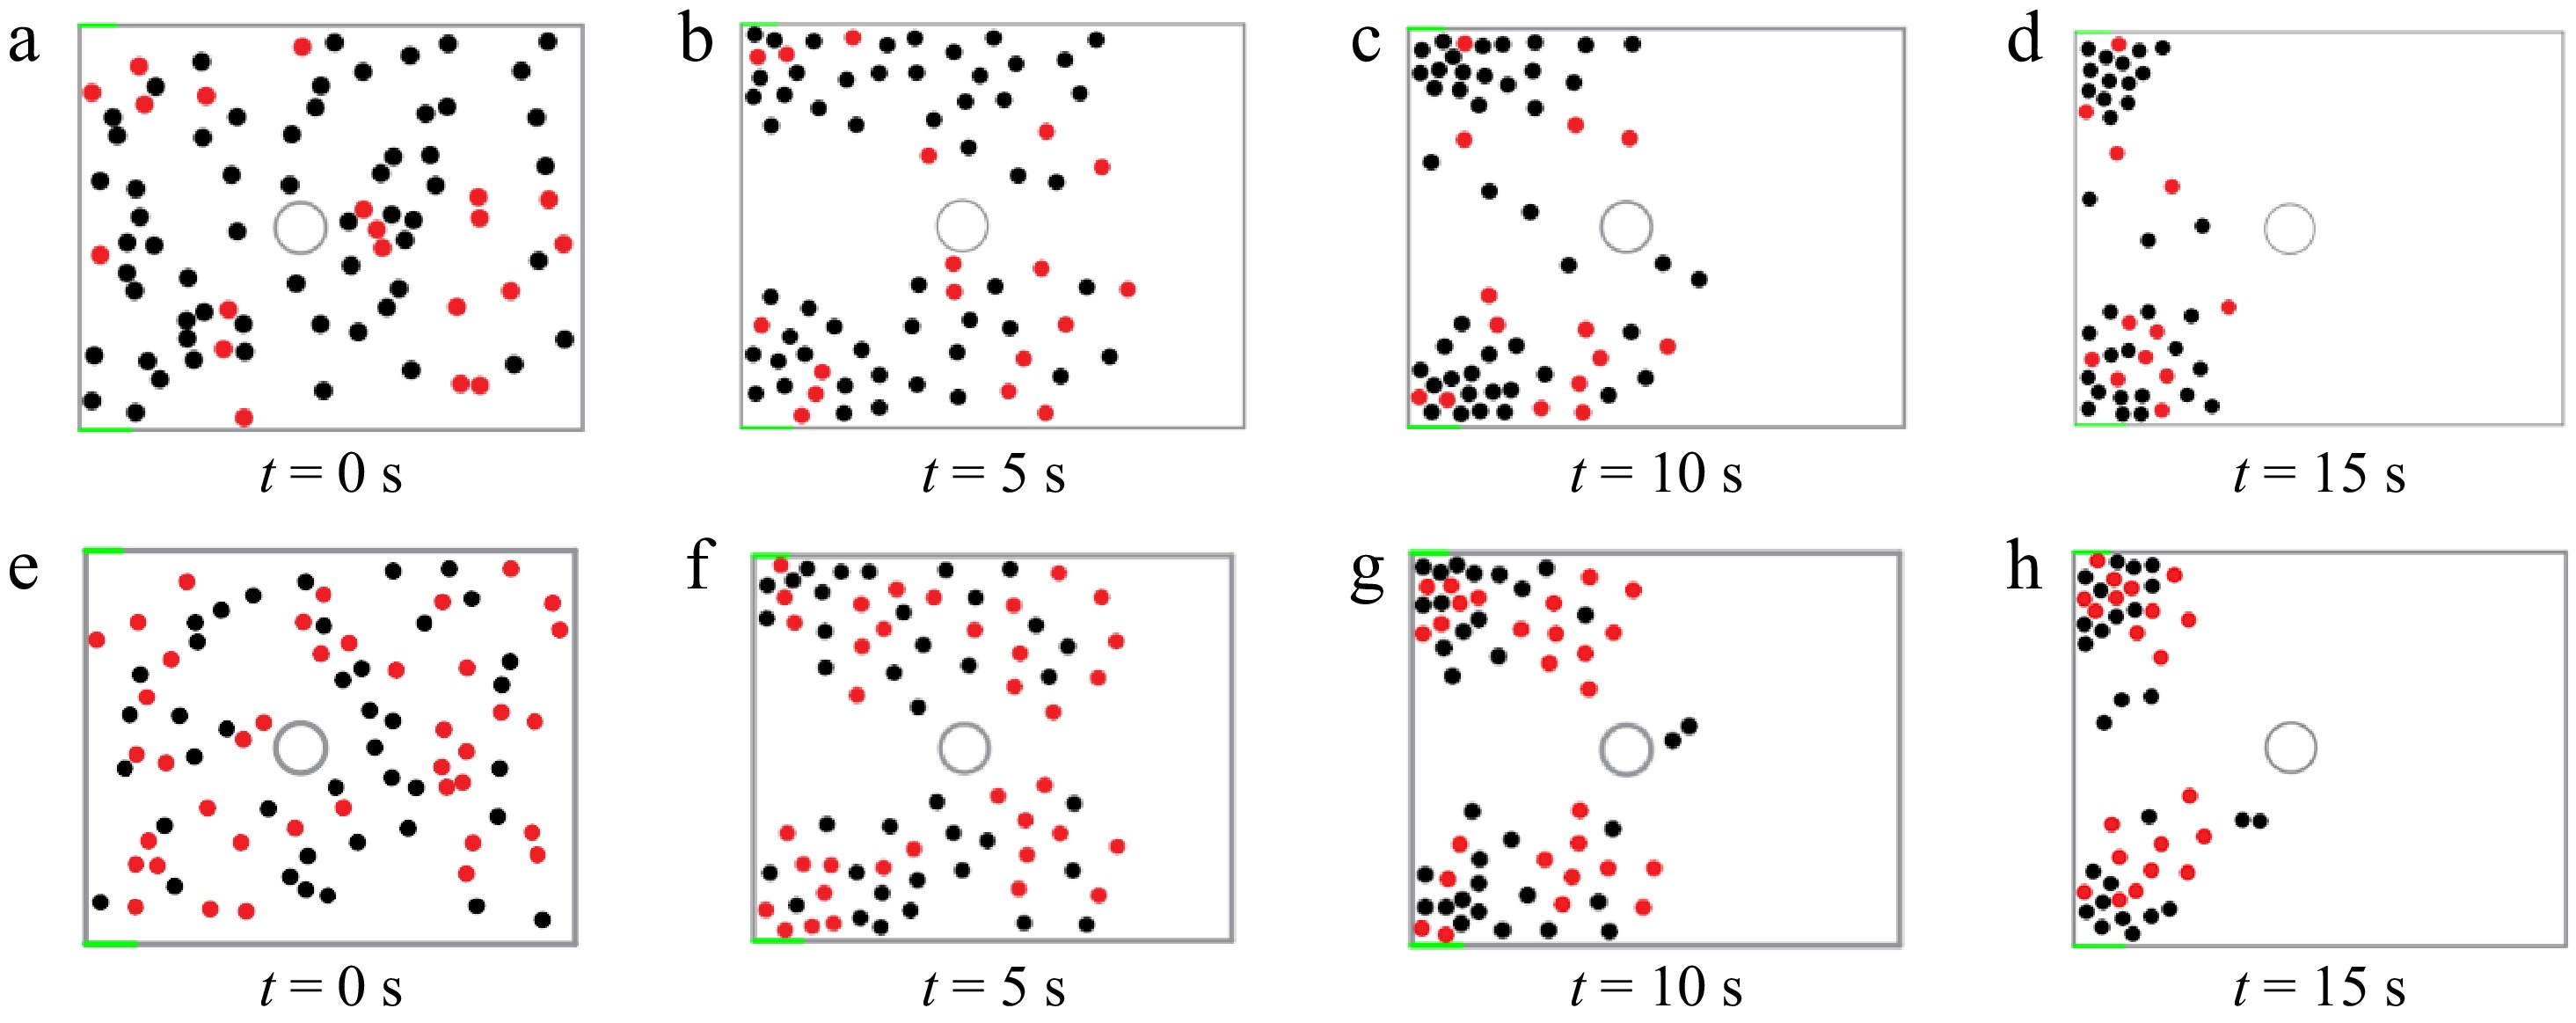
Figure 13.
Simulation diagram of pedestrian dynamic distribution at different time points, with sensitive and insensitive pedestrians are represented in black and red, respectively.
These results indicate that the evacuation time increases with the number of insensitive pedestrians until the number of insensitive pedestrians reaches 30. When the number of insensitive pedestrians is small, the density at the exit has a larger effect than the exit width on the pedestrians' exit choice, and the lighted guidance signs improve the evacuation efficiency. The influence of the lighted guidance sign on the pedestrians' exit choice is lower for a higher number of insensitive pedestrians. With 20 insensitive pedestrians, the lighted signs reduced evacuation time by 27.5% (from 48.6 to 35.2 s) compared to Scenario 1. However, this improvement decreased to 12.1% when insensitive pedestrians exceeded 30, highlighting the signs' limited efficacy in heterogeneous crowds.
Evacuation with lighted guidance signs in a low-view environment
-
The limit distance of the glasses with 50% opacity was tested in a dim hallway and a well-lit parking lot (Fig. 14). The limit distance was 8−10 m in the hallway and 12−15 m in the parking lot. Thus, the limit distance in the simulation was 10 m.
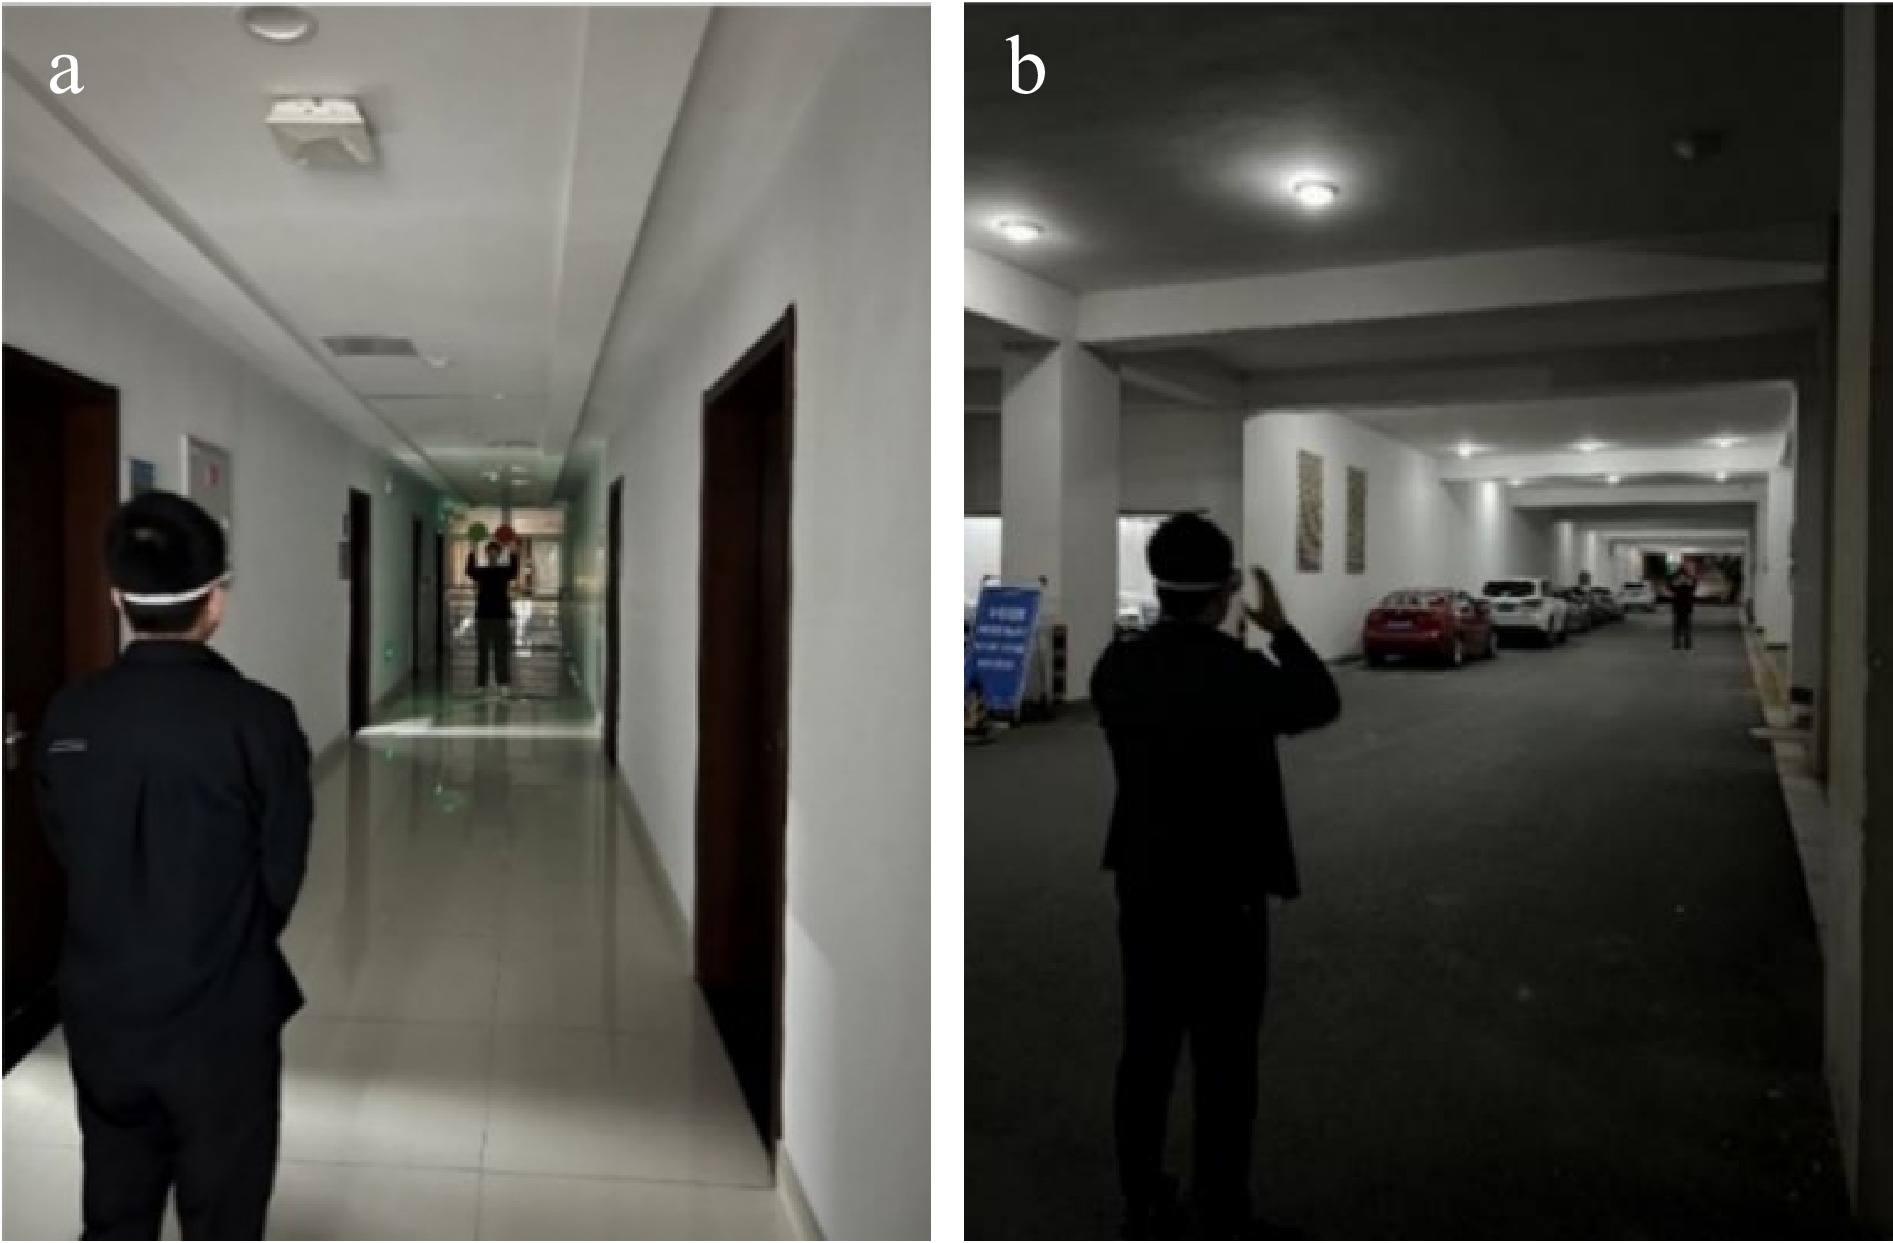
Figure 14.
Limit distance test with 50% opacity glasses: (a) hallway, (b) parking.
Figure 15 shows the relationship between the evacuation time and the number of insensitive pedestrians for different exit widths in a low-view environment. The evacuation time is significantly higher than in the normal-view environment due to the lower average speed of the pedestrians caused by the low-view. Unlike the normal-view environment, evacuation time shows a slight increase with more insensitive pedestrians. In addition, the influence of the exit width on the evacuation time is significantly greater in the low-view environment than in the normal-view environment. In the low-view environment, pedestrians have greater difficulty seeing the lighted signs. Thus, the influence of the evacuation signs on the pedestrians is smaller, and the exit width is more influential.
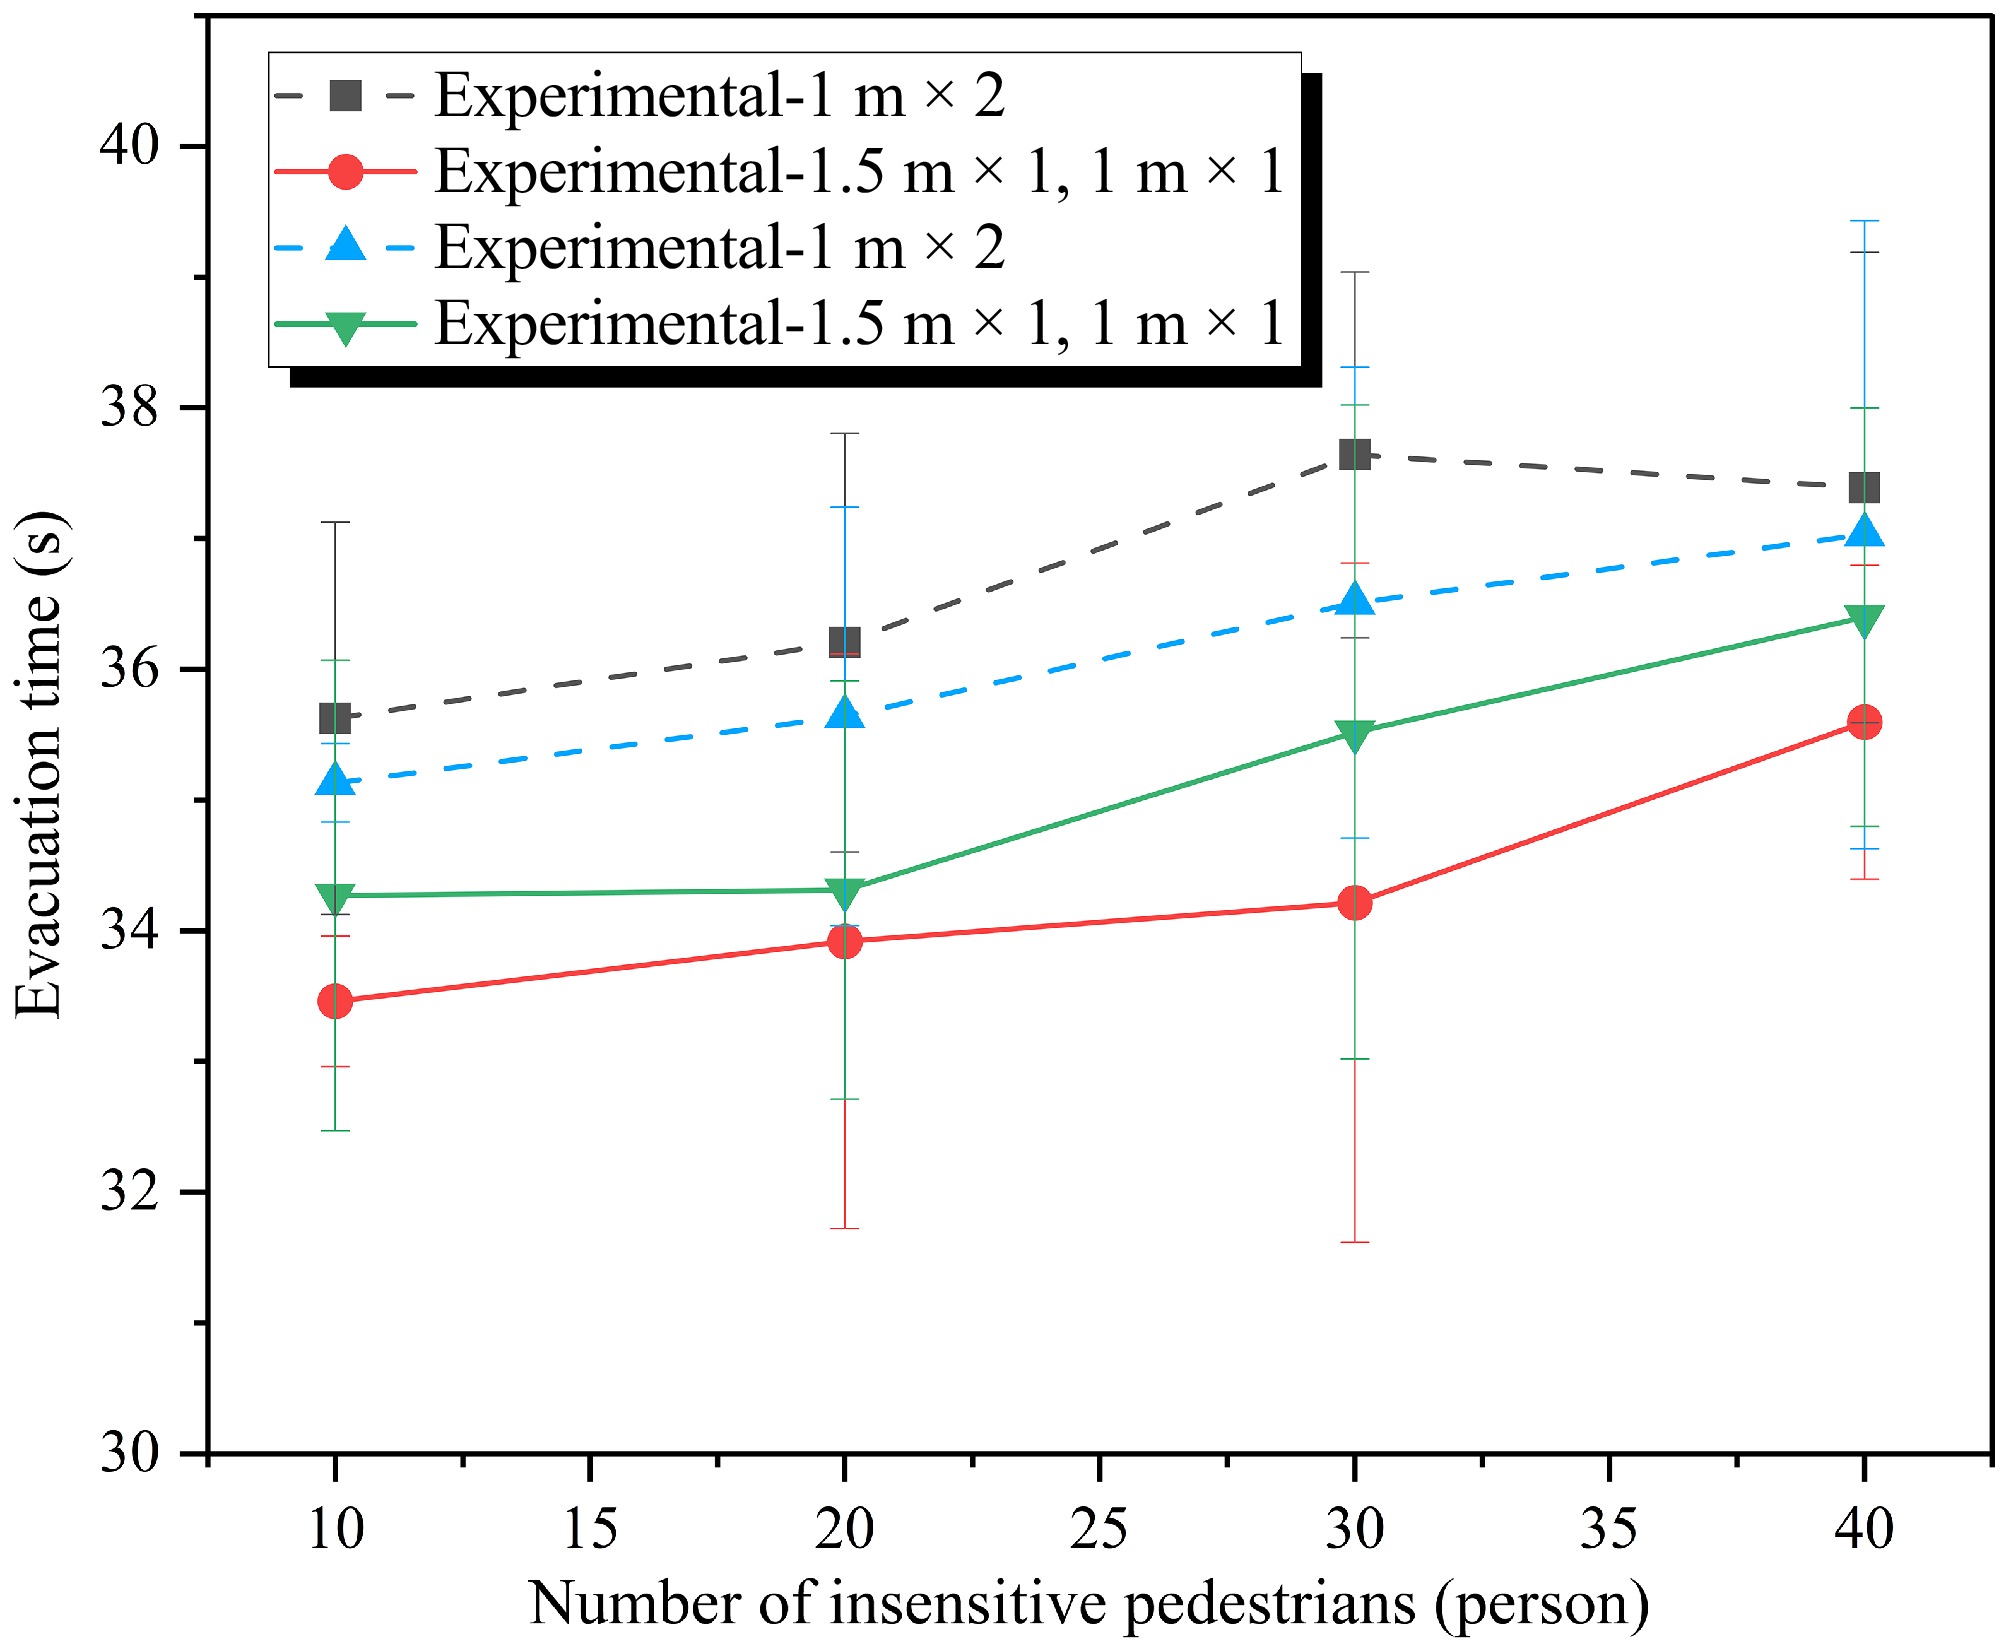
Figure 15.
Scenario 3 experimental and simulation results.
Figure 16 shows that the difference in the number of evacuated pedestrians between the two exits is small when the exit width is 1 m in the low-view environment, consistent with the results for the normal view environment. However, when the exit width is expanded to 1.5 m, the results differ from that of the normal view environment. In the normal view environment, the difference between the number of pedestrians evacuated from exit a and exit b is very small for a few insensitive pedestrians (10 or 20 people). While in the low view environment, the number of pedestrians evacuated from exit a is significantly larger than that from exit b, regardless of the number of insensitive pedestrians. The relative density of pedestrians at the exit is also different in this scenario.
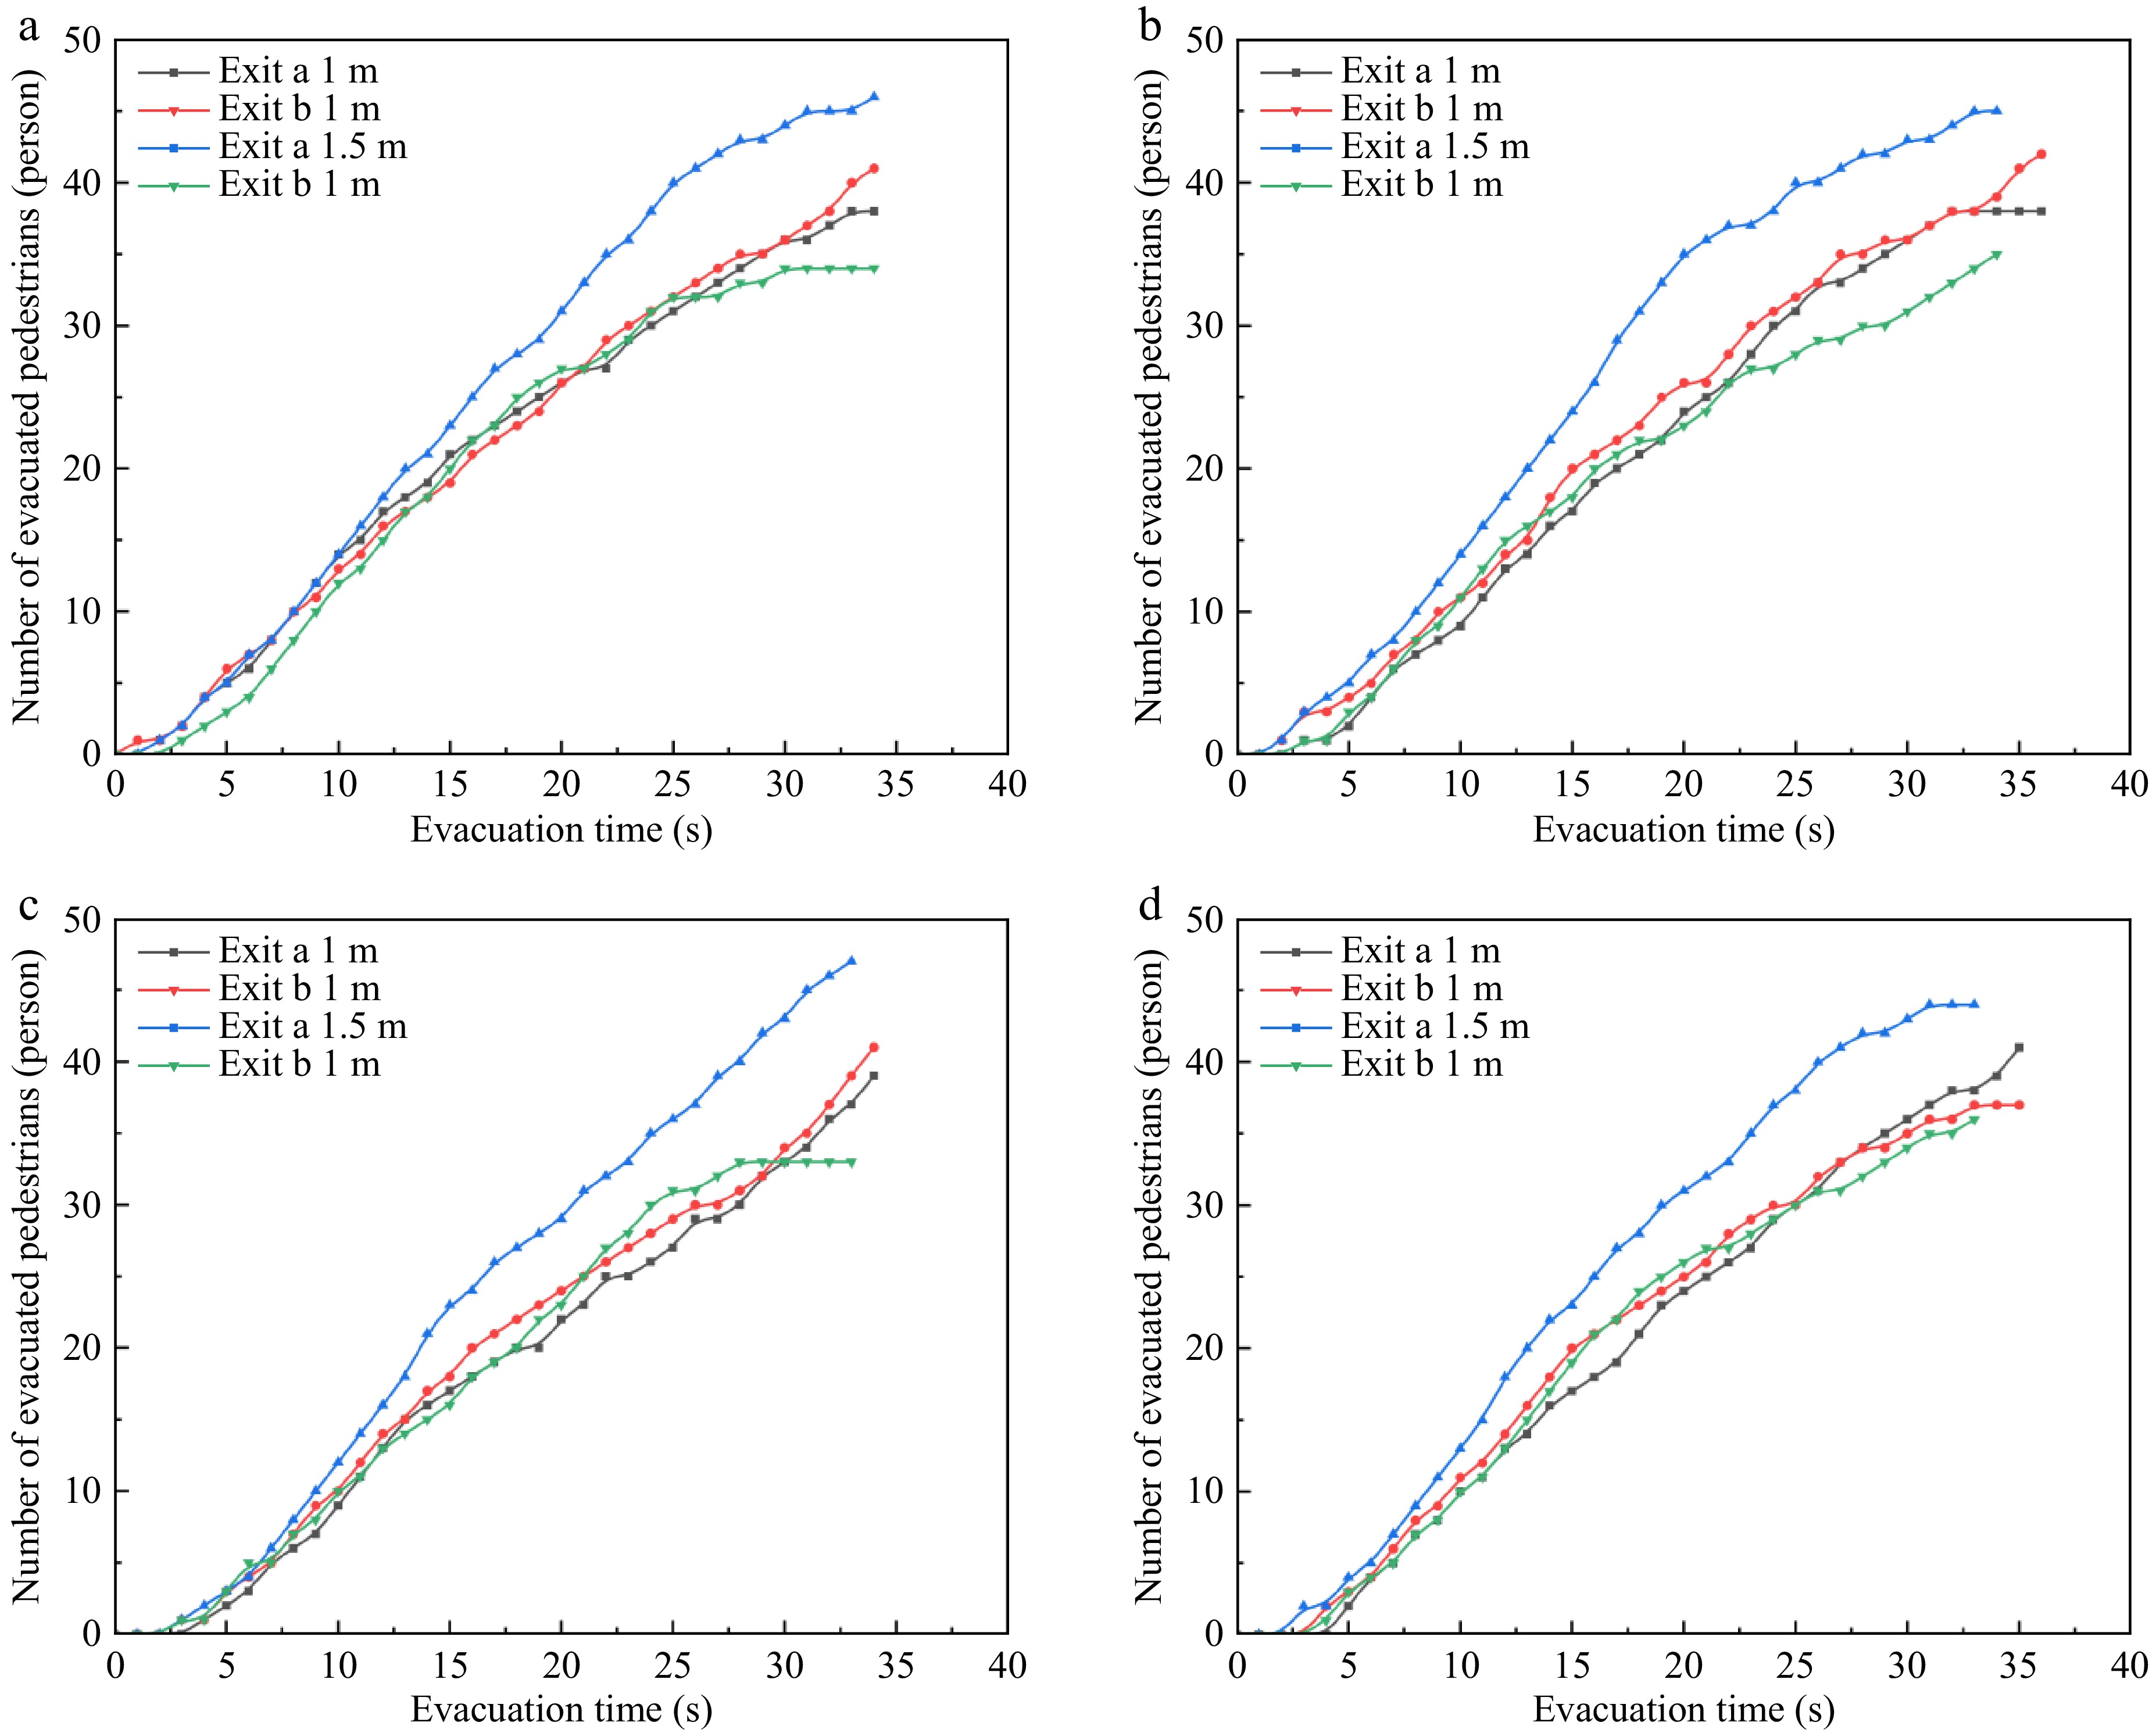
Figure 16.
Number of pedestrians evacuated with varying numbers of insensitive pedestrians ((a) 10, (b) 20, (c) 30, (d) 40) at two exits under Scenario 3.
Figure 17 shows the relative density at the exit under different operation conditions. In the normal view environment, when there are few insensitive pedestrians, the relative density at the exits fluctuates significantly with time, exceeding the density threshold at multiple discontinuous time points. However, when there are many insensitive pedestrians, the overall trend of relative density at the exits shows an initial increase followed by a decrease, with continuous and longer-lasting occurrences of density exceeding the threshold. However, in the low view environment, the trend of the relative density at the exit is similar to that under normal view environment, regardless of the number of insensitive pedestrians. The density threshold is reached later than in normal view environment, and the duration of exceeding the density threshold is longer. The reason is that the pedestrians' vision is obstructed, and the speed is slower in the low view environment. When the density threshold is reached at the exit, the pedestrians at the rear cannot tell that the area is congested and choose the original exit. Due to the slower speed of the pedestrians, the time when the pedestrian density reaches the threshold at the two exits is close and occurs later than in normal view environment. Only a few pedestrians change their exit choices.
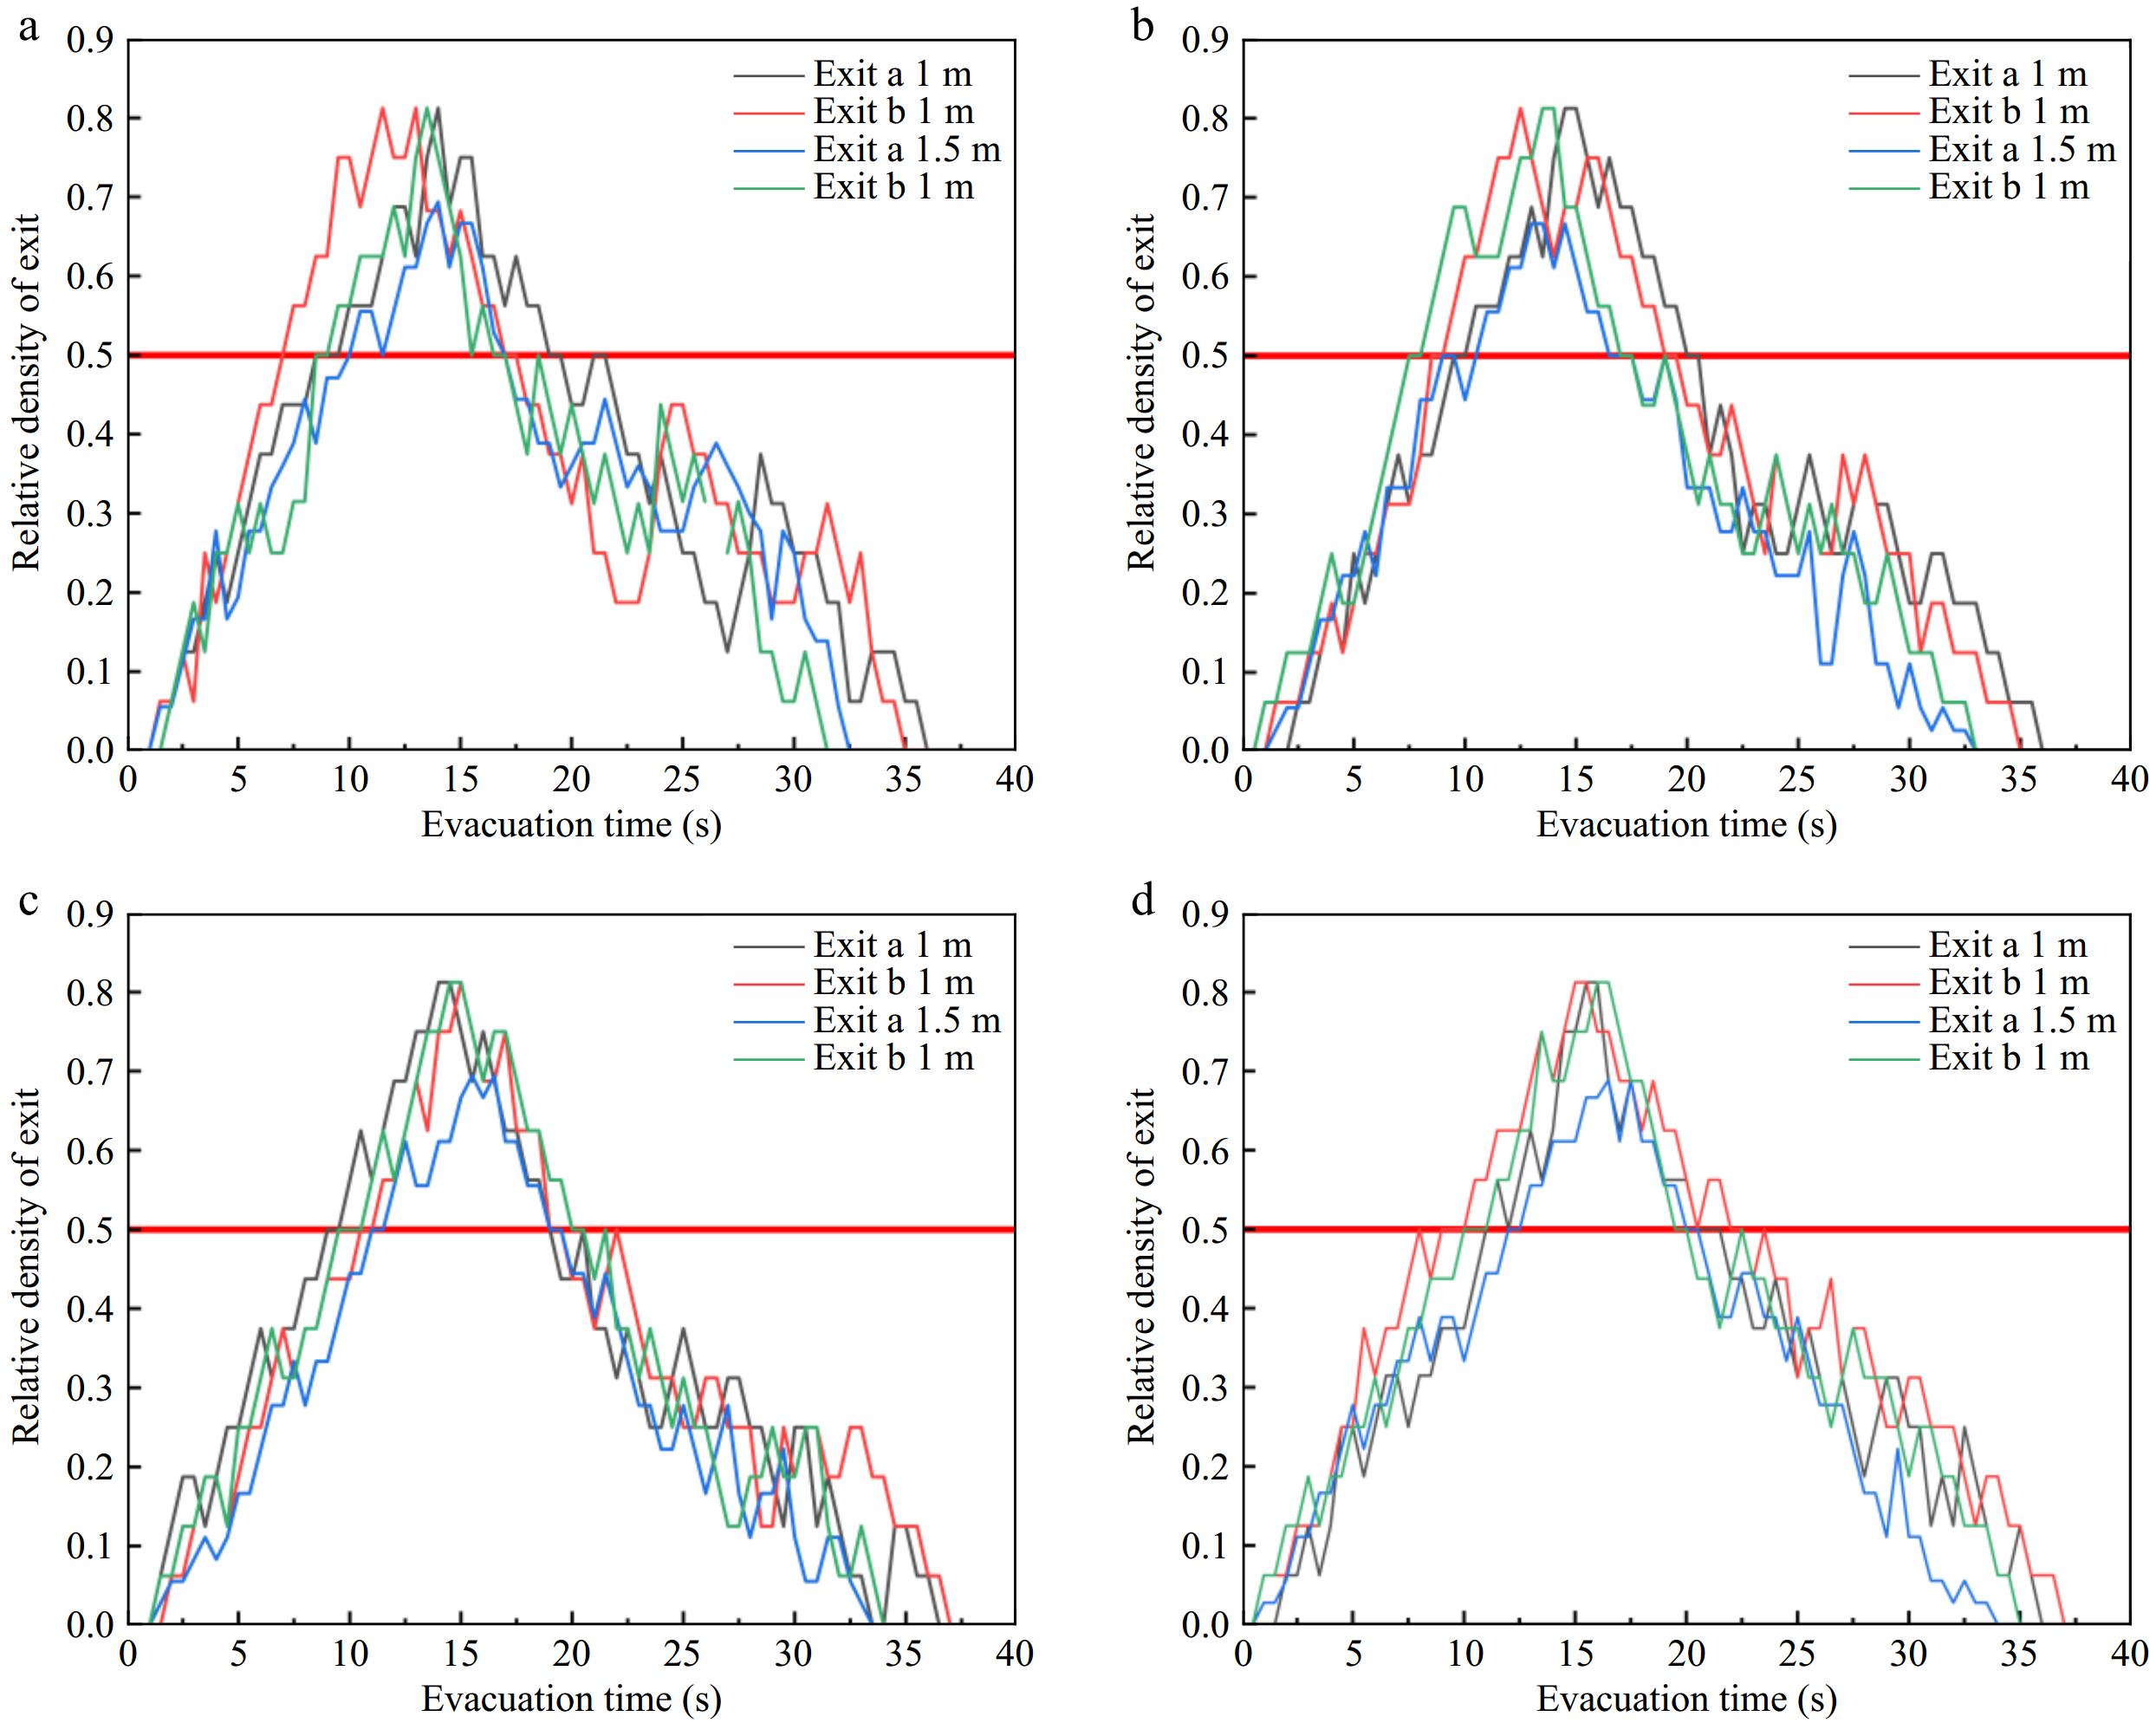
Figure 17.
Relative pedestrian density with varying numbers of insensitive pedestrians ((a) 10, (b) 20, (c) 30, (d) 40) at two exits under Scenario 3.
The pedestrian dynamics during the evacuation in a low-view environment were analyzed for 20 and 40 insensitive pedestrians and the exit width of a is 1.5 m. The pedestrian trajectory and speed is shown in Fig. 18.
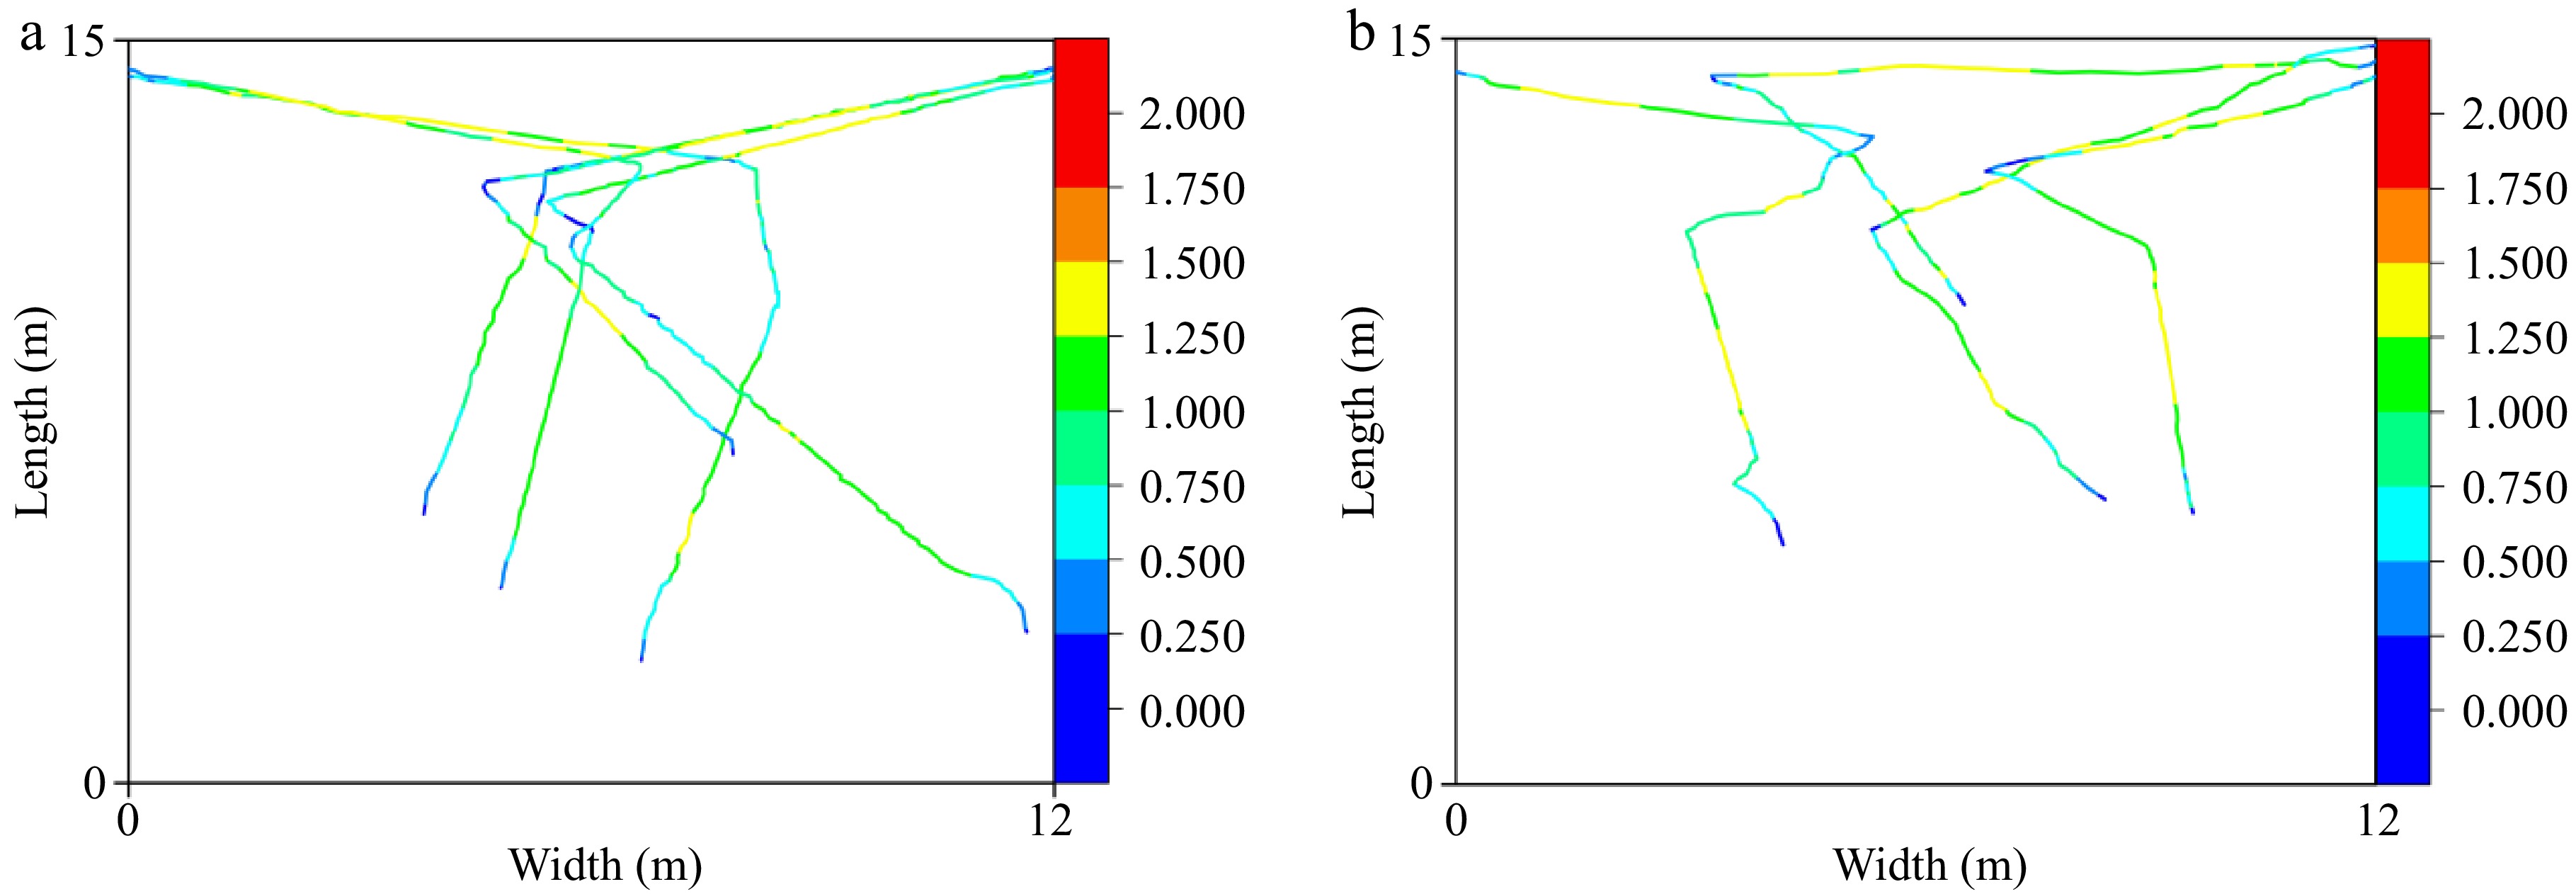
Figure 18.
The trajectory map of the exit re-selection for sensitive pedestrians under varying numbers of insensitive pedestrians ((a) 20 , (b) 40) at two exits under Scenario 3.
A significant difference in the trajectory is observed between the normal view and low-view environments. The proportion of pedestrians who change their exit re-selection is 15% in the normal view environment and 6% in the low-view environment for 20 insensitive pedestrians. In the low-view environment, pedestrians at the rear have greater difficulty seeing the red light at the exit, and they choose the original exit. In addition, pedestrians who change their exit selection in the normal view environment are located in the middle of the evacuation lane because sensitive pedestrians perceive the congestion at the exit. However, pedestrians have limited view in the low-view environment and choose the exit with the closest distance. Fewer pedestrians change their exit selection when there are 40 insensitive pedestrians, regardless of the view conditions. More pedestrians consider the exit width and distance, and the proximity in time of both exits reaching the pedestrian density threshold leads to sensitive pedestrians persisting in their choice of the original exit. The pedestrian speed is significantly slower in the low-view environment than in the normal-view environment, but the trend is the same. The speed is 1.00 ± 0.25 m/s after the evacuation starts but drops to 0.75 ± 0.25 m/s when the pedestrians change exits because they choose the exit according to the lighted guidance signs. After changing the exit selection, the pedestrians accelerate to the exit, and the speed increases to 1.25 ± 0.25 m/s.
The dynamic distribution of pedestrians during the evacuation for 20 and 40 pedestrians and exits widths of 1.5 m for exit a and 1 m for exit b is shown in Fig. 19. Figure 19a−d depicts the screenshots of 20 pedestrians at four time points, and Fig. 19e−h shows the corresponding results for 40. Although the number of insensitive pedestrians is small (20 people), only a few change their exit choice (Fig. 19a−d). After 15 s, exit b has more pedestrians because it is narrower than exit a. Some sensitive pedestrians change their exit choice and move toward exit a. This result differs from that of the normal view environment. In the latter, sensitive pedestrians can perceive the color change of the lighted guidance sign at the exit in time and change their exit choice according to the congestion at the exit. While in the low-view environment, sensitive pedestrians can only observe the lighted guidance sign when they are close to the exit. Thus, the number of pedestrians who change their exit choice is much lower. The results for 40 insensitive pedestrians are similar to those of the normal view environment. The obstructed view and the high number of insensitive pedestrians cause pedestrians to change their exit choice only after the middle phase of the evacuation. After 15 s, since exit b is narrower, more pedestrians gather at exit b and few sensitive pedestrians move towards exit a.
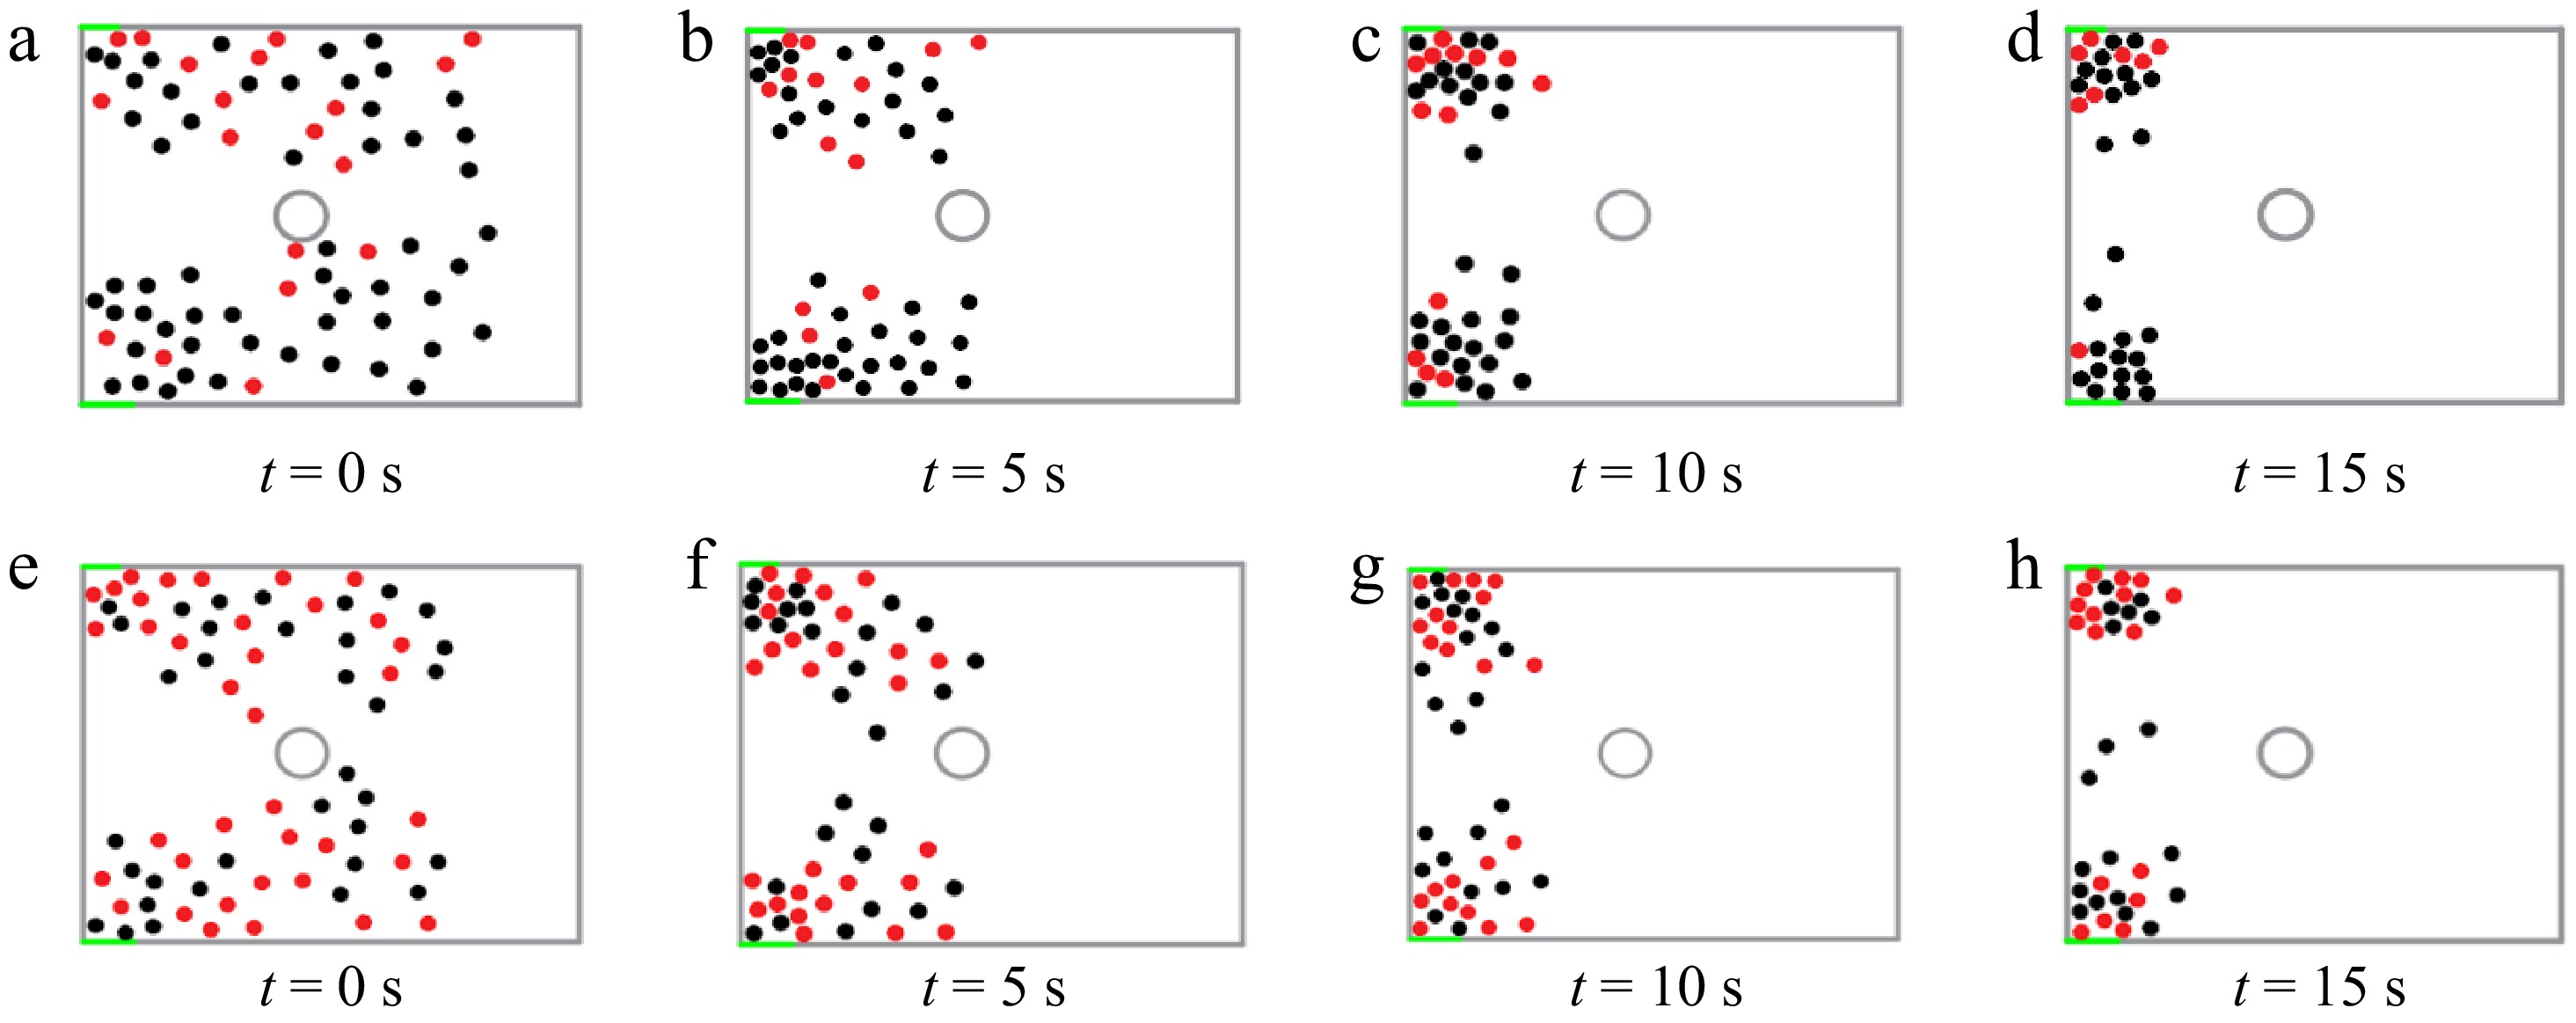
Figure 19.
Simulation diagram of pedestrian dynamic distribution at different time points, with sensitive and insensitive pedestrians are represented in black and red, respectively.
Therefore, it can be concluded that in the low-view environment, increasing the number of insensitive pedestrians has a limited impact on the evacuation time, expanding the exits is more effective in reducing evacuation time. A significantly larger number of pedestrians choose exit a with a width of 1.5 m than exit b with a width of 1 m under four different conditions with varying numbers of insensitive pedestrians. The relative density at the exit under the four working conditions shows an initial increase followed by a decrease, reaching the density threshold for a continuous time and a longer duration. In the low-view environment, the impact of the lighted guidance signs on the pedestrians' exit choice diminishes, while the influence of exit width becomes more significant. In low visibility, the signs' effectiveness dropped significantly: evacuation time improved by only 8.9% (52.1−47.5 s) for 20 insensitive pedestrians, while exit width expansion (1−1.5 m) yielded a 22.4% reduction (52.1−40.4 s), emphasizing the dominance of physical exit design under impaired visibility.
-
A small-scale multi-exit evacuation experiment with lighted guidance signs and three experimental scenarios was conducted. The evacuation time, the number of pedestrians at each exit, the relative pedestrian density at the exits, and the pedestrian trajectory were compared and analyzed. An improved SFM for pedestrian classification was combined with an exit selection model, and a density threshold was used. The simulation and experimental results were compared to verify the proposed model's accuracy. The conclusions for the different scenarios are as follows:
(i) Evacuation with no lighted guidance signs: The pedestrians tended to choose the wider exit. Increasing the exit width had a greater effect on reducing the evacuation time for 80 pedestrians than for 60 and 100 pedestrians. The simulation and experimental results were similar.
(ii) Evacuation with lighted guidance signs: The pedestrian speed was higher in this scenario because they were attracted by the lighted guidance signs. The evacuation time was positively correlated with the number of insensitive pedestrians but stabilized after reaching 30 insensitive pedestrians. The effect of the lighted guidance signs was larger for fewer insensitive pedestrians, and the signs improved the evacuation efficiency. The simulation and experimental results were similar.
(iii) Evacuation with lighted guidance signs in a low view environment: Low view environments can slow down pedestrian evacuation speed. The evacuation time exhibited a negligible change as the number of insensitive pedestrians increased. Increasing the exit width had a larger impact on the evacuation time than the lighted guidance signs. The simulation and experimental results were similar.
Based on our findings, we propose the following design guidelines for lighted guidance signs in subway stations:
(i) Optimal pedestrian density: signs should activate when exit density exceeds 0.5 persons/m² (Eqn 2), as higher thresholds delay rerouting decisions.
(ii) Color scheme: green/red lights must use high-contrast colors (e.g., RGB 0,255,0 for green) to ensure visibility in low-view environments.
(iii) Dynamic updates: signs should refresh at ≤ 2-s intervals to prevent information lag, especially in crowds with > 30% insensitive pedestrians.
(iv) Placement: signs should be positioned within 10 m of exits to accommodate low-visibility conditions, as tested in Fig. 14.
These parameters balance evacuation efficiency and adaptability to heterogeneous pedestrian behaviors.
One limitation of this study is that the color of the lighted sign was changed manually by research personnel at the exit. Therefore, intelligent real-time evacuation information and pedestrian evacuation guidance strategies deserve further research.
This research has been supported by the Research Fund of National Natural Science Foundation of China (Grant No. 52174190), Qing Lan Project in Jiangsu Province of China, Postgraduate Research & Practice Innovation Program of Jiangsu Province, China (SJCX24_0527).
-
The authors confirm contribution to the paper as follows: overall conception and design of the research: Zhou R, Hao M, Fu J; provision of resources (including experimental materials, research funds, equipment, and facilities, etc.): Zhou R, Hao M; data collection, processing, and paper writing: Fu J; review of the results, revision and approval of the final version of the manuscript: Zhou R, Hao M, Li Y, Yu L, Cai Z, Liang W, Wang Y, Jiang J. All authors reviewed the results and approved the final version of the manuscript.
-
All data generated or analyzed during this study are included in this published article.
-
The authors declare that they have no conflict of interest.
- Copyright: © 2025 by the author(s). Published by Maximum Academic Press on behalf of Nanjing Tech University. This article is an open access article distributed under Creative Commons Attribution License (CC BY 4.0), visit https://creativecommons.org/licenses/by/4.0/.
-
About this article
Cite this article
Fu J, Li Y, Yu L, Cai Z, Liang W, et al. 2025. Experimental and simulation study on the effect of lighted guidance signs on exit re-selection for different pedestrian types. Emergency Management Science and Technology 5: e010 doi: 10.48130/emst-0025-0008 

Experimental and simulation study on the effect of lighted guidance signs on exit re-selection for different pedestrian types
- Received: 06 March 2025
- Revised: 12 April 2025
- Accepted: 14 May 2025
- Published online: 28 May 2025
Abstract: Large subway stations have many exits. Selecting the correct exit is crucial for pedestrian evacuation during a disaster. Thus, the intelligent guidance of pedestrians is necessary during an evacuation. In this study, a small-scale multi-exit evacuation experiment is conducted in an H-type subway station using lighted guidance signs to indicate the real-time pedestrian density at the exit. Three experimental scenarios are investigated: evacuation with no lighted guidance signs; evacuation with lighted guidance signs; and evacuation with lighted guidance signs in a low-view environment. The exit choice model and the social force model with pedestrian classification are used, and a density threshold is incorporated into the exit choice model for numerical simulation. The simulation results are compared with the experimental results. The results show that pedestrians are more inclined to choose wider exits when no lighted guidance signs are used. The lighted guidance signs significantly improve evacuation efficiency, and this effect is more pronounced for fewer insensitive pedestrians (10 or 20 people). The lighted guidance signs are less effective in a low-view environment, and the exit width is a more crucial factor in choosing an exit.
-
Key words:
- Social force model /
- Multi-exit evacuation /
- Lighted guidance sign /
- Exit re-selection