


-
The urgency of the problem of vegetation fires, including forest fires, is significant worldwide. In the forests of Russia, which occupy about 50% of the entire territory of the country, and have an area of 1.2 billion hectares, from 10 to 35,000 forest fires are registered annually, covering an area of 0.5 to 2.5 million hectares[1]. Moreover, up to 97% of fires (as in the fire season of 2024), occur in hard-to-reach areas. Climate change contributes to an increase in the number and area of wildfires, but in 90% of cases, human activity is the cause.
The problem of wildfires cannot be solved solely by improving fire suppression equipment without taking into account the nature of vegetation fires, as shown by the experience of developed countries of Canada and the USA, where national fire danger rating and fire behavior prediction systems have long been created[2,3] and are under continuous development[4,5].
In Russia, despite the difficult economic situation in the country and limited funds in forestry for improving forest fire protection, a vegetation fire monitoring system has been developed and successfully applied in practice, including space monitoring and air patrol of forests[6], and a fire danger rating system based on weather conditions. There is however no system for predicting the behavior of vegetation fires in Russia, but there are all the prerequisites for its development based on the long-term fundamental fire science research, which allows for the creation of the necessary database.
Forest fire protection can involve such inevitable situations that require prediction of fire occurrence probability, fire behavior, and effects. Firstly, when a significant number of fires occur and there are not enough suppression forces to stop them in a timely manner, one should select the most dangerous fires in terms of possible fire damage (especially the ones threatening settlements and valuable objects) and the most difficult in terms of fighting them in case of their development. Secondly, when creating an optimal plan for managing a large fire (including its control and suppression), it is necessary to foresee and take into account dangerous trends and situations in its spread and development. Thirdly, scenarios of the fire spread and its effects over a certain area under various weather conditions are necessary to choose the optimal time and technology for prescribed burning.
It is difficult to imagine the implementation of these tasks listed above without special maps containing the pyrological (i.e., fire- and fuel-related) characteristics of the complex of vegetation fuels (VFs). VF maps are the basis for predicting fire occurrence, behavior, and effects. The prediction of surface fire occurrence and behavior is of the greatest importance, since such fires account for more than 80% of all vegetation fires, and crown fires develop from surface fires and cannot spread over significant distances without their support.
-
To develop methods for VF mapping, their detailed classification is needed. Historically, different countries have developed their own methodological approaches to the classification of VFs and to the creation of information databases for their mapping[4,5,7−9]. They correspond to the geographical, traditional, and economic conditions of the countries, which limit their borrowing. Notionally, the following methodological approaches can be distinguished: 'selective', 'standard', and 'individually standard'.
The 'selective' method empirically studies the dynamics of fuel moistening and drying as well as burning of certain categories of vegetation sites (biogeocenoses) in connection with dynamic weather conditions and phenological periods. This method was developed in Canada[10], and before the 1980s in Russia[11,12]. However, there is a huge number of different categories of vegetation sites, it takes many years to study their pyrological characteristics, and when predicting fire behavior on a particular area, the pyrological description of all sites, both forest and non-forest, is necessary. A 'selective' method cannot provide this.
With the 'standard' method, all vegetation (forest and non-forest) is roughly divided into fuel models. This method is used in the USA in the national BEHAVE system. Initially, 13 fuel models were identified in the United States, then 40 models and their number continues to grow[13]. The use of a 'standard' method for predicting the behavior of vegetation fires is to some extent preferable in treeless countries, since we consider it somewhat rough assessment for pyrological description.
All vegetation areas as objects of combustion are structural complexes of various VFs. Especially complex are forest biogeocoenoses, which can include up to seven VF groups identified in Russia by Professor Kurbatsky[11,14]. The role of different VF groups in the combustion process is different: they can carry, support, inhibit combustion, and are not involved in combustion under certain conditions. Mapping of the entire VF complex is complicated by the fact that the map should reflect not only the VFs, but also take into account the conditions of moistening, drying, and burning of the main group of fuels, i.e., fire carriers, under certain weather conditions and appearance of ignition sources. Therefore, an 'individually standard' method of pyrological classification of vegetation started being developed in Russia in the late 1970s under the guidance of Professor Ivan S Melekhov, the founding father of Russian forest fire science, Academician of the All-Union Academy of Agricultural Science. It was the time when the experimental study of the patterns of moistening, drying and burning of fuel beds in the taiga zone of different regions of Russia (European North, Western and Eastern Siberia, Transbaikalia) began[15], contributing to the development of a more advanced VF classification, which served as the basis for the development of methods and technology for VF mapping at the Sukachev Institute of Forest SB RAS.
The research began with studying the distribution of liquid precipitation under the canopy of various stands (with varying relative basal area of a tree stand) by arranging a large number (from 100 to 200) of the simplest rain gauges from trunk to trunk. The uneven distribution of rainfall under the canopy of the coniferous forest was established. Such studies were carried out in pine, Siberian pine, spruce, larch, and birch forests. Layer-by-layer moistening and drying of moss-lichen and dead cover were studied on sampling sites. Samples of the ground cover were taken with a special cylindrical drill without disturbing the structure and cut into layers depending on the type and thickness of the cover. Precipitation was measured using five simple rain gauges installed around the site where samples were taken. The time and intensity of precipitation were determined by a pluviograph at a specially equipped weather station near the test area in a small clearing. In the same test areas, observations of the penetration of solar radiation under the canopy of stands were carried out using a calorimetric method involving standard fuel (pieces of birch veneer), and experimental test ignition of the ground cover was performed daily around the clock, after complete drying of the ground cover, to determine the effect of relative humidity on moisture content of moss-lichen and dead cover during 24 h. A special metal ring shield (700 mm in diameter and 600 mm in height) was made for the safe test ignitions. The idea of the Canadian scientist Wright[16] was used in this installation, supplemented by a special heat accumulator, a vessel with water installed in the center of the screen at a height of 500 mm, 200 mm in diameter, 90 mm in height, 1,400 mL in water volume (to determine the amount of energy released). Calibration of the resulting installation on standard fuel showed that the relationship between the heating of water in the heat accumulator and the heat of combustion of a fuel layer is linear. In the installation with the described parameters, each degree of water heating corresponded to rounded 760 kJ/m2. Observations were carried out during eight field seasons of 3−5 months each in the northern and southern subzones of the Taiga, in the lowland and mountain Taiga forests of Russia. Around 790 test ignitions of the ground cover were made under different weather conditions, and more than 3,000 samples of the ground cover were examined to determine the moisture content.
The fundamental pyrological studies carried out by us served as the basis for continuing the development of the pyrological classification of vegetation, dividing the VF groups identified by Kurbatsky[11] into types. We named the first main group of VFs, which included mosses, lichens, and small plant remains, as the primary fire carriers (PFC) and identified eight types and two subtypes[15], taking the fire/fuel-related drying and moistening dynamics as the classification criterion (see Supplementary Table S1). Additionally, we analyzed numerous observations of Russian fire scientists on the rate of fire/fuel-related drying and moistening dynamics in different types of forests according to the method of Kurbatsky[12].
Schematically, this classification of primary fire carriers can be demonstrated in relation to the dryness classes based on the Nesterov Index[17] (Table 1).
Table 1. Scheme showing the idea of PFC classification.
Mossy PFC subgroup Lc
(lichen)Dm
(dry moss)Mm
(moist moss)Bm1
(bog moss)Bm2
(bog moss)Litter PFC subgroup Cg ↔ Ll ↔ C1 ↔ Nc1 Nc2 (Cured grass) (Loos litter) (Compact litter) (Non-fire-carriers) Critical class of dryness (CCD) I II III IV Would not burn Note: The critical class of dryness (CCD) for a PFC fuel type is a dryness class under which the PFC fuel class becomes flammable. A dryness class was determined based on the Nesterov Index[17]. It is the state of the primary fire carriers that determines the possibility of flaming combustion when ignition sources appear, its intensity and spread. It is, first of all, the primary fire carriers that should be shown on the VF maps, and all other fuel groups should be included in a special pyrological description or additionally indicated with conventional signs on the map (see Supplementary Table S2). The preliminary division of the remaining six VF groups into types was also carried out and is given in the general VF classification (see Supplementary Table S3)[15].
As a result of studying the factors of VF moistening and drying under the canopy of forest stands with varying relative basal area, corrections were obtained to determine the rate of PFC drying and moistening depending on the phenological periods, relative basal area, and slope (Tables 2 and 3).
Table 2. Estimation of critical dryness classes for current fire hazard assessment.
PFC subgroup Prevailing tree species Treeless Moss Litter With foliage (both leaf and needle):
pine, spruce, Siberian pine, larch, birch, aspen, firWithout foliage:
larch, birch, aspenAreas without a thick
layer of shrubsPrimary Fire Carriers (PFC)
types and subtypesRelative stand stocking* (including the second storey) ≥ 0.8 0.5−0.7** ≤ 0.4*** Any Critical dryness classes Lc Cg II I I I I Dm Ll III II I I I Mm Cl IV III III III III Bm1 Nc1 V IV (Nc1-V) IV (Nc1-V) IV (Nc1-V) IV (Nc1-V) Bm2 Nc2 Would not burn * It is the ratio of the cross-sectional area of trees at breast height (1.3 m) in a given forest stand to the cross-sectional area in a standard (for this species) forest stand, which is assumed to be 1. ** ≥ 0.6, and *** ≤ 0.5 for Northern larch open forests. Table 3. Influence of exposure and slope on drying rate (for latitude 50−60° North).
Periods Before April 30 and after September 1 From May 1
to August 31Exposure North and North-East South and
South-WestNorth and North-East Slope 20−30° > 30° > 25° > 30° Drying rate One dryness class later Two dryness classes later One dryness class earlier One dryness class later All methods of VF mapping require identification of PFC-types in natural conditions. For this, a special PFC-types identifier has been developed and is being improved. It helps to identify them in any area (in Russia and abroad) covered with any vegetation[18]. Areas without vegetation are indicated as non-fire-carriers on the VF map. For instance, the Nc1 subtype implies that fire spread over this area is possible only in the form of smoldering, since there are no PFCs in the form of a continuous layer; however, there may be other fire carriers, such as litter, turf, areas with green grass in summer, etc. The Nc2 type implies that there are no fire carriers at all in this area (sands, rocky placers, pebbles, roads, arable land, etc.), and combustion cannot take place there.
-
The methods of VF mapping proposed in the academic literature are mainly based on the use of satellite images, information about vegetation in GIS, and available field research results. To improve the VF mapping, high hopes are put on the development of modern methodology and technology for remote sensing of the Earth[5,9,19−21]. To show the entire hierarchical structure of vegetation on VF maps in a particular area, it is proposed to develop and use active sensors that 'can penetrate forest canopies and derive some surface fuel attributes'[20]. Almost all authors mention the need for high-quality field research. The need is also identified for a new generation of simulation models for fire behavior prediction which would use data that can be accurately measured in the field[9,21].
We believe that the basis for mapping VFs is their classification, the level of development of which determines the accuracy of VF maps. The methods of making VF maps depend on the available information database, the purpose of their practical use, and the scale.
The most accurate (when making a large–scale map), but also the most expensive method to make a VF map is autonomous, or rather, relatively autonomous, since airborne or satellite images are required to create the basis of the map, depending on the scale of the map. And then similar natural and territorial complexes (NTC-analogues) are highlighted in the images and the necessary pyrological descriptions of the entire VF complex are performed on them, including the identification of the PFC types, and if necessary, test ignitions of the ground cover are carried out under different dryness classes according to weather conditions to clarify the drying rate of vegetation plots, especially where it is difficult to exactly identify the PFC type. There are situations when there is a heterogeneity in the ground cover. This method of making VF maps is applicable for limited areas, for example, in valuable forest areas, or around the urban forest interface, and around important national economic facilities.
Accurate large-scale (1:10,000−1:50,000) VF maps can be made for protected areas (PAs) in the process of forest management or based on the materials of the latest forest management, using the PFC types identifier in both field and desk work.
Unlike PAs, which are arranged according to the first category (There are three categories of forest inventory in Russia: the 1st category is that of protected natural areas, the 3rd category is that of vast Taiga forests. The rest of the forest areas are managed as the 2nd category. The difference among these categories lies in areas into which the territory is divided, e.g., the 1st category has 0.5 × 1.0 km partitioning of the area, the 2nd category has 1 × 2 km, the 3rd category has 2 × 4 km. More detailed and accurate information is provided under the 1st category of forest inventory) of forest inventory, vast forest areas in the Russian forestry sector are arranged according to the third category of forest inventory. However, it is also acceptable to use the available information database in GIS for large-scale mapping. Moreover, by now, there are digitized materials for most of the forest territory of Russia.
Making VF maps based on high-resolution satellite images requires the development of interpretation features, since not all fuel types can be identified directly in the image, and indirect features should be taken into account, as well as regional conditions.
The possible method of making medium-scale (1:1,000,000−1:500,000) VF maps is based on satellite images and vegetation maps, which are used to compile the pyrological (fire/fuel-related) characteristics of sites. Field studies are also needed on selected natural territorial complexes identified in the images. The following section demonstrates examples of VF mapping performed by us.
-
Large-scale VF maps (1:10,000−1:50,000) are needed to predict fire occurrence and behavior (rate of spread and development), as well as to predict the immediate effects of vegetation fires. On the maps, the primary fire carriers are shown in color, and the pyrological description of the map provides a description of other VF groups. Figure 1a and b shows fragments of the VF map for spring (and dry fall) and summer periods of a fire season for the Ubsunur Hollow Nature Reserve. As can be seen in the spring (fall) period, the cured-grass (Cg) VF type (yellow) prevails in this area, becoming ready to burn in the first dryness class according to weather conditions. In summer, this area is characterized by the non-fire-carrier (Nc1) VF type (gray), that is, after the regrowth of green grasses, the VF type changes to a non-fire-prone one, which is observed when the load of green grasses exceeds the load of cured grass. A fire in such an area can spread slowly only under severe drought and in the form of smoldering, flamelessly. Based on the VF maps showing phenological effects on flammability, maps of the current fire hazard are made, where the stage of readiness of vegetation areas to burn is assessed in three gradations: ready to burn (red), not ready to burn (green), and in a transitional stage (yellow) (Fig. 1c and d). The example is given for the spring and summer periods with the same 3rd dryness class. So, in spring (fall) under the 3rd dryness class, fire can spread over most of the area in the event of an ignition source, and in summer, most of the area is not fire-prone. In the areas colored yellow on the maps of the current fire hazard, the possibility of fire spread is uncertain. When suppressing a particular fire, the forest fire operations manager checks their condition on the site: if fire spreads over these areas, they are colored red on the operational map.
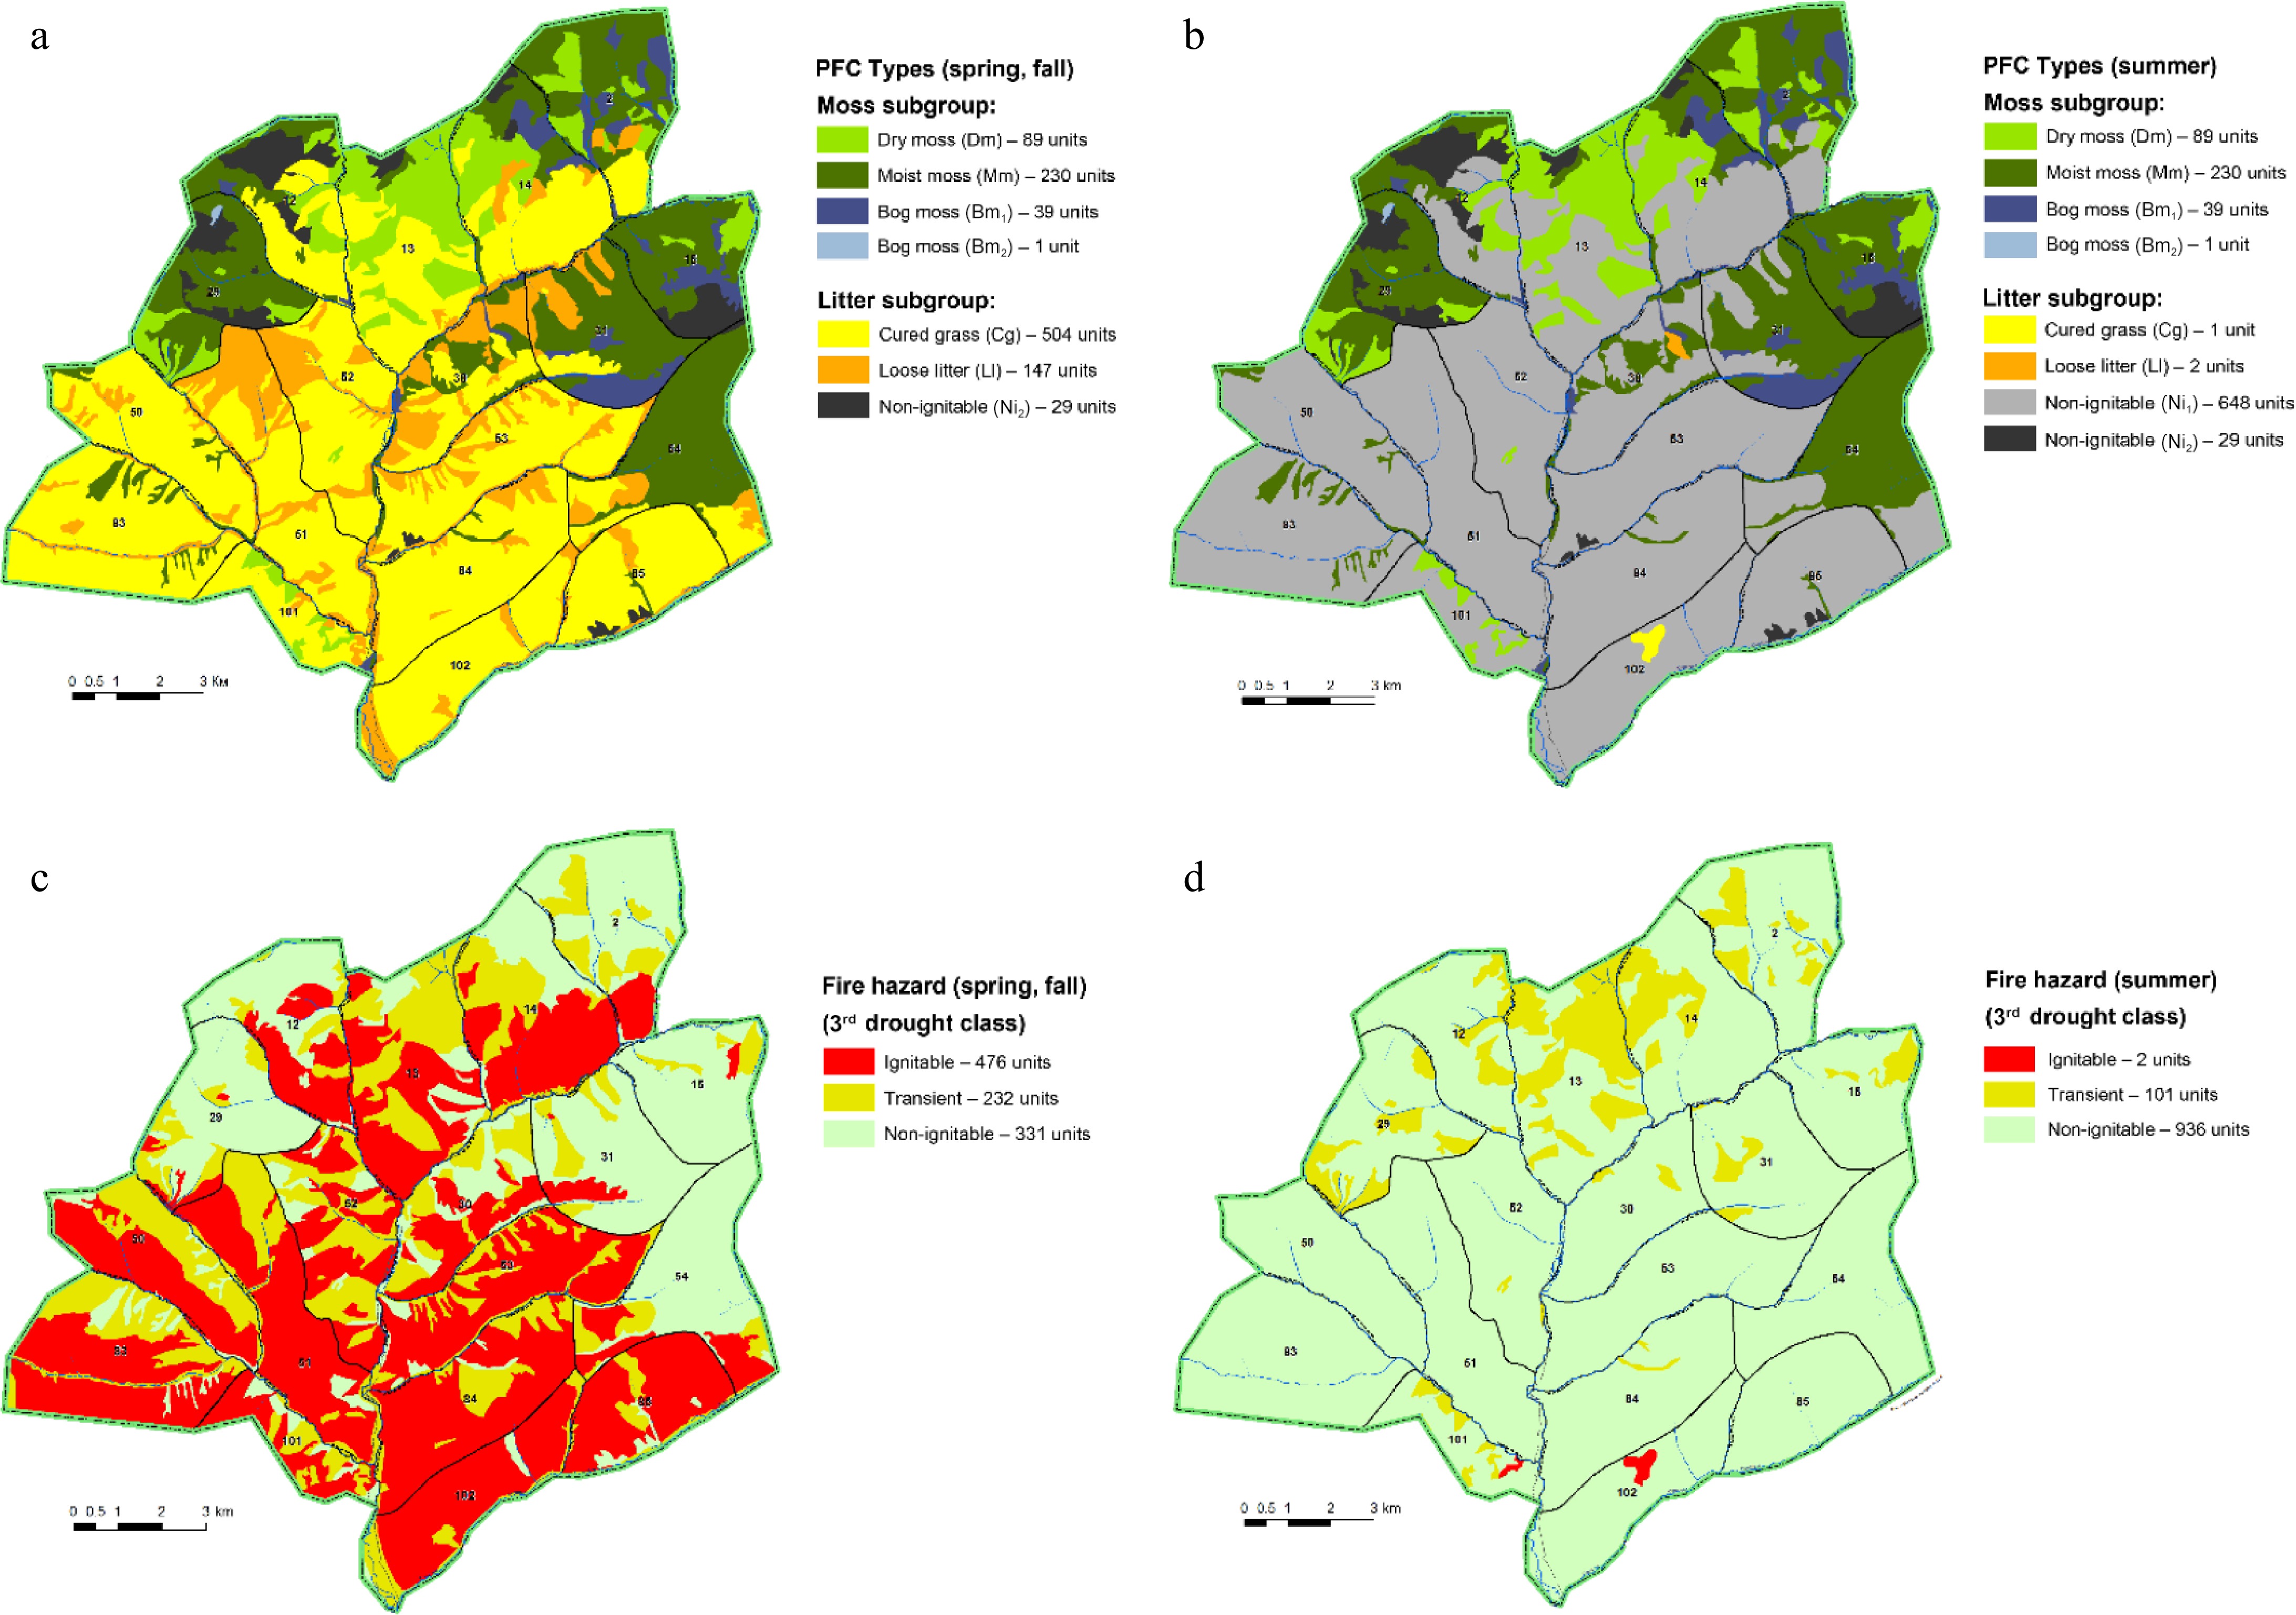
Figure 1.
Fragments of the VF map and the current fire hazard map for the Ubsunur Hollow Nature Reserve.
In limited areas, for example, in areas of valuable forestlands, around fire-prone settlements, and important national economic facilities, large-scale VF maps can be created independently based on airborne images and field descriptions of the identified vegetation. An example is the VF map made by us for a test site in Central Evenkia. Using QuickBird satellite images and the interpretation features of PFCs developed by PhD Candidate AV Safronova, a fragment of the map was made (Fig. 2). Here, in addition to the satellite image, forest inventory descriptions were used where forest types were indicated. Based on the forest type description, the PFC type was identified using the PFC identifier. If there is not enough information in the description of the forest type, field research is required. The numbers in Fig. 2 indicate areas with similar pyrological characteristics. Where an area of the same color (of the same PFC type) has two numeric symbols, field clarifications are required.
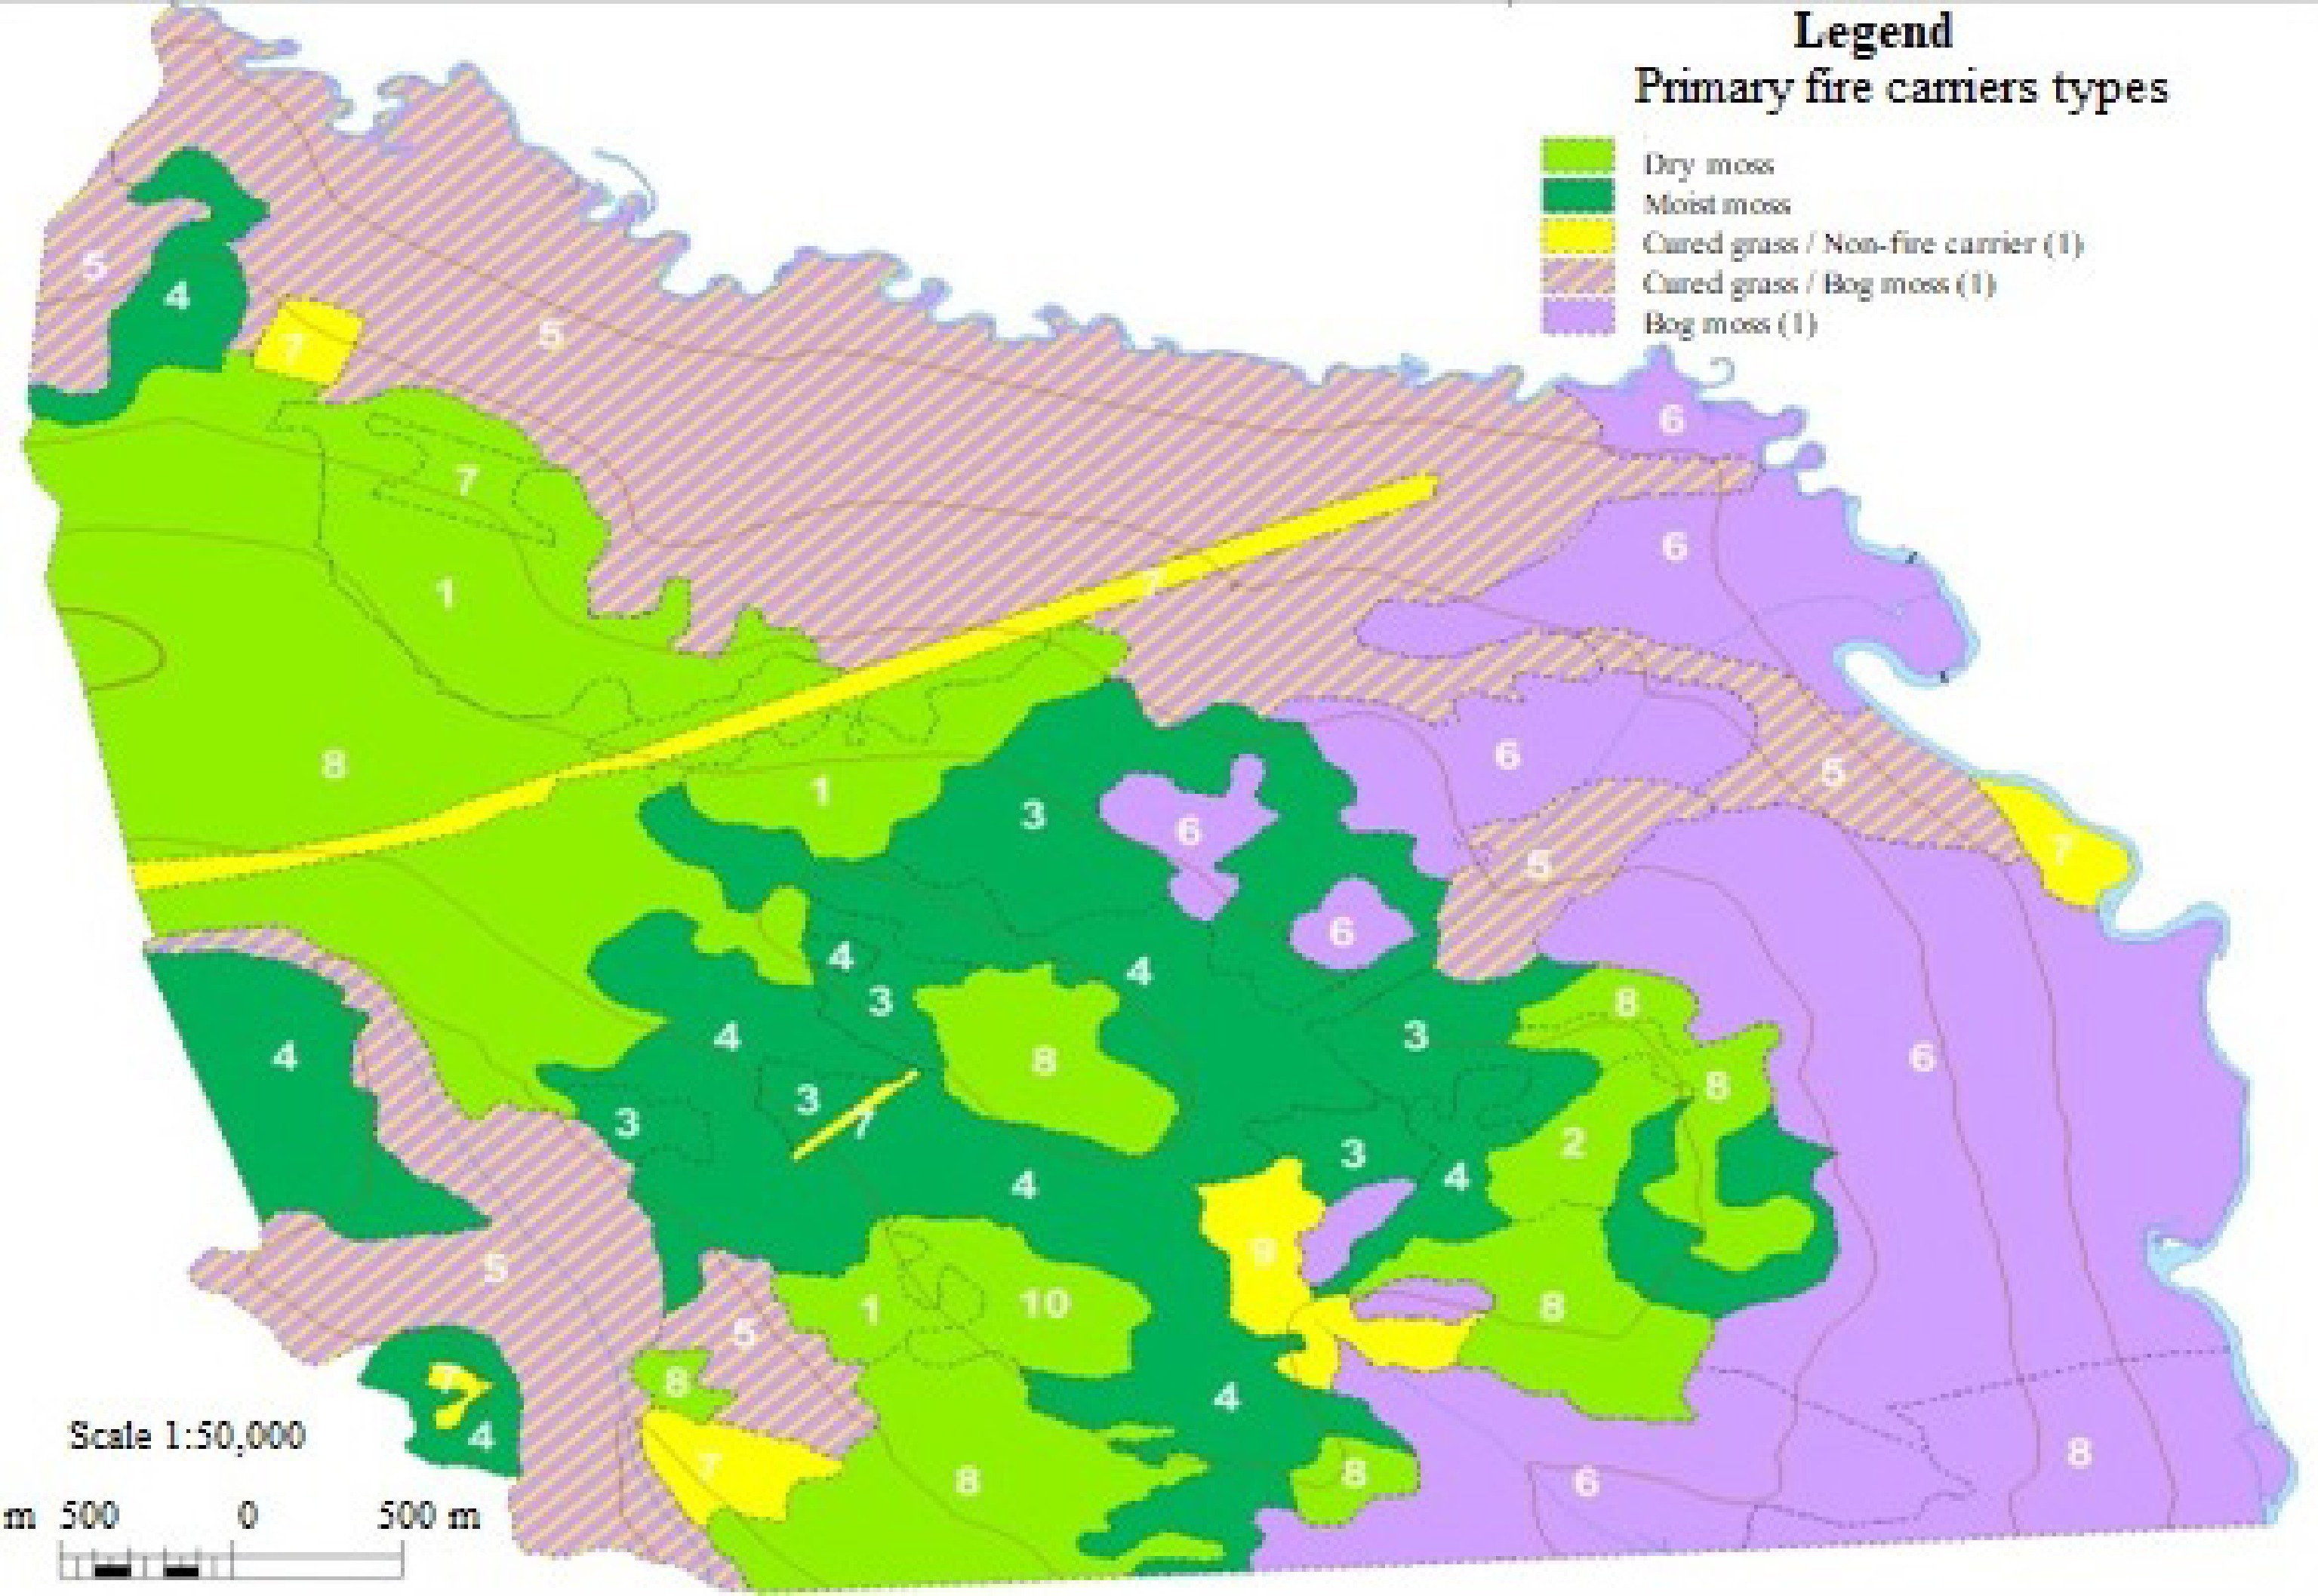
Figure 2.
The result of interpreting PFC types using QuickBird image (Evenkia, VF map fragment).
It has been revealed that the bog-moss PFC type (Bm1) is most reliably interpreted in open sphagnum bogs, and in open coniferous bog forests. In cases of continuous spread in bogs and swampy areas with open forests, sedge transforms into a cured-grass VF type (Cg) in spring and dry fall, contributing to the occurrence of running surface fires under the first dryness class according to weather conditions. In summer, the bog-moss PFC type (Bm1) persists, becoming ready to burn only under severe droughts. Such sites are reliably interpreted as Cg in spring and Bm1 in summer. However, when interpreting the PFC types in forest areas, especially high-density ones (with high relative basal area), additional information should be addressed on orography and hydrology, as well as regional Forest Type Schemes used in forest management. This way, with a sufficient degree of reliability, it is possible to identify dry-moss (Dm) and moist-moss (Mm) PFC types in the images, as well as the non-fire-carrier (Nc1) PFC type, which is typical of grass forest types in summer.
It is efficient to make such maps for large areas using forest inventory data, which are available for almost the entire forest fund of the Russian Federation, and most of them have already been digitized. However, when making VF maps, it is necessary to take into account the time limitation for forest inventory in the logging regions and in the highly fire-prone regions, since updating of forest inventory information using high- and ultra-high-resolution aerial and satellite images will be needed to introduce the latest changes in the forest fund database which occurred after the previous forest inventory procedure. Unfortunately, the transition towards less accurate forest inventory in Russia based primarily on remote sensing will not have the best effect on the quality of new information, since ground-based field research will be significantly curtailed, although ground-based data are very important to interpret PFCs in the images and show them on the VF maps. Direct PFC interpretation is possible only for a limited number of cases, and for indirect interpretation, ground-based observations are indispensable.
Based on long-term fundamental pyrological research, the Sukachev Institute of Forest SB RAS has developed a technology for making large-scale VF maps using GIS-based forest inventory information. A software program has been developed and registered for calculating the pyrological description of forest inventory plots (Certificate of State Registration No. 2014660252 dated October 03, 2014). Within the framework of Government Contract No. 82 (2008−2010), an information database was created and VF maps for different periods of a fire season were made for the Chunskoye Forestry District (Krasnoyarsk Angara Region) with an area of about 1 million hectares. Under Agreement No. 339 (2014−2015) with the East Siberian Forestry Enterprise, VF maps were made for the nature reserves: Stolby, Sayano-Shushensky, Kuznetsky Alatau, and Ubsunur Hollow.
To predict the behavior of the occurred fires and their immediate effects, a software program has been developed and registered (Certificate of State Registration of a software program ensures copyright but does not imply immediate implementation of the software program in forestry management) by the Sukachev Institute of Forest SB RAS (Certificate of State Registration No. 2015661771 dated November 09, 2015). The program is based on the VF map and the model of flame combustion spread[22]. The developed prediction method is based on the use of simple empirical dependencies and tables. First, the state of readiness to burn for vegetation plots around the ignition source is assessed in connection with the level of dryness, then the rate of fire spread and intensity within the plots are predicted in accordance with the weather forecast when modeling the fire contour spread. Finally, the possible fire effects are assessed, taking into account the fire intensity and forest inventory characteristics of a tree stand on each plot.
A retrospective performance test of the program showed good results. For this, 125 registered fires in the Chunskoye Forestry District and 10 fires in the Stolby Nature Reserve were analyzed[23]. Information was collected about the weather conditions, the locations and duration of fires, and their spread over the area. The data on the actual spread of each specific fire was compared with the data obtained using a software program to calculate the spread rate of tactical parts of each fire (front, rear, and flanks). One of the performance test results is shown in Fig. 3 and Table 4. The fire spread contours calculated using the developed software program (PGM2) reflect (by almost 98%) the actual fire spread situation under the influence of wind. However, since the given fire (No. 5) was actively extinguished in reality, the final post-suppression fire contour should not coincide with the final predicted one. In the dangerous frontal direction (downwind), the fire edge was stopped earlier than the right flank of the fire.
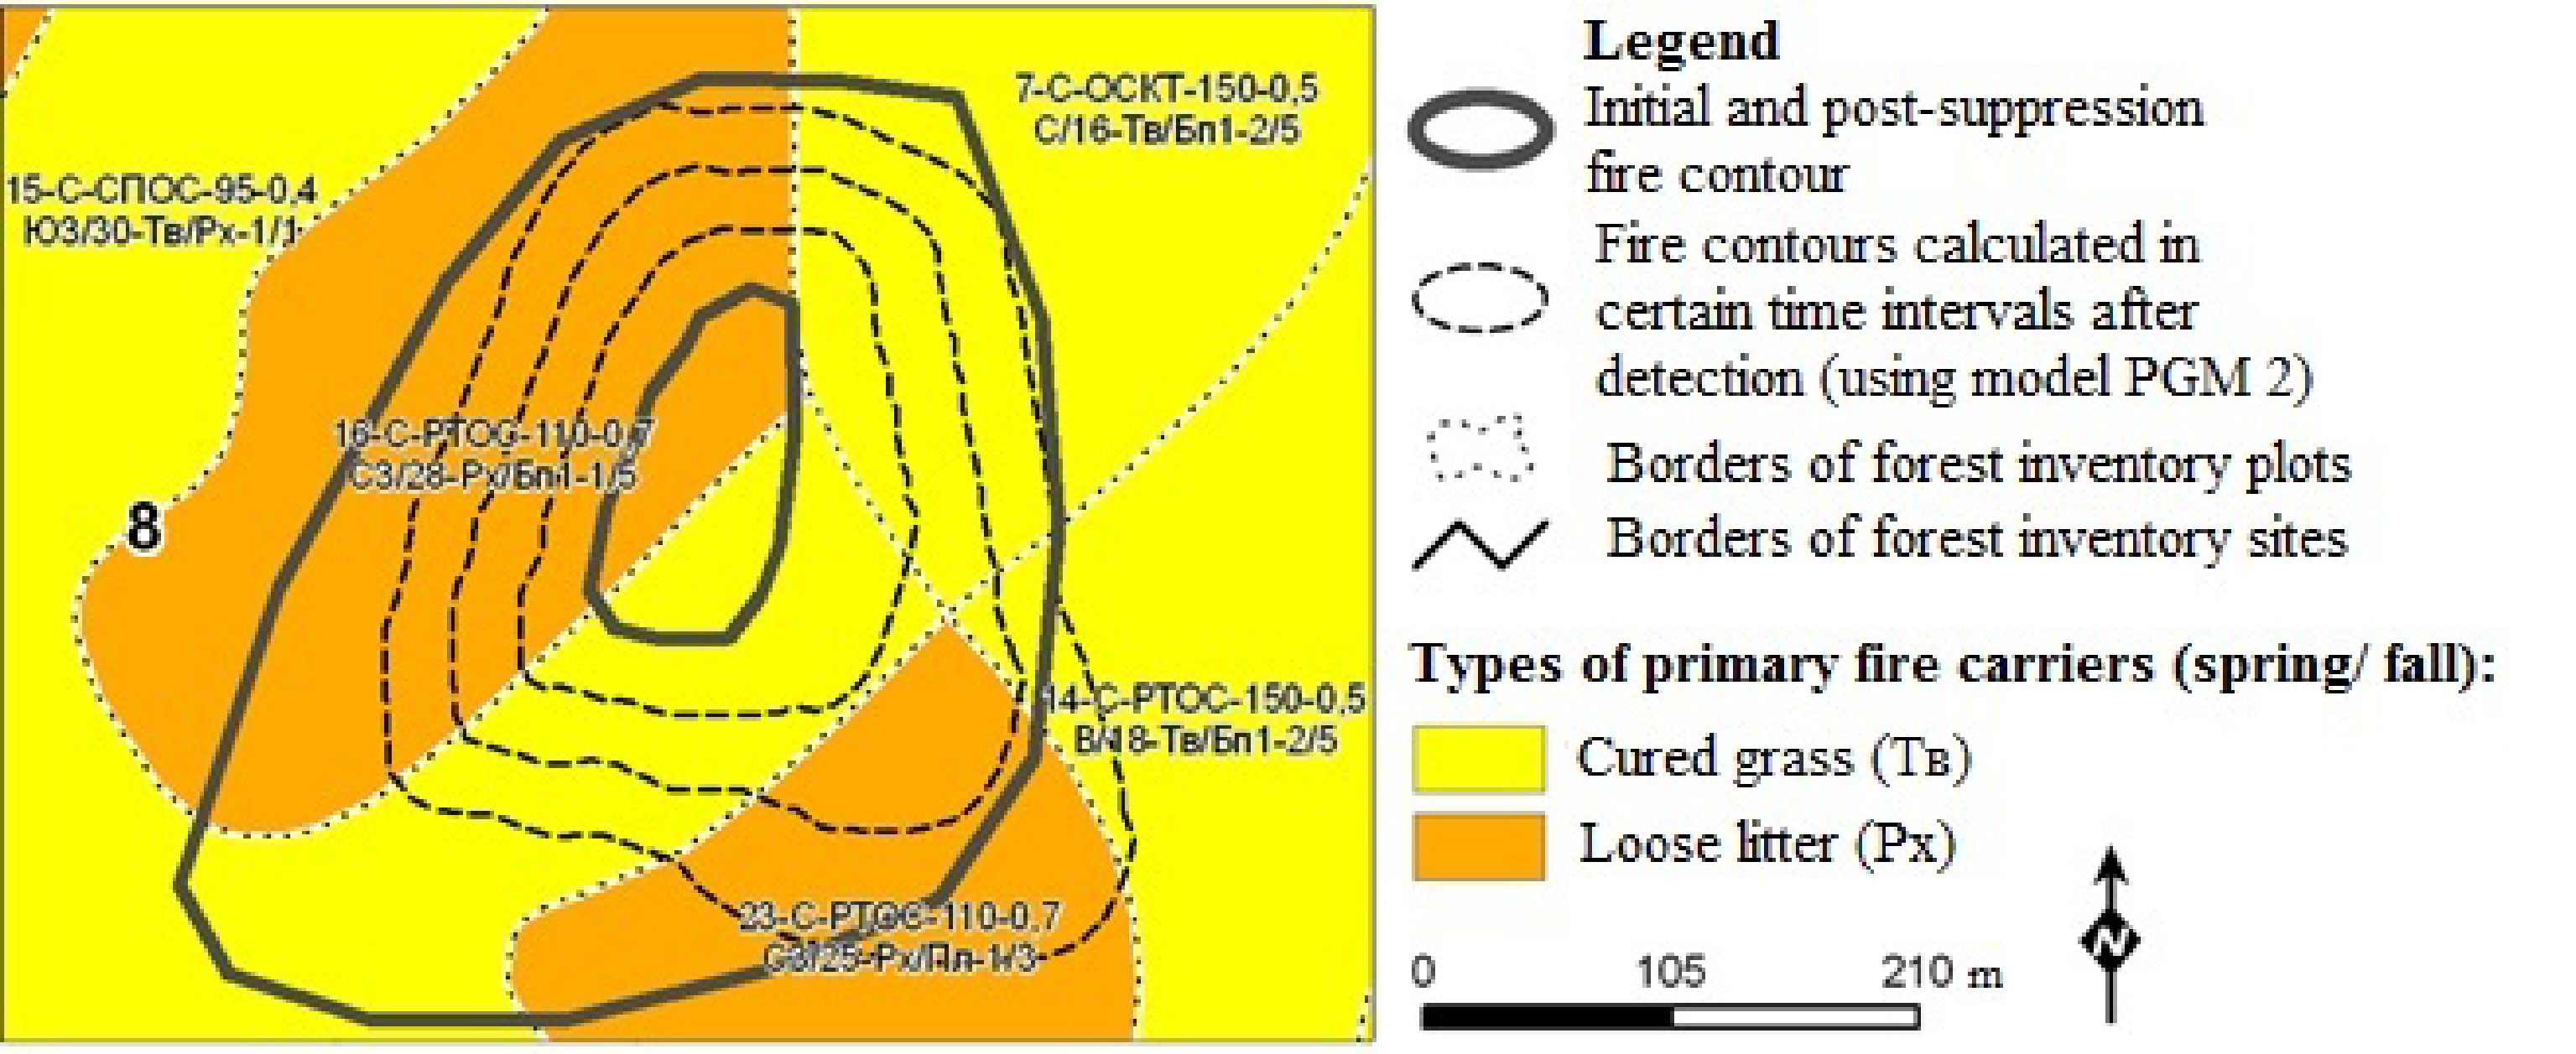
Figure 3.
Prediction of the forest fire spread in the Nature Reserve Stolby.
Table 4. Characteristics of fire No. 5 calculated using the developed software.
Time passed after the
start of prediction1 h 2 h 3 h Fire characteristics Fire area, ha 2.7 5.2 8.5 Fire perimeter, m 620 870 1120 Perimeter spread rate, m/h 226 260 240 Area spread rate, ha/h 2 2.9 3.6 Fire front average spread rate, m/h 33 35 34 Fire edge average intensity, kW/m 112 109 107 Fire intensity assessment Medium Medium Medium Assessment of manpower and means for fire suppression Optimum suppression rate, m/h 680 780 720 Suppression duration, h/area of burnt area after suppression, ha Three firefighters 7/16 – – Five firefighters 3/8 5/20 7/40 Seven firefighters 1.5/4.5 2.5/11 3.5/20 10 firefighters 1/3.5 1.5/9.9 2.5/17 15 firefighters 0.5/3 1/7 1.5/15 20 firefighters – – 1/14 Table 5 shows the prediction of tree mortality probability in stands of different tree species, depending on fire intensity and average tree diameter which helps make an optimum plan for suppressing a specific fire. This 2005 tree mortality model was developed based on the research conducted in 1976[24]. The idea of the 1976 tree mortality model was to assess tree mortality by the scorch height. The model works only after the fire, when the scorch height can be measured. The idea of the 2005 tree mortality model was developed to predict tree mortality before a fire based on the predicted fire intensity. For this, there were long-term empirical studies on the dynamics of fire intensity in relation to weather conditions for primary fire carriers[25].
Table 5. Prediction of tree mortality by stock (%) in stands after a surface fire, depending on the predicted fire intensity at the fire edge (Ife, kW/m).
Ife, kW/m Average stand diameter (or forest component), cm Pine stand mortality, % Larch stand mortality, % 8 12 16 20 24 28 32 36 8 12 16 20 24 28 32 36 Up to 20 8 2 1 0 0 0 0 0 0 0 0 0 0 0 0 0 20−60 32 9 4 2 1 0 0 0 4 2 0 0 0 0 0 0 61−100 56 22 10 6 3 1 0 0 11 4 2 0 0 0 0 0 101−250 76 38 21 12 9 5 4 3 28 10 6 2 0 0 0 0 251−550 100 73 45 33 23 16 12 9 65 28 15 7 4 1 0 0 551−1,200 100 100 84 72 60 47 36 36 95 64 32 22 15 11 6 4 1,201−2,400 100 100 100 95 87 82 75 66 100 95 58 41 28 22 17 10 Over 2,400 100 100 100 100 100 96 93 88 100 100 85 60 44 33 27 22 Birch stand mortality, % Spruce stand mortality, % Up to 20 25 6 2 0 0 0 0 30 16 8 4 2 0 0 0 20−60 45 23 10 7 5 4 3 63 44 30 24 21 18 16 14 61−100 69 40 20 15 11 10 8 85 67 55 45 40 36 34 32 101−250 84 57 32 22 20 18 14 100 83 75 67 58 53 50 47 51−550 100 72 50 33 30 27 22 100 98 93 88 82 77 73 70 551−1,200 100 85 65 50 42 38 33 100 100 100 100 98 96 94 92 Over 1,200 100 100 74 62 54 48 42 100 100 100 100 100 100 100 100 -
Medium-scale VF maps (1:1,000,000-1:500,000) are required for the purposes of monitoring vegetation fires, for making general schemes of forest fire prevention, for planning the development of new areas and allocation of various objects of the national economy (for example, oil and gas complexes), as well as for predictive environmental assessments related to vegetation fires. Two methodological options have been developed for their creation: 'autonomous' and 'conjugate'. The 'autonomous', or rather, conditionally autonomous, method consists in using satellite images to identify natural territorial complexes (NTCs), which are further combined into NTC-analogues within natural areas. To characterize the NTC-analogues, field pyrological studies are conducted at key sites using additional aerial photographs. This is followed by the usual procedure of making maps. This technique involves significant financial costs. The authors have failed to make use of it in practice.
With the 'conjugate' method, the contours of the ready-to-use selected base map (landscape map, vegetation map, forest typological map, forest fund map, or geobotanical map) are applied as the VF map contours. These contours are given a pyrological description by means of analyzing the legends of the base map and other maps for the region, as well as all available information about the VFs of the given region. If there is a lack of information, special field studies are conducted. Based on the 'conjugate' technique, VF maps were created for the northern part of the Lake Baikal basin on a scale of 1:1,000,000 (Fig. 4) and for the Angara-Yenisei Region (on a trapezoid from 0−45 to 0−48) on a scale of 1:500,000[15]. Medium-scale VF maps can be efficient in managing catastrophic vegetation fires when there is a threat of their spread to neighboring regions.
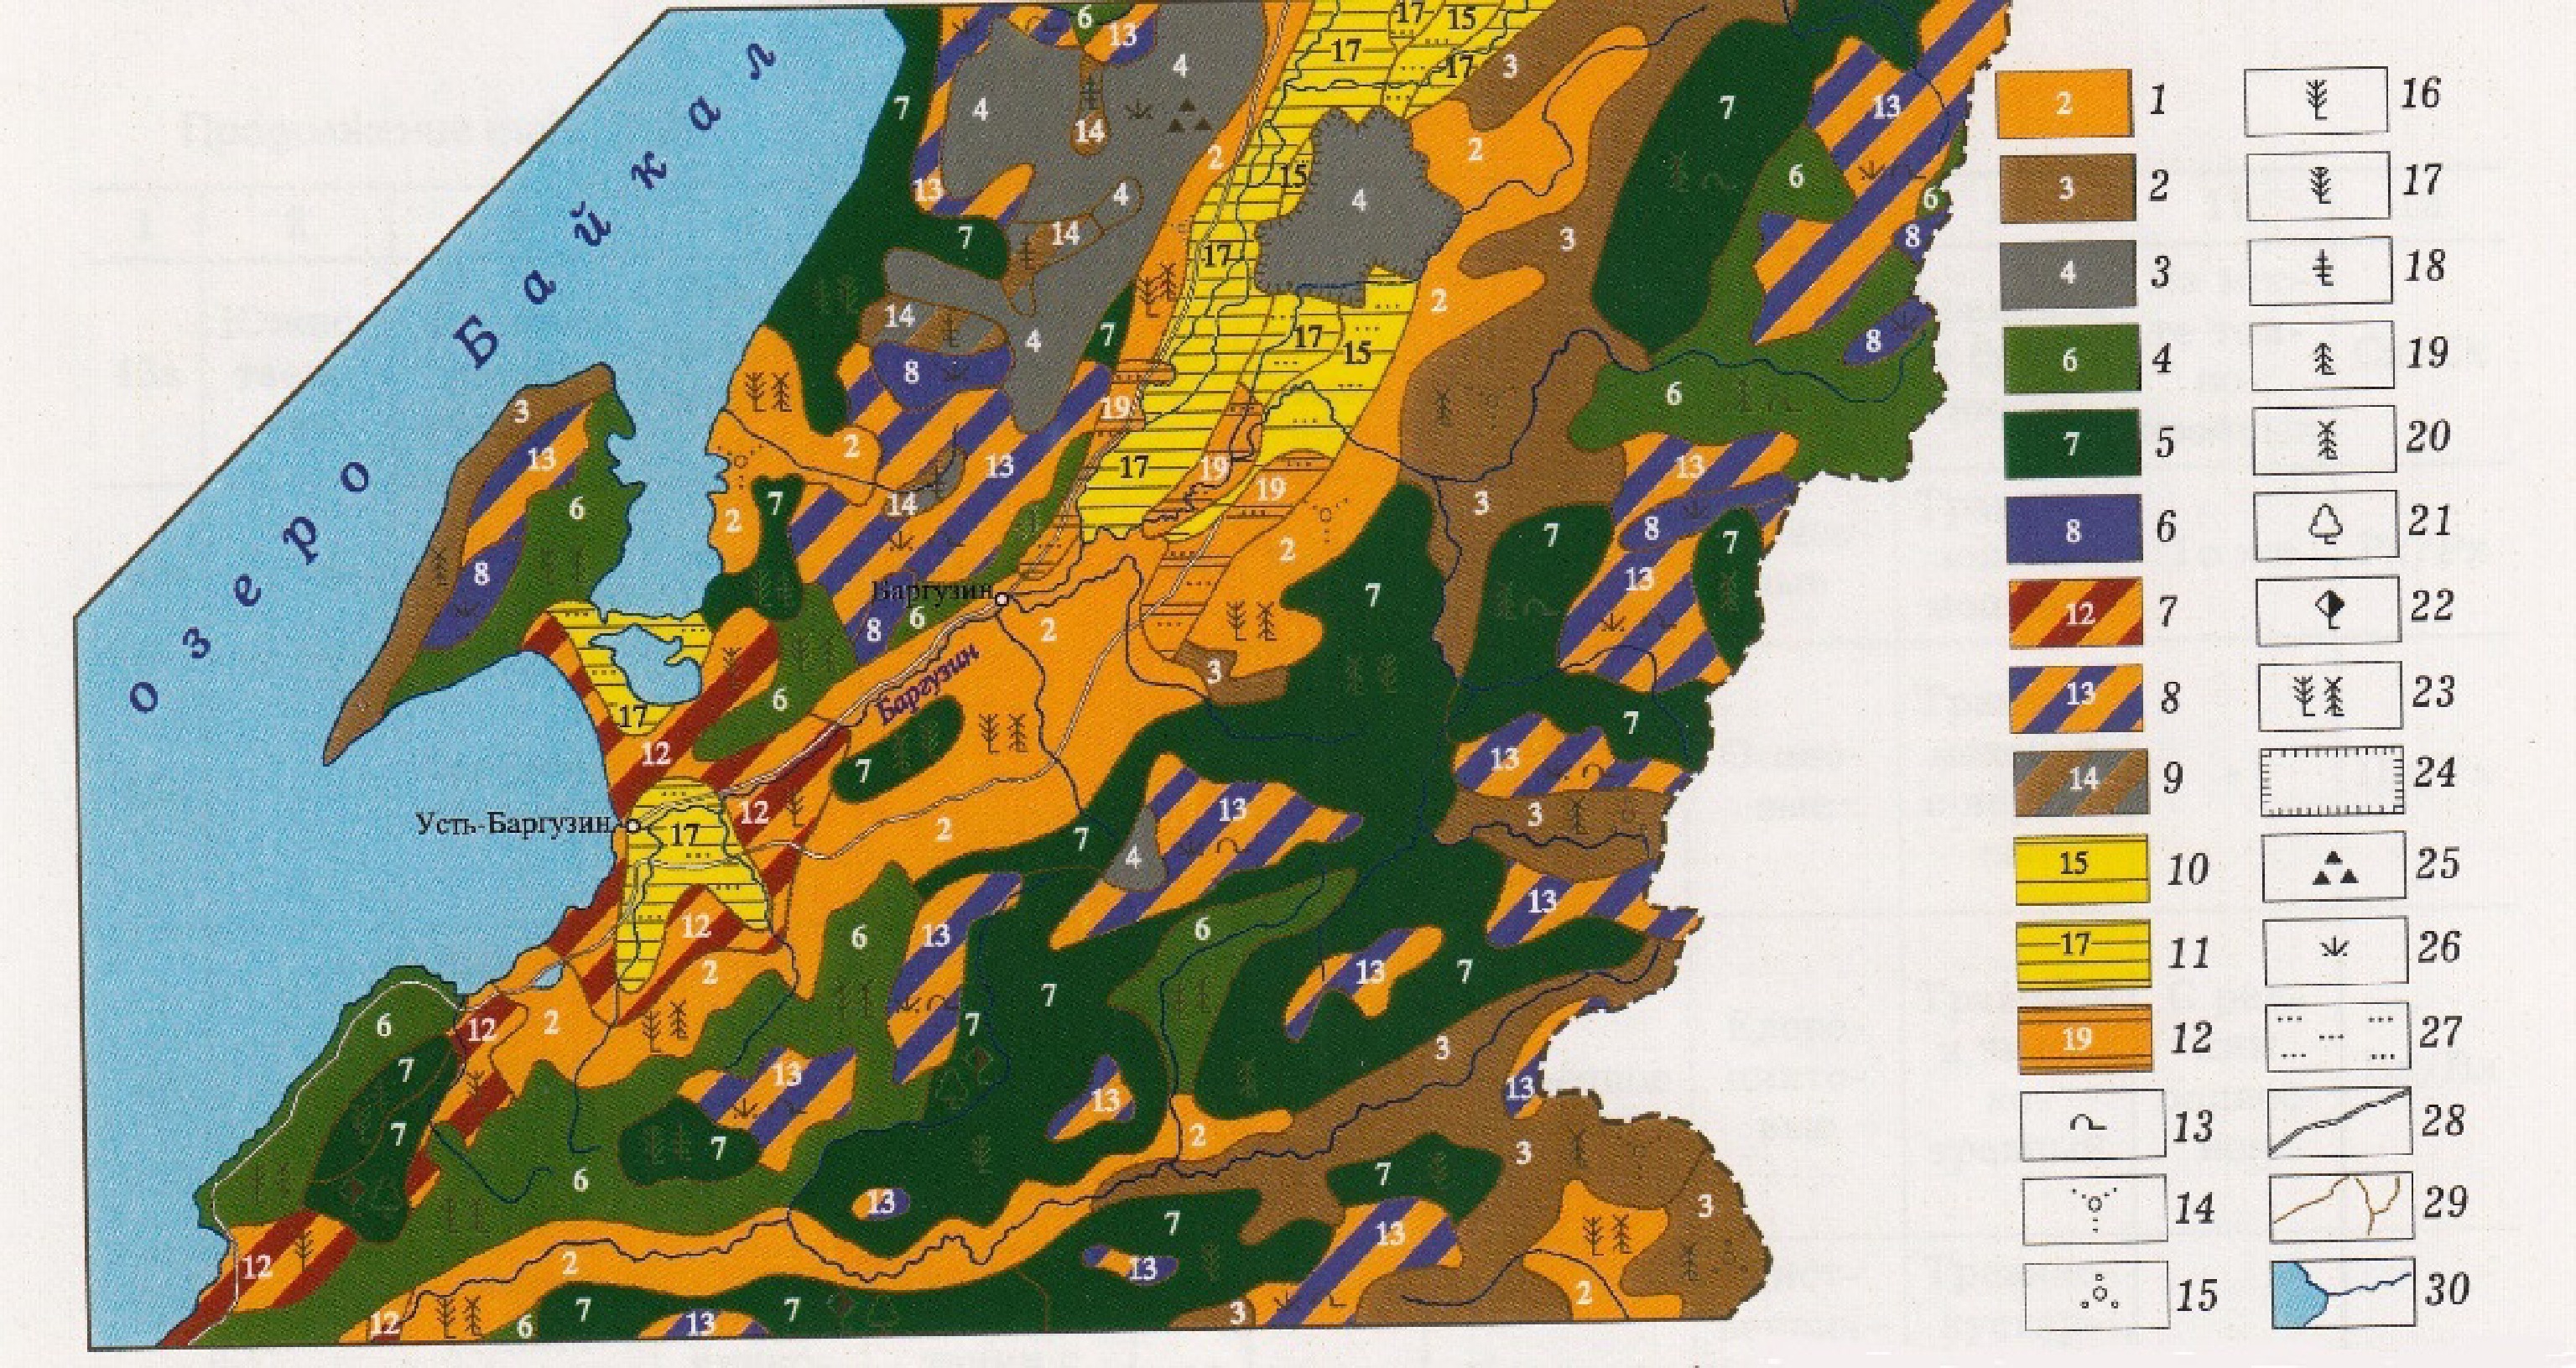
Figure 4.
VF map fragment for Lake Baikal Basin (1:1,000,000). Types of primary fire carriers (PFC types): 1 – loose litter, 2 – compact litter, 3 – non-fire-carriers, 4 – dry moss, 5 – moist moss, 6 – bog moss. Combinations of PFC types: 7 – loose litter and lichen, 8 – loose litter and bog moss, 9 – compact litter and non-fire-carrier. Seasonal dynamics of PFC types (spring/summer): 10 – cured grass/loose litter, 11 – cured grass/non-fire-carrier, 12 – loose litter/compact litter. Shrubs: 13 – Pinus pumila, 14 – Rhododendron, 15 – Betula nana. Canopy cover: 16 – pine, 17 – Siberian pine, 18 – larch, 19 – spruce, 20 – fir, 21 – birch, 22 – aspen, 23 – mixed canopy cover. Non-forest areas: 24 – crop lands, 25 – goltsy, 26 – tundra, 27 – steppes. Other legend signs: 28 – roads, 29 – plot borders, 30 – rivers, lakes.
-
The difficulty of predicting the occurrence, spread, and effects of vegetation fires without special cartographic materials is undeniable. According to most forest fire scientists, the process of VF mapping is also difficult, since it is based on the VF classification, the development methods of which have their own features in different countries. The exchange of information helps to improve the methods of VF mapping and contributes to their implementation in forestry practice.
The present method presents a VF classification, developed on the basis of long-term pyrological studies in different regions of Russia and serving as the basis for methods of VF mapping (including forest VFs). Large-scale mapping methods are used to make maps for predicting the occurrence, spread, and effects of vegetation fires. Examples of maps and the results of their retrospective verification are given. Based on the methods of medium-scale mapping, examples of maps have been made for the purpose of fire monitoring and fire hazard assessment in large areas.
The aforementioned proves that we have developed and successfully prototyped a decision support system that can reduce the severity of the wildfire problem. Clearly, under the relevant federal support, it is possible to create an information database for the entire territory of Russia to make the proposed large-scale VF maps which are urgently needed for predicting the occurrence and behavior of emerging fires. However, first of all, such information databases are needed for PAs, wildland-urban interfaces that may be affected by forest and steppe fires, as well as around important national economic facilities.
The implementation of the developments presented in the article into the practice of Russian forestry is still difficult, since the results were obtained at an academic institute that does not receive funds for pilot testing and implementation of applied developments, since only fundamental developments are funded. Applied developments are carried out in the branch institutes of the Federal Forestry Service. They often emulate the developments carried out at the academic institute, but not always at a high scientific level. The solution lies in the future cooperation of these organizations through the interaction of the heads of forest research institutes with the support of federal authorities.
The article was prepared within the framework of two basic projects of the Sukachev Institute SB RAS 'The role of natural and anthropogenic factors in the system of sustainable forest manage-ment in Siberia' (No. FWES-2024-0007, R&D Registration No. 124012900559-4) and 'Dynamics of carbon cycle components in Siberian ecosystems under climate changes' (FWES-2024-0023, R&D Registration No. 124012900558-7).
-
The authors confirm their contributions to the paper as follows: study conception and design: Volokitina A, Sofronova T, Korets M; data collection: Volokitina A, Korets M; analysis and interpretation of results: Volokitina A, Sofronova T, Korets M; draft manuscript preparation: Volokitina A, Sofronova T. All authors reviewed the results and approved the final version of the manuscript.
-
The datasets analyzed during the current study are available from the corresponding author upon reasonable request.
-
The authors declare that they have no conflict of interest.
- Supplementary Table S1 The types of primary fire carriers (PFC).
- Supplementary Table S2 Pyrological description (fragment).
- Supplementary Table S3 Vegetation fuel (VF) classification.
- Copyright: © 2025 by the author(s). Published by Maximum Academic Press on behalf of Nanjing Tech University. This article is an open access article distributed under Creative Commons Attribution License (CC BY 4.0), visit https://creativecommons.org/licenses/by/4.0/.
-
About this article
Cite this article
Volokitina A, Sofronova T, Korets M. 2025. Revisiting methods of vegetation fuel mapping. Emergency Management Science and Technology 5: e017 doi: 10.48130/emst-0025-0015 

Revisiting methods of vegetation fuel mapping
- Received: 23 January 2025
- Revised: 24 July 2025
- Accepted: 03 August 2025
- Published online: 16 September 2025
Abstract: This paper presents methods of multi-scale mapping of vegetation fuels (VFs). It has been developed based on long-term fundamental pyrological (fire/fuel-related) studies in different regions of Russia, which have helped create a detailed VF classification and develop methods for mapping it in forest fire protection. There are examples of assessing the current fire hazard under different classes of dryness according to weather conditions using large-scale VF maps. There is also an example of predicting the spread of a forest fire in a nature reserve using a specially developed and registered software, also providing probable fire characteristics, including fire intensity at the fire edge, which helps to predict the immediate fire effects in the form of mortality probability in birch, pine, larch, and spruce stands by their average diameter.
-
Key words:
- Vegetation fuels /
- Vegetation fuel maps /
- Fire behavior prediction /
- Fire effects /
- Fire occurrence /
- Fire spread