


-
Polyphenol oxidase (PPO) is a copper-containing redox metal enzyme, characterized by two copper ions at its active site[1,2]. This enzyme catalyzes the oxidation of phenolic compounds, resulting in the formation of quinones, which then undergo polymerization to produce brown pigments[3]. The lack of effective enzyme inactivation methods in food storage and processing contributes to the browning of fruits, vegetables, fungi, etc[4,5], thereby significantly reducing their marketability and consumer appeal[6].
Thermal pasteurization, commonly employed to ensure microbial safety and prolong the shelf life of fruit and vegetable juices, and purees frequently leads to considerable degradation in color, flavor, texture, and the loss of thermosensitive functional components[7]. As consumer demand for minimally processed juices continues to grow, the commercial potential of non-thermal technologies has increasingly attracted attention in recent years[8−10]. High-pressure processing (HPP) has become one of the most widely used non-thermal processes in the fruit and vegetable sector, and is receiving increasing attention within both academia and industry[11]. The effects of HPP on PPO activity varies significantly across different cultivars. In bok choy juice, HPP at 300 MPa for 20 min retained as high as 85.1 ± 2.6% of PPO activity, indicating that enzymes remained highly active[12]. By contrast, in apple juice, after 350 MPa treatment for 10 min, the relative enzyme activity decreased to 60.17%[13]. While in pawpaw, 600 MPa for less than 2 min decreased activity to around 14%, indicating strong inhibition[14]. In red raspberries, PPO activity increased by 15% and 8% after treatment at 400 and 800 MPa for 5 min, respectively, suggesting a certain activation effect[15]. All these variable results confuse the researchers and hinder the potential application of high-pressure processing in the food industry.
HPP induces substantial changes in the energy landscape of biomolecules, altering the Boltzmann distribution of conformational states and thereby affecting enzymatic activity. However, current experimental techniques face challenges in quantitatively assessing these molecular distributions under high pressure. Existing commercially available HPP devices are limited in the pressures they can withstand (typically ≥ 300 MPa) and have been reported to be unable to completely inactivate PPO in many fruit and vegetable products[12]. Consequently, research into enzyme activity and conformational changes under high-pressure conditions is constrained. Molecular dynamics (MD) simulations provide a powerful tool to investigate enzyme behavior under high pressure at atomic resolution, and to elucidate the associated structural dynamics and functional mechanisms. For example, Zhang et al.[16] demonstrated that high pressure changed pectin methylesterase (PME) activity by altering the PME active center and substrate channel conformation, while HPP compressed the protein volume, increasing the density and the contact area between solvent and protein. Chen et al.[17] studied the conformational changes of lipase under high pressure and found that the enzyme activity was determined by the opening and closing state of the lid above the active site, and the enzyme's tertiary structure changed significantly at pressures higher than 500 MPa. Zhou et al.[18] found the distance between Cu and His residues decreased, leading to the exposure of the active pocket and an increase in catalytic activity under 200 MPa, but the distance between Cu and His residues increased, causing the active pocket to be buried within the protein and resulted in a decrease in catalytic activity at 600 MPa. Although MD simulations have greatly enhanced the understanding of enzyme behavior under high-pressure conditions, accurately capturing the complex energy landscape and dynamics of enzymes remains challenging. Both experimental and computational limitations continue to hinder a comprehensive understanding of HPP effects on enzyme activity and conformation.
Markov State Models (MSMs) have become instrumental in studying enzyme conformational dynamics, offering a framework to capture the stochastic transitions between conformational states and to identify metastable states and their kinetics[19]. This approach offers insights into how conformational ensembles are linked to enzyme function. Mushroom PPO is a copper-containing enzyme with a molecular weight of approximately 43–70 kDa, comprising two heavy and two light subunits with a stable structure.[20−22]. Former studies have demonstrated that PPO exhibits varying enzymatic activities when subjected to high-pressure treatments ranging from 0 to 600 MPa, making it an ideal model for investigating the relationship between enzyme conformation and activity under commonly used pressure conditions. In this study, we employ MD simulations integrated with MSM to analyze the conformational distributions of mushroom PPO under different pressure conditions. Complementary experimental techniques, including the determination of protein-surface hydrophobicity, fluorescence spectroscopy, and circular dichroism (CD) spectra are utilized to monitor conformational changes. This integrative approach aims to elucidate the intrinsic relationship between enzyme conformation and activity under high-pressure conditions, thereby advancing understanding of enzyme behavior in such environments.
-
Mushrooms (Agaricus bisporus) were purchased from a local market in Taian, China, and stored at 4 °C. Citric acid, sodium chloride, ammonium sulfate, and disodium hydrogen phosphate dodecahydrate were purchased from Tianjin Kaitong Chemical Reagent Co., Ltd (Tianjin, China). Catechol was obtained from Macklin (Shanghai, China). All other chemicals and reagents used in the study were of analytical grade, and their purity was more than 99%.
Polyphenol oxidase purification
-
PPO from mushrooms was purified using ion exchange chromatography and size exclusion chromatography according to the method with some modifications[23]. Mushrooms (200 g) were homogenized for 1 min (maximum speed) in a juicer extractor (AUX Group Co., Ltd, Zhejiang, China) with 200 mL cold 50 mM sodium phosphate buffer (pH 6.8, 4 °C). The homogenate was filtered through six layers of cheesecloth and centrifuged at 9,000 × g for 20 min at 4 °C, and the resulting supernatant was crude soluble polyphenol oxidase (sPPO). Solid ammonium sulfate was gradually added to the crude sPPO extract to reach 35% saturation, followed by 1 h of standing, and subsequent centrifugation at 9,000 × g for 15 min at 4 °C, after which additional ammonium sulfate was introduced to the supernatant to achieve 75% saturation. After allowing the mixture to stand for 1 h, it was centrifuged again at 9,000 × g for 15 min at 4 °C[24]. The precipitate was re-suspended in 50 mM sodium phosphate buffer (pH 6.8) and dialyzed (molecular weight cutoff of 8 k–10 kDa) against phosphate buffer at 4 °C, with four to five buffer changes. The dialyzed sPPO fraction was dissolved in as little as 50 mM sodium phosphate buffer (pH 6.8) at 4 °C for further purification.
The sPPO was purified according to the method of Liu et al.[25]. The DEAE Sepharose Fast Flow material (100 mL) was washed with distilled water and sodium phosphate buffer (50 mM, pH 6.8), then packed into a column (2.6 × 20 cm) using a glass rod to minimize air bubbles. After equilibrating with the same buffer, the dialyzed sPPO extract was filtered through a 0.45 μm syringe filter and loaded onto the column. Elution was carried out using a NaCl gradient (0–0.5 M) in phosphate buffer (50 mM, pH 6.8) at 1 mL/min, with the peak showing the highest enzymatic activity collected and monitored at 280 nm. The active fractions were pooled and concentrated by ultrafiltration (molecular weight cutoff of 30 kDa) before being applied to a Sephadex G-75 column (1.6 × 70 cm), which was equilibrated with phosphate buffer (50 mM, pH 6.8) at a flow rate of 0.5 mL/min. After loading the concentrated sample, the fractions with the highest enzymatic activity were collected and concentrated for subsequent use.
Sodium dodecyl sulfate polyacrylamide gel electrophoresis (SDS-PAGE) analysis of the purified PPO solution was conducted according to the method described by Xu et al.[26]. Firstly, 16 μL of sPPO solution and 4 μL of 5× loading buffer were boiled for 5 min. Thereafter, each sample well was injected with a volume of 20 μL, and electrophoresis was conducted at 150 V. After electrophoresis, stacking gel was dyed with Coomassie Brilliant Blue R-250 and then decolorized until the bands were clear before being photographed.
High-pressure processing
-
The purified PPO solution was treated using high pressure equipment (Homogenising Systems Ltd, UK). The samples were vacuum-sealed in polyethylene bags and placed in a pressurization device, with water serving as the pressure-transmitting medium, and subjected to pressures of 0.1, 100, 300, and 500 MPa for 30 min at 25 °C[7,10,17,18].
Polyphenol oxidase activity determination
-
PPO activity after different HPP was determined according to the method[27]. The mixture consisted of 2.5 mL substrate solution (0.2 M catechol in 50 mM sodium phosphate buffer at pH 6.8) and 0.25 mL of PPO solution. The absorbance change was measured at 420 nm in triplicate by a multi-scan spectrum (SpectraMax M5, Molecular Devices Shanghai, China). One unit (U) of PPO activity was defined as the amount of enzyme causing an increase of 0.001 in absorbance at 420 nm per min under the assay conditions described above. The residual enzyme activity (RA) was calculated using the following formula:
$ {R}_{A}=\dfrac{{A}_{t}}{{A}_{0}}\times 100{\text{%}} $ (1) where, At was the enzyme activity of the treated sample, and A0 was the initial enzyme activity of the untreated sample.
Determination of protein surface hydrophobicity
-
1-Anilino-8-naphthalene sulfonate (ANS), a widely used fluorescent probe for assessing protein surface hydrophobicity, was dissolved in a small amount of 95% ethanol and stored in the dark for later use. The PPO solution, after high-pressure treatment, was diluted to 10 μM and mixed with a 50 μM solution of the ANS fluorescent probe, which was used to evaluate protein hydrophobic properties according to the method with some modifications[28]. The fluorescence intensity is correlated with the interaction strength between the hydrophobic regions of the protein and the probe, providing both qualitative and quantitative insights into the binding between the ANS and the protein. The resulting ANS-protein solution (ANS-PPO) was transferred to a fluorescence spectrophotometer, with an excitation wavelength set at 350 nm and the emission spectrum scanned over the range of 400 to 550 nm for fluorescence detection.
Circular dichroism assay
-
CD spectra of PPO after different HPP were recorded at 25 °C using a CD spectrophotometer (J-1500 JASCO, Tokyo, Japan)[29]. A quartz cuvette with a 1 mm path length was employed, and the CD spectra were recorded in the far UV range (260–190 nm) at a rate of 100 nm/min and a bandwidth of 1 nm. All spectra were subtracted with a baseline, a CD spectrum of a phosphate buffer solution (50 mM, pH 6.8). Subsequently, the Cluster-based Discriminative Neural Networks (CDNN) CD analysis software was employed to calculate the percentage of enzymes' secondary structures.
Fluorescence spectrum analysis
Synchronous fluorescence spectra measurement
-
The synchronous fluorescence spectra (SFS) of processed PPO were measured with an F-7000 spectrofluorometer (Hitachi Ltd, Tokyo, Japan)[30]. The excitation wavelength was fixed, the emission wavelength scanning range was set to 290–335 nm with a wavelength interval (Δλ) of 15 nm, and the scanning emission wavelength range was 315–370 nm when Δλ was set to 60 nm. The excitation and emission slits were set to 5 nm to ensure optimal resolution.
3D fluorescence spectra measurement
-
The 3D fluorescence spectra of processed PPO were obtained with excitation wavelength from 230 to 350 nm, and emission wavelength from 210 to 450 nm[29]. The excitation and emission slits were both 5 nm, scan number was 50, and the excitation wavelengths were 10 nm intervals. The obtained spectra were corrected by subtracting the baseline spectrum of a phosphate buffer (50 mM, pH 6.8).
Molecular dynamics simulations
Metal coordination bond modeling
-
The python based metal center parameter builder of MCPB.py was used to build force fields for the simulation of metal complexes employing the bonded model approach[31]. The PDB and mol2 files for the Cu ions were prepared, and the PDB file including all the standard residues was processed using the webserver H++ (
https://biophysics.cs.vt.edu/H++/ , accessed on 19 May 2025) to add hydrogen atoms and assign the protonation state of amino acids with the default setting parameters. The python builder was then used to generate the input files for Gaussian calculation, perform the geometry optimization, force constant calculation, and the Merz-Kollman RESP charge calculation, with the keywords of opt, freq separately and B3LYP/6-31G (d) settings. After the final model was performed, cpptraj and ParmEd modules in Ambertools were conveyed to check the metal site parameters.Molecular dynamics simulation
-
The MD simulations of the PPO structure at different pressures were conveyed to analyze the structure change and establish the MSM. The protein structure and topological file of PPO with the built-in metal coordination bond parameters were transformed using the Amber tools, and the Gromacs software[32]. Amber 99 force field[33] was used to carry out the MD simulation under the pressures of 0.1, 100, 300, and 500 MPa, and the simulation time was set to 100 ns at 1 fs step. The average structure of the last 1 ns under 100, 300, and 500 MPa was then extracted and used as the representative structure to analyze the effects of HPP, and the same simulation protocol was further applied to obtain trajectories after 100, 300, and 500 MPa. The protein structure was solvated in a cube box with an SPC water model, then energy minimization, NVT, and NPT (500 ps) simulations were performed to equilibrate the system[34]. The V-rescale and Berendsen methods were used for temperature coupling and pressure coupling during the producing stage. Then the root-mean-square deviation (RMSD), root-mean-square fluctuation (RMSF), solvent accessible surface area (SASA), and residue-residue distance matrix were calculated using the Gromacs modules.
Markov State Modeling analysis
-
The program PyEMMA[35] was employed to build the MSM of the PPO conformation during different pressure processing in the following steps: (1) All the residues within the 20 Å around Cu ions were selected (even if only one atom of the residue falls within this range) to cover the catalytic site, then the frame in the molecular dynamics trajectory was transformed into a vector composed of the backbone torsion, all atom positions, Cα atom positions, and Cα atom distance, respectively. VAMP2 score with the lag time of 0.5, 1.0, and 2.0 ns were then calculated to specify the preferable collective variable with a higher value (backbone torsion was selected). (2) The selected conformation space was reduced using time-lagged independent components analysis (tICA), and the conformations were clustered into 40 states (microstates) using the Mini-Batch K-Medoids clustering algorithm (the conformations in the same cluster are geometrically similar). (3) VAMP2 score of different implied time scales at variable lag times was calculated, and the proper implied time scales were determined where VAMP2 score converged and thus selected to a Markov model. (4) A transition matrix was constructed between these microstates at a proper lag time, and the Chapman-Kolmogorov test was also conveyed to test the MSM.
Statistical analysis
-
All experiments were repeated three times, and the data was expressed as mean ± standard deviation. The data was processed and analyzed using the Origin 2021 software (free trial), and statistical analysis was carried out by one-way analysis of variance (ANOVA). Differences among means were considered significant at a significance level of p < 0.05.
-
Based on previous studies, the crude solution of PPO is purified by a combination of ammonium sulfate-graded precipitation and chromatography. Ammonium sulfate precipitation mainly purifies PPO by salting out proteins, as all proteins possess hydrophilic and hydrophobic groups on their surfaces, and the addition of excess salt to an aqueous extract increases the surface tension, ultimately enhancing the hydrophobic interactions of the proteins and causing them to precipitate[36]. In a DEAE anion-exchange column, the dialyzed PPO solution was eluted with a NaCl gradient (0.1–0.5 M) to separate proteins with different charges, and the target PPO was collected from the corresponding elution fractions.[37]. During the elution of sPPO from the DEAE column, eight protein peaks appeared (Fig. 1a), the highest PPO activity was found in the second peak (maximum protein absorbance peak), corresponding to fractions 50–100 (eluted with 0.1 M NaCl). The number of eluted impure proteins increased with NaCl buffer concentration until 0.5 M, when most of the impure proteins adsorbed on the packing material were eluted. Similar gradient elution results were shown for apple[23], chestnut kerne[38], and water yam isolations[39]. The fraction with the highest enzyme activity was collected and further up-sampled to a Sephadex G-75 size exclusion column for further purification, where different proteins were separated according to their molecular weights[40]. Notably, the elution profile shown in Fig. 1b revealed three peaks, with the first peak containing the highest protein content and good enzyme activity being pooled, while the remaining two peaks, with lower protein content, exhibited no enzyme activity.
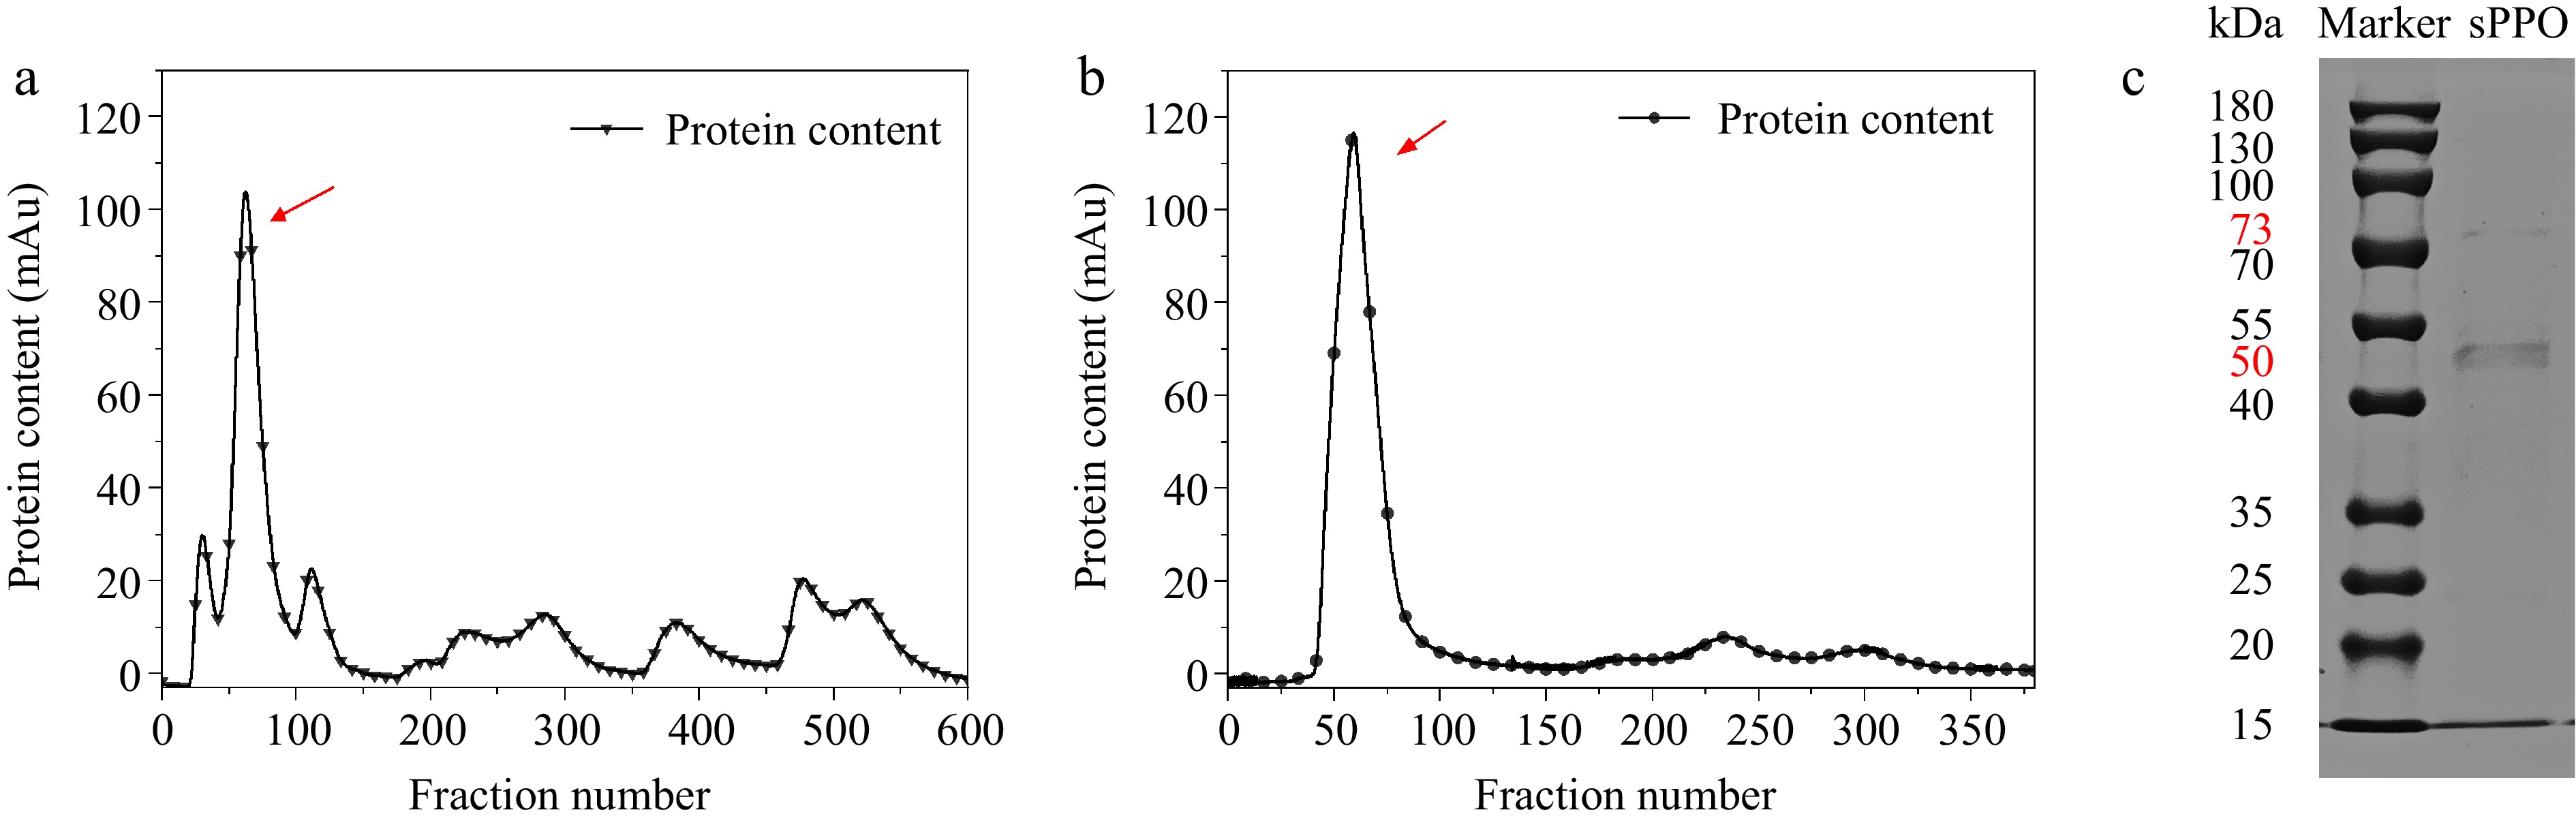
Figure 1.
Purification results of Agaricus bisporus sPPO. (a) DEAE ion-exchange chromatographic elution profile. (b) Sephadex G-75 size exclusion chromatographic elution profile. (c) Denaturing SDS-PAGE of purified sPPO protein stained with Coomassie Brilliant Blue R-250.
The collected PPO solution was concentrated and analyzed by SDS-PAGE, which showed distinct protein bands (Fig. 1c), with two visible bands shown, one at 73 kDa with weak protein content, and another prominent band corresponding to a molecular weight of 50 kDa, which is the same molecular weight as the highly active H-subunit isolated from Agaricus bisporus, and basically in line with the molecular weight of the commercially pure PPO (51 kDa) in related studies[30,41]. Reports on the molecular weights of plant PPOs are very diverse and variable, and the reason for analyzing the presence of two protein bands may be the partial protein hydrolysis of the enzyme during isolation for subunits dissociated from the same protein, or it may be that a certain isoform of sPPO is a homodimerization enzyme for some of the same subunits[42,43]. In addition, the number of bands with a molecular weight of 73 kDa was extremely weak in this study, and was supposed to not affect the subsequent results.
Polyphenol oxidase activity analysis under different high-pressure processing
-
As shown in Table 1, the effects of HPP on PPO activity were investigated. PPO activity exhibited a significant reduction following high-pressure treatment. At 100 MPa, PPO retained only 16.55 ± 0.61% of its initial activity, indicating substantial inactivation; while processing of 300 MPa reduced RA to 13.28 ± 1.30%, and 500 MPa processing reduced RA to 12.76 ± 0.96%. These findings suggest that PPO is highly susceptible to high pressure, with the most pronounced inactivation occurring at lower pressure levels. ANOVA was performed to determine the statistical significance of these variations, and the results confirmed that RA at 100, 300, and 500 MPa was significantly lower than that of the control group (p < 0.05).
Table 1. Residual enzyme activity under different high pressure processing.
Pressure (MPa) Processing time (min) RA (%) 0.1 30 100.00 ± 5.80a 100 30 16.55 ± 0.61b 300 30 13.28 ± 1.30b 500 30 12.76 ± 0.96b Different lowercase letters in the same column indicate significant differences at the 0.05 level. Compared with the enzymatic activity of commercial PPO previously studied under HPP, the purified PPO exhibited significantly higher pressure sensitivity[18,30]. This difference can be largely attributed to the nature of the enzyme preparations. Commercial mushroom PPO used in previous studies do not represent a single soluble PPO system; they usually contain a mixture of soluble and membrane-associated PPO isoforms, polymeric enzyme complexes, and other matrix components and stabilizing additives, which enhance structural stability under high-pressure conditions. By contrast, the purified sPPO used in this study mainly existed in a monomeric form after purification and was dissolved in a simple buffer system without other formulation stabilizers, making it much more susceptible to pressure-induced structural changes and inactivation.
Protein surface hydrophobicity analysis
-
The ANS probe interacts with the protein through hydrophobic interactions, binding to exposed hydrophobic regions. Changes in fluorescence intensity indicate the hydrophobic microenvironment and conformational changes of the protein[44]. As shown in Fig. 2, the binding between ANS and the protein was significantly influenced by pressure, with increasing pressure from 0.1 to 500 MPa, the fluorescence intensity gradually increased, and a noticeable blue shift of the emission maximum was observed. This suggested that high pressure promotes the exposure of hydrophobic regions, allowing more ANS molecules to bind in nonpolar pockets on the protein surface. Conversely, when hydrophobic regions were shielded, the binding of ANS was reduced, resulting in lower fluorescence intensity. Furthermore, the blue shift of the emission maximum indicated that the ANS probe is located in a more hydrophobic environment. Under high pressure, the exposure of hydrophobic regions allows more ANS probe to bind to these non-polar sites, and the resulting decrease in local polarity simultaneously leads to a blue shift of the emission wavelength and an enhancement of fluorescence intensity.
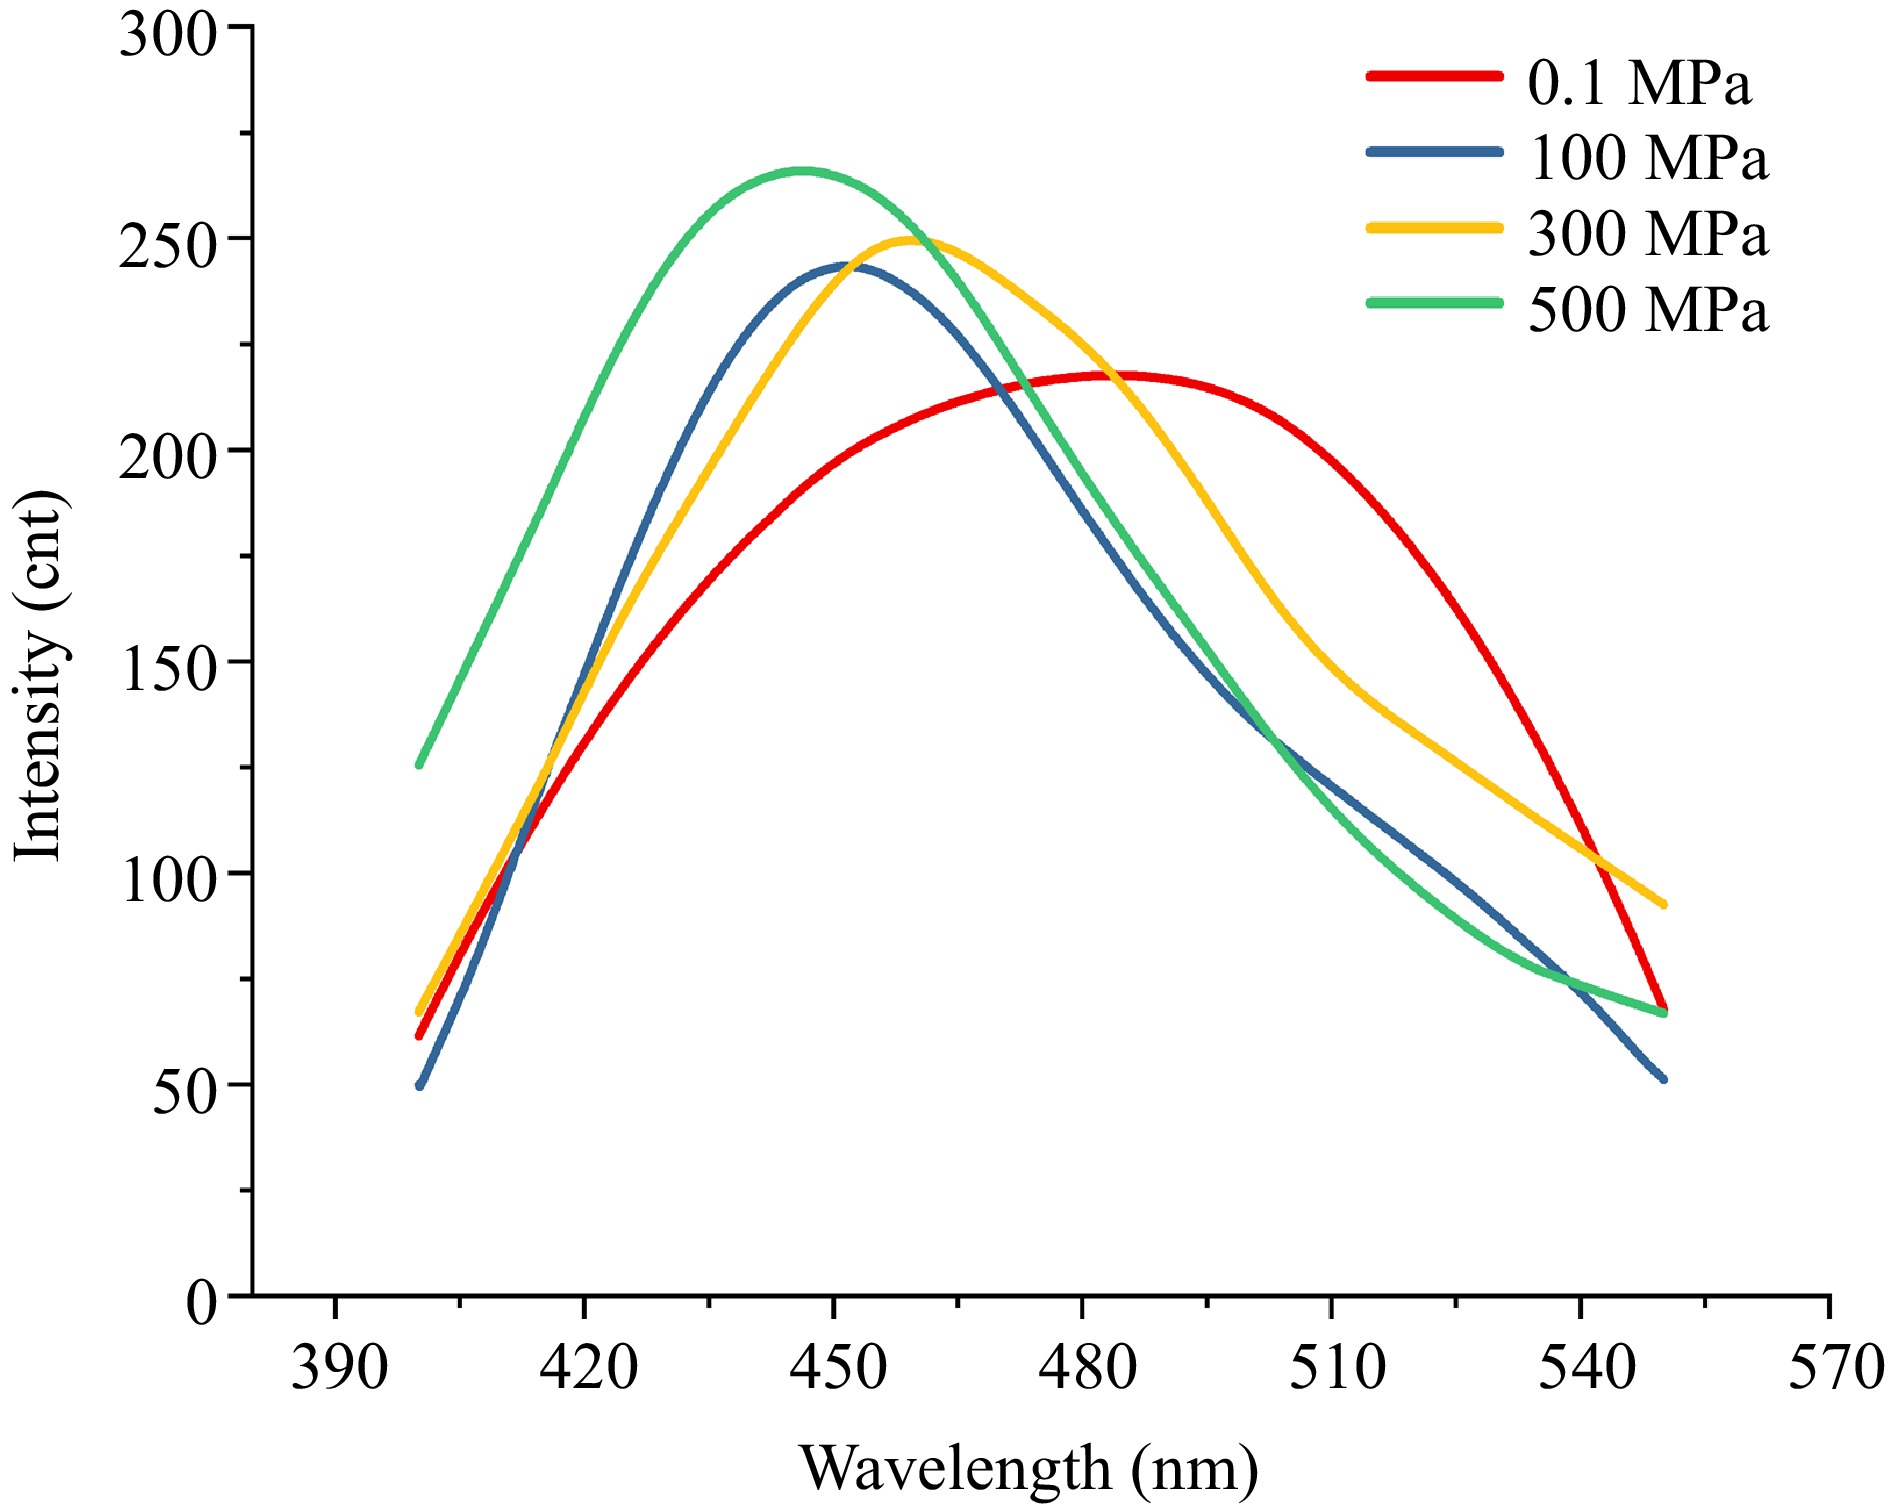
Figure 2.
ANS fluorescence spectra under different pressures. ANS–protein fluorescence spectra measured at 0.1, 100, 300, and 500 MPa.
Secondary structure change analysis
-
The CD spectrum is an excellent tool for rapidly determining protein secondary structure, folding properties, and binding properties[45]. The signals of the major chromophores in proteins are located in the UV region (190–240 nm) of the CD spectrogram, which can be used to characterize the conformational structure of PPO at different high pressures[46]. As shown in Fig. 3a, the CD spectrum of PPO showed a positive peak at 190–200 nm and a negative peak at 220 nm, which was characteristic of the α-helix conformation[17]. In the band below 200 nm, a change in signal was also observed, reflecting changes in β-folding and random coil. As the pressure increased, the negative ellipticity at 220 nm became more pronounced, indicating a gradual loss of the overall ordered secondary structure of PPO. In conjunction with Fig. 3b, the relative content of α-helix decreased with the increase of pressure, which indicated that pressure has a significant effect on the secondary structure of PPO, leading to the reduction or transformation of the α-helix.
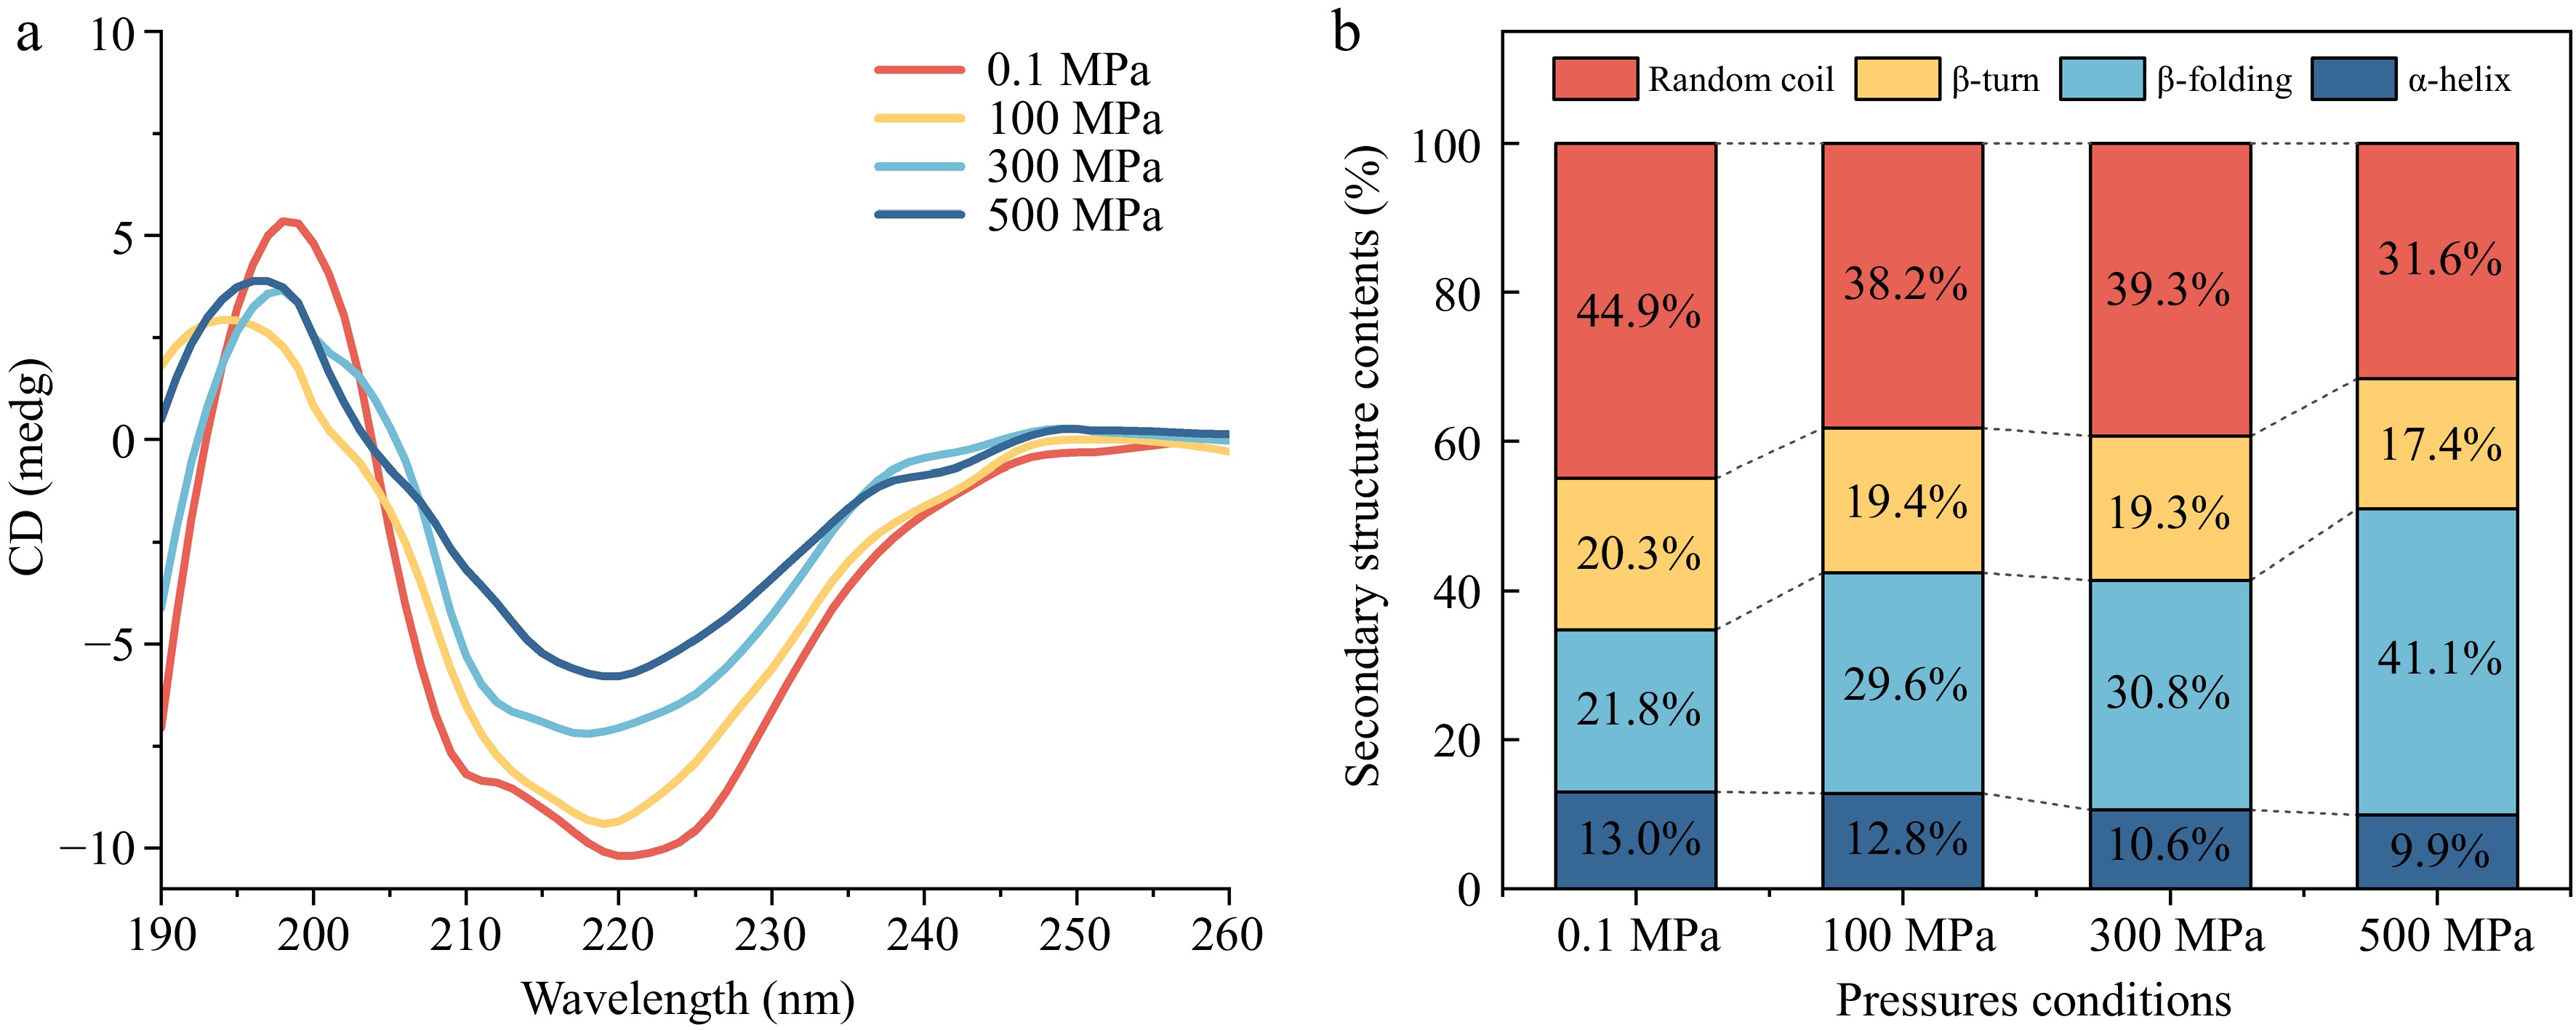
Figure 3.
Circular dichroism spectra of Agaricus bisporus sPPO. (a) CD spectra change under different pressure conditions. (b) Secondary structure contents.
The calculated contents of secondary structures at 0.1 MPa suggested PPO included 13.0% α-helix, 20.3% β-folding, 21.8% β-turn, and 44.9% random coil. Under 100 MPa, the α-helix remained largely unchanged, but a significant reduction in the relative abundance of α-helix was observed at 300 MPa and 500 MPa. According to Köhler et al.[47], hydrogen bonds stabilizing the secondary structure of protein were strengthened at low/intermediate pressures, but disrupted at higher pressures, which may explain the observed changes in the α-helix of PPO. At the same time, with increasing pressure, the proportion of β-folding increased significantly, from 21.8% to 41.1%, while the content of random coil gradually decreased from 44.9% to 31.6%. These results suggested that high pressure does not cause complete unfolding of PPO, but rather induced structural transitions in specific flexible regions. The disruption and reorganization of hydrogen bonds and hydrophobic interactions under pressure likely allow parts of the α-helix and random-coil segments to partially unfold, and then refold into more extended β-folding structures, while the overall protein fold is preserved. In contrast, the change in β-turn was relatively minor, slightly decreasing from 20.3% to 17.4%. The observed changes can likely be attributed to the disruption of hydrogen bonds and hydrophobic interactions within the protein structure under increased pressure, while β-turn structures, due to their inherent flexibility, appear to be less sensitive to pressure variations[48].
Although the residual activities of purified sPPO at 100, 300, and 500 MPa were similarly low, this does not contradict the pronounced pressure-dependent changes in secondary structure. Enzyme activity and conformation are related, but the presence or absence of statistically significant differences in activity does not dictate how the secondary-structure elements will respond to pressure. Instead, the secondary structure changes are mainly governed by the applied pressure itself.
Fluorescence spectrum analysis
-
The intrinsic fluorescence of proteins, primarily arising from tyrosine (Tyr) and tryptophan (Trp) residues located in the hydrophobic core, can be effectively distinguished using synchronous fluorescence spectroscopy with Δλ = 15 nm for Tyr, and Δλ = 60 nm for Trp. The conformational changes around the Trp and Tyr fluorophores after HPP can be observed by synchronous fluorescence measurements. As shown in Fig. 4a, b, the fluorescence intensities of both Tyr and Trp decreased significantly with increasing pressure. This indicated that HPP perturbs the protein structure, resulting in increased exposure of fluorophores, which in turn enhances fluorescence quenching. When we set Δλ = 15 nm, as the pressure increases from 0.1 MPa to 500 MPa, the maximum emission wavelength (λmax) exhibited a slight red shift (i.e., a shift to longer wavelengths), suggesting that the hydrophobic environment around Tyr residues weakens, leading to greater exposure to a polar environment. For Δλ = 60 nm, between 0.1 MPa and 300 MPa, a similar red shift in λmax was observed, accompanied by a gradual decrease in fluorescence intensity. This resulted in the protein undergoing partial unfolding or relaxation within this pressure range, exposing Trp residues to a more polar environment, which accounted for the red shift and reduced intensity. However, under 500 MPa, the fluorescence peak of Trp exhibited a blue shift (i.e., a shift to shorter wavelengths) compared to lower pressure conditions, which likely indicated that under high pressure, the protein underwent partial refolding, causing some Trp residues to be reburied within the hydrophobic core or a more hydrophobic microenvironment.
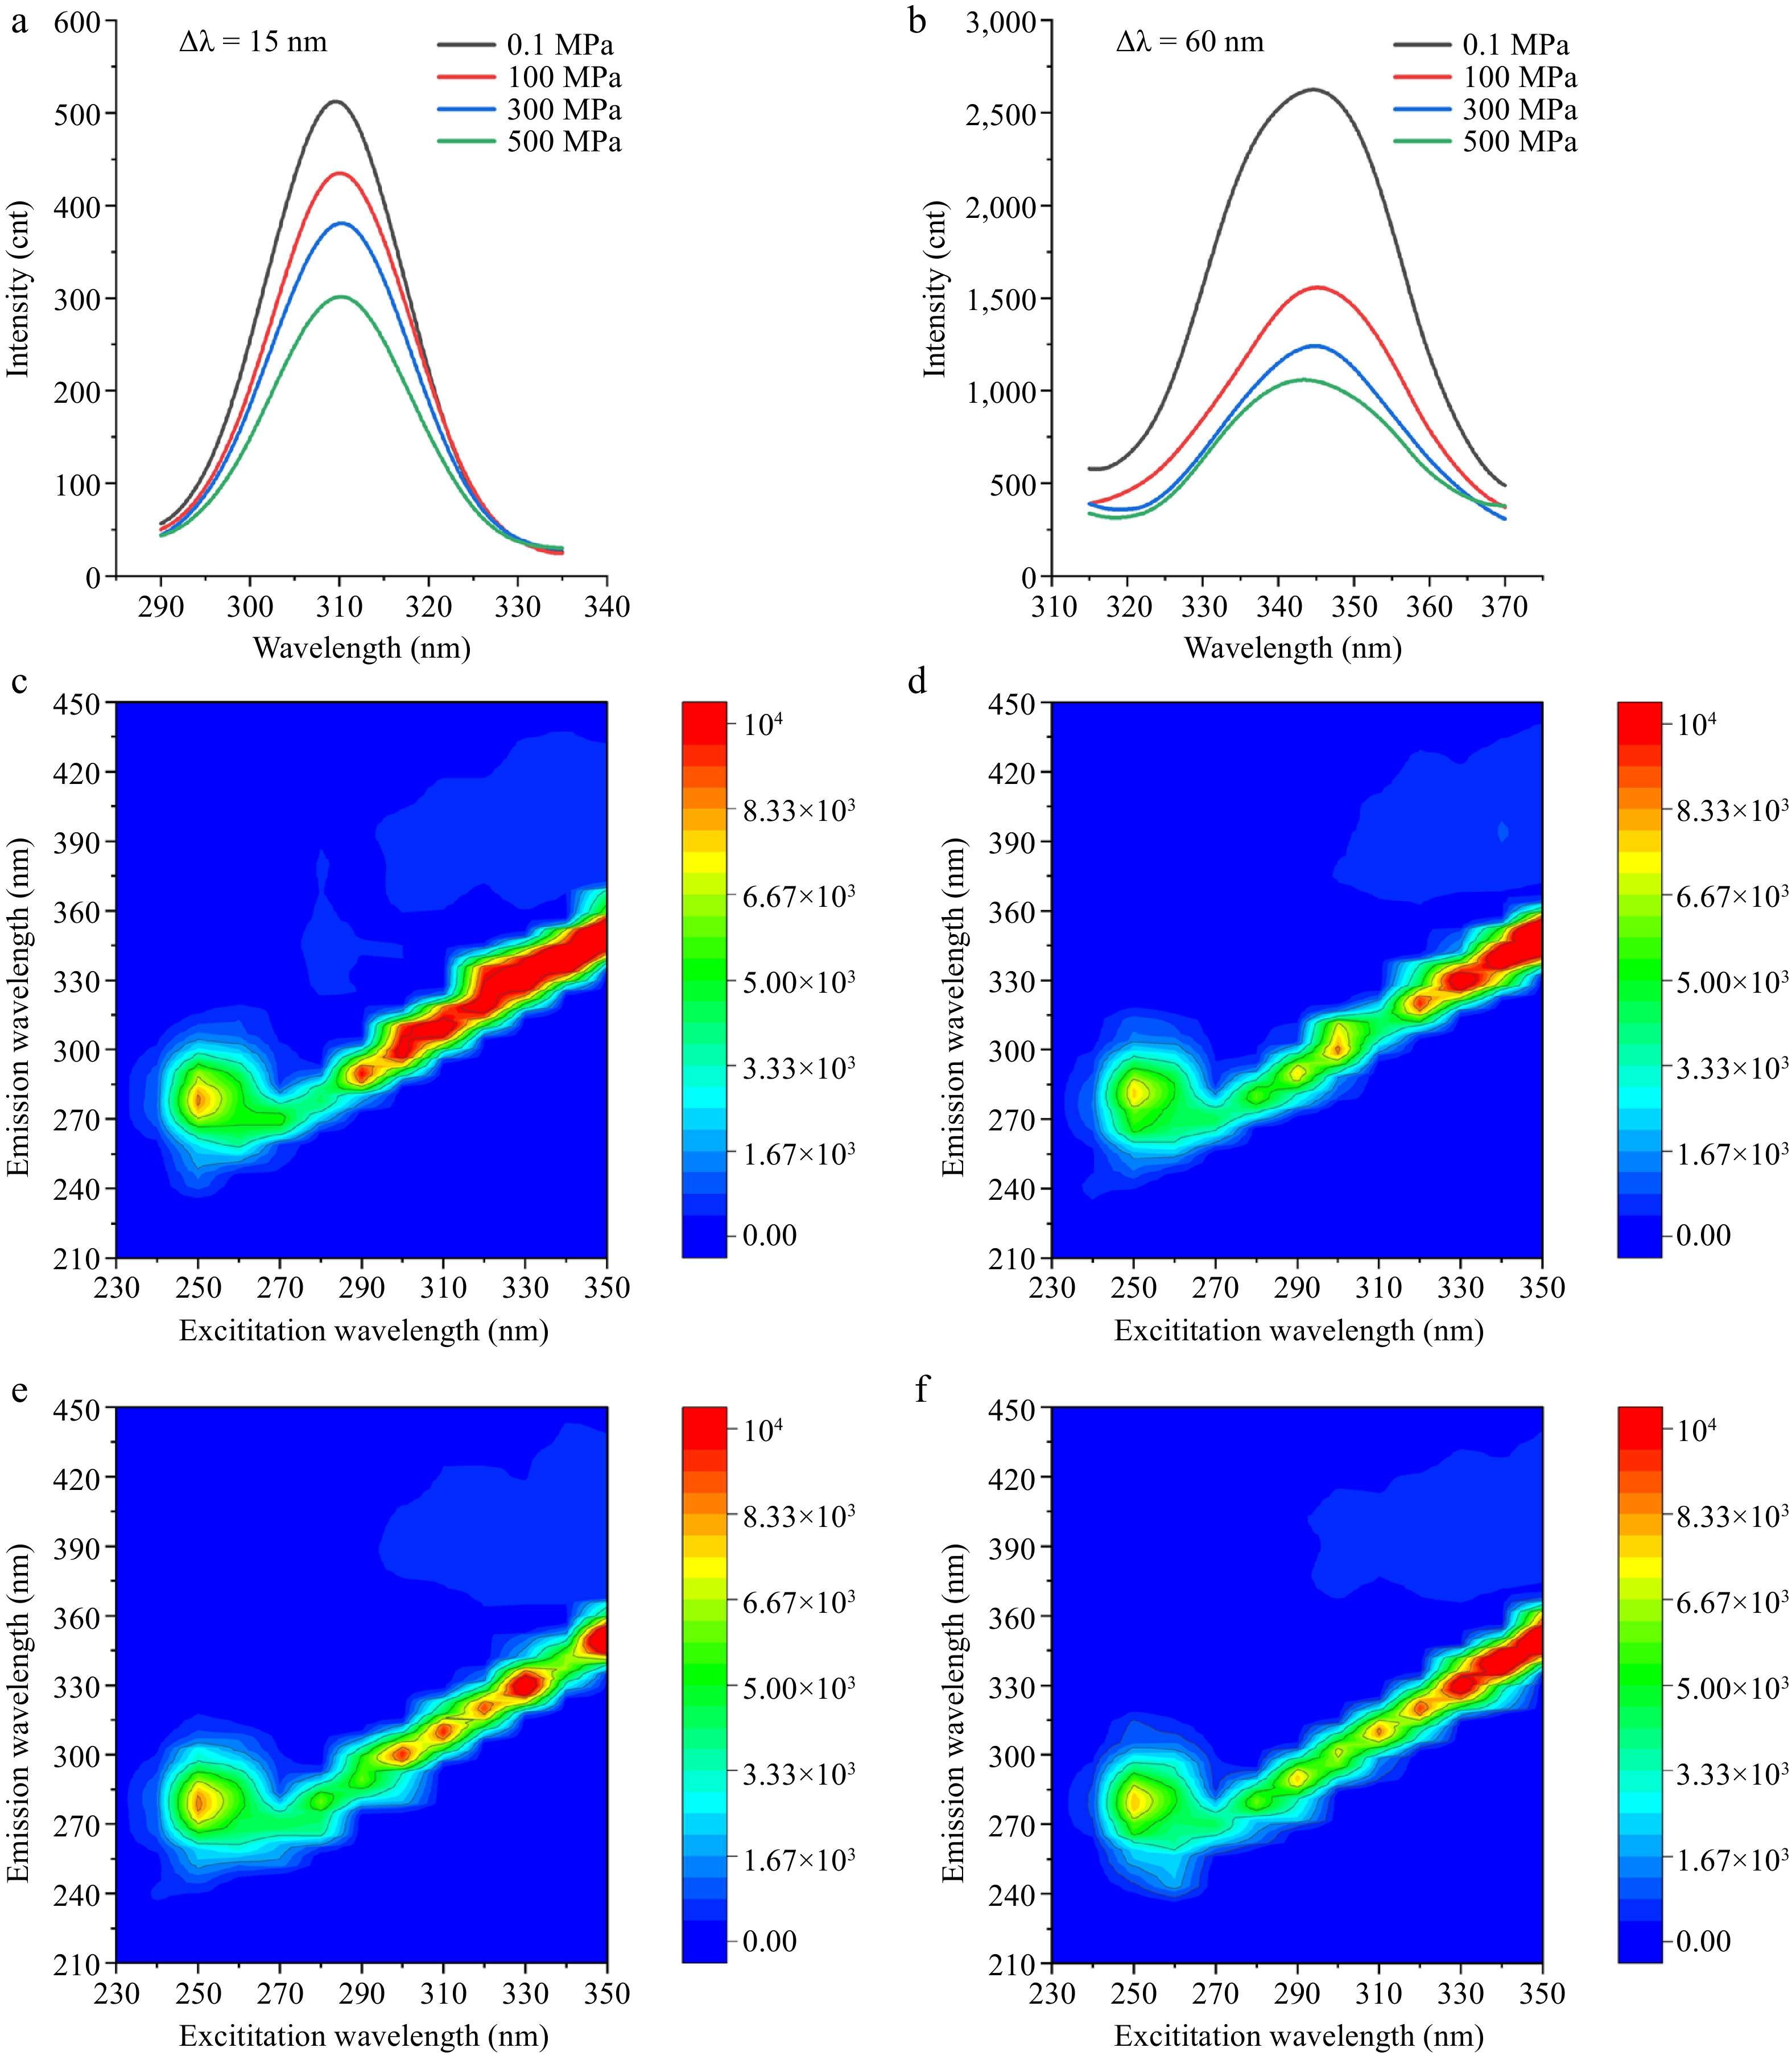
Figure 4.
Fluorescence spectrum under different HPP treatments. (a) Synchronous fluorescence spectra recorded at Δλ = 15 nm (Tyr), and (b) Δλ = 60 nm (Trp), respectively. 3D fluorescence spectra at (c) 0.1, (d) 100, (e) 300, and (f) 500 MPa, respectively.
The 3D fluorescence spectra of PPO under different pressure treatments (0.1, 100, 300, and 500 MPa) were presented in Fig. 4c–f. These spectra indicated that fluorescence intensity, peak shape, and peak position exhibited notable changes as pressure increased. At 0.1 MPa (Fig. 4c), the fluorescence spectrum displayed a typical excitation-emission correlation, with the primary fluorescence peak observed at an excitation wavelength of approximately 250 nm and an emission wavelength around 280 nm, along with relatively high fluorescence intensity. After treatment at 100 MPa (Fig. 4d), although the fluorescence peak remained, its shape was altered, and fluorescence intensity decreased in certain regions, likely due to pressure-induced molecular conformational changes or aggregation. At 300 MPa (Fig. 4e), the fluorescence peak became more uniform, and fluorescence intensity slightly increased. This enhancement may have resulted from the formation of an ordered molecular stacking arrangement, optimizing π–π interactions and reducing non-radiative decay, thereby improving fluorescence efficiency[49]. In contrast, at 500 MPa (Fig. 4f), fluorescence intensity further decreased, potentially due to enhanced intermolecular interactions under high pressure, leading to increased fluorescence quenching.
Molecular dynamics simulation analysis
-
To compare the structural behavior of PPO during pressurization and after depressurization, the MD simulations were divided into two stages: simulations under 0.1, 100, 300, and 500 MPa (pressurized state), and simulations after 100, 300, and 500 MPa (depressurized state).
RMSD is commonly employed to evaluate the structural stability and conformational changes of a protein during simulations, with a higher RMSD value indicating greater deviation in the overall structure. As shown in Supplementary Fig. S1, the overall RMSD variations under all pressure conditions were relatively low and stable, suggesting that the simulated structures had reached equilibrium. When PPO was subjected to pressure, increasing the pressure under 100, 300, and 500 MPa resulted in slightly lower RMSD values compared with 0.1 MPa, indicating that the systems under 300 and 500 MPa exhibited reduced structural deviation and higher stability. In the depressurized state, RMSD remained low after 100 and 300 MPa, showing that moderate depressurization conditions preserved structural stability, whereas after 500 MPa, the RMSD values increased, suggesting that very high pressure followed by depressurization induced additional structural perturbations.
RMSF reflects the degree of fluctuation of amino acid residues and thus the local mobility of the protein structure. As shown in Supplementary Fig. S2, high-pressure treatment reduced overall residue fluctuations under 100, 300, and 500 MPa, indicating enhanced structural rigidity compared with 0.1 MPa. In the depressurized simulations after 100 MPa, residue fluctuations were also relatively low, consistent with a stabilized structure under moderate post-processing conditions. However, after 300 and 500 MPa, RMSF values in some regions increased again, suggesting that excessive depressurization caused localized flexibility or destabilization. Throughout all conditions, residues in the structurally conserved core showed low RMSF values, while the largest fluctuations were observed around residue 500, corresponding to an intrinsically flexible loop or disordered region. RMSF analysis further showed that residue fluctuations decreased with increasing pressure, stabilizing the core of PPO, while excessive depressurization led to localized increases in flexibility, mainly in peripheral loop regions.
SASA is a key parameter that reflects protein structural compactness and solvent exposure. A lower SASA value generally indicates a more compact protein structure, whereas a higher SASA suggests increased solvent exposure and potential structural loosening. As shown in Supplementary Fig. S3a, SASA values under 0.1, 100, 300, and 500 MPa exhibited a clear trend, under pressurized conditions, increasing pressure led to a more compact PPO structure, reducing hydrophobic interactions. In contrast, after 100, 300, and 500 MPa (Supplementary Fig. S3b), SASA values increased, indicating that depressurization produced a more relaxed conformation with enhanced exposure of hydrophobic regions, which is consistent with the ANS fluorescence results. Overall, these SASA results, together with the RMSD and RMSF analyses, indicate that PPO becomes more compact as pressure increases, whereas after depressurization, it adopts a more relaxed, reorganized conformation with greater solvent exposure.
Based on the residue–residue distance matrix in Supplementary Fig. S4, the residue-residue interactions exhibited minimal variation under different pressure treatments and pressure states. This observation indicated that the protein structure remained relatively stable throughout the entire simulation.
Markov State Model analysis
-
MD simulations often struggle to capture long-timescale conformational dynamics due to computational limitations. In contrast, MSM provides an effective framework for describing such slow transitions by discretizing the system's continuous dynamics into a set of metastable states, and constructing a transition probability matrix based on the Markovian assumption, thereby enabling the efficient characterization of long-timescale evolution. In this study, tICA combined with clustering techniques was employed to construct a low-dimensional kinetic model of the protein system and to identify its metastable states. Figure 5a presented the VAMP2 scores for different feature representations at varying lag times, demonstrating that backbone torsions emerged as the optimal feature and consistently yielded the highest VAMP2 scores across all lag times, which suggested that backbone torsions were the most effective descriptor for capturing slow conformational transitions.
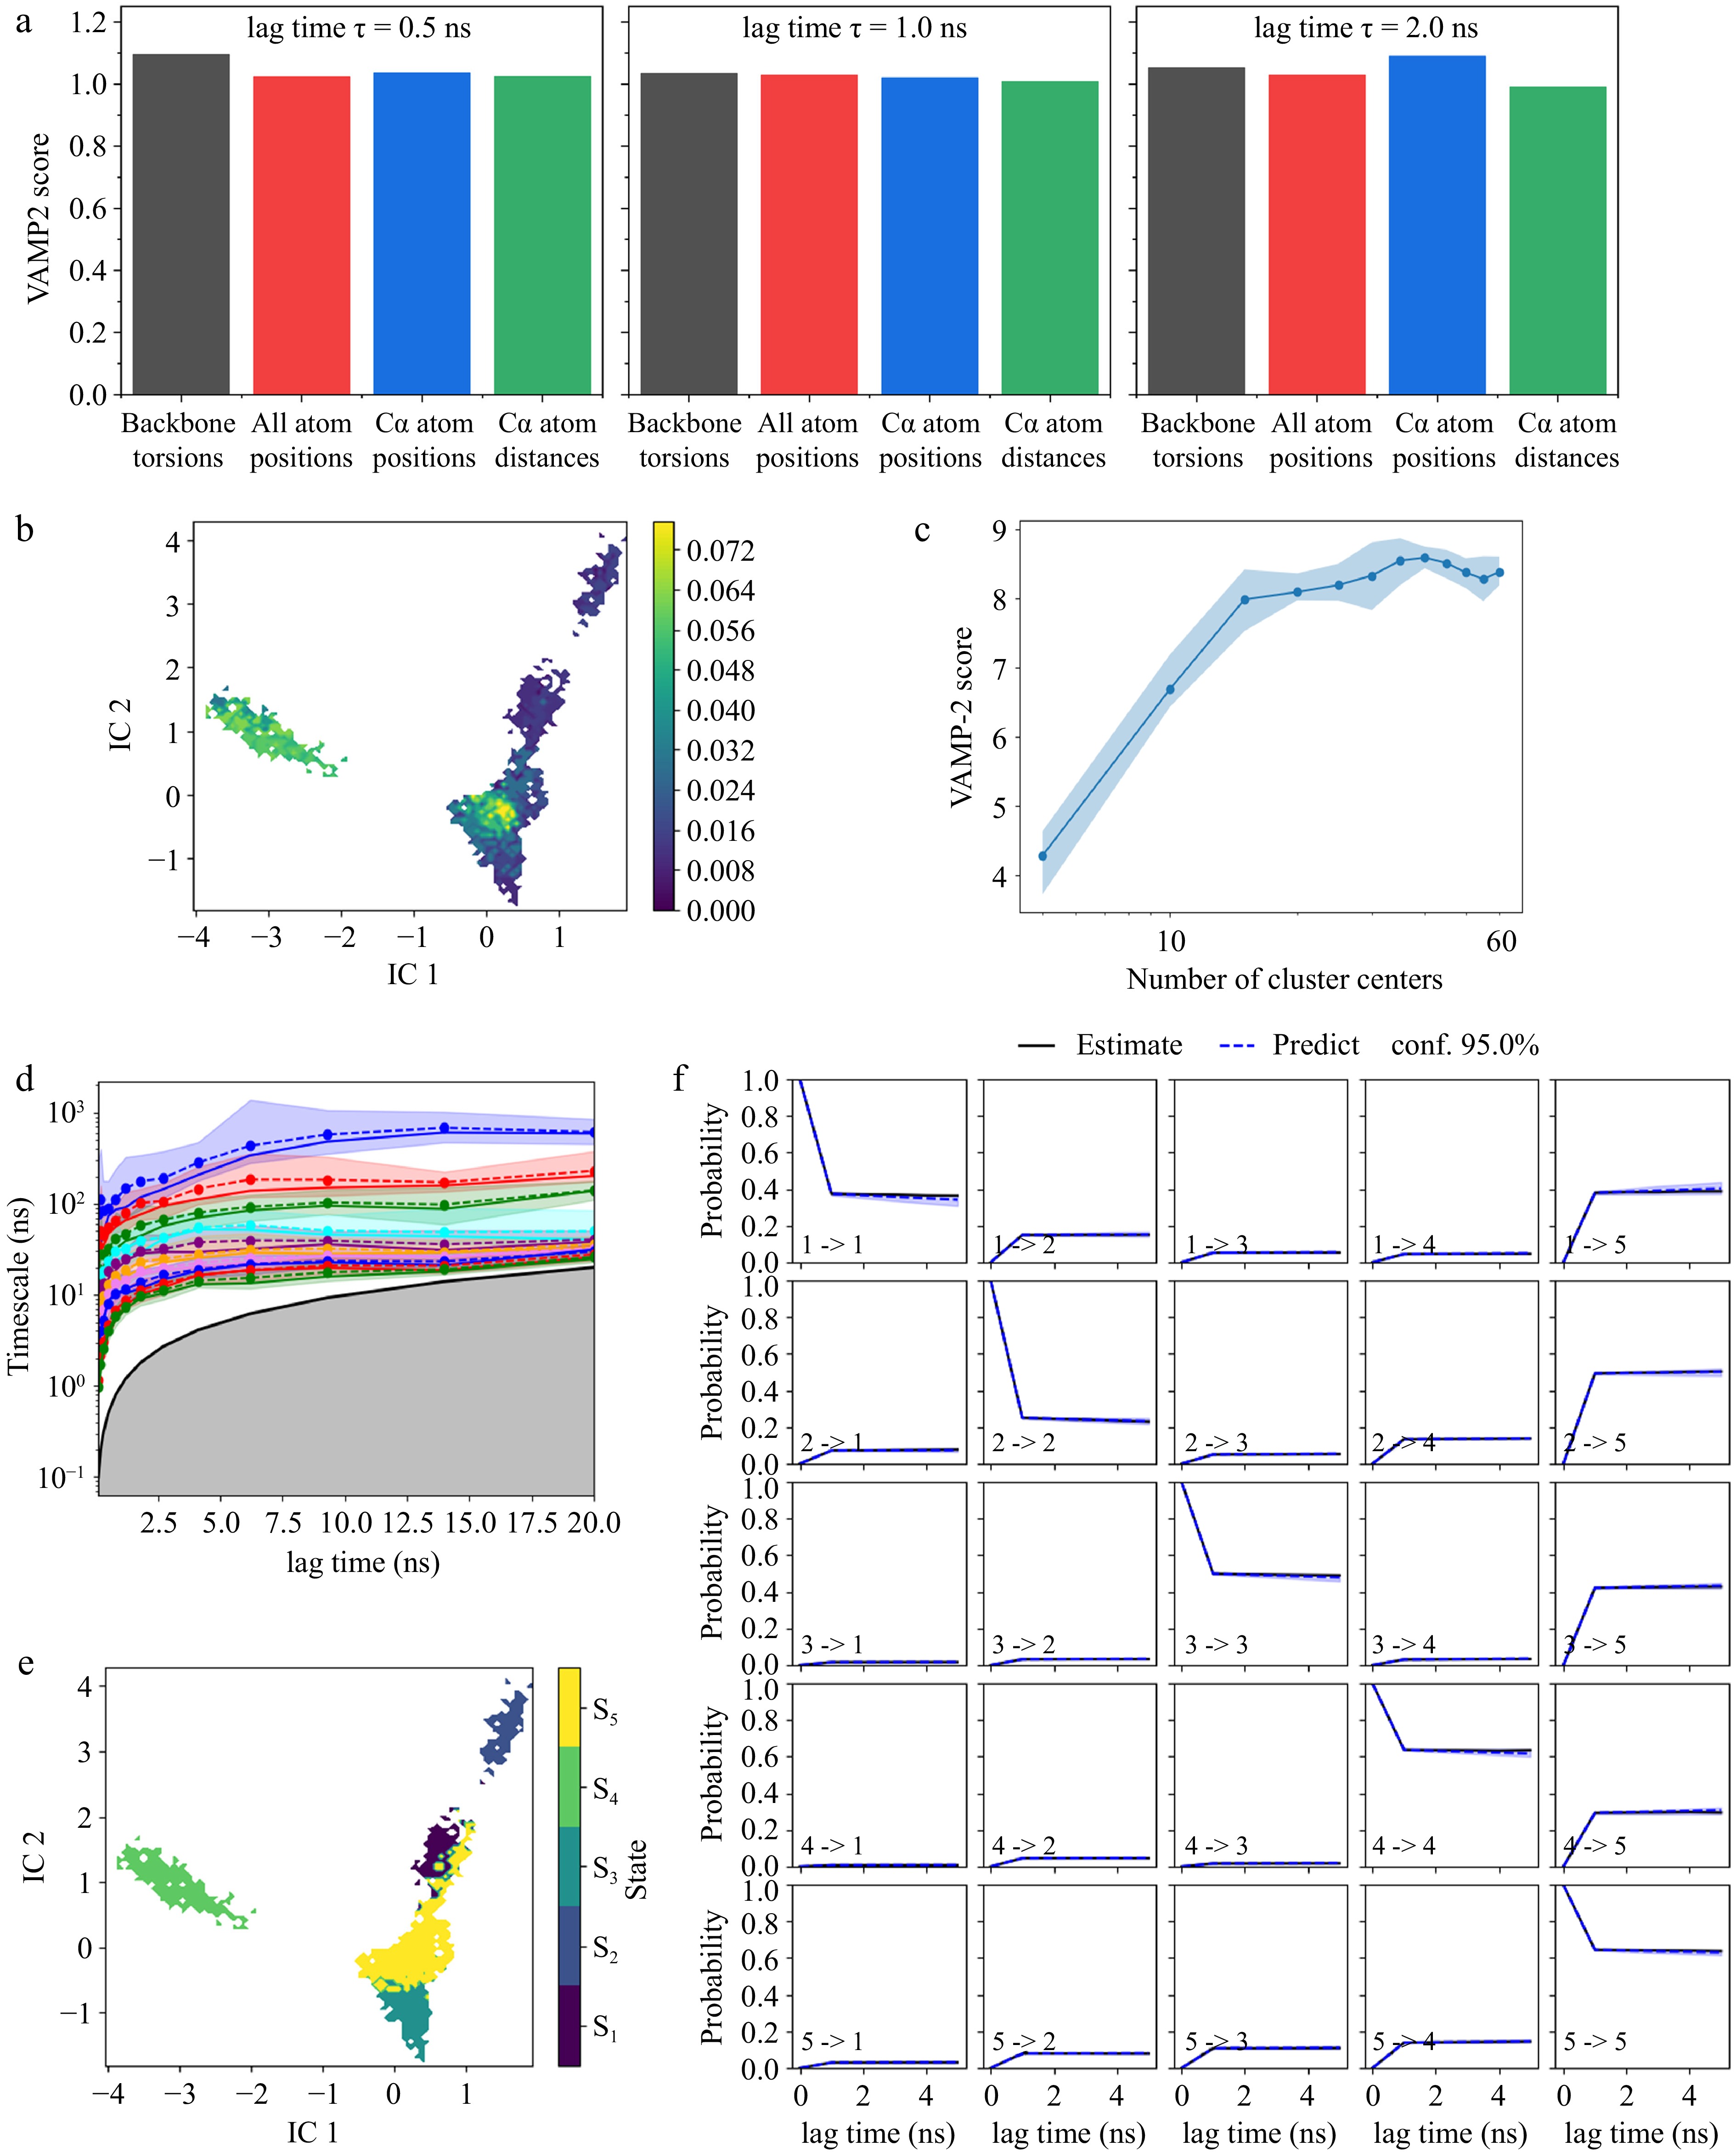
Figure 5.
Markov State Model analysis of mushroom polyphenol oxidase. (a) VAMP2 score of backbone torsion, all atom positions, Cα atom positions, and Cα atom distance; (b) time-lagged independent component analysis (tICA); (c) k-means cluster number validation using VAMP2 score; (d) implied timescales of different lag time; (e) Perron Cluster Cluster Analysis (PCCA) of metastable states. S1–S5 indicate the five metastable sets corresponding to states 1–5 in the MSM. (f) Markov State Model validation with Chapman-Kolmogorov test.
Figure 5b illustrates the projection of backbone torsions onto the first two independent components (IC1 and IC2) derived from tICA under seven distinct processing conditions (0.1 MPa, under 100, 300, and 500 MPa, and after 100, 300, and 500 MPa). The tICA analysis revealed multiple metastable states within the conformational space, where high-density regions corresponded to frequently sampled stable conformations, while low-density regions indicated transition pathways between states. The well-separated metastable basins suggested significant conformational heterogeneity, with potential free energy barriers between different states. Figure 5c displayed the clustering optimization results, where the VAMP2 score increased with the number of cluster centers and eventually stabilized. Beyond a certain threshold, the VAMP2 score plateaued or slightly declined, indicating that increasing the number of states further did not significantly enhance model performance. Based on this, 40 cluster centers were selected, which were sufficient to resolve the slow processes without altering the spectrum of implied timescales, thereby achieving a balance between model detail and statistical robustness.
Figure 5d evaluated whether the constructed MSM satisfied the Markovian assumption, ensuring that all implied timescales converged at an appropriate lag time. The different colored curves represented distinct relaxation timescales corresponding to different kinetic processes computed by the MSM. At lag times shorter than 5 ns, the implied timescales remained unstable, suggesting that the system had not yet achieved Markovianity, whereas a lag time of τ = 5 ns was selected, as the system exhibited stable and converged timescales beyond this point. Under this choice, the slowest implied timescales correspond to the dominant conformational transitions between metastable states and are clearly separated from faster local motions, indicating that the MSM captures the relevant slow kinetics of PPO.
Figure 5e visualized the distribution of five metastable states identified by MSM within the tICA space. The distinct clustering pattern, obtained via Perron Cluster Cluster Analysis (PCCA), suggested that the state decomposition was well-defined, aligning with the implied timescale analysis (τ = 5 ns), thereby further validating the robustness of the MSM training. Subsequently, a Chapman-Kolmogorov test was conducted (Fig. 5f) to evaluate whether the identified five state models adequately captured the system's conformational transitions. This assessment ensured that the metastable states faithfully represented the long-timescale behavior of the system and provided a meaningful kinetic partitioning of the conformational landscape.
The comparative analysis of PPO under 0.1, 100, 300, and 500 MPa, after 100, 300, and 500 MPa revealed distinct effects on conformational dynamics, as shown in Fig. 6a–g. Under 100 MPa, the conformational space remained relatively restricted, with minor deviations from the 0.1 MPa reference. However, after 100 MPa, the system exhibited a significantly expanded distribution. This trend became more pronounced under 300 MPa, and after 300 MPa, where the latter induced greater conformational shifts along the IC1 axis, suggesting a deeper exploration of alternative states. Similarly, 500 MPa resulted in a relatively compact distribution, whereas after 500 MPa led to an even broader conformational spread, spanning the entire IC1 direction. After depressurization, the conformation changes with pressure were consistent with both spectroscopic and molecular dynamics results: ANS, synchronous, and three-dimensional fluorescence indicated increased exposure of hydrophobic regions, whereas CD, together with SASA analysis revealed a shift from compact high-pressure conformations to more relaxed, solvent-exposed structures.
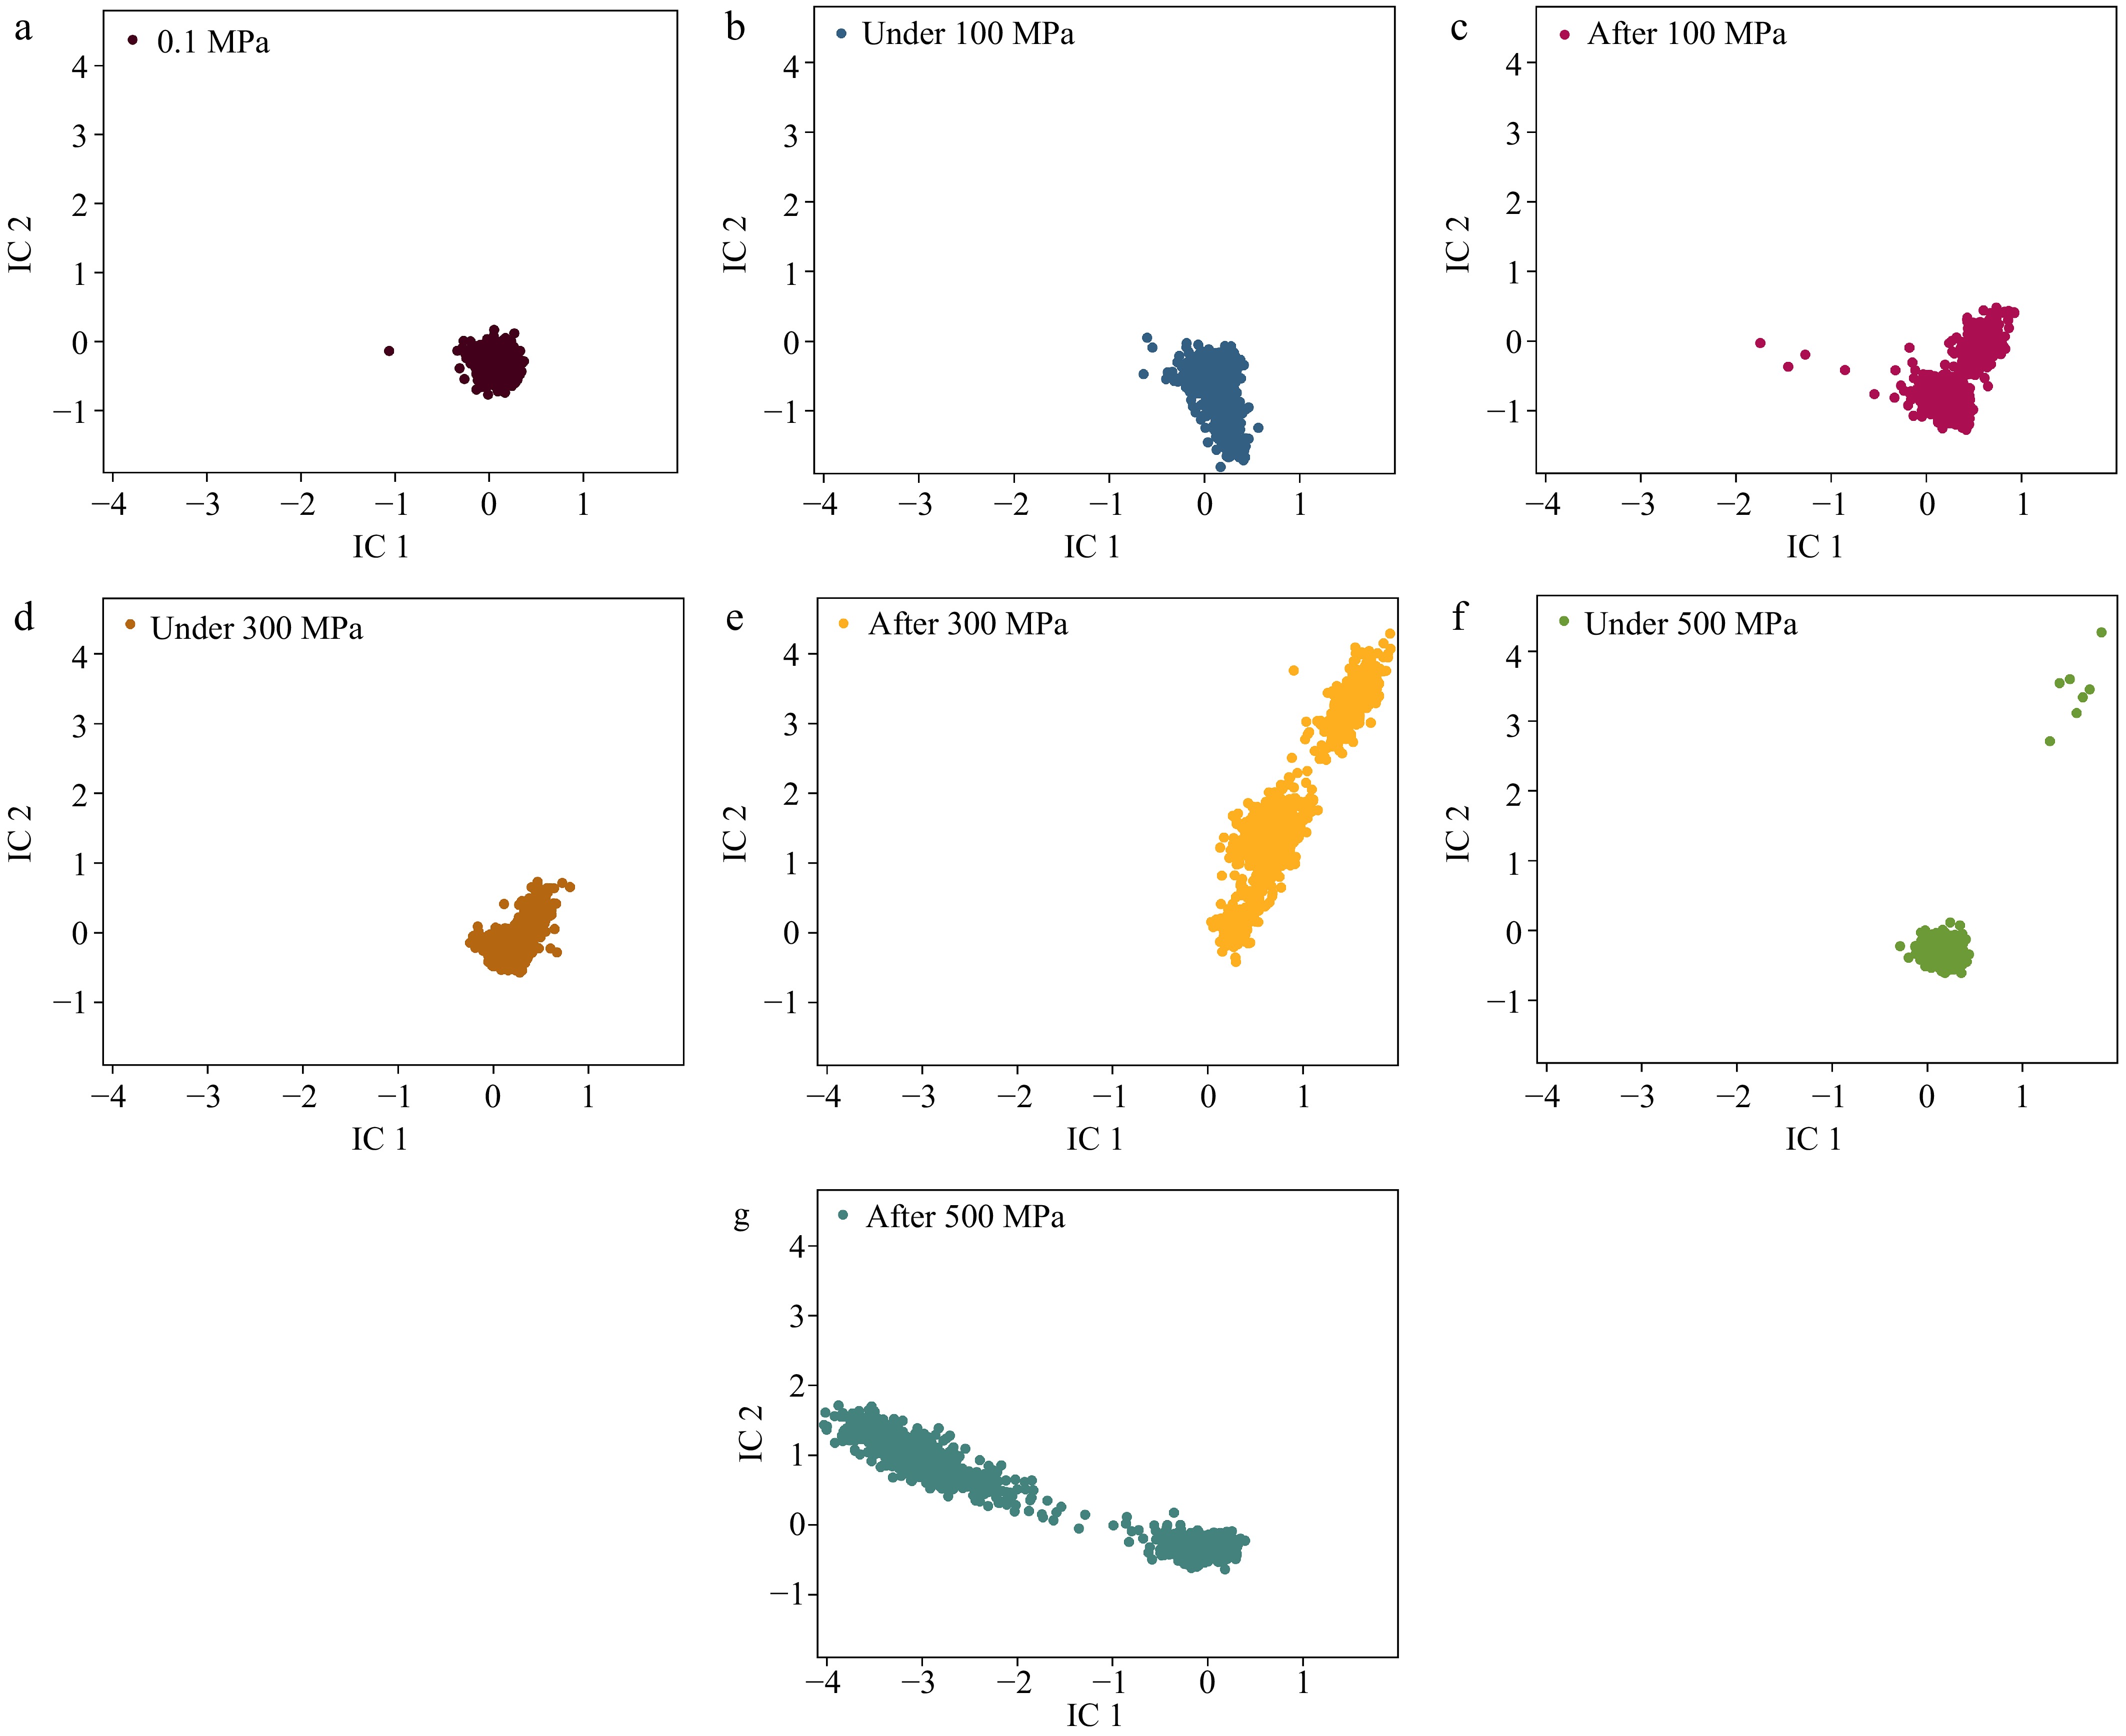
Figure 6.
Conformational distributions in tICA space. Conformational distributions at pressures of (a) 0.1 MPa, (b) under 100 MPa, (c) after 100 MPa, (d) under 300 MPa, (e) after 300 MPa, (f) under 500 MPa, and (g) after 500 MPa.
The PCCA-based metastable state decomposition (Fig. 5e) identified five distinct conformational states 1-5 within the tICA space, providing a quantitative characterization of slow conformational dynamics. At 0.1 MPa, under 100 MPa, and after 100 MPa, the system predominantly resided in State 3 and State 5, suggesting that lower pressure conditions did not significantly perturb the conformational landscape, and the system remained in metastable basins that were accessible under ambient conditions. These two states mainly correspond to native or only slightly loosened conformations with limited changes in global compactness. Under 300 MPa, the system still remained localized in State 3 and State 5, indicating that while moderate pressure induced conformational changes, it did not extensively promote transitions into alternative metastable states. These compact high-pressure conformations were consistent with the lower RMSD and SASA values observed under 300 MPa, supporting the notion that PPO becomes more tightly packed and dynamically restricted during pressurization. In contrast, after 300 MPa, the system exhibited transitions across States 1, 2, 3, and 5, suggesting that post-processing at this pressure level facilitated a broader conformational sampling, and enhanced transitions into previously inaccessible metastable states, likely reflecting structural relaxation from compact high-pressure conformations. In this regime, State 1 and 2 can be viewed as alternative compact or partially relaxed conformations that become more populated after pressure release. After 300 MPa, the conformational ensemble was consistent with the enhanced ANS fluorescence, the redistribution of the secondary structure, and the increased RMSF and SASA values in the depressurized simulations, indicating that PPO adopted a more heterogeneous and flexible conformational distribution. Under 500 MPa, the system primarily populated State 2 and State 5, implying that extreme pressure induced a shift in the free energy landscape, stabilizing specific metastable states that were distinct from those observed at lower pressures. Notably, after 500 MPa, the system transitioned predominantly into State 4 and State 5, highlighting a pressure-dependent shift in conformational preferences. State 4, which appeared exclusively after 500 MPa, represented a more expanded and flexible metastable conformation that did not occur under the corresponding pressurized conditions, indicating that high-pressure treatment followed by depressurization promoted unique structural rearrangements in PPO. The appearance of a distinct, more flexible metastable state, only after 500 MPa was consistent with the most pronounced fluorescence and CD changes at this pressure, and helped explain the persistently low residual activity observed at 500 MPa.
Further analysis using PCCA (Fig. 7) provided a visual representation of the representative conformations of these metastable states. The five conformational states (Fig. 7a–e) exhibited significant differences in secondary structure elements and active site geometry. Notably, States 3 and 5, which corresponded to lower pressure conditions (Fig. 7c, d), maintained a more compact and ordered conformation, whereas States 1, 2, and 4 (Fig. 7a, b, and e), which emerged under high-pressure conditions, displayed greater conformational flexibility.
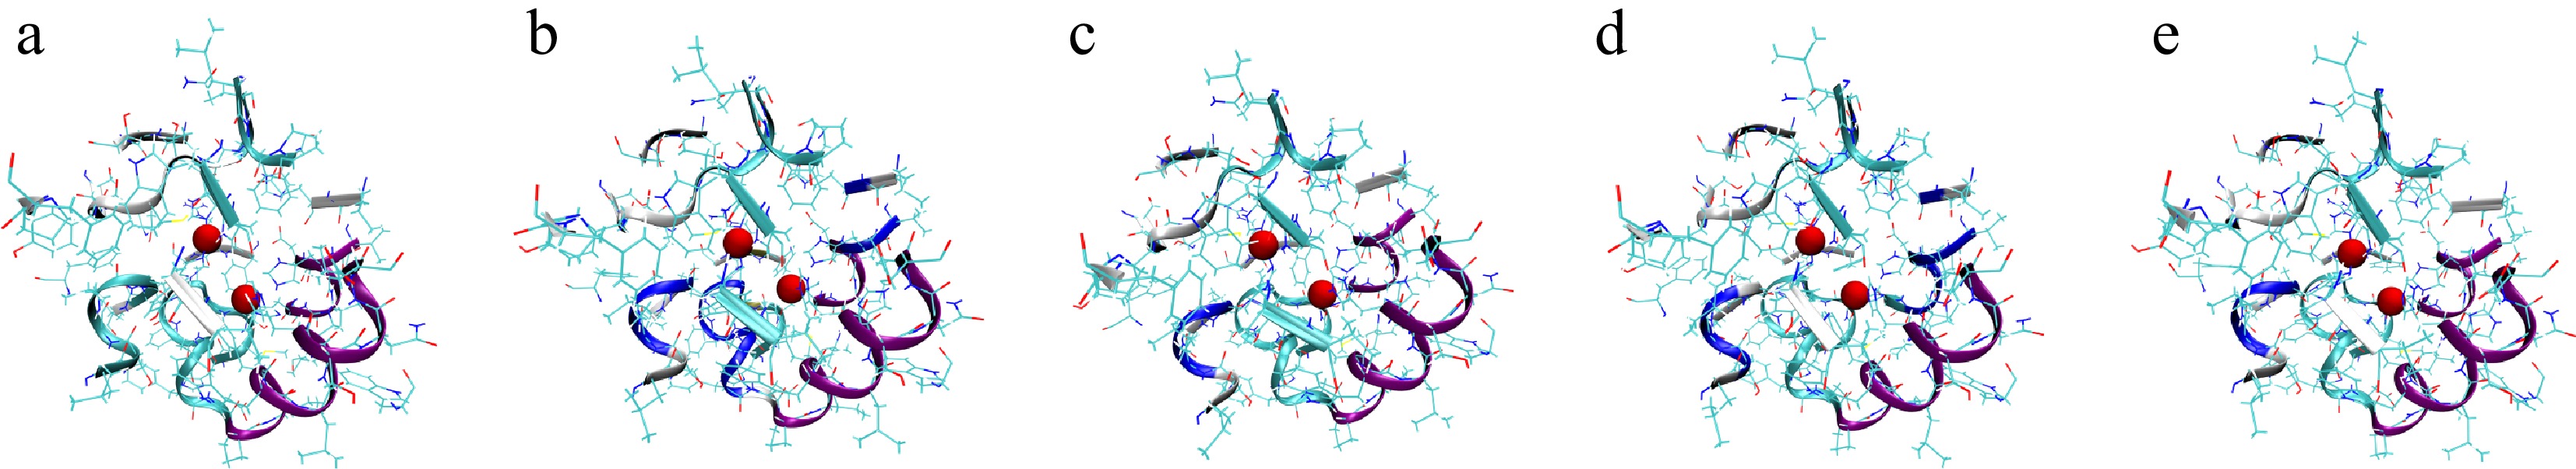
Figure 7.
Mushroom PPO structures corresponding to the five metastable states obtained from PCCA clustering. (a)–(e) The representative conformations of the five metastable states. The two red spheres denote the Cu2+ ions at the catalytic active site, defined as residues within 20 Å of the copper ions, and these surrounding residues are shown in New Cartoon representation to highlight the local active-site environment.
-
This study revealed that HPP significantly affected the structural stability and conformational dynamics of PPO. Enzymatic activity declined with increasing pressure, while spectroscopic analyses showed structural perturbations, including hydrophobic exposure, α-helix loss, and β-sheet formation. Computational approaches enabled the characterization of distinct PPO conformations under high pressure, offering molecular insights into pressure-induced structural adaptations. MD simulations confirmed that high pressure stabilized PPO by reducing residue fluctuations, while depressurized state facilitated structural relaxation. MSM analysis identified five states and corresponding PPO conformations. These findings provide insights into the structure of PPO adaptability under pressure, elucidating the intrinsic relationship between enzyme conformation and activity, thereby advancing the understanding of enzyme behavior in high-pressure environments.
-
The authors confirm contribution to the paper as follows: conceptualization, methodology, investigation, writing − original draft: Gao L; visualisation: Gao L, Zou H, Chen Y; writing − review and editing and supervision: Zou H, Chen Y; project administration and funding acquisition: Zou H. All authors reviewed the results and approved the final version of the manuscript.
-
The datasets generated during and/or analyzed during the current study are available from the corresponding author on reasonable request.
-
The authors declare that they have no conflict of interest.
-
accompanies this paper online at: https://doi.org/10.48130/fia-0026-0012.
- Supplementary Fig. S1 RMSD of PPO systems during the pressurization and depressurization stages from MD simulations.
- Supplementary Fig. S2 RMSF of PPO systems during the pressurization and depressurization stages from MD simulations.
- Supplementary Fig. S3 SASA of PPO systems during the pressurization and depressurization stages from MD simulations.
- Supplementary Fig. S4 Residue–residue distance matrix heatmaps of PPO systems during the pressurization and depressurization stages from MD simulations.
- Copyright: © 2026 by the author(s). Published by Maximum Academic Press on behalf of China Agricultural University, Zhejiang University and Shenyang Agricultural University. This article is an open access article distributed under Creative Commons Attribution License (CC BY 4.0), visit https://creativecommons.org/licenses/by/4.0/.
-
About this article
Cite this article
Gao L, Zou H, Chen Y. 2026. Effects of high pressure processing on the polyphenol oxidase activity: exploring the relationship between structure conformation and enzyme activity using Markov State Model. Food Innovation and Advances 5(2): 163−174 doi: 10.48130/fia-0026-0012 

Effects of high pressure processing on the polyphenol oxidase activity: exploring the relationship between structure conformation and enzyme activity using Markov State Model
- Received: 26 October 2025
- Revised: 26 January 2026
- Accepted: 31 January 2026
- Published online: 27 April 2026
Abstract: Polyphenol oxidase (PPO), a copper-containing enzyme, plays a key role in the enzymatic browning of fruits and vegetables, presenting challenges for food preservation. High-pressure processing (HPP) is a non-thermal technology for preserving fruits, vegetables, meat, etc. In some cases, its effect on PPO activity is limited, leading to severe browning during storage, and the underlying mechanisms remains unclear. This study purified mushroom PPO, primarily with a molecular weight of 50 kDa, and its conformation and activity under different HPP conditions were evaluated by combining multispectral analysis with computational methods. Results showed that enzyme activity decreased with increasing pressure, retaining 16.55%, 13.28%, and 12.76% at 100, 300, and 500 MPa, respectively. High pressure exposed hydrophobic regions of PPO, which promoted ANS binding, led to an increase in fluorescence intensity along with a blue shift. The secondary structure became less stable—β-folding rose by 19.3%, while random coils dropped by 13.3%. As more fluorescent groups were exposed, fluorescence quenching was enhanced. Molecular dynamics simulations combined with Markov State Models (MSMs) revealed that high pressure stabilized PPO, whereas pressure release caused local structural disruptions, increased flexibility, and a looser overall conformation. For MSM analysis, conformational distributions were compact during HPP and showed varied expansion directions depending on the release pressure. High pressure under 100 MPa showed limited conformation changes compared to 0.1 MPa, while under 300 and 500 MPa produced distinct conformations. In addition, after 500 MPa promoted transitions into a unique metastable state not seen under high pressure.