


-
Obesity and its associated metabolic syndrome have become increasingly severe public health issues worldwide. In 2021, an estimated 2.11 billion adults were overweight or obese, accounting for nearly half of the global population[1]. Obesity is also a leading cause of the growing burden of non-communicable diseases, with type 2 diabetes, cardiovascular diseases, and fatty liver closely linked to obesity. Studies have shown that obesity is a chronic disease caused by the complex interplay of genetic, metabolic, behavioral, and environmental factors. However, its essence remains an imbalance between energy intake and energy expenditure, with excess energy being converted into triglycerides that accumulate, leading to lipid deposition. Currently, in addition to lifestyle interventions such as dietary control and increased physical activity, medical interventions for patients with severely elevated BMI have emerged, including pharmacological treatments, medical devices, and weight-loss surgeries[2]. However, in practical applications, high-intensity lifestyle interventions are often difficult to maintain, while medical interventions are associated with significant drawbacks, including rebound weight gain, side effects, and severe complications. Therefore, exploring the mechanisms of weight loss and finding safe and reliable treatment strategies for obesity have become key areas of focus in current weight reduction research.
Mammalian adipose tissue is classified into three main types: white adipose tissue (WAT), brown adipose tissue (BAT), and beige adipose tissue. WAT primarily functions in energy storage, while BAT and beige adipose tissue are involved in thermogenesis and play a key role in maintaining body temperature and regulating energy metabolism. Under cold stimulation, sympathetic nerve endings in BAT secrete norepinephrine, which promotes an increase in the expression of uncoupling protein 1 (UCP1), leading to energy dissipation in the form of heat[3]. Additionally, white adipocytes can also undergo a transformation into a beige adipocyte phenotype under conditions such as cold exposure, characterized by the increased expression of thermogenesis-related genes. Animal studies have demonstrated that activation of BAT can significantly increase the basal metabolic rate, reduce fat accumulation, and improve glucose tolerance and insulin sensitivity[4], providing new insights for the intervention of obesity and its metabolic diseases.
Previous studies often regarded lactate as a byproduct of anaerobic metabolism, but recent research has shown that lactate plays a crucial role in the body's energy metabolism. Lactate functions as an energy source, signaling molecule, and gluconeogenesis precursor by shuttling between producing and consuming cells[5], and it also plays a role in various pathophysiological processes such as obesity, non-alcoholic fatty liver disease, and cancer. Lactate is a major carbon source for the TCA cycle. Studies simulating increased circulating lactate through extracellular lactate accumulation have shown that lactate enters the mitochondrial matrix and stimulates the activity of the mitochondrial electron transport chain (ETC), leading to enhanced mitochondrial ATP synthesis[6]. Similarly, dietary intake of lactate can activate G-protein-coupled receptors, promoting the browning of adipose tissue, and reducing obesity in high-fat diet-fed mice[7,8]. Accumulation of lactate in the liver can inhibit the activity of fatty acid synthase through lactylation, thereby reducing liver lipid accumulation in models of fatty liver[9]. Furthermore, extensive research has identified lactate as an important mediator in exercise-induced appetite suppression[10]. Therefore, lactate can alleviate obesity through various mechanisms, including promoting metabolism, enhancing thermogenesis, and inhibiting appetite.
The lactate-specific receptor GPR81 participates in the metabolic processes of tissues and cells by regulating the Gi signaling pathway and its associated signaling molecules. GPR81 is predominantly expressed in adipose tissue[11], but it is also widely present in other tissues and organs such as the liver, kidneys, and brain. Studies have shown that increased circulating lactate levels can activate GPR81, leading to the phosphorylation of downstream proteins and inducing thermogenesis and browning of adipose tissue[12]. Supplementation with lactate in the diet can also activate GPR81 to promote the browning of white adipose tissue[13].
The transmembrane transport of lactate is crucial for mammalian cells[14]. MCT1–4 are bidirectional proton-coupled monocarboxylate transporters, located on both the mitochondrial and plasma membranes. The driving forces for their transport include the transmembrane substrate concentration gradient and the local availability of protons[15]. Among them, MCT1 and MCT4 mediate lactate shuttling both intracellularly and intercellularly[16], serving as the main pathways for lactate uptake and efflux in adipose and liver cells[17]. Beyond their known roles in lactate shuttling, studies have shown that MCT1 and MCT4 play functional roles in metabolic diseases. The deletion of the MCT1 gene in the liver exacerbates high-fat diet-induced obesity and hepatic steatosis in mice[18]. Additionally, increasing MCT4 expression can reduce lipid accumulation by inhibiting lipid synthesis and promoting lipid metabolism. Conversely, inhibition of MCT4 leads to the accumulation of intracellular lipids and glucose metabolites, causing hepatic steatosis[19]. In adipocytes, MCT4 knockout-induced intracellular lactate accumulation also promotes the browning of white adipose tissue[20].
It is noteworthy that previous studies on lactate-mediated metabolic regulation have mostly employed salt forms such as sodium lactate or calcium lactate, primarily to neutralize acidity and facilitate administration. However, under physiological conditions, lactic acid (pKa 3.86) and its salt forms differ fundamentally in their dissociation state, transmembrane transport pathways, and bioavailability. Studies have shown that exposure to high concentrations of sodium lactate (i.e., lactate ions) can cause cellular swelling. Because H+ ions help neutralize negative charges within the cell, a simultaneous increase in both lactic acid or lactate ions and H+ can stabilize cell volume[21]. To date, there has been a lack of systematic investigation into the effects of exogenously administered lactic acid molecules, rather than merely their salt forms, on adipose metabolism.
Although several studies have shown that both exogenous and endogenous lactate levels can influence the body's lipid metabolism by acting on its transporters and receptors, no research has yet explored the effects of exogenous lactic acid on lactate transporters and intracellular lactate, and how this process impacts adipose tissue metabolism in obese mice. Therefore, we gavaged lactic acid to high-fat diet-induced obese mice, assessed changes in their obesity levels, and measured related genes and proteins in their tissues and organs. An equimolar sodium lactate treatment group was included to differentiate the distinct contributions of the lactate anion and the proton (H+). We found that lactic acid gavage could increase lactate levels in the body, promoting the expression of MCT1, MCT4, and GPR81, which in turn stimulated lipid metabolism and thermogenesis in brown adipose tissue, thereby alleviating obesity in the mice. In contrast, the weight-reducing effect of sodium lactate was comparatively modest.
-
Six-week-old male SPF-grade C57BL/6J mice were purchased from Spf (Beijing) Biotechnology Co., Ltd (Beijing, China). The mice were fed a high-fat diet (60% fat + 20% carbohydrates + 20% protein, 5.24 kcal/g) purchased from Research Diets, Inc., and were given distilled water. The mice were housed in an SPF animal facility with a 12-h light/dark cycle, at a temperature of 25 ± 2 °C and humidity of 55% ± 10%. After one week of acclimatization, the mice were fed a high-fat diet to induce obesity. During the acclimatization and experimental periods, the mice had free access to water and food. After 7 weeks, the average body weight reached approximately 35 g, with a body weight increase of over 20% compared to the control group, indicating successful obesity modeling. The mice were randomly divided into three groups based on body weight, with 3–4 mice per cage, and 10 mice per group. The groups were as follows: high-fat model group (MOD), lactic acid (LA) treatment group (Adamas-beta Reagent Co., Ltd, Shanghai, China), and sodium lactate (SLA) treatment group (Shanghai Macklin Biochemical Technology Co., Ltd, Shanghai, China). The mice were gavaged daily with the respective treatments. Both lactic acid and sodium lactate were administered at a dose of 1 × 10⁻³ mol/kg, with lactic acid prepared as a 7.5 μL/mL solution, and sodium lactate as a 11.2 mg/mL solution, freshly prepared. The high-fat model group was gavaged with an equal volume of distilled water. Body weight was measured weekly, and food intake was measured every 3 d. At the end of the experiment, the mice were fasted for 12 h, after which blood was collected via eyeball extraction and cervical dislocation to euthanize the mice. Serum, liver, kidney, BAT, inguinal white adipose tissue (iWAT), epididymal white adipose tissue (eWAT), ileum, cecal contents, colon, and other tissues and organs were harvested for further analysis.
Glucose tolerance test
-
A glucose tolerance test (GTT) was performed at week 12 of the experiment. After fasting the mice for 16 h, glucose was intraperitoneally injected at a dose of 1.5 g/kg body weight. Blood samples were collected from the second drop of the tail vein at the following time points: 0, 15, 30, 45, 60, 75, and 90 min to measure blood glucose levels. A glucose tolerance curve was plotted with time (min) on the x-axis and blood glucose values on the y-axis, and the area under the curve (AUC) was calculated.
Insulin tolerance test
-
One week after the GTT, an insulin tolerance test (ITT) was performed. Mice were fasted for 6 h, followed by intraperitoneal injection of 1 IU/kg body weight of insulin aspart (Novo Nordisk, China). Blood samples were collected from the second drop of the tail vein at the following time points: 0, 15, 30, 45, 60, and 75 min to measure blood glucose levels. An insulin tolerance curve was plotted with time (min) on the x-axis and blood glucose values on the y-axis, and the area under the curve (AUC) was calculated.
Mouse respiratory metabolism analysis
-
At week 15 of the experiment, a respiratory metabolism test was conducted on the mice. Six mice were randomly selected from each group, and their body weight was recorded. The mice were placed in a respiratory energy metabolism apparatus (Animal Respiratory Metabolism Measurement System, SE Systems GmbH, Germany) with free access to food and water. The instrument was set to maintain a constant temperature of 25 °C with a 12-h light/dark cycle, and data were collected every 10 min. The experiment lasted for 36 h, with a 12-h adaptation period followed by the measurement of oxygen consumption and carbon dioxide production over the next 24 h.
Mouse activity analysis
-
At week 15 of the experiment, a mouse activity analysis was performed. Six mice were randomly selected from each group and placed in an activity monitoring system (Animal Activity Measurement System, Columbus Instruments, USA) with free movement, feeding, and drinking. The activity level of the mice was measured every 10 s. The experiment lasted for 36 h, with a 12-h adaptation period followed by the measurement of activity data over the next 24 h.
Cold tolerance tests
-
The rectal temperature of the mice at room temperature was first measured. After removing the bedding, the mice were placed in a 4 °C environment, and the rectal temperature was measured at 1, 2, 3, 4, and 5 h after cold stimulation. After the measurements, infrared thermal images were taken using a handheld infrared thermal imaging camera (Hangzhou Microimage Software Co., Ltd, Hangzhou, China), with a focus on the temperature of the brown adipose tissue around the scapular region of the mice. The images were then analyzed using HIKMICRO analyzer software.
Lactate content measurement
-
An appropriate amount of tissue was excised, added to PBS, and homogenized using a tissue grinder. After centrifugation, the supernatant was collected for measurement. Lactate content in the tissue was determined using the L-lactate (L-LD) test kit (Nanjing Jiancheng Bioengineering Institute, Nanjing, China), following the manufacturer's instructions. The absorbance value of each well was measured using a microplate reader at a wavelength of 530 nm.
Histopathological analysis
H&E staining
-
Tissue samples from the same location were excised and fixed in 4% paraformaldehyde buffer solution. After fixation, the tissues were dehydrated with 70% ethanol, then embedded in paraffin and sectioned into thin slices for H&E (Hematoxylin and Eosin) staining. After staining, the slides were dehydrated and mounted. The samples were observed and photographed under a microscope (Nikon Eclipse E100, Nikon Corporation, Japan). For adipose tissue sections (BAT, iWAT, and eWAT), adipocyte morphology and the extent of whitening in brown adipose tissue were assessed. Liver tissue sections were examined for hepatocyte morphology, inflammatory cell infiltration, and the formation of lipid vacuoles.
Oil red O staining
-
Samples were frozen in OCT embedding medium to form blocks, and cryosections were fixed with tissue fixative. Oil Red O working solution was used for staining according to the manufacturer's instructions. After staining, the sections were differentiated with isopropanol to remove the background. Hematoxylin counterstaining was then performed, followed by washing with tap water and mounting with glycerol gelatin. The samples were observed and photographed under a microscope. Liver sections were analyzed for the distribution and accumulation of red lipid droplets to assess hepatic lipid deposition. Tissue embedding, sectioning, and staining were outsourced to Beijing Laike Biotechnology Co., Ltd (Beijing, China).
Serum biochemical parameters
-
Collected arterial blood samples from mice were allowed to stand at room temperature for 1 h, and then centrifuged at 3,000 rpm for 15 min to separate the serum. The obtained serum was used for biochemical analysis. Four parameters—triglycerides (TG), total cholesterol (TC), low-density lipoprotein cholesterol (LDL-C), and high-density lipoprotein cholesterol (HDL-C)—were assayed using kits from Nanjing Jiancheng Bioengineering Institute (Nanjing, China), strictly following the manufacturer's instructions.
RT-qPCR
-
Total RNA was extracted from tissue cells using the Total RNA Extraction Reagent (Nanjing Vazyme Biotechnology Co., Ltd, Nanjing, China). The RNA concentration and purity were determined by measuring the absorbance at 260 nm and 280 nm using a microplate reader. cDNA was synthesized via reverse transcription using the M5 Super Plus qPCR RT Kit with gDNA Remover (Beijing Mei5 Biotechnology Co., Ltd, Beijing, China) according to the manufacturer's instructions. Real-time quantitative PCR (qPCR) was performed using the Taq Pro Universal SYBR qPCR Master Mix (Beijing Mei5 Biotechnology Co., Ltd, Beijing, China). A 10 μL reaction mixture was used for the qPCR, and reactions were run on a LightCycler 480 (Roche) instrument. The reaction program was as follows: 95 °C for 10 min, followed by 40 cycles of 95 °C for 15 s, and 60 °C for 1 min. Primer sequences were synthesized by Bioengineering Co., Ltd. (Shanghai, China) and are listed in Supplementary Table S1. Gene expression levels were normalized to the internal reference gene β-actin and calculated using the 2−ΔΔCᴛ method. Briefly, the difference in threshold cycle (CT) values between the target gene and β-actin (ΔCT) was determined, followed by calculation of the ΔCT difference between the experimental and control groups (ΔΔCT). Relative expression of each target gene was expressed as 2−ΔΔCᴛ.
Western blotting
-
An appropriate amount of BAT tissue was excised and added to RIPA lysis buffer (Shanghai Beyotime Institute of Biotechnology, Shanghai, China) containing a protease inhibitor (Shanghai Beyotime Institute of Biotechnology, Shanghai, China). The tissue was homogenized using a tissue grinder, followed by centrifugation to collect the supernatant as the protein lysate. Protein concentration was measured using the BCA Protein Assay Kit (Shanghai Beyotime Institute of Biotechnology, Shanghai, China), according to the manufacturer's instructions. An appropriate volume of loading buffer (Shanghai Beyotime Institute of Biotechnology, Shanghai, China) was added to the sample, and the mixture was boiled at 95 °C for 10 min. Approximately 10 μg of protein was loaded onto a 10% PAGE gel for separation, followed by transfer to a PVDF membrane. After washing the membrane three times with buffer, it was incubated with blocking solution at room temperature for 1 h. The membrane was then incubated overnight at 4 °C with the primary antibody solution targeting the protein of interest. After washing the membrane three times with buffer, it was incubated at room temperature for 1 h with the corresponding secondary antibody solution. After incubation, the secondary antibody was washed off, and the protein bands were exposed and analyzed using ECL reagent (Shanghai Beyotime Institute of Biotechnology, Shanghai, China) in a chemiluminescence imager. Images were captured using the ChemiDoc imaging system.
Image analysis was performed using ImageJ software. The images were converted to 8-bit grayscale mode, and the background was manually subtracted. The integrated optical density (IOD) value was calculated. The relative expression of the target protein was normalized to the internal control (Tubulin/HSP90), and the relative ratio was expressed as the target protein IOD value/internal control IOD value.
Data analysis
-
Data were analyzed using GraphPad Prism 10.0. All data are presented as the mean ± standard error of the mean (SEM). For inter-group comparisons, one-way analysis of variance (ANOVA) is first conducted. If the ANOVA results are significant, Tukey's post hoc test is then performed for pairwise comparisons between multiple groups. A p-value of less than 0.05 was considered statistically significant. Graphs were generated using GraphPad Prism 10.0 software.
-
In this study, we gavaged high-fat diet-induced obese mice with equivalent molar doses of lactic acid and sodium lactate daily (Fig. 1a) to evaluate the effects of lactic acid and its sodium salt on alleviating obesity. Compared to the high-fat model group, lactic acid treatment significantly reduced the degree of obesity in the mice (Fig. 1b), and the weight of the iWAT and liver were also significantly decreased (Fig. 1c). The food intake of the lactic acid and sodium lactate groups was relatively lower than that of the model group (Fig. 1d), but the body weight of the sodium lactate group did not decrease. This suggests that lactate anion intake might suppress appetite, but it is not the key factor in the weight reduction observed with lactic acid gavage.
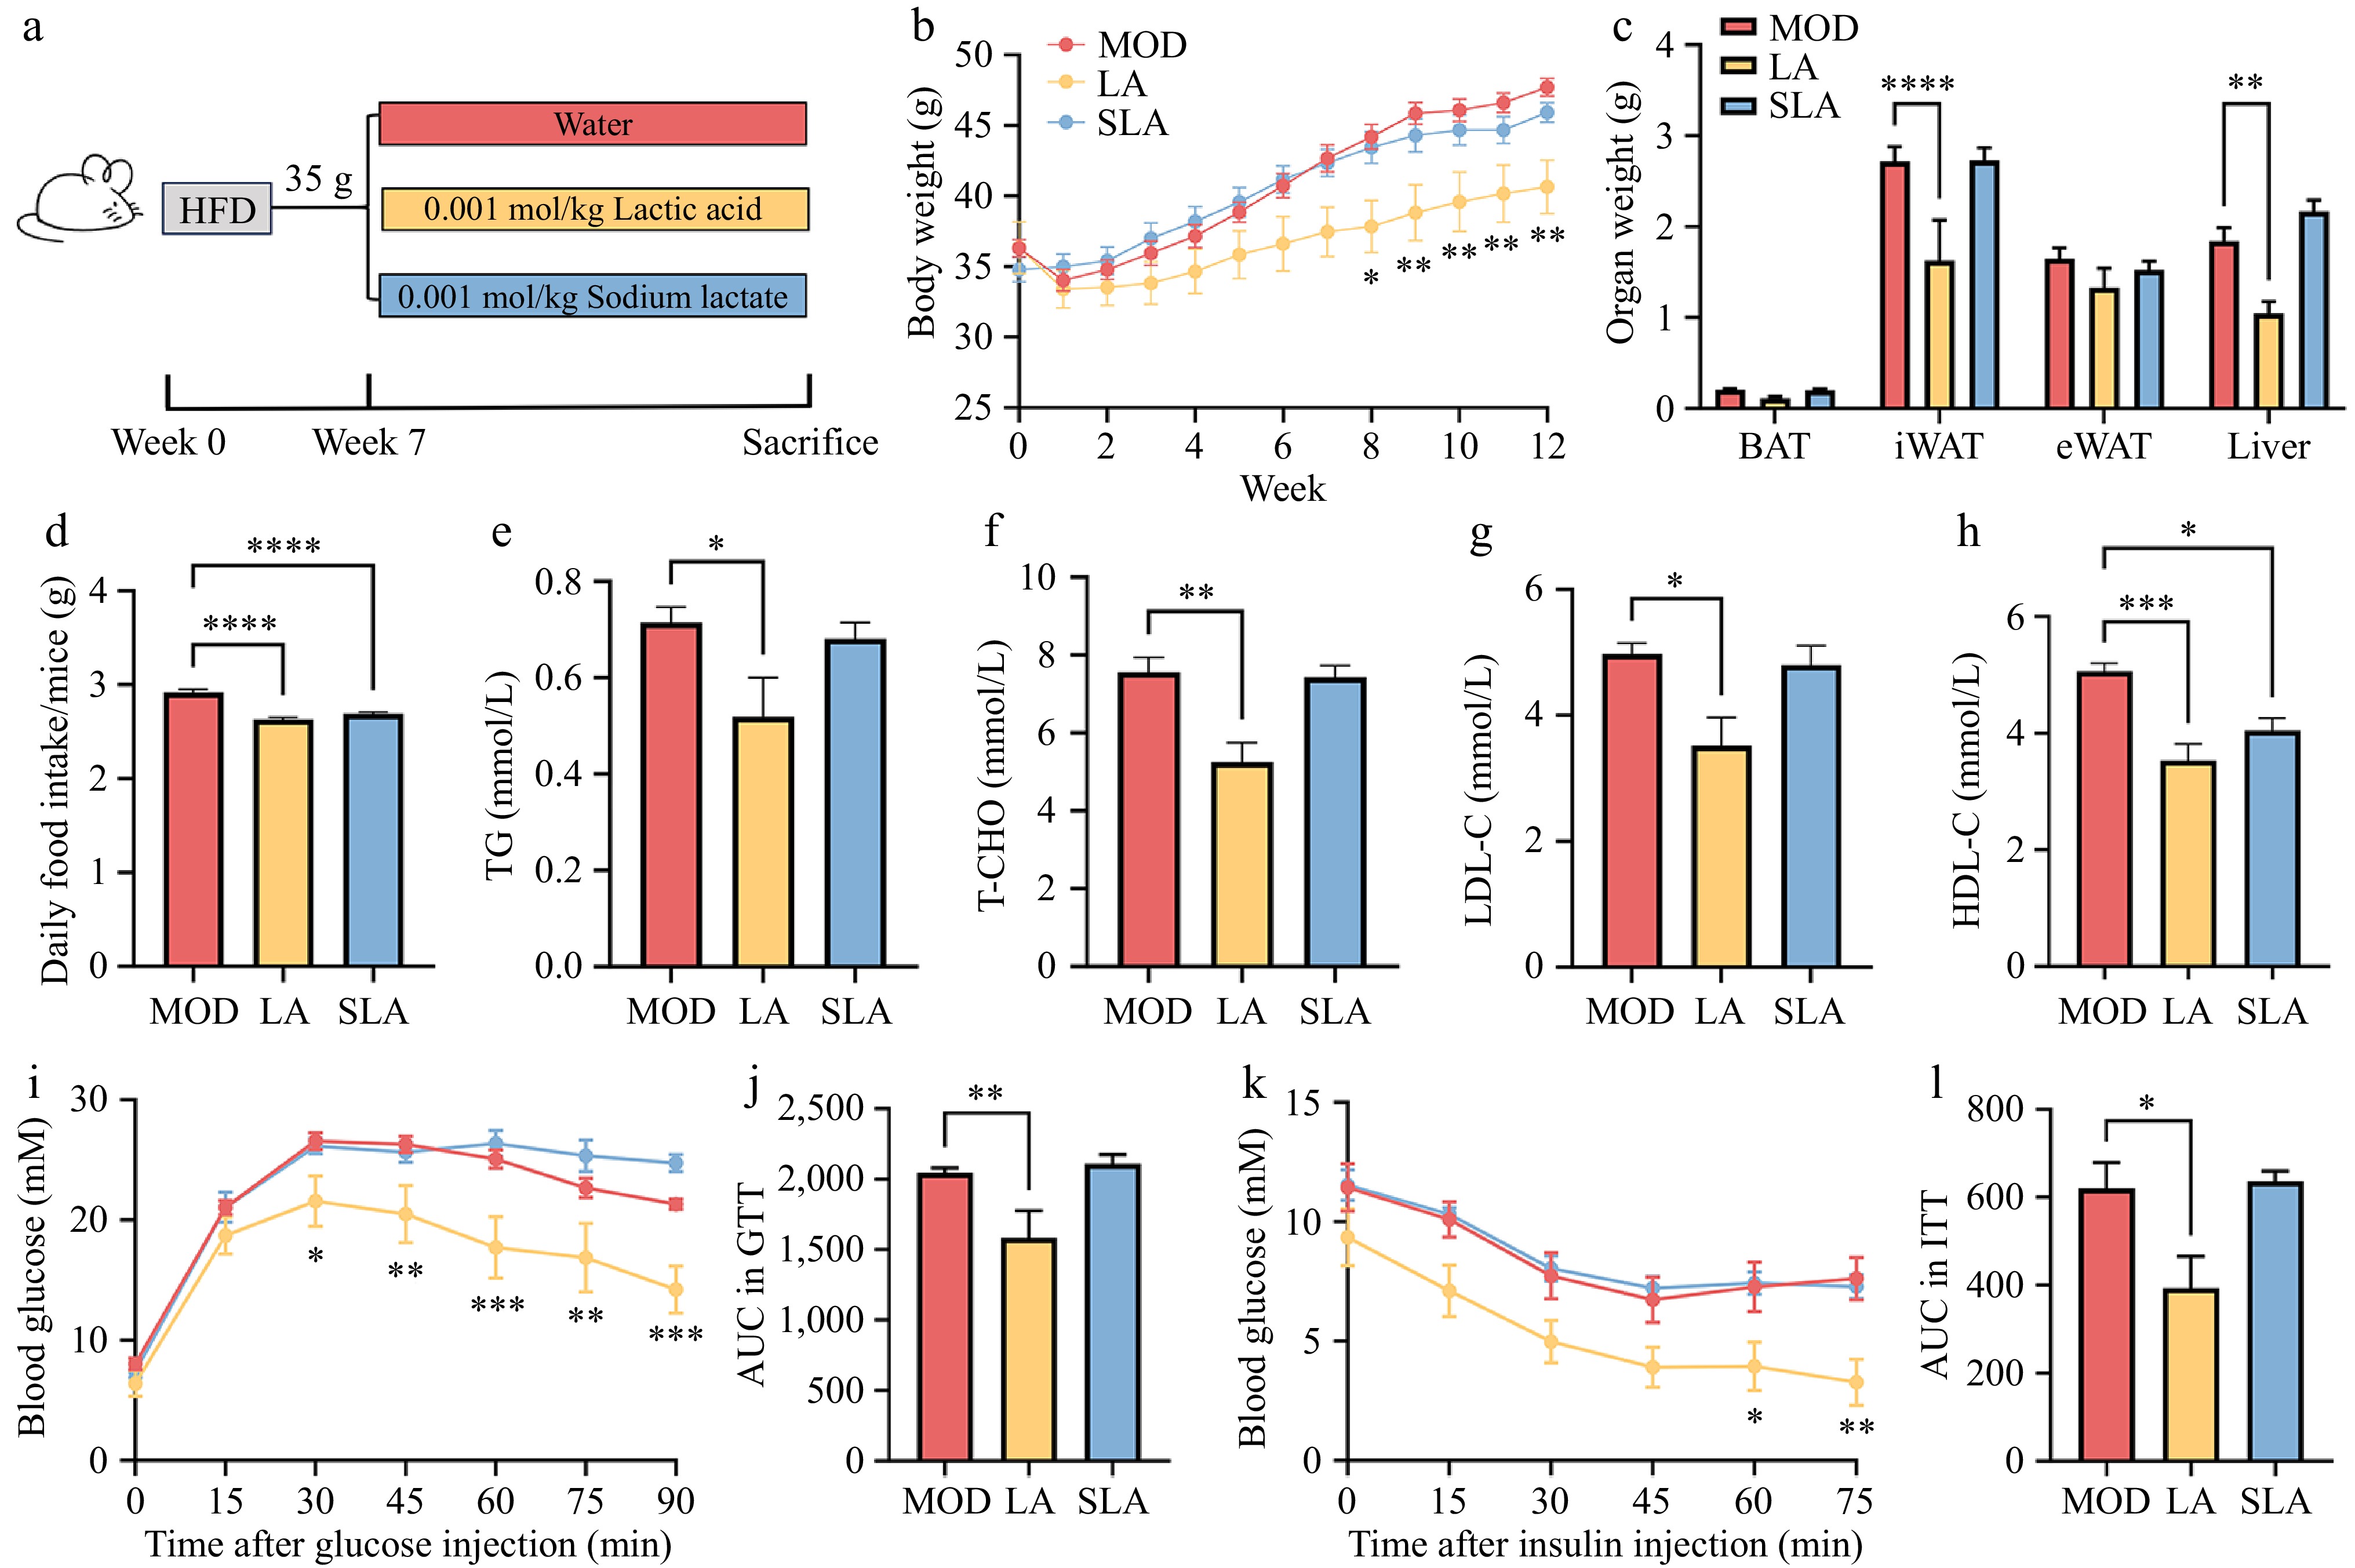
Figure 1.
Lactic acid treatment alleviates obesity in mice. Male WT mice were fed from 6 to 30 weeks of age [(b), n = 7, (c)–(l), n = 6]. (a) Schematic diagram of mouse treatment. (b) Body weight changes. (c) Tissue weight of BAT, iWAT, eWAT, and liver. (d) Food intake. (e) Serum levels of triglycerides, (f) total cholesterol, (g) low-density lipoprotein cholesterol, and (h) high-density lipoprotein cholesterol. (i) Glucose tolerance test curve, and (j) area under the curve (AUC). (k) Insulin tolerance test curve, and (l) area under the curve (AUC). Data are presented as mean ± SEM. * p < 0.05, ** p < 0.01, *** p < 0.001, and **** p < 0.0001 compared to control. Statistical analysis was performed using one-way ANOVA followed by Tukey's post hoc test.
Regarding serum parameters, lactic acid treatment significantly reduced the levels of TG, T-CHO, and LDL-C in the serum (Fig. 1e–g). However, HDL-C levels, which are responsible for cholesterol transport, were also significantly decreased (Fig. 1h). This could be due to the absence of the MiR-33b gene in the mice, as high-fat diet-induced obesity slightly increases HDL-C levels in these mice[22]. Additionally, compared to the high-fat model group, lactic acid-treated mice exhibited stronger glucose tolerance (Fig. 1i, j). Similarly, lactic acid improved insulin tolerance in the mice (Fig. 1k, l). Therefore, lactic acid treatment alleviated a range of obesity-related phenotypes induced by a high-fat diet, while sodium lactate, as a neutral salt of lactate, did not show a significant effect on fat reduction.
Lactic acid treatment enhances metabolism and thermogenesis in mice
-
Next, we investigated the specific mechanisms by which lactic acid gavage alleviates obesity in mice, focusing on thermogenesis and metabolism. We found that both lactic acid and sodium lactate gavage alleviated the drop in body temperature in mice under cold stimulation (Fig. 2a, b), and enhanced the thermogenic capacity of BAT in the scapular region (Fig. 2c). Moreover, compared to high-fat diet mice, lactic acid-treated mice showed higher oxygen and carbon dioxide consumption during both the day and night at room temperature (Fig. 2d, f, h, and i), while sodium lactate treatment had no significant effect on the respiratory metabolism of the mice (Fig. 2e, g, h, and i). Additionally, there were no significant differences in the respiratory exchange ratio (RER) or physical activity between the different treatment groups (Fig. 2j, k). These results suggest that lactic acid can promote metabolism and thermogenesis by activating brown adipose tissue, thereby alleviating obesity, while sodium lactate-treated mice only exhibited a mild enhancement in thermogenesis.
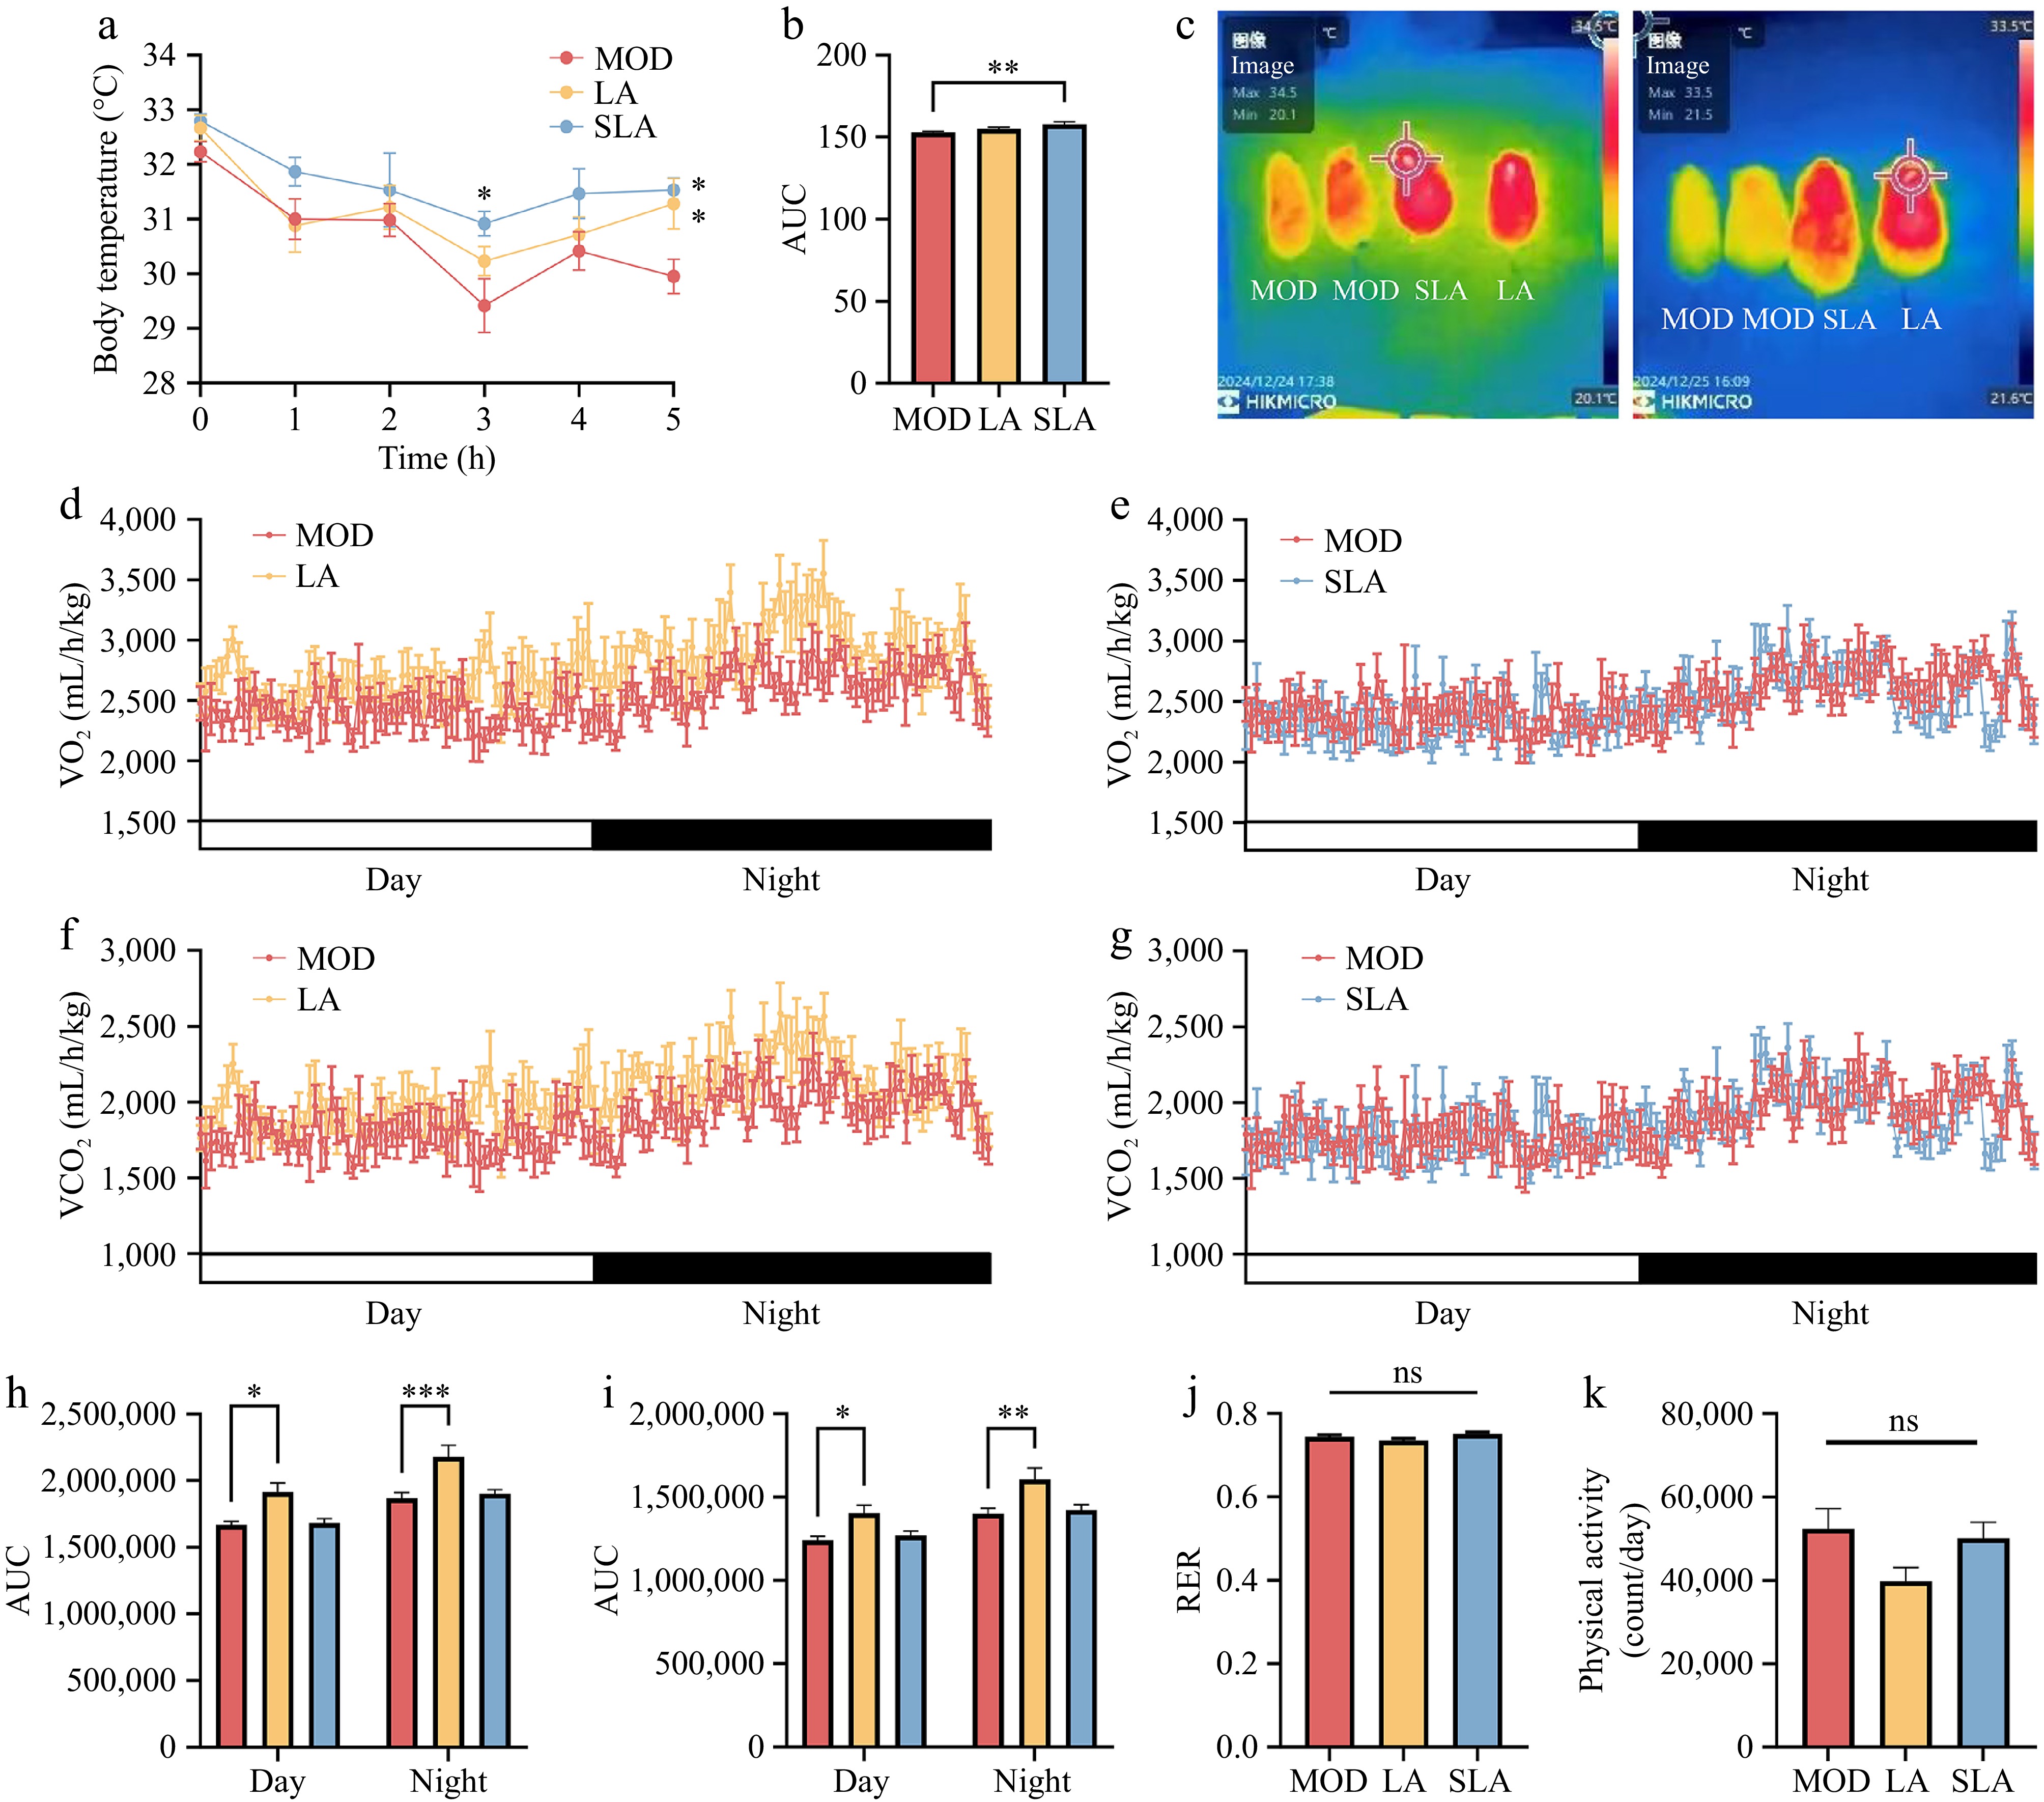
Figure 2.
Lactic acid treatment enhances metabolism and thermogenesis in mice (n = 6 for all animal experiments). (a) Changes in colonic temperature of mice at 4 °C, and (b) the area under the curve (AUC). (c) Infrared thermographic images of the back of mice after 5 h of 4 °C treatment. Oxygen consumption over 24 h in (d) lactic acid-treated mice, and (e) sodium lactate-treated mice. Carbon dioxide consumption over 24 h in (f) lactic acid-treated mice, and (g) sodium lactate-treated mice. AUC for (h) oxygen consumption, and (i) carbon dioxide consumption over 24 h. (j) Respiratory exchange ratio (RER) of mice. (k) Physical activity of mice. Data are presented as mean ± SEM. * p < 0.05, ** p < 0.01, *** p < 0.001, and **** p < 0.0001 compared to control. Statistical analysis was performed using one-way ANOVA followed by Tukey's post hoc test.
Lactic acid treatment improves metabolic dysregulation in adipose tissue of high-fat diet mice
-
Analysis of tissue section images revealed that in adipose tissue, lactic acid treatment improved the whitening of BAT and reduced the increase in cell size in both iWAT and eWAT caused by a high-fat diet (Fig. 3a). Although sodium lactate treatment also had some effect on adipose tissue, it was less pronounced than lactic acid treatment (Fig. 3a). Measurement of the expression levels of lipid metabolism-related genes in adipose tissue showed that lactic acid treatment significantly upregulated the expression of adipose triglyceride lipase (Atgl) in both white adipose tissues (iWAT and eWAT) (Fig. 3b, c), and increased the expression of peroxisome proliferator-activated receptorα (Pparα) in iWAT (Fig. 3b). In contrast, sodium lactate treatment did not significantly affect the expression of lipid metabolism genes in white adipose tissue (Fig. 3b, c). In BAT, lactic acid treatment significantly upregulated the expression of carnitine palmitoyl transferase 1A (Cpt1A), medium-chain acyl-CoA dehydrogenase (Mcad), and Atgl, while sodium lactate treatment also increased the expression of Cpt1A and Mcad (Fig. 3d). At the protein level, compared to the model group, the expression of CPT1A, a key enzyme in β-oxidation in brown adipose tissue, was significantly increased in the lactic acid-treated group, whereas no significant changes were observed in the sodium lactate-treated group (Fig. 3e, f; Supplementary Fig. S1). These findings suggest that dietary lactic acid can significantly improve the metabolic dysregulation of adipose tissue in obese mice by promoting the expression of lipid metabolism-related genes and proteins. However, sodium lactate had a less pronounced effect on lipid metabolism compared to lactic acid, which corresponds to the differences observed in the body weight and respiratory metabolism levels between the two treatments, as mentioned earlier.
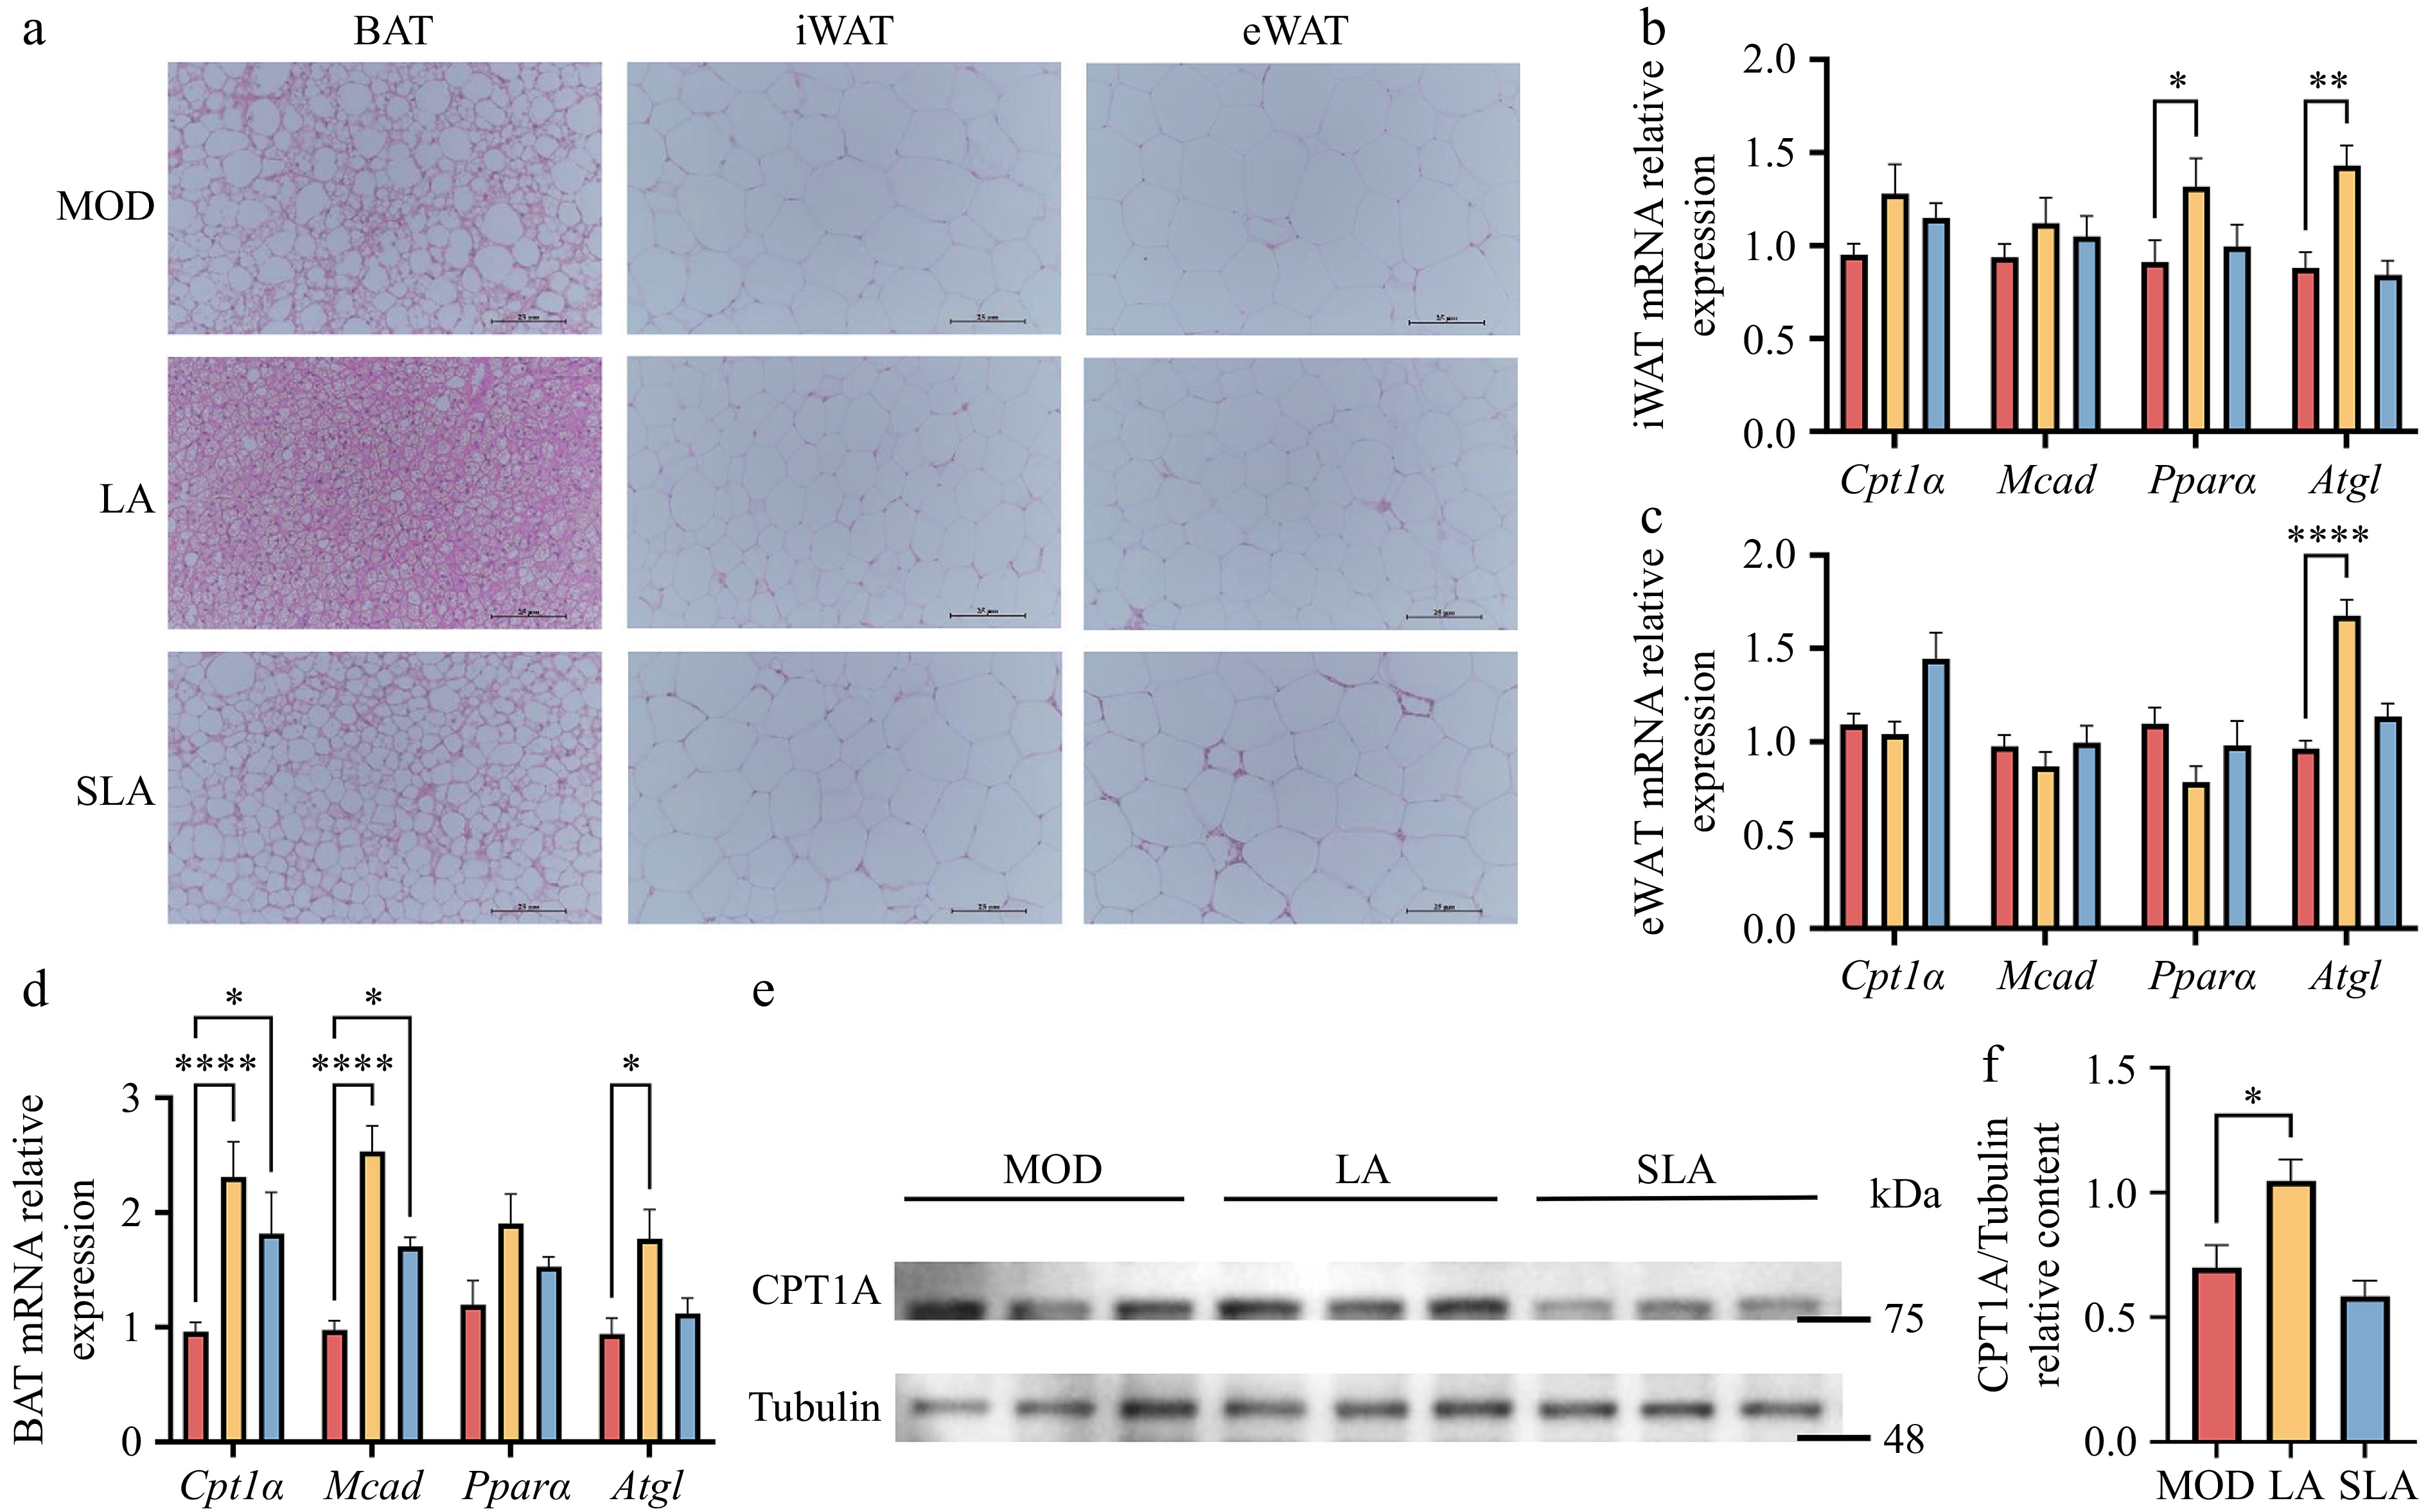
Figure 3.
Lactic acid treatment improves metabolic dysregulation in adipose tissue of high-fat diet mice [(b)–(d), n = 5; (e), (f), n = 3). (a) Representative H&E staining images of BAT, iWAT, and eWAT from mice in Fig. 1. Scale bar: 25 μm. Expression of lipid metabolism-related genes in (b) iWAT, (c) eWAT, and (d) BAT. (e) CPT1A protein expression in BAT. (f) Quantification of Cpt1A protein levels. Data are presented as mean ± SEM. * p < 0.05, ** p < 0.01, *** p < 0.001, and **** p < 0.0001 compared to control. Statistical analysis was performed using one-way ANOVA followed by Tukey's post hoc test.
Lactic acid treatment improves liver dysfunction in high-fat diet-induced obese mice
-
The liver is one of the key organs involved in fat metabolism in the body. Histological analysis (HE staining) revealed that lactic acid treatment significantly reduced hepatocyte size and liver adipocyte size. Oil Red O staining also showed a marked decrease in liver fat deposition (Fig. 4a). Furthermore, although the effect was not as significant as lactic acid, sodium lactate also had a certain effect on reducing liver fat deposition (Fig. 4a). Further analysis of related gene expression revealed that lactic acid treatment significantly reduced the expression of monocyte chemoattractant protein-1 (Mcp-1), thereby alleviating the increased liver inflammation caused by obesity (Fig. 4b). Additionally, the expression levels of genes involved in lipid uptake, transport, and storage in the liver, such as cluster of differentiation 36 (Cd36) and fatty acid binding protein 4 (Fabp4), were significantly reduced following lactic acid treatment (Fig. 4c). Sodium lactate also suppressed liver fat production by inhibiting peroxisome proliferator-activated receptor γ (Pparγ) (Fig. 4c). Therefore, dietary lactic acid can improve liver metabolic disorders caused by obesity by inhibiting liver inflammation and lipid storage. Sodium lactate, to a certain extent, can also reduce hepatic lipid production through different mechanisms.
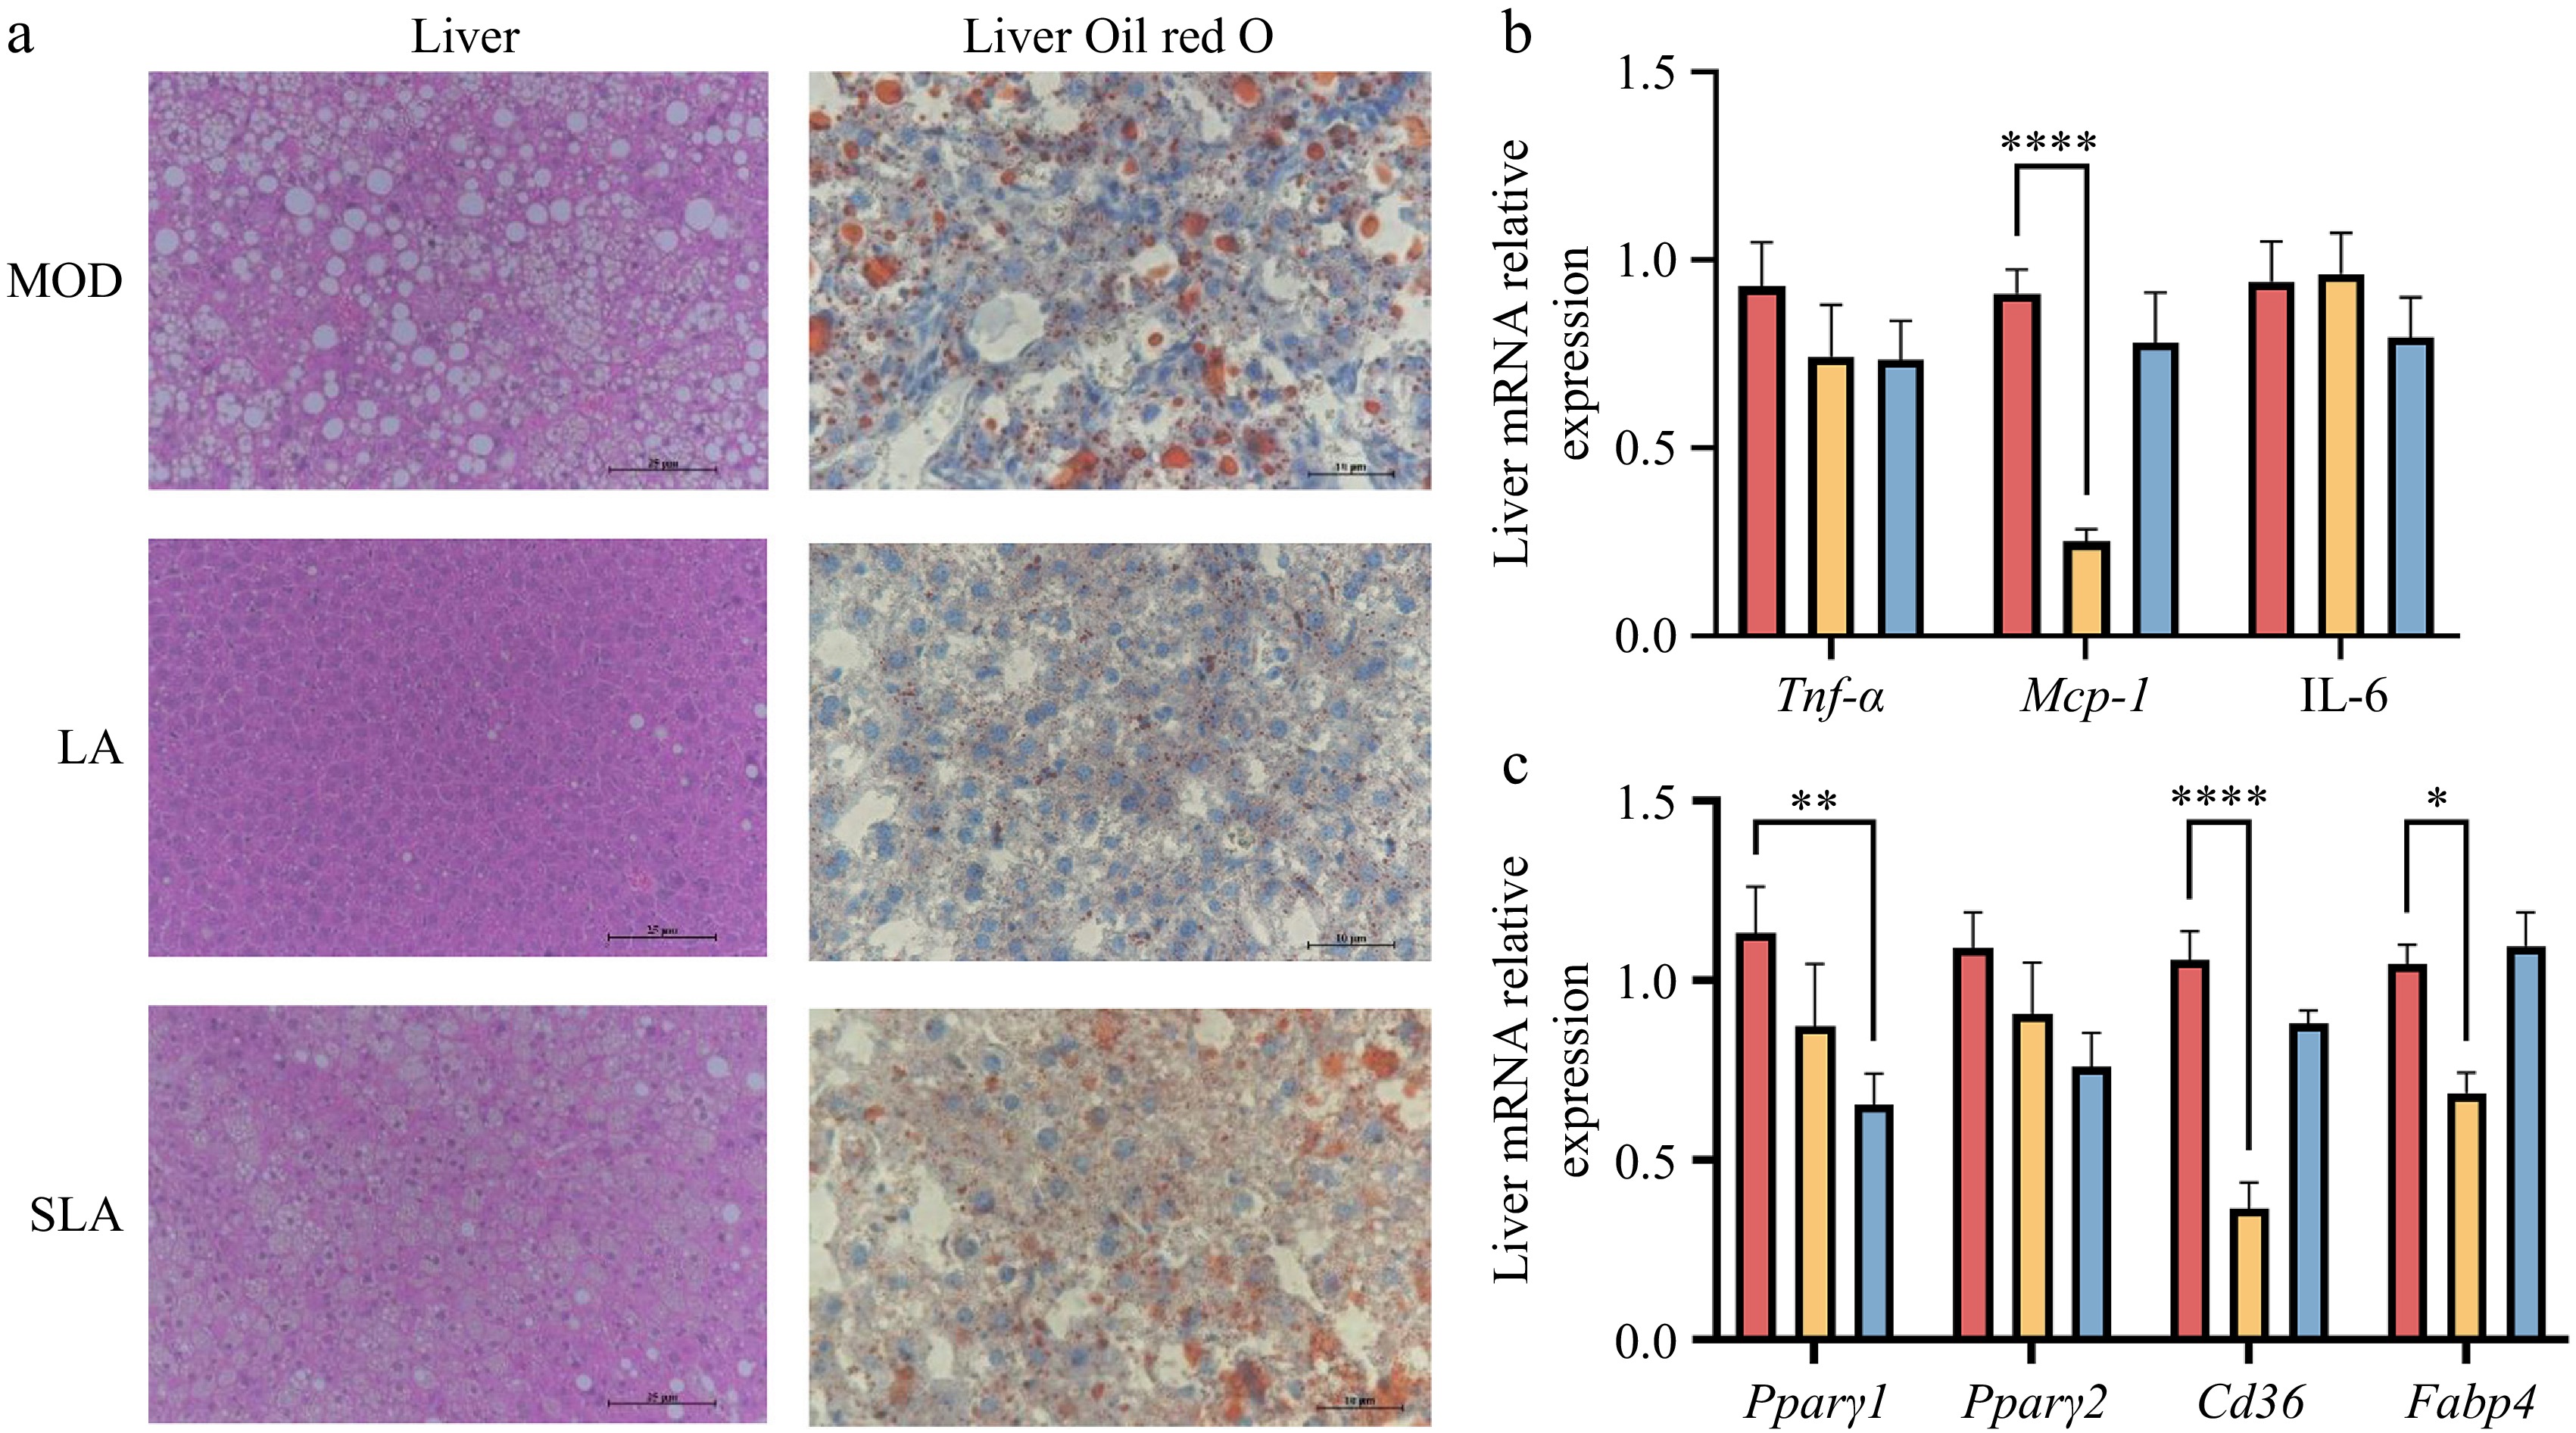
Figure 4.
Lactic acid treatment improves liver dysfunction in high-fat diet-induced obese mice [(b), (c), n = 5). (a) Representative H&E and Oil Red O staining images of liver from mice in Fig. 1. H&E scale bar: 25 μm, Oil red O scale bar: 10 μm. Expression of (b) inflammation, and (c) lipid storage related genes in the liver. Data are presented as mean ± SEM. * p < 0.05, ** p < 0.01, *** p < 0.001, and **** p < 0.0001 compared to control. Statistical analysis was performed using one-way ANOVA followed by Tukey's post hoc test.
Lactic acid treatment increases lactate levels in tissues and organs
-
Lactate is one of the high-throughput circulating metabolites in the body, and the body maintains lactate homeostasis through metabolic regulation. We measured the lactate levels in serum and tissue organs and found that long-term intake of lactic acid and sodium lactate did not change the serum lactate levels (Fig. 5a), but it significantly increased the lactate content in the BAT, iWAT, and liver compared to the model group (Fig. 5b, c, and e). Long-term intake of sodium lactate also increased the lactate content in eWAT (Fig. 5d). These results suggest that the gavage-administered lactic acid and sodium lactate can enter the circulation through digestion and absorption.
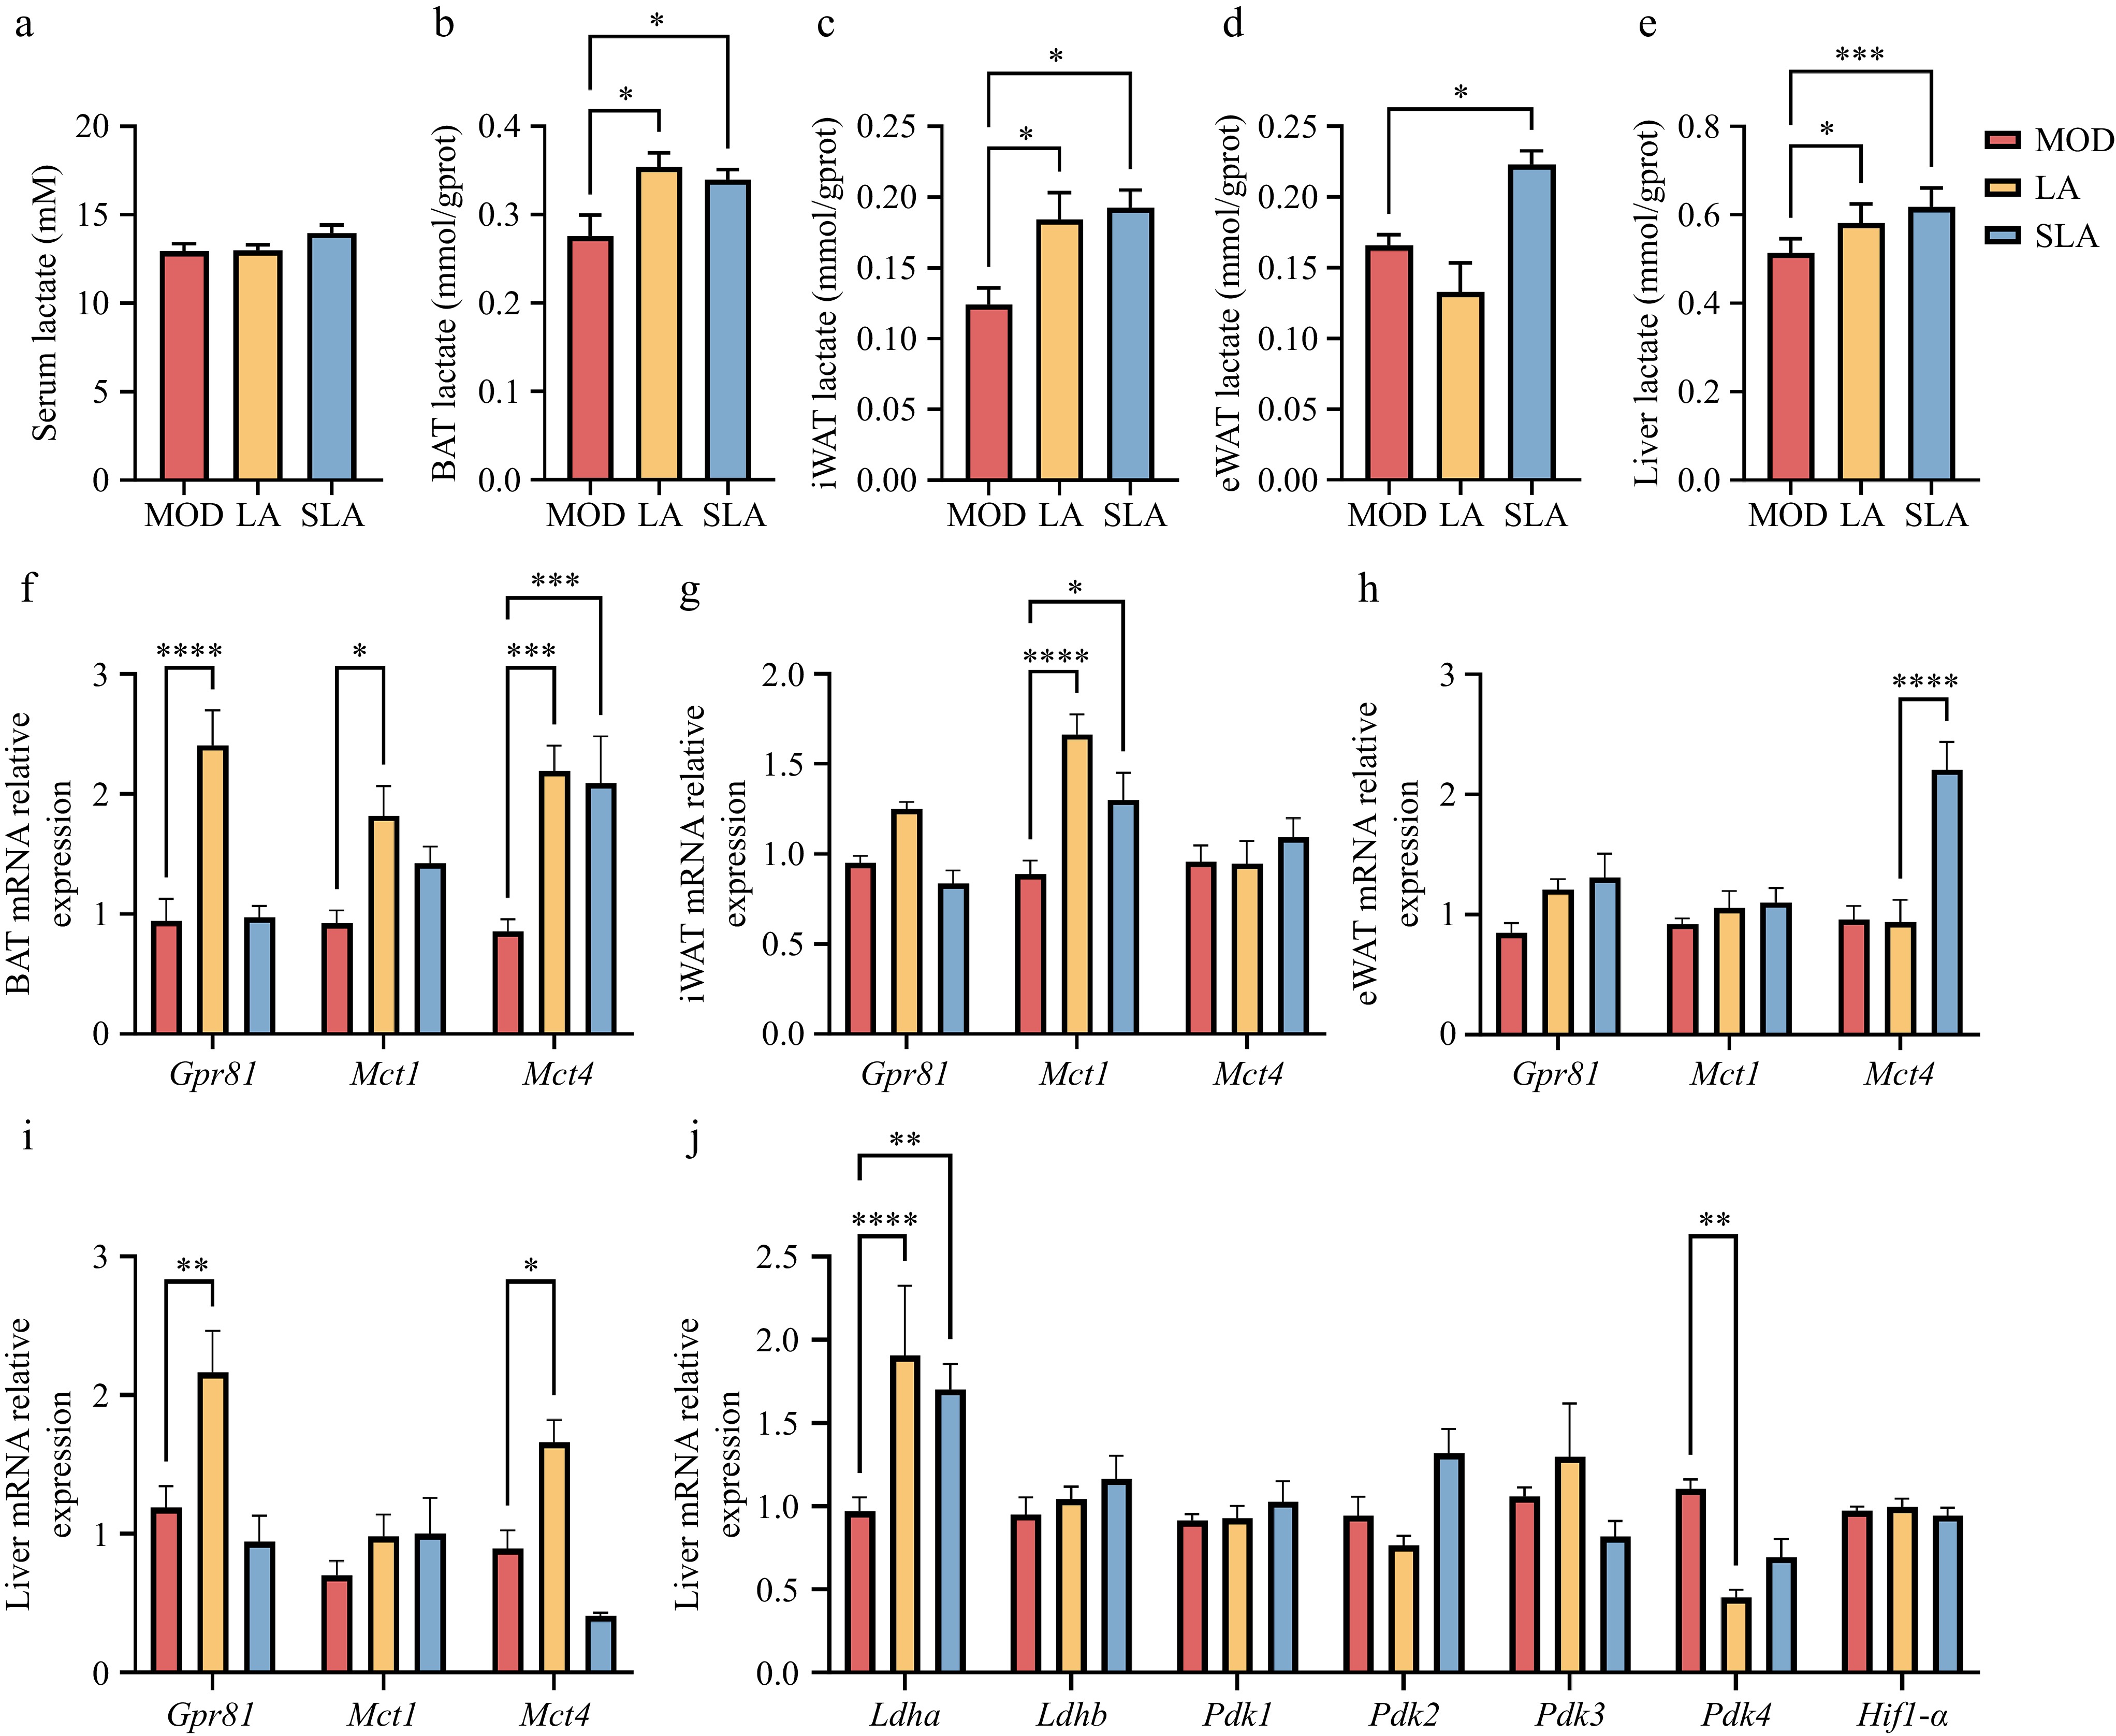
Figure 5.
Lactic acid treatment increases lactate levels in tissues and organs. [(a)–(e), n = 6; (f)–(j), n = 5]. Lactate levels in (a) serum, (b) BAT, (c) iWAT, (d) eWAT, and (e) liver of lactate-treated mice. Expression of lactate-related genes in (f) BAT, (g) iWAT, (h) eWAT, and (i), (j) liver. Data are presented as mean ± SEM. *p < 0.05, ** p < 0.01, *** p < 0.001, and **** p < 0.0001 compared to control. Statistical analysis was performed using one-way ANOVA followed by Tukey's post hoc test.
Measurement of lactate transporter-related gene expression revealed that in BAT, both lactic acid and sodium lactate treatments increased the expression of Mct4 compared to the model group, while Mct1 expression only increased under lactic acid treatment (Fig. 5f). In iWAT, both lactic acid and sodium lactate treatments increased Mct1 expression (Fig. 5g). In eWAT, only sodium lactate increased Mct4 expression (Fig. 5h), which corresponds with the increase in lactate levels in adipose tissue. In the liver, only the expression of Mct4 was significantly increased after lactic acid treatment (Fig. 5i), while lactate levels in the liver were noticeably higher after both lactic acid and sodium lactate treatments. Given that the liver is the primary organ regulating lactate homeostasis in the body, we further measured the expression of genes related to lactate production and consumption in the liver. We found that the activity of lactate dehydrogenase A (Ldha), which is associated with lactate production, was significantly increased after lactic acid and sodium lactate treatments, while the activity of lactate dehydrogenase B (Ldhb), which catalyzes the conversion of lactate to pyruvate, did not change significantly (Fig. 5j). Interestingly, the activity of pyruvate dehydrogenase kinase 4 (Pdk4), which inhibits lactate entry into the tricarboxylic acid cycle (TCA) cycle, was significantly reduced after lactic acid treatment (Fig. 5j), suggesting that under increased exogenous lactic acid conditions, the liver accelerates the internal lactate metabolic cycle.
Moreover, compared to the model group, lactic acid treatment increased the expression of the lactate-specific receptor Gpr81 in both BAT and liver (Fig. 5f, i). It is known that lactate can reduce liver inflammation through activation of GPR81, and thus lactate may alleviate liver inflammation (Fig. 4b) by increasing the expression of Gpr81, thereby inhibiting liver lipid accumulation. The above findings indicate that exogenous lactic acid and sodium lactate treatments can increase tissue lactate levels by promoting lactate transport and synthesis, and can also influence tissue metabolism by activating downstream signaling pathways through lactate receptor activation.
Lactic acid treatment activates GPR81 to promote thermogenesis
-
Previous studies have shown that dietary lactic acid can enhance thermogenesis and metabolic capacity in obese mice. Therefore, we assessed the expression of thermogenesis-related genes in adipose tissue and found that lactic acid treatment significantly increased the expression of Ucp1, proliferator-activated receptor gamma co-activator 1β (Pgc1β), cell death-inducing DNA fragmentation factor alpha-like effector A (Cidea), and creatine kinase B (Ckb) genes in BAT. Sodium lactate treatment also significantly increased Ucp1 expression in BAT (Fig. 6a). In iWAT, lactic acid treatment significantly increased the gene expression of Ucp1 and Ckb, while sodium lactate treatment significantly decreased the expression of Ucp1 and Cidea (Fig. 6b). In eWAT, lactic acid treatment increased Ckb expression but did not significantly affect Ucp1 expression (Fig. 6c). These findings suggest that lactic acid can promote thermogenesis in different adipose tissues, but the mechanisms may differ.
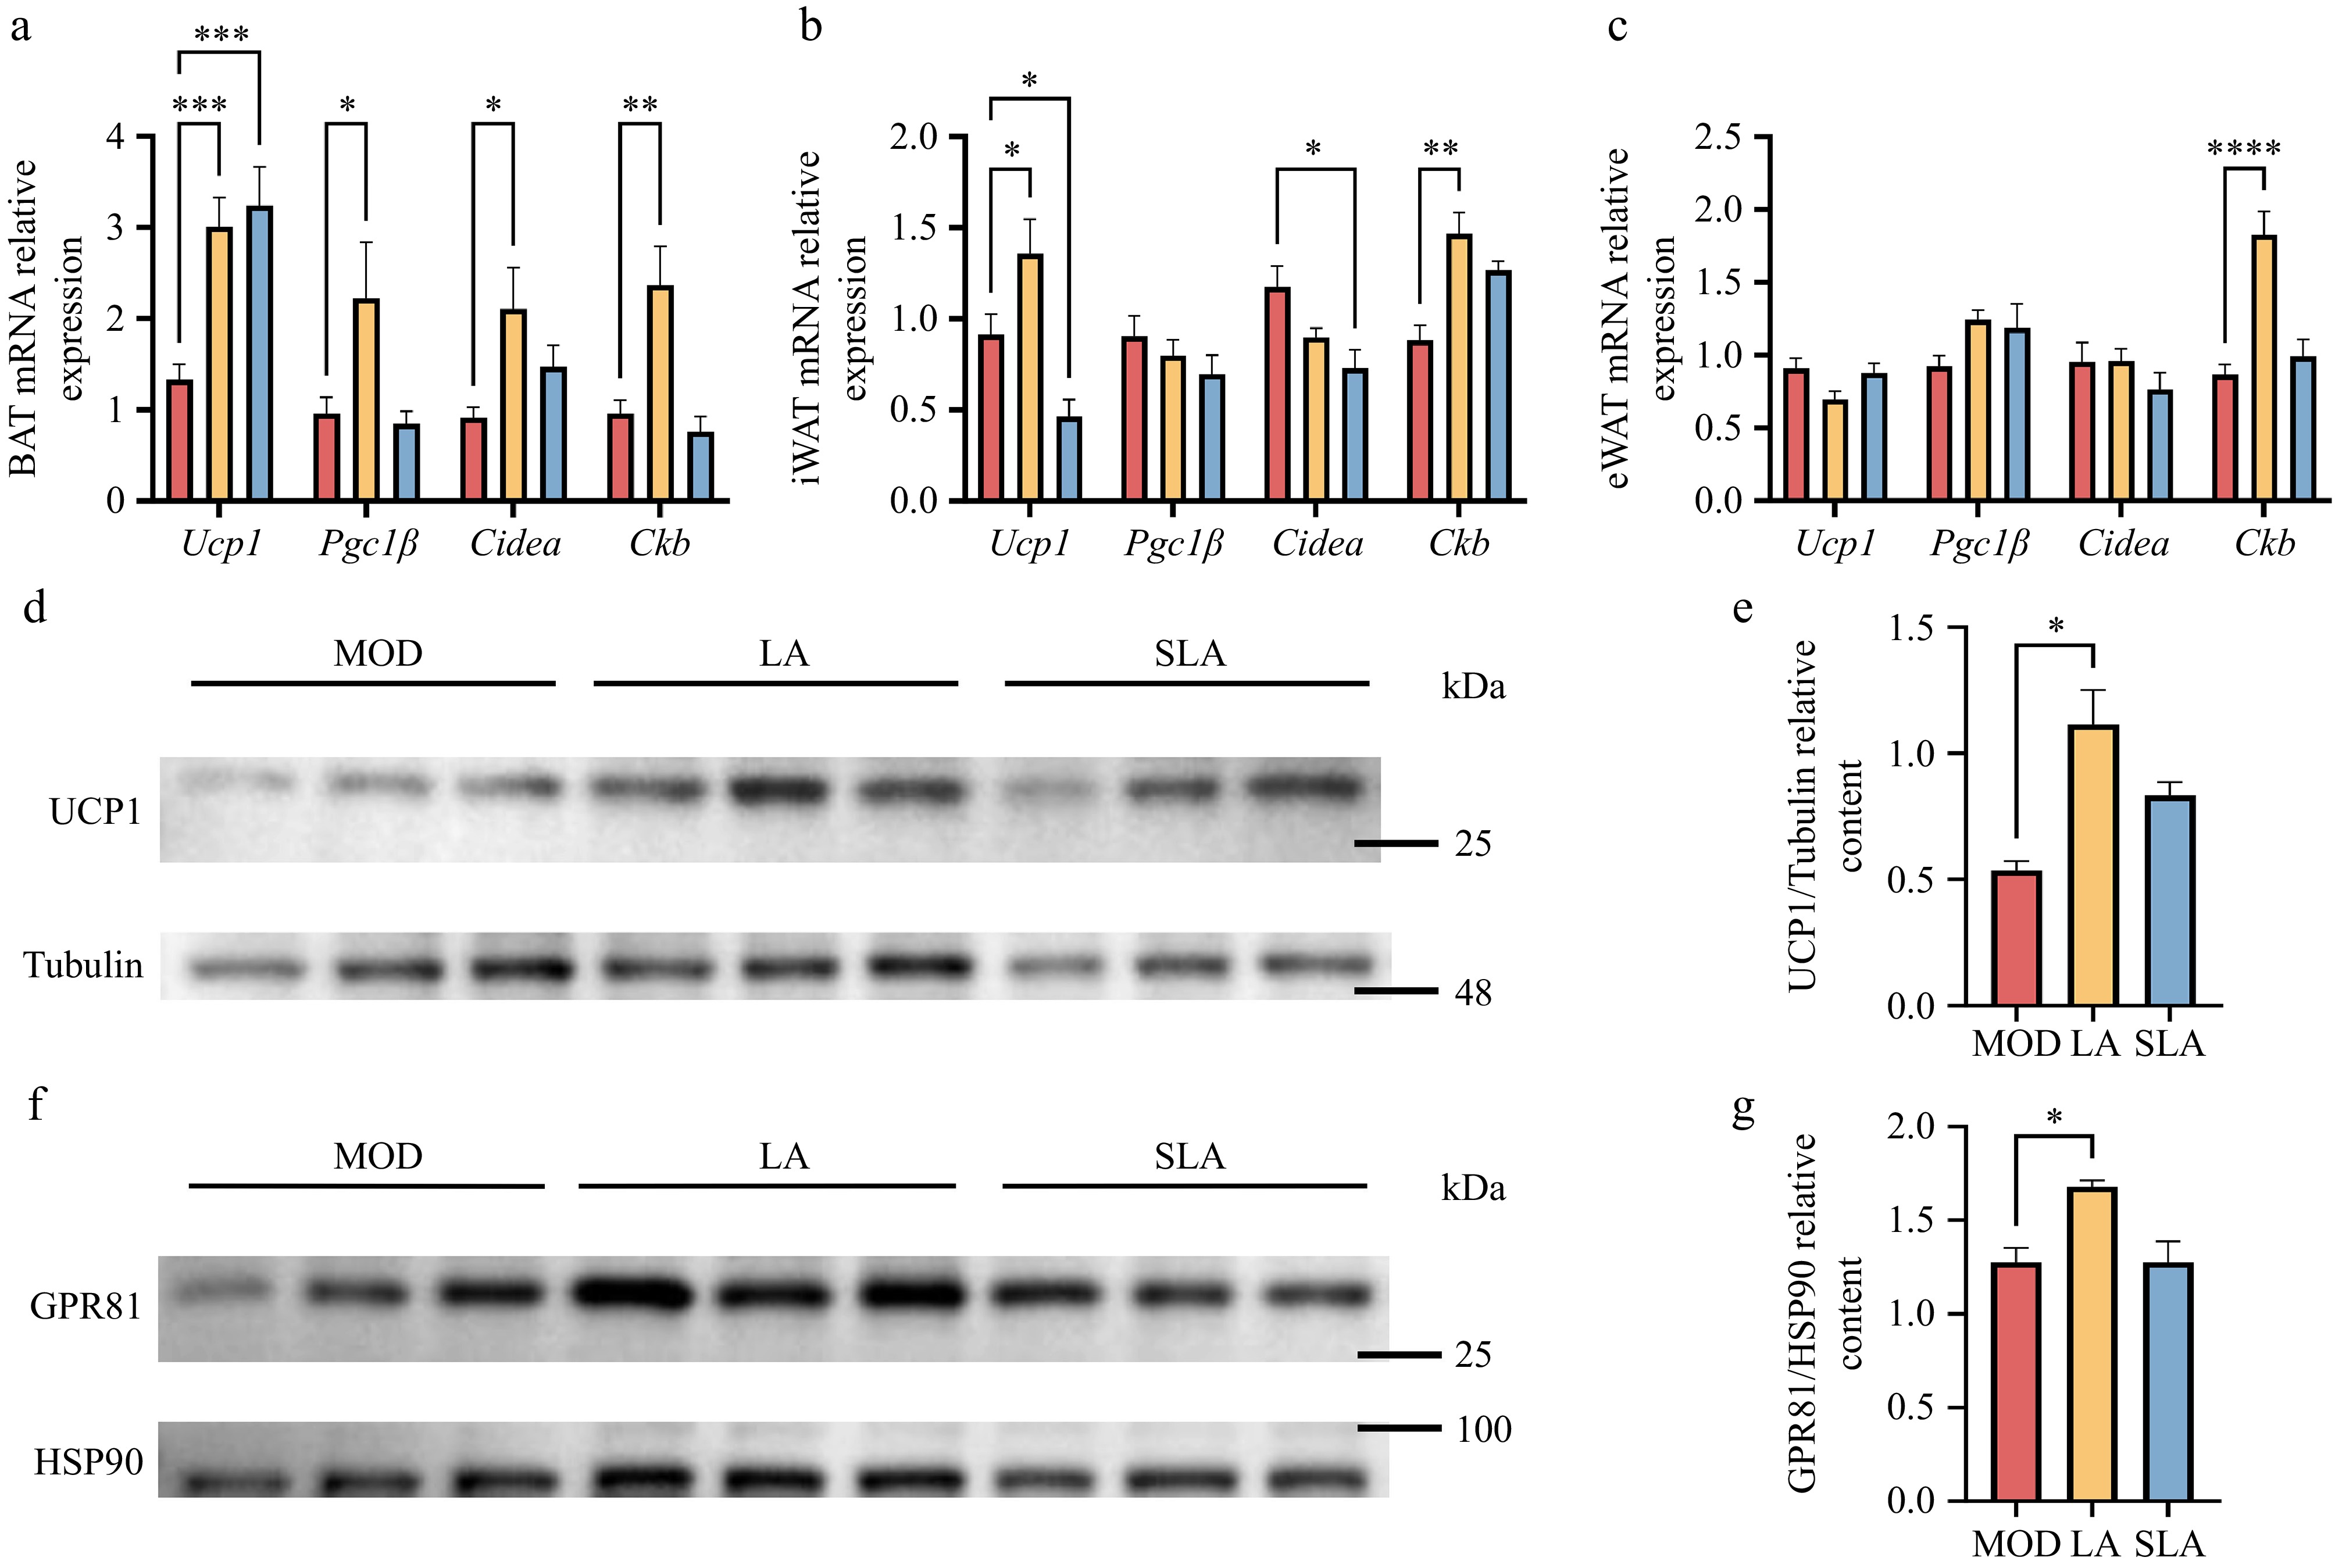
Figure 6.
Lactic acid treatment activates GPR81 to promote thermogenesis [(a)–(c), n = 5; (d)–(g), n = 3]. Expression of thermogenesis-related genes in (a) BAT, (b) iWAT, and (c) eWAT. Protein expression of (d) UCP1, (f) GPR81 in BAT, and quantification of (e) UCP1 and (g) GPR81 protein levels. Data are presented as mean ± SEM. * p < 0.05, ** p < 0.01, *** p < 0.001, and **** p < 0.0001 compared to control. Statistical analysis was performed using one-way ANOVA followed by Tukey's post hoc test.
To explore whether lactate increases UCP1 expression by activating GPR81, we measured the protein levels of GPR81 and UCP1 in BAT, where both genes were significantly upregulated after lactic acid treatment. Compared to the control group, the protein levels of GPR81 and UCP1 in BAT were significantly increased (Fig. 6d–g; Supplementary Figs S2, S3). These results suggest that lactic acid treatment promotes adipose tissue browning through two parallel pathways, involving UCP1 and CKB. Moreover, In the primary thermogenic organ, BAT, consistent with previous studies, lactic acid treatment can promote UCP1 expression by activating GPR81. In contrast, sodium lactate treatment had no significant effect on this thermogenic pathway.
-
Firstly, our study demonstrates that exogenous lactic acid intervention not only reduces body weight in mice but also significantly improves their glucose metabolism and enhances insulin sensitivity. This effect may be related to lactate increasing the internal lactate levels and activating the expression of lactate transporters Mct1 and Mct4, as well as the lactate receptor GPR81. Through these pathways, lactate promotes energy expenditure and thermogenesis in adipose tissue, thereby alleviating obesity and associated metabolic abnormalities. This mechanism aligns with previous research on lactate's involvement in metabolic regulation, confirming that lactate not only acts as an energy substrate but also exerts its effects on fat metabolism and energy balance through its signaling functions.
In this study, equimolar doses of sodium lactate were included as a control to systematically compare, for the first time, the anti-obesity effects of lactate in its weak acid form vs its salt form. This experimental design differs from most previous studies, which primarily used lactate salts, and helps clarify the unique role of the lactic acid molecule itself, rather than merely the lactate anion, in metabolic regulation. In previous studies, lactate is commonly used in the form of salts (such as sodium lactate, calcium lactate) to neutralize its acidity, making it easier and safer for administration. However, most studies have not controlled for the effects of the osmotic pressure of the injection solution and the co-injection of sodium ions. Previous research has shown that injecting a hypertonic solution of sodium chloride (2 g/kg NaCl) can simulate the appetite-suppressing and thermogenic effects of exogenous sodium lactate in mice, and both lead to high sodium load symptoms such as reduced physical activity and increased water intake[23]. The coordination ions may interfere beyond the pharmacological scope of lactate itself. These findings highlight the importance of controlling osmotic load and coordination ions in experimental design. In this study, we selected 1 × 10⁻³ mol/kg of lactic acid and its sodium salt (lactic acid: 90 mg/kg, sodium lactate: 112 mg/kg). Considering a gavage volume of 10 mL/kg in mice, the lactic acid solution was prepared at 0.75% (v/v) with a pH of approximately 2.5, comparable to carbonated beverages such as Sprite, while the sodium lactate solution was prepared at 11.2 mg/mL with a pH of approximately 8.4, similar to soda water. Furthermore, the osmotic pressure of the lactic acid solution was ~165 mosm/L, and that of the sodium lactate solution was ~190 mosm/L, both below physiological osmolarity (0.9% NaCl: 308 mosm/L), and differing by less than 15%. These doses are far lower than those typically used in previous studies (200–2,000 mg/kg), allowing a safe comparison of the effects of lactate vs its salt. This design more closely resembles the co-existence of lactic acid and lactate salts in dietary intake and provides important insights into the physiological relevance of lactate in its weak acid form.
We found that there were significant differences in anti-obesity effects between lactic acid and sodium lactate. Although both increased lactate accumulation in certain tissues and reduced food intake at equimolar doses, only lactic acid itself exhibited significant effects in terms of weight reduction, enhanced thermogenesis, and metabolic improvements. This result suggests that the physiological activity of lactic acid is not only dependent on the lactate ion (lactate−), but also crucially on the proton (H+) it carries. From a biological perspective, during the oral gavage process from the esophagus to the stomach and then to the intestine, lactic acid (pKa 3.86) exists primarily in its undissociated form in the highly acidic environment of the stomach (pH 1.5–3.5). This allows lactate to possess characteristics similar to lipophilic molecules, enabling rapid absorption through the gastric mucosal epithelial cells. In contrast, sodium lactate is fully dissociated in the stomach into lactate anions and sodium ions, with its absorption mainly dependent on proton-gradient-driven active transport mediated by monocarboxylate transporters (MCTs) in the small intestine[24], leading to significantly lower bioavailability. The metabolic signaling effect of the protons themselves may also be a contributing factor, as changes in intracellular pH can directly affect mitochondrial electron transport chain activity, activate the AMP-activated protein kinase (AMPK) energy-sensing pathway, and regulate ion channel functions. While sodium lactate showed limited efficacy in weight reduction, it maintained a noticeable impact on thermogenic markers and gene expression. These findings indicate that the lactate anion likely retains certain metabolic regulatory properties as both a signal and a substrate; however, the presence of protons further augments this response, providing a crucial auxiliary boost. This hypothesis provides an important direction for future development of functional lactate-based foods: the acidic form of lactate may possess superior biological activity compared to its neutral salt form.
Lactic acid is not only an important metabolic intermediate in the body but also a naturally occurring functional ingredient widely found in everyday diets. As a key metabolic product of fermentation, lactic acid is abundant in traditional fermented foods such as yogurt, pickles, fermented meats, and wine. For example, the lactic acid content in yogurt typically ranges from 0.7%–1.1% (w/w), while fermented vegetables like pickles can contain 0.6%–2.3% (w/w)[25]. In fermented meat products, its content generally remains between 0.5%–1.0% (w/w). During wine fermentation, lactic acid produced from malic acid-lactic acid fermentation usually ranges from 1–5 g/L[26]. These daily dietary intakes are significant sources of exogenous lactic acid for the human body. A cohort study involving over 8,000 people revealed that those who consumed yogurt more than seven times a week had a significantly lower incidence of overweight/obesity compared to those who consumed little or no yogurt. Epidemiological studies also suggest that increased yogurt consumption (≥ 4 servings per week) is strongly associated with a reduced incidence of metabolic syndrome in middle-aged and elderly individuals. Traditional views have attributed these health benefits mainly to probiotics, calcium, or protein content. However, this study suggests that lactic acid itself, as a characteristic component of fermented dairy products, may independently play a role in metabolic regulation through mechanisms such as promoting thermogenesis in adipose tissue. Based on the effective dose used in this study (90 mg/kg, equivalent to about 5.4 g of lactic acid per 60 kg adult body weight per day)[27], consuming approximately 550 g of yogurt daily (containing 4–6 g of lactic acid) would provide a similar level of lactic acid exposure. This aligns well with the recommended daily intake of 300–500 mL of dairy products as outlined in the 'Dietary Guidelines for Chinese Residents (2022)'. Commercial yogurts are usually sold in 150–250 g servings, meaning that consuming 2–3 servings per day can meet the effective dose, making it feasible in the context of typical dietary habits. However, many commercially available flavored yogurts contain substantial added sugar, and excessive long-term intake may contribute additional caloric load. Low-sugar or sugar-free options are therefore recommended to avoid offsetting the potential weight-loss benefits. Other traditional fermented foods can similarly provide appreciable lactic acid intake. For instance, consuming 50 g of kimchi daily may provide about 0.35–1.15 g lactic acid, 100 g of fermented meat products may contribute about 0.5–1 g lactic acid, and moderate wine consumption (~100 mL) may provide 0.1–0.5 g lactic acid. These fermented foods are typically consumed in combination as part of a diverse diet, offering flexibility and feasibility for achieving effective lactic acid exposure without relying on prolonged high intake of a single food source. Furthermore, while industrially added lactic acid salts can provide lactate ions, they may lack the proton-related signaling effects. Therefore, choosing naturally acidic fermented foods produced using traditional fermentation methods may have a more significant metabolic health effect than simply supplementing with lactic acid salts. It should be noted, however, that the metabolic process of gavage administration differs from that of daily dietary intake. Furthermore, the aforementioned dose conversion, based on the body surface area normalization method, represents a theoretical estimation. Although it provides a valuable reference, the actual effective dosage for humans remains to be validated through clinical studies.
This study found that lactic acid treatment significantly upregulated the expression of Mct1 and Mct4 in brown adipose tissue (BAT), Mct1 in white adipose tissue, and Mct4 in the liver. This tissue-specific regulation of transport proteins forms the molecular basis for the metabolic changes induced by lactic acid. MCT1 and MCT4, as bidirectional proton-coupled transporters, their upregulation not only promotes the uptake of exogenous lactate but also accelerates the shuttling and utilization of lactate within the cells[28]. Previous studies have shown that α-cyano-4-hydroxycinnamate (CHC), a broad-spectrum MCT inhibitor, can effectively block approximately 90% of lactate uptake in adipocytes[29], whereas deletion of the loss of mitochondrial MCT1 in BAT inhibits the increase in body temperature and glucose uptake in mice[30]. Further investigations revealed that both CHC and the MCT1/MCT2-selective inhibitor AR-C155858 can suppress lactate flux in differentiated adipocytes, which feedback inhibits glycolysis and oxidative metabolism, thereby affecting thermogenic capacity and browning of adipose tissue[17]. Therefore, the coordinated upregulation of Mct1 and Mct4 in adipose tissue likely promotes the intake and oxidative cycling of lactate, allowing lactate to replace glucose as the primary energy substrate in the TCA cycle, thus supporting thermogenesis and promoting the expression of related genes and proteins[31]. Notably, the selective upregulation of Mct4 in the liver is accompanied by a decrease in Pdk4 activity, suggesting that the increased lactate levels may inhibit the phosphorylation of the pyruvate dehydrogenase complex, thereby promoting excess lactate to enter the TCA cycle as a carbon source and reducing hepatic gluconeogenesis[32]. Inhibition of PDK4 can enhance insulin signaling in the liver and activate lipid regulation pathways, promoting glucose and lipid metabolism[33]. Furthermore, although sodium lactate can induce Mct expression in some tissues, its downstream effects are not as pronounced as those of lactic acid, further supporting the presence of a proton-dependent regulatory mechanism.
This study demonstrates the critical role of GPR81 (HCAR1) as the lactate-specific receptor in mediating thermogenic effects. Lactic acid treatment significantly upregulated the gene expression of GPR81 in both brown adipose tissue (BAT) and the liver, and further confirmed the increase in GPR81 and UCP1 at the protein level in BAT. GPR81, as a Gi protein-coupled receptor, upon activation, inhibits adenylate cyclase from producing cAMP, thereby reducing protein kinase A (PKA) activation[34]. This seems to contradict the traditional non-shivering thermogenesis process, where β-adrenergic receptor activation of Gs proteins promotes cAMP production and PKA activation. However, recent studies have shown that in GPR81-deficient mice, β3-adrenergic stimulation fails to induce the browning of white adipose tissue, and the interscapular surface temperature is markedly decreased[13]. The lactate-induced browning of WAT and associated thermogenic effects are completely abolished in GPR81 knockout mice. Mechanistic studies further revealed that lactate promotes UCP1 expression through the GPR81-Gi-Gβγ-RhoA/ROCK1-p38 signaling cascade[12]. Furthermore, the upregulation of Pgc1β and Cidea induced by lactic acid in this study also supports the hypothesis that chronic lactate regulates mitochondrial biomarkers to promote adaptive thermogenesis[35].
The protective effect of lactic acid on the liver is closely related to the upregulation of Gpr81 in the liver and the increase in lactate levels. Histologically, lactate significantly reduces lipid deposition and hepatocyte ballooning. At the molecular level, it inhibits Cd36-mediated fatty acid uptake, decreases the lipid transport function of Fabp4, and downregulates Mcp-1-driven inflammatory responses. Previous studies have shown that lactate treatment alleviates inflammation and organ damage in mice with immune hepatitis through a GPR81-dependent mechanism[36]. In this study, the reduction of Mcp-1 suggests that lactate may improve the hepatic immune microenvironment by inhibiting macrophage infiltration, thereby regulating liver lipid metabolism abnormalities.
Future research can further expand on the following aspects: Firstly, although oral gavage allows precise control over the dosage, it does not fully replicate the natural intake process of dietary lactic acid. Future studies could explore long-term feeding trials with lactic acid added to food or drinking water to simulate more natural consumption. Secondly, this study mainly used long-term oral administration of lactic acid and sodium lactate. The safety of long-term consumption, its impact on gut microbiota, and potential resistance need to be evaluated. It is known that the median lethal dose (LD50) of acute oral lactic acid in mice is approximately 4–5 g/kg, while the dose used in this study (100 mg/kg) is far below this level. Besides, no pathological differences were observed in tissue sections from the liver, kidneys, and colon. The US Food and Drug Administration (FDA) lists lactate as a Generally Recognized as Safe (GRAS) substance, allowing its use in food, but there are certain limits on the amount used in different food products. Additionally, the USDA-Food Safety and Inspection Service (USDA-FSIS) permits sodium lactate content in processed meat formulations up to 4.8% (USDA-FSIS, 2000)[37]. However, the specific safe intake levels of these substances still require chronic toxicity data. Thirdly, this study only investigated lactate levels in serum and tissue samples at the time of collection. The tissue pharmacokinetics of lactate—such as distribution at different time points, circulating lactate, and dynamic changes in intracellular lactate balance—need to be clarified in future research. Finally, future studies could use specific inhibitors and activators of MCT or GPR81 to further validate the mechanisms. Knockout or overexpression of the corresponding genes in both cells and mice would be an important approach to verifying the specific targets of lactate's effects.
-
This study aimed to investigate the metabolic effects of exogenous lactic acid on high-fat diet-induced obese mice and its underlying mechanisms. The experimental results indicate that lactic acid, as a metabolic regulatory molecule, can significantly reduce obesity induced by a high-fat diet, improve adipose tissue remodeling, liver lipid deposition, as well as glucose tolerance and insulin sensitivity. This effect is primarily achieved by increasing lactate levels in the body, which subsequently activates the expression of lactate transporters MCT1 and MCT4, as well as the lactate receptor GPR81 in adipose tissue and liver, thereby promoting the expression of proteins associated with lipid metabolism and thermogenesis, particularly UCP1. While traditional views have considered lactate as a waste product of anaerobic metabolism, this study strengthens the role of lactate as a key energy substrate and signaling molecule in metabolic regulation, providing new theoretical support for dietary lactic acid as an obesity intervention strategy.
This work was supported by the General Program of National Natural Science Foundation of China (32272306) to Yilin You, the National Key Research and Development Program of China (2024YFD1600304-4) to Yilin You, the National Natural Science Foundation of China Youth Fund (81900777) to Yilin You, and the High-Value Utilization of Whole Changshan Pomelo Fruits and New Product Development (202405410610918) to Yilin You.
-
All experiments adhered to the principles of animal care and made efforts to minimize animal suffering. The animal experiments were approved by the Animal Ethics Review Committee of China Agricultural University, approval number AW81114202-5-03.
-
The authors confirm contributions to the paper as follows: conceptualization: Lin Y, Han X, Guo J, Huang W, Zhan J, You Y; investigation: Lin Y, Kang X, Hong K, Tang Y, Xue H, Liu X; formal analysis: Lin Y; data curation: Lin Y; writing − original draft: Lin Y; methodology: Lin Y, Kang X, Hong K, Tang Y, Xue H; visualization: Lin Y; writing − review and editing: You Y; resources: Han X, Guo J, Huang W, Zhan J, You Y; funding acquisition: Huang W, Zhan J, You Y. All authors reviewed the results and approved the final version of the manuscript.
-
All data generated or analyzed during this study are included in this published article and its supplementary information files.
-
The authors declare that they have no conflict of interest.
-
accompanies this paper online at: https://doi.org/10.48130/fia-0026-0022.
- Supplementary Table S1 Primers used for qPCR.
- Supplementary Fig. S1 Raw images of the electrophoretic gels and blots in Figure 3-e.
- Supplementary Fig. S2 Raw images of the electrophoretic gels and blots in Figure 6-d.
- Supplementary Fig. S3 Raw images of the electrophoretic gels and blots in Figure 6-f.
- Copyright: © 2026 by the author(s). Published by Maximum Academic Press on behalf of China Agricultural University, Zhejiang University and Shenyang Agricultural University. This article is an open access article distributed under Creative Commons Attribution License (CC BY 4.0), visit https://creativecommons.org/licenses/by/4.0/.
-
About this article
Cite this article
Lin Y, Kang X, Hong K, Tang Y, Xue H, et al. 2026. Dietary lactic acid ameliorates high-fat diet-induced obesity by promoting lactate transport and activating GPR81-mediated thermogenesis. Food Innovation and Advances 5(2): 207−218 doi: 10.48130/fia-0026-0022 

Dietary lactic acid ameliorates high-fat diet-induced obesity by promoting lactate transport and activating GPR81-mediated thermogenesis
- Received: 23 February 2026
- Revised: 17 April 2026
- Accepted: 23 April 2026
- Published online: 09 May 2026
Abstract: Obesity and its associated metabolic diseases pose a severe threat to human health, necessitating the identification of safe and effective nutritional intervention mechanisms. Lactic acid, a key flavor and functional component in fermented foods such as yogurt, sauerkraut, and fermented meat products, is widely present in the daily diet. Beyond contributing to the characteristic sour taste and preservative effects of these foods, recent studies have demonstrated that lactate serves as an energy substrate and signaling molecule in the body, playing an crucial role in metabolic regulation. However, its underlying mechanisms remain unclear. This study aims to investigate the mechanisms by which dietary lactic acid helps alleviate obesity. Using a high-fat diet-induced obesity mouse model, the effects of lactic acid on body weight, glucose tolerance, insulin sensitivity, and lipid metabolism were examined. The results demonstrated that exogenous lactic acid intervention effectively reduced the body weight of high-fat diet-induced obese mice, while improving glucose tolerance and insulin sensitivity. Lactic acid gavage significantly increased the accumulation of lactate in tissues and improved liver lipid deposition by activating the lactate transporters monocarboxylate transporter 1(MCT1) and monocarboxylate transporter 4(MCT4), as well as the lactate-specific receptor G-protein-coupled receptor 81(GPR81). These effects enhanced lipid metabolism and thermogenesis in adipose tissue, thus alleviating obesity and its metabolic syndrome. This study provides new theoretical evidence for dietary lactic acid as an intervention strategy for obesity.
-
Key words:
- Lactic acid /
- Sodium lactate /
- Obesity /
- UCP1 /
- GPR81 /
- Thermogenesis