


-
The most usual disease caused by ingestion of cereal protein is celiac disease or gluten-sensitive enteropathy. Gluten, which is present in grains like wheat (Triticum aestivum), rye (Secale cereale), and barley (Hordeum vulgare) and is commonly used in diets worldwide[1], but it cannot be digested in the small intestine by those with celiac disease. The incidence of celiac disease is increasing globally, with recent annual statistics showing that for women, the incidence is 17.4 cases out of 100,000 in one year; for men, the incidence is 7.8 per 100,000 people in one year. More and more children are also diagnosed with celiac disease: 21.3 per 100,000 person-years compared with 12.9 per 100,000 in adults[2]. Currently, the widespread occurrence of celiac disease, an autoimmune disorder and inflammatory condition of the digestive system, presents symptoms such as diarrhoea, lack of growth, fatigue, and anemia. Even trace amounts of gluten in food formulations can negatively impact the digestive system of individuals with celiac disease[3]. People with these diseases have a lower quality of life when they consume gluten-containing food, and they must avoid gluten. To date, the gluten-free (GF) diet has been the only therapeutic option for celiac disease[4]. The main challenges celiac patients face in maintaining a GF diet include the limited availability, relatively low nutritional and sensory quality, high cost, and safety concerns of GF foods, as well as the risk of cross-contamination[5].
The global market size of GF products was valued at USD 22.1 billion in 2024. Looking forward, IMARC Group estimates that the market will reach USD 40.0 billion by 2033, exhibiting a Compound Annual Growth Rate (CAGR) of 6.8% from 2025 to 2033[6]. Palomares-Navarro et al.[7] reported that most GF products, such as bread, cookies, and pasta, contain large amounts of simple carbohydrates and are low in fiber and protein, affecting people's health. GF baked goods are often low in fiber, as wheat flour is mainly substituted with commercial starches. To simulate the viscoelastic qualities of gluten in wheat doughs, a variety of flours and starches (rice [Oryza sativa], corn [Zea mays], sorghum [Sorghum bicolor], cassava [Manihot esculenta], soybean [Glycine max], and peanut [Arachis hypogaea]), pseudocereals (e.g., amaranth [Amaranthus spp.], buckwheat [Fagopyrum esculentum], quinoa [Chenopodium quinoa])[8−10], as well as a variety of ingredients such as gums, enzymes, and egg white, have been utilized in GF products[11,12].
Bread is a staple and one of the oldest bakery foods that is closely related to daily life. Bread is a ready-to-eat snack that is popular around the world and largely consumed by people of all ages, including children. The nutritional quality of gluten-free breads (GFBs) could be improved by using nutrient-dense alternative flours and/or ingredients with the nutritional goal of enhancing the nutrients and phytochemicals, such as various fruit- and vegetable-based components[13]. Some researchers have used fruit and vegetable-based ingredients such as pumpkin (Curcurbita moschata) flour[14,15], extracts from green kiwifruit (Actinidia chinensis) puree[16], unripe banana (Musa acuminata) flour[17], orange (Citrus × sinensis) pomace[18], chestnut (Castanea sativa) flour[19], and different vegetable flours (broccoli [Brassica oleracea var. italica], cauliflower [B. oleracea var. botrytis], artichoke [Cynara cardunculus], fennel [Foeniculum vulgare], zucchini [Curcubita pepo], and mushroom)[20] have shown promising results in GFB formulas.
In this regard, processed pumpkin products deserve attention because pumpkin can play a role in the diet as a source of carotenoids, polyphenols, many essential compounds (minerals, vitamins, amino acids)[21], starch, and pectin[22]. These facts have led to pumpkins being processed into a variety of foods, and pumpkin has been used to supplement cereal flour in baking items. From these perspectives, pumpkin flour (PF) can be used as an improver in bakery goods, reflecting the potential for its application[15]. Aziah and Komathi[23] investigated the fresh peeled and unpeeled pumpkin pulp, which has a lot of potential as a functional ingredient or in wheat–pumpkin composite flour blends in the food processing industry. Incorporating PF into noodles[24], GF pasta[25], bread[15,26,27], muffins[28], cookies[29], biscuits[30], and cakes[14,31] not only increases the amount of various nutrients but it also enhances the taste, color, and flavor of the final products[32]. Untreated PF, like other flours presents certain limitations, mainly regarding its utiliation in GF products, in which pregelatinized starch is preferred. High-pressure processing (HPP) is used to improve the flour's functionality and the availability of bioactive compounds, and it has emerged as a novel nonthermal technology that is capable of modifying the physicochemical and biological properties of plant-based materials. A study by Rinaldi et al.[33] reported that HPP alters the mechanical properties of plant foods by modifying the cell wall components, causing tissue damage, loss of turgor, and irregular cell morphology in pumpkin. Interestingly, Paciulli et al.[34] observed that HPP induces starch–pectin rearrangements, a change which could contribute to texture degradation in vegetables such as pumpkin and asparagus lettuce (Lactuca sativa var. augustana)[35,36]. Furthermore, HPP has been noted to influence the interactions between macromolecules and bioactive substances such as carotenoids and phenolics[35], improving the extractability of these compounds. These effects of HPP are accompanied by structural changes, gelatinization, and protein unfolding in fruits, vegetables, starches, and grains, as these modifications make the ingredients more suitable for nutrient-rich bakery formulations[37]. Optimizing the HPP conditions is crucial to producing modified ingredients that are suitable for high-quality bread production. Moreover, the novelty of HPP lies in its ability to tailor the ingredients' properties while maintaining quality, clean-label status and perceived minimal processing.
However, there is a clear lack of research on the use of HPP on fresh pumpkins before the vegetables are converted into flour. Furthermore, extensive research work found no information on HPP-treated PF incorporated into GFB. Hence, the objective of the present study was to investigate the effects of HPP on the physicochemical properties and antioxidant activities of PF. Furthermore, the study aimed to evaluate the suitability of the resulting PF as a potential ingredient in the formulation of GFB, we also assessed the impact on bread quality.
-
Pumpkins (Cucurbita moschata L.) were collected at the commercial ripening phase from a local supermarket in Parma, Italy. Pumpkins were washed under running cold water to remove dirt and soil residues and manually peeled. The seeds were removed, and the pumpkin was cut into small pieces using a sharp knife. Subsequently, the pieces were combined to create homogeneous samples. The homogenized pumpkin pieces were then grated using a Kitchen Aid Professional grater (KitchenAid, St. Joseph, Michigan, USA) for 2 min at maximum velocity. Raw (UNTR) grated pumpkin samples were separated for drying. Then the remaining grated pumpkin samples were immediately mixed uniformly to stop any initial changes and packed at an appropriate quantity in High-Density Polyethylene (HDPE) bags and sealed under a vacuum (92%) by a packaging machine (Lavezzini Univac, Fiorenzuola d'Arda, PC, Italy). After sealing, the packaged pumpkin samples were immediately subjected to HPP at various pressures.
High-pressure processing treatments were conducted at the research institute Stazione Sperimentale Industria Conserve Alimentari (SSICA, Parma, Italy) by using a 30-L AvureTM vertical machine (Model AV-S). The HPP treatment was conducted at ambient temperature (20 °C) at 100, 300, and 600 MPa for 3 min (referred to as the 100HPP, 300HPP, and 600HPP samples, respectively)[38]. Three packed bags of grated pumpkin samples were treated under each condition. Following the HPP treatments, all samples were promptly set aside for drying to prepare flour. Each HPP treatment was repeated twice.
Drying and pulverization: UNTR and HPP-treated grated pumpkin samples were dried at 50 °C for 24 h. After drying, the dried material was pulverized by a Vorwerk thermomix (Wuppertal, Germany) at maximum speed for 10 min. After pulverization, PF samples were collected and used for analysis of the particle size distribution. Then the samples were packed under a vacuum in an HDPE bag to avoid clumps and cake formation until the analysis and bread formulation.
Bread-making process
-
The recipe was developed by starting from the instructions reported on the label of the GF mixture. Pumpkin flour-based GFB was produced, substituting the gluten-free mix with 2.5% or 5% of PF[39]. All ingredients, namely 100 g of the gluten-free bread mix (corn–potato [Solanum tuberosum] starch, rice flour, corn, and sorghum), 2.5 g of yeast, 95 mL of water, 1 g of sugar, 2 g of salt, 5 mL of oil, and PF (2.5% and 5%)[40], were mixed and allowed to rest for 10 min. A domestic bread machine (Moulinex, Milano, Italy) was used for breadmaking, with a rapid program: Stirring + kneading + rising for 80 min, followed by baking for 55 min at 210 °C. The breadmaking process was performed in triplicate. After all the processes, the bread was taken out from the machine and cooled at ambient temperature for 2 h. Fresh bread samples were used for analysis and some were also kept at ambient temperature in a sealed polyethylene bag with ethanol for at least 3 days for a storage (shelf life) study.
-
The PF was graded according to particle size using a multidimensional sieve shaker (Giuliani Technologie srl. Torino, Italy) with three mesh sizes, < 300, 300–500, and > 500 μm. The sample was shaken for 3 min at a constant speed (300 rpm), lightly stirred, then shaken for an additional 2 min with a total sieving time of 5 min. The material retained on each sieve was weighed, the percentage of yield was calculated, and the samples were then vacuum-packed in polythene pouches. The physicochemical properties of PF samples with different particle sizes were evaluated.
Moisture content and water activity
-
The moisture content (g/100 g) of PF and bread samples was evaluated by means of the gravimetric technique following the official method[41]. The water activity (aw) of PF was performed using water activity equipment (AQUALAB 4TE, USA). All samples were analyzed in three replicates.
Water absorption index and water solubility index of PF
-
The water absorption index (WAI) was evaluated, according to Anderson et al.[42], with a few adaptations. In a centrifugal tube, approximately 2.5 g of a sample was placed with 30 mL of distilled water at 28 °C. The tubes underwent mechanical agitation in a water bath at 28 °C for 30 min and then were centrifuged at 1,008 × g for 10 min. Then the supernatant was carefully pipetted into aluminum cups and placed in a heater at 105 °C for 4 h. After this period, the material was cooled and weighed on analytical scales. The leftover centrifugal residue was weighed, and the WAI was calculated according to the following equation:
$ \mathrm{WAI=CRW/SW-ERW} $ where, WAI is the water absorption index (gel weight [g]/dry matter [g]), CRW is the centrifuged residue weight (g), SW is the sample weight (g) (dry base), and ERW is the evaporated residue weight (g).
The water solubility index (WSI) was determined by following the same steps used to calculate WAI and calculated from the relationship between the weight of the evaporation residue and the dry weight of the sample, according to the following equation:
$ \mathrm{WSI=(ERW/SW) \times 100} $ where, WSI is the water solubility index (%), ERW is the evaporated residue weight (g), and SW is the sample weight (g) (dry base).
Starch and pectin content of PF
-
The starch from the PF sample was extracted by the wet-milling method[43] with some changes. The PF samples (12.5g) were immersed in 150 mL of a 0.45% (w/w) Na2S2O5 solution and kept at 4 °C overnight. The resulting slurry was filtered through a 400-mesh nylon screen. The filtrate was subsequently combined with 150 mL of absolute ethanol and stirred for 20 min. Following agitation, the samples were centrifuged at 3,388 × g for 10 min, resulting in the starch fraction settling at the bottom of the centrifuge tubes. The supernatant was carefully decanted, and other impurities were removed with a spatula. Finally, the recovered starch was rinsed with water and centrifuged again (3,388 × g for 10 min) with water. We finally collected the extracted starch at the bottom and dried it in an oven at 50 °C overnight. After drying, the dried starch matter was weighed, and the percentage was calculated using the following formula:
$ \rm {\text{%}}\; Starch=(Weight\;of\;extracted\;starch/Weight\;of\;sample) \times 100 $ The PF's pectin was obtained using an acid-based extraction method[44] with minor modifications. The PF samples (12.5 g) were dispersed in 500 mL of in 0.1 M HCl and stirred for 2 h at 65 °C, followed by filtration through a 200-mesh nylon screen. The resulting filtrate was allowed to cool at room temperature, then combined with three times its own volume of 96% ethanol and kept overnight (16 h) to allow pectin to precipitate. The precipitated pectin was collected after centrifugation at 3,388 × g for 10 min, followed by two washing processes with acidified aqueous alcohol (10 mL HCl in 1 L 70% v/v ethanol) (centrifuged at the same speed and time) and pure ethanol (centrifuged at 3,388 × g for 10 min). After centrifugation, the supernatant was removed, and the bottom part (i.e., pectin) was collected then dried in a warm air current (40–50 °C). After drying, the dried pectin matter was weighed, and the percentage was calculated using the following formula:
$ \rm{{\text{%}} \;Pectin=(Weight\;of\;extracted\;Pectin/Weight\;of\;sample)\,\times 100} $ Instrumental color
-
Instrumental color was measured in a spectrophotometer (CM 2600d, Konica Minolta Co., Osaka, Japan). For this, 5 g of each flour sample was placed evenly on a petri dish, and the bread sample (crust-crumb) was covered with thin plastic foil before measurement. Reflectance measurements were made using d/10 geometry (diffuse illumination and the observer placed at a 10° viewing angle) with the primary Illuminant D65 and Commission Internationale de l'Eclairage (CIE) color mode L*, a*, b* scale, where L* is lightness (black = 0, white = 100), a* is redness (red, a* > 0; green, a* < 0), and b* is yellowness (yellow, b* > 0; blue, b* < 0), C is chroma (0 at the centre of the color sphere), and h° is the hue angle (red = 0°, yellow = 90°, green = 180°, blue = 270°). Color values were recorded in 10 replicates of each sample type, and the total color changes (ΔE) were also calculated to evaluate changes between the UNTR and HPP-treated samples using the following equation:
$ (\Delta E)=[(L^*-L^*_0)^2+(a^*-a^*_0)^2+(b^*-b^*_0)^2]^{0.5} $ where, L*0, a*0, and b*0 are the values for untreated sample and L*, a*, and b* are the values of the HPP-treated sample.
Rheological properties of PF
-
A sample obtained by mixing 10 g of PF and 90 mL of distilled water was used for the rheological study[45]. The viscosity profile of the samples was measured with concentric cylinder geometry (Couette cell) mounted on an ARES rheometer (TA Instruments, New Castle, DE, USA). The dimensions of the geometry were a 34 mm cup diameter, a 32 mm bob diameter, and a height of 33 mm. The tests were performed at 25 °C after equilibration at shear rates from 10 to 100 s−1. As the sample was assumed to behave as a non-Newtonian fluid, shear stress (σ) vs. shear rate (γ) curves were fitted by means of the power-law model:
$ k={\gamma }^{n} $ where, k is the consistency coefficient (Pa.sn) and n is the flow behavior index (dimensionless). All the trials were performed in triplicate.
-
The volume of bread samples was measured according to the AACCI 10-05.01[46] Guidelines for Measurement of Volume by Rapeseed Displacement method.
Texture attributes of bread
-
A texture profile analysis (TPA) was performed on the crust and crumb by using a XT2i Texture Analyzer equipped with a cylindrical aluminium probe 35 mm in diameter by means of double compression with a speed of 2 mm/s up to 50% of the original sample's height for the crumb evaluation. Breadcrumb samples were cut into cubes of 2 cm × 2 cm × 2 cm. The textural characteristics considered were hardness (maximum peak force of the first compression cycle, N), cohesiveness (the ratio of positive force area during the second compression to that throughout the first compression area, dimensionless), resilience (area during the withdrawal of the force, divided by the area under the first force, dimensionless), and chewiness (product of hardness × cohesiveness × springiness, N). The maximum peak force was obtained from the crust during a puncture test, which was performed using a single compression to determine force (N) and distance (mm). Ten replicates of each sample were analyzed at room temperature.
Breadcrumbs' pore distribution by image analysis
-
Image analysis was performed by cutting the sample into slices with a thickness of 2 cm each. These slices were scanned with an HP® Scanjet 8200 scanner (Hewlett-Packard Company, USA), calibrated, analyzed, and processed using Image-Pro Plus® software (Media Cybernetics, USA). Each scan took place at 600 dpi, which corresponds to 236.4 pixels per cm, and was acquired in million-color format. This analysis was performed on three slices of each bread sample. In this case, the honeycomb of the breadcrumb was calculated by quantifying the number of cells in an area of 1 mm2.
A certain area of about 5 cm × 5 cm from the slice image was considered, which was converted to grayscale and subjected to contrast adjustment. This allowed us to accurately observe the alveolation of the slice, eliminating the noise of the alveoli present in the background and reducing the three-dimensionality of the image. Finally, the areas were counted, and the program allowed us to count the alveoli and their subdivision into classes (mm2) according to the area they belonged to. The number of pores (expressed as a percentage of the total number) was obtained according to four preselected dimensional classes: < 0.20, 0.21–0.99, 1.0–10, and > 10 mm2.
Total antioxidant capacity of PF GFB
-
For each antioxidant assay, a Trolox (6-hydroxy-2,5,7,8-tetramethylchroman-2-carboxylic acid) aliquot was used to develop a 50–500 μmol/L standard curve. All data were then expressed as Trolox equivalents (mmol/100 g PF), and antioxidant activity was determined as Trolox equivalent antioxidant capacity (TEAC). The TEAC values (mM Trolox/100 g) of samples were obtained from the calibration curve calculated by measuring the absorbance at 517 nm of methanolic solutions of Trolox at different concentrations.
Antioxidant capacity was identified using the 2,2-diphenyl-1-picrylhydrazyl (DPPH) assay[34] with small modifications. Each PF (1 g) sample was mixed with a 70% methanolic solution (10 mL) and stirred for 1 h at 25 °C in a rotary shaker. After shaking, the sample was centrifuged at 580 × g for 10 min at 4 °C, and then the supernatant was collected for further analysis. Next, 0.2 mL of the supernatant was diluted 10-fold with 4.0 mL of a methanolic solution of DPPH (0.14 mmol/L). All the samples were kept in a dark room for at least 60 min, and then the absorbance was measured at 517 nm with a spectrophotometer (UV-726, T6, PG General, Beijing, China). Analyses were performed in triplicate.
Data processing
-
Mean values and standard deviations were calculated with SPSS (v. 29.0, SPSS Inc., Chicago, IL, USA). The data were analyzed by one-way analysis of variance (ANOVA) with Tukey's test to evaluate the effect at a significance level of 0.05.
-
The four samples of PF (UNTR, HPP100, HPP300, and HPP600) were measured by sieve analysis to determine the particle distribution. The sieve method showed a larger percentage of particles passing through the 300-µm sieve, ranging from 45% to 75% (Fig. 1). The particle size for all PF samples in the 300–500 µm range and > 500 µm sieves were 22%–41% and 2%–14%, respectively. The 300HPP and 600HPP samples showed a higher percentage of particles in the < 300 µm range compared with the UNTR and 100HPP samples. This result is probably related to the movement of water, the migration of cellular components, and cell damage observed in pumpkin tissue after HPP[33]. As the tissue subsequently dried, the cells no longer maintained their original structural integrity, which is directly related to the particle size distribution after grinding, as demonstrated for other vegetable products like wheat bran[47]. Sharma et al.[48] studied the particle size of mango (Mangifera indica) powder and reported that particles around 264 µm were the most acceptable with respect to sensory qualities. On the basis of this fact, PF with < 300 µm for all the treatments (UNTR, 100HPP, 300HPP, and 600HPP) was selected for further analysis.
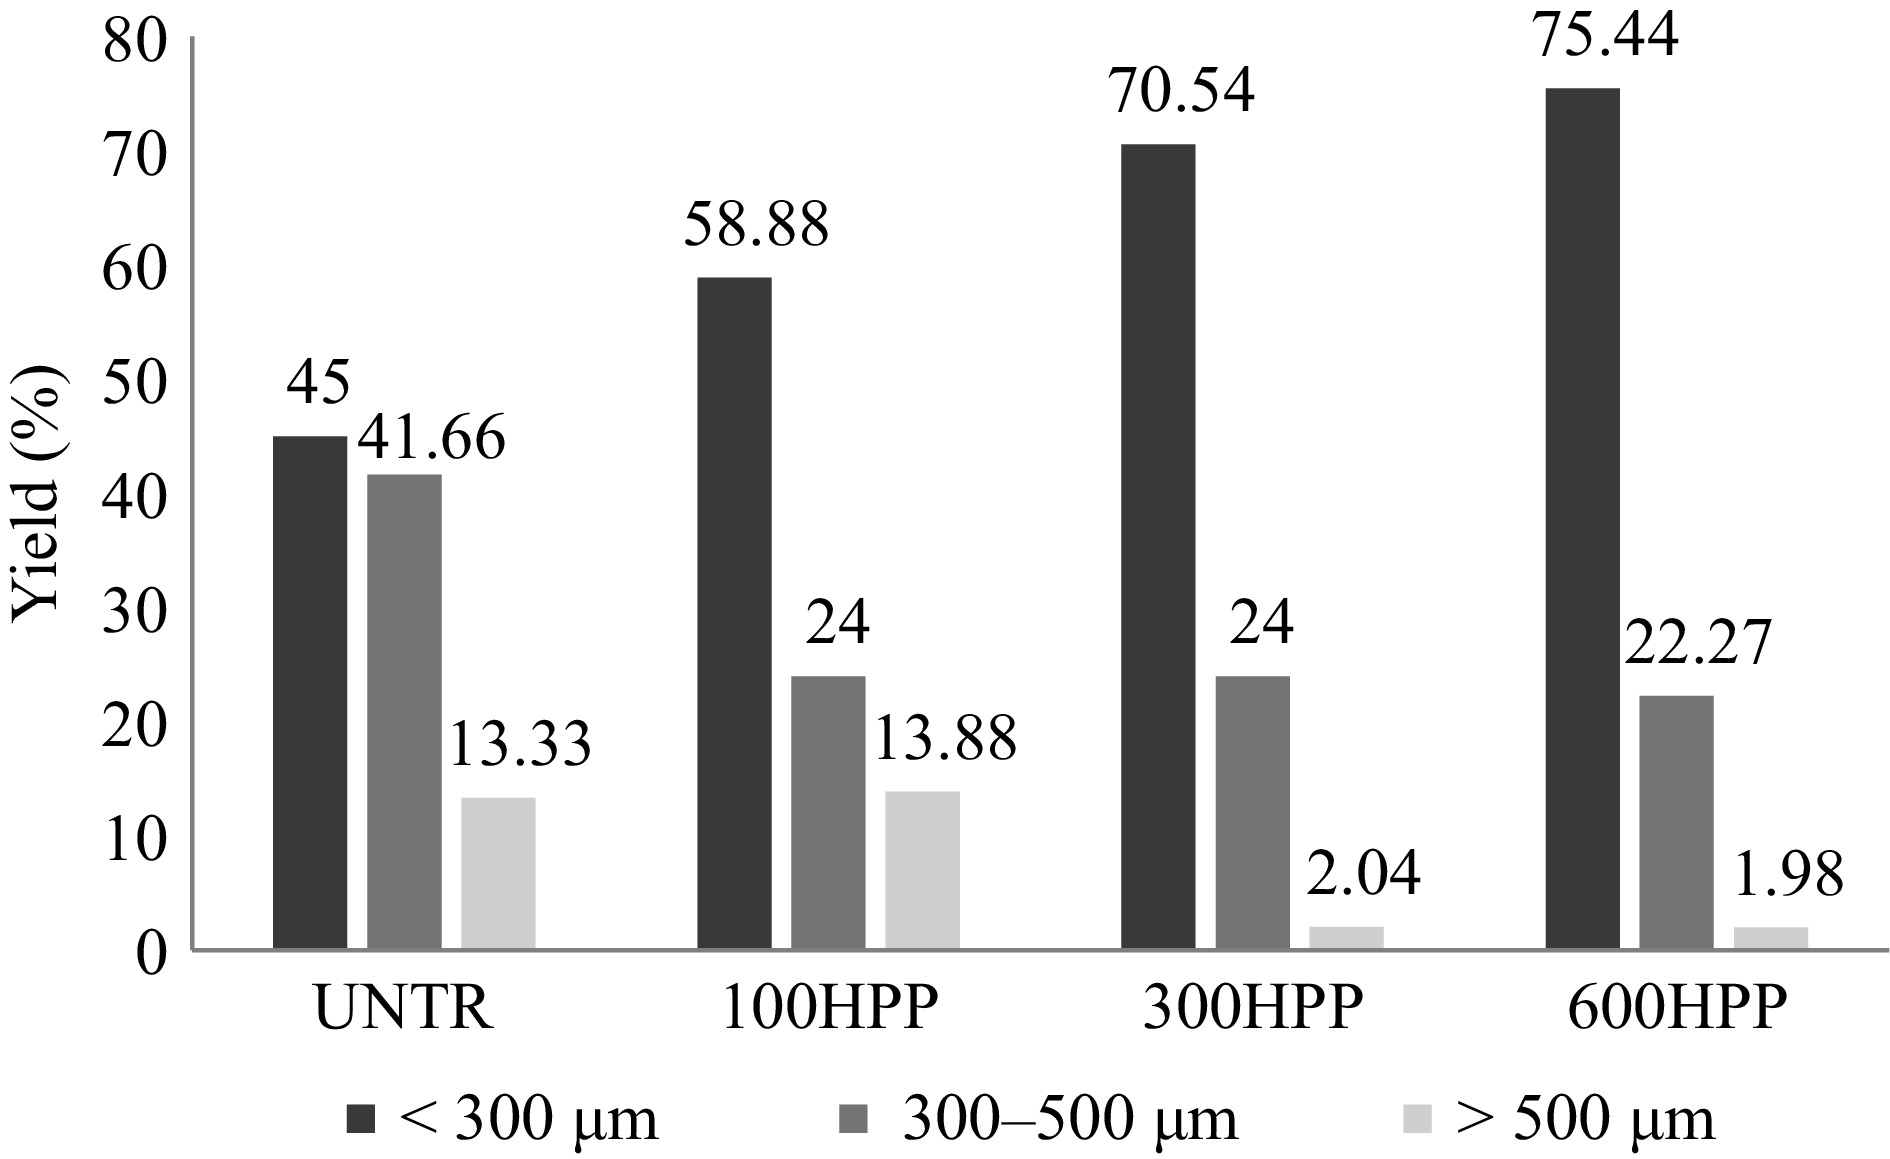
Figure 1.
Particle size distribution of untreated and treated pumpkin flour (PF) after sieving. Data are expressed as percentages. UNTR, untreated sample; 100HPP, 300HPP, and 600HPP: Samples treated by high-pressure processing. Sieve sizes: < 300, 300–500. and > 500 µm.
Moisture content, aw, WAI, and WSI of PF
-
The moisture content (MC) of all PF samples ranged from 6.00 to 7.87 g/100 g. Specifically, the 300HPP sample (7.87 g/100g) exhibited the highest moisture content compared with other samples (Table 1). These moisture content values are consistent with previous studies by several authors[14,49,50].
Table 1. Physicochemical properties of < 300-µm PF.
Samples MC (g/100 g) aw WAI (g/g) WSI (g/g) Starch (g/100 g) Pectin (g/100 g) UNTR 6.01 ± 1.8b 0.261 ± 0.006c 4.11 ± 0.03c 33.4 ± 0.1a 3.26 ± 1.1c 5.94 ± 1.9d 100HPP 6.50 ± 2.0b 0.265 ± 0.005c 4.33 ± 0.08c 31.0 ± 0.3b 3.39 ± 1.3c 6.22 ± 2.8c 300HPP 7.87 ± 2.4a 0.272 ± 0.002b 7.69 ± 0.13a 19.8 ± 2.8d 4.42 ± 2.0b 7.35 ± 3.2b 600HPP 6.03 ± 1.8b 0.288 ± 0.007a 5.81 ± 0.01b 23.3 ± 1.9c 6.86 ± 2.6a 8.11 ± 2.7a Data are expressed as mean ± standard deviation (n = 3). Means in the same column followed by different superscript letters (a, b, c, d) differ significantly (p < 0.05). Abbreviations: MC, moisture content; aw, water activity; WAI, water absorption index; WSI, water solubility index; UNTR, untreated sample; 100HPP, 300HPP, 600HPP, samples treated by high-pressure processing. The PF's water activity (aw) varied from 0.26 to 0.28 (Table 1); similar observations were reported by Aziah and Komathi[23] and Pereira et al.[51]. The UNTR and 100HPP PF significantly showed lower aw values than the 300HPP and 600HPP samples. The results are in agreement with observations for WAI: The 300HPP and 600HPP samples showed the highest values, with a high ability to interact with water, also described as moisture-holding capacity, but only with physical interactions with no effect on water activity.
The WAI of the PF ranged from 4.11 to 7.69 (g dry matter gel/g), respectively for the UNTR and HPP-treated samples (Table 1). The 300HPP PF showed the significantly greatest WAI, followed by the 600HPP PF, compared with the 100HPP and UNTR samples. At moderate pressure such as 300 MPa, partial starch gelatinization and cell wall disruption occurs, which leads to a pronounced increase in WAI, whereas 600 MPa causes excessive compression that leads to the collapse of starch granules and higher cell disruption, which reduce the number of accessible water binding sites. Structural densification of the matrix and pressure-induced interactions may limit the swelling capacity. This could be attributed to the significant alteration in the surface properties of the powders after HPP treatment of freshly grated pumpkin caused by the exposure of hydrophilic groups in the cellulose and hemicellulose of pumpkin, resulting in an easier integration with water, thus leading to an increased WAI[52]. Our WAI results were considerably higher and differed because of the distinct aims and methods used in our study, although Roongruangsri et al.[49] found WAI values for pumpkin powder ranging from 2.33 to 3.50 g/g when dried in hot air at different temperatures (50, 60, and 70 °C). The WAI is a valuable characteristic becasue of its ability to enhance the preservation of items like bread and cakes by maintaining optimal moisture levels[53].
Solubility depends on other nutrients and their structural modifications after pressure treatments. The UNTR and 100HPP PF showed significantly higher values than the 300HPP and 600HPP samples (Table 1). Probably, the solubility of the 300HPP and 600HPP samples was lower becasue of greater starch modification, pectin degradation, and cell wall solubilization under high pressure[33,34]; in addition, lower surface energy can also affect the solubility index. By using hot air-drying and freeze-drying, Que et al.[54] observed higher water solubility in hot air-dried PF compared with freeze-dried flour, indicating that more starch would be decomposed during hot air-drying. Probably, the HPP treatment, like hot air, favored starch decomposition.
Starch and pectin content of PF
-
Starch granules are composed of amylose and amylopectin and have a semicrystalline structural property. The starch content of < 300 µm UNTR PF was 3.26 g/100 g, whereas for the 600HPP sample, the amount of starch extracted increased significantly to 6.86 g/100 g. This change can be attributed to the effect of HPP, which disrupts the crystalline structure of starch even at mild temperatures through a phenomenon known as cold gelatinization; during this process, hydrogen bonds within the granules break, allowing water to penetrate, leading to granule swelling, loss of birefringence, and transformation into an amorphous, gel-like state with increased water-binding capacity and viscosity. Consequently, more starch becomes extractable in HPP-treated samples[55]. Similarly, pectin, a major component of the primary cell wall and middle lamella, contributes to cell integrity by forming ionic cross-links and interactions with cellulose and hemicellulose, influencing the structural properties of plant tissues. Pectin content ranged from 5.94 g/100 g to 8.11 g/100 g for UNTR and 600HPP, respectively (Table 1). High pressure weakens the cell structure by disrupting the membranes and reducing intercellular cohesion, which loosens pectin in the cell wall. This promotes partial solubilization by breaking noncovalent bonds, thereby increasing the amount of extractable pectin and resulting in higher pectin content with rising pressure[56]. These results indicate that both starch and pectin extraction rise with increased pressure, as high pressure leads to starch gelatinization and solubilization of pectin from cell walls[34,57]. Rinaldi et al.[33] reported similar results for HPP-treated fresh pumpkin starch and pectin. Such variations in starch and pectin content could be influenced by species differences, ripeness levels, and the samples' extraction methods.
Instrumental color of PF
-
The colorimetric valuea of < 300 µm UNTR and HPP-treated PF is presented in Table 2. The values of L* varied from 80.7 to 75.8 from UNTR to 600HPP, respectively. The UNTR sample reported the highest value of L*, whereas 300HPP and 600HPP reported the significantly lowest. Pereira et al.[51] reported similar L* values for different unprocessed pumpkin flours. The present findings are in agreement with Rinaldi et al.[33] and Oey et al.[38], who observed a decrease in L* after HPP and suggested that it may be linked to enzymatic activity and the isomerization of β-carotene; additionally, oxidation likely contributed to the reduction in color intensity, affecting both red and yellow hues. After HPP at 100, 300, and 600 MPa, the values of a* and b* significantly increased compared with UNTR, likely through the release of more free carotenoids, enhancing the color intensity[58]. Higher pressures (300 and 600 MPa) significantly affected the L*, a*, and b* color parameters compared with UNTR, whereas the 100HPP sample showed higher values for all color parameters (Table 2). Looking at the total color difference (ΔE) among all samples, 600HPP showed the lowest value (6.94).
Table 2. Instrumental color of < 300 µm untreated and treated PF.
Samples L* a* b* ΔE UNTR 80.66 ± 0.2a 17.53 ± 0.1d 39.42 ± 0.3d − 100HPP 77.71 ± 0.2b 24.11 ± 0.2a 43.19 ± 0.7a 8.15 ± 0.5a 300HPP 75.29 ± 0.3d 22.54 ± 0.1b 42.75 ± 0.7b 7.83 ± 0.4b 600HPP 75.79 ± 0.4c 22.09 ± 0.1c 41.27 ± 0.4c 6.94 ± 0.3c Data are expressed as the mean ± standard deviation (n = 10). Means followed by different superscript letters (a, b, c, d) differed significantly (p < 0.05). Legends: UNTR, untreated sample; 100HPP, 300HPP, and 600HPP, samples treated by high-pressure processing. Rheological properties of PF
-
There is evidence that structural changes occurred during HPP treatment, which was evaluated and influenced when the study of rheological measurement was taking place. The 300HPP and 600HPP samples exhibited higher viscosity than UNTR and 100HPP, as shown in Fig. 2, with 300HPP having the highest. However, there was a significant difference in the yield stress and flow behavior index values (data not reported), which may be related to soluble solids and other components, caused by the different pressures[59]. PF's viscosity begins to significantly increase between 300 and 600 MPa, likely caused by starch gelatinization or its interaction with highly solubilized pectin, as HPP disrupts starch granules, facilitating water absorption and swelling, which increases viscosity. Additionally, the solubilization of pectin under high pressure promotes a structured gel matrix, further improving the flour's rheological properties. However, in the 600HPP sample, the viscosity decreased compared with 300HPP, likely caused by excessive starch breakdown, disruption of the gel matrix, or disintegration of pectin networks. These results are in agreement with the WAI values: 300HPP showed a higher WAI than 600HPP, confirming the higher ability to form a gel in water. The rheological properties of PF provide important information for developing food products with the desired texture.
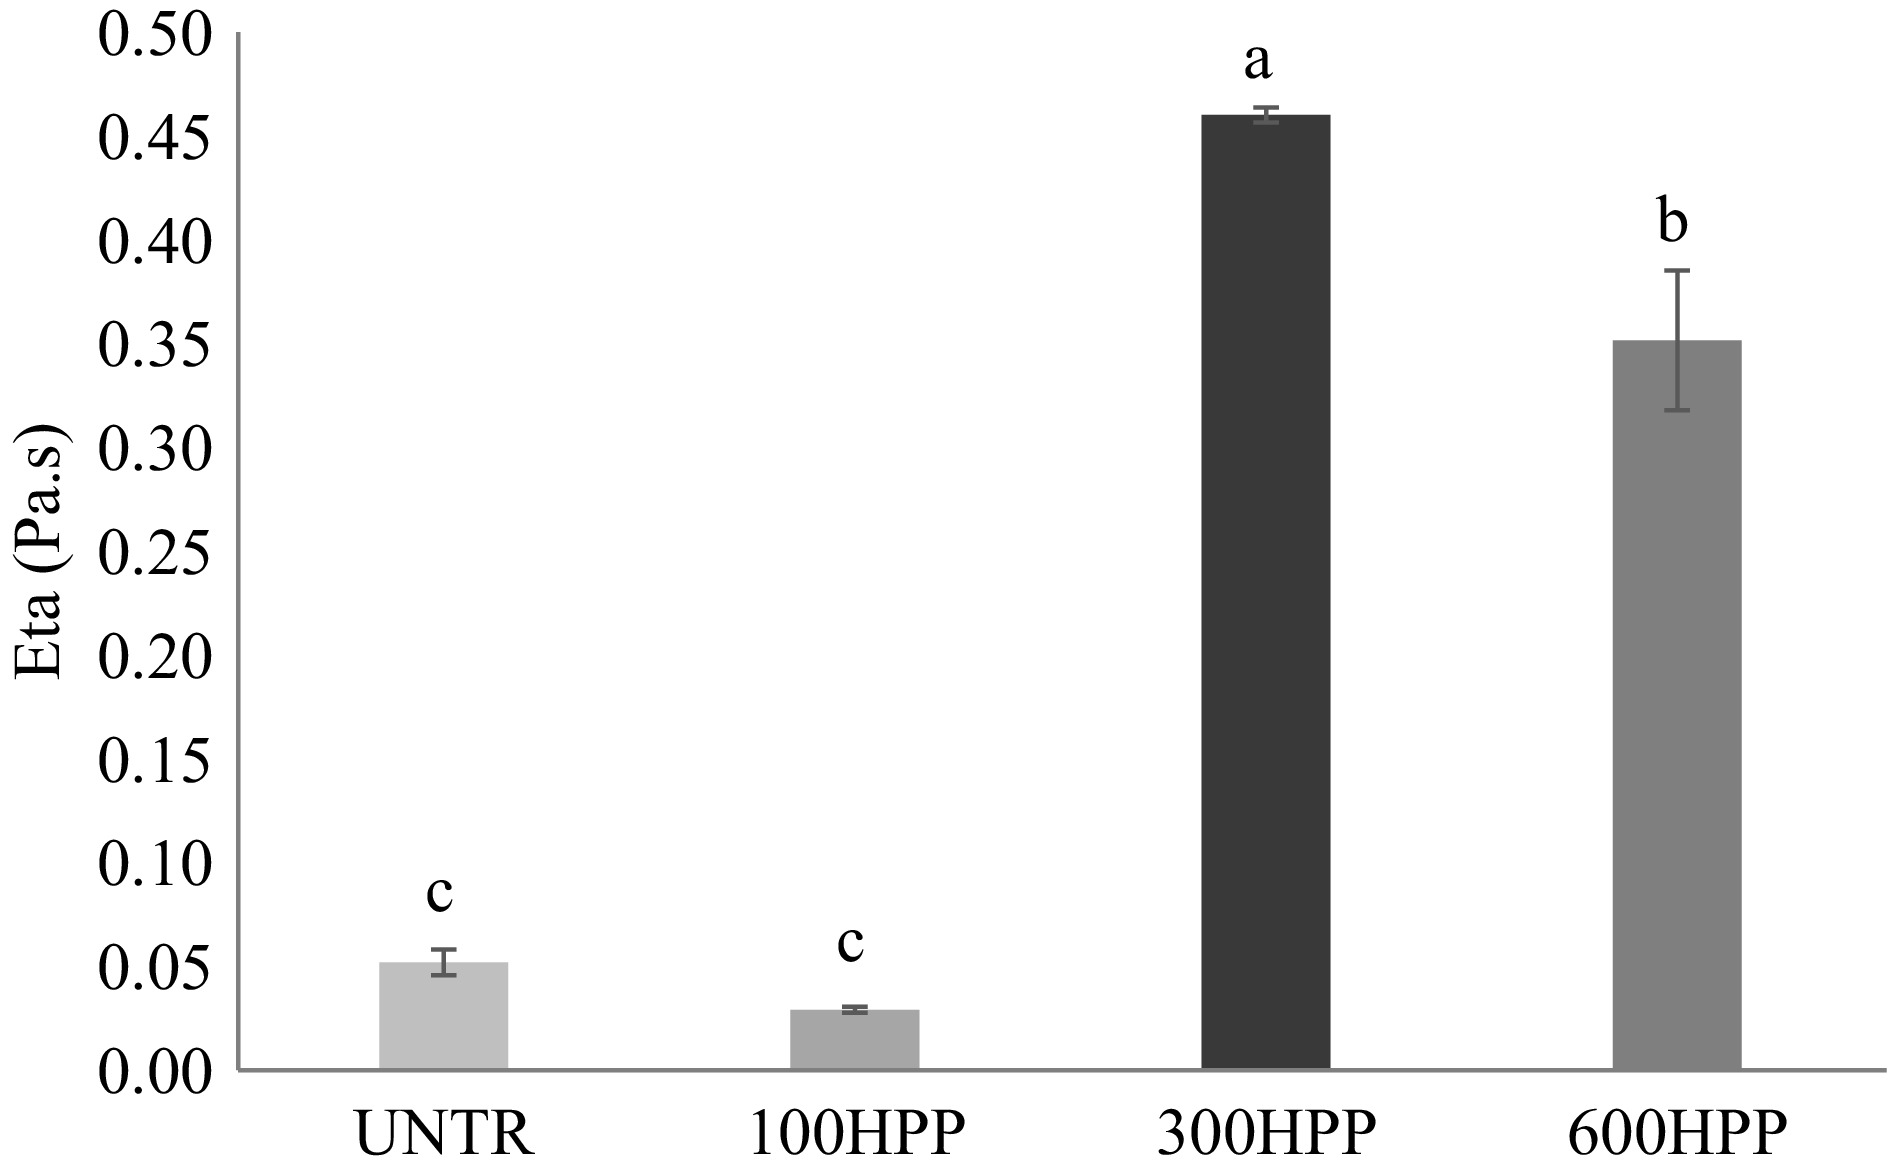
Figure 2.
Rheological properties of untreated and treated PF(< 300 µm) at 25 °C. Data are expressed as the mean ± standard deviation (n = 3). Means followed by different letters (a, b, c) differed significantly (p < 0.05). Legends: UNTR, untreated sample; 100HPP, 300HPP, and 600HPP, sampled treated by high-pressure processing.
Total antioxidant capacity of PF
-
Figure 3 illustrates the total antioxidant capacity of PF. Among all the treatments, the 100HPP sample (2.02 mmol Trolox/100 g) exhibited a significantly higher antioxidant capacity. In contrast, the UNTR, 300HPP, and 600HPP samples showed similar values (1.99 mmol Trolox/100 g), indicating no substantial improvement. Although previous studies have reported a significant enhancement in antioxidant capacity after HPP treatment[33,34], it is important to note that our study involved a two-step process: HPP followed by hot air drying. The additional drying step may have influenced the antioxidant properties by promoting the degradation or oxidation of antioxidant compounds, thereby counteracting the potential benefits of HPP.
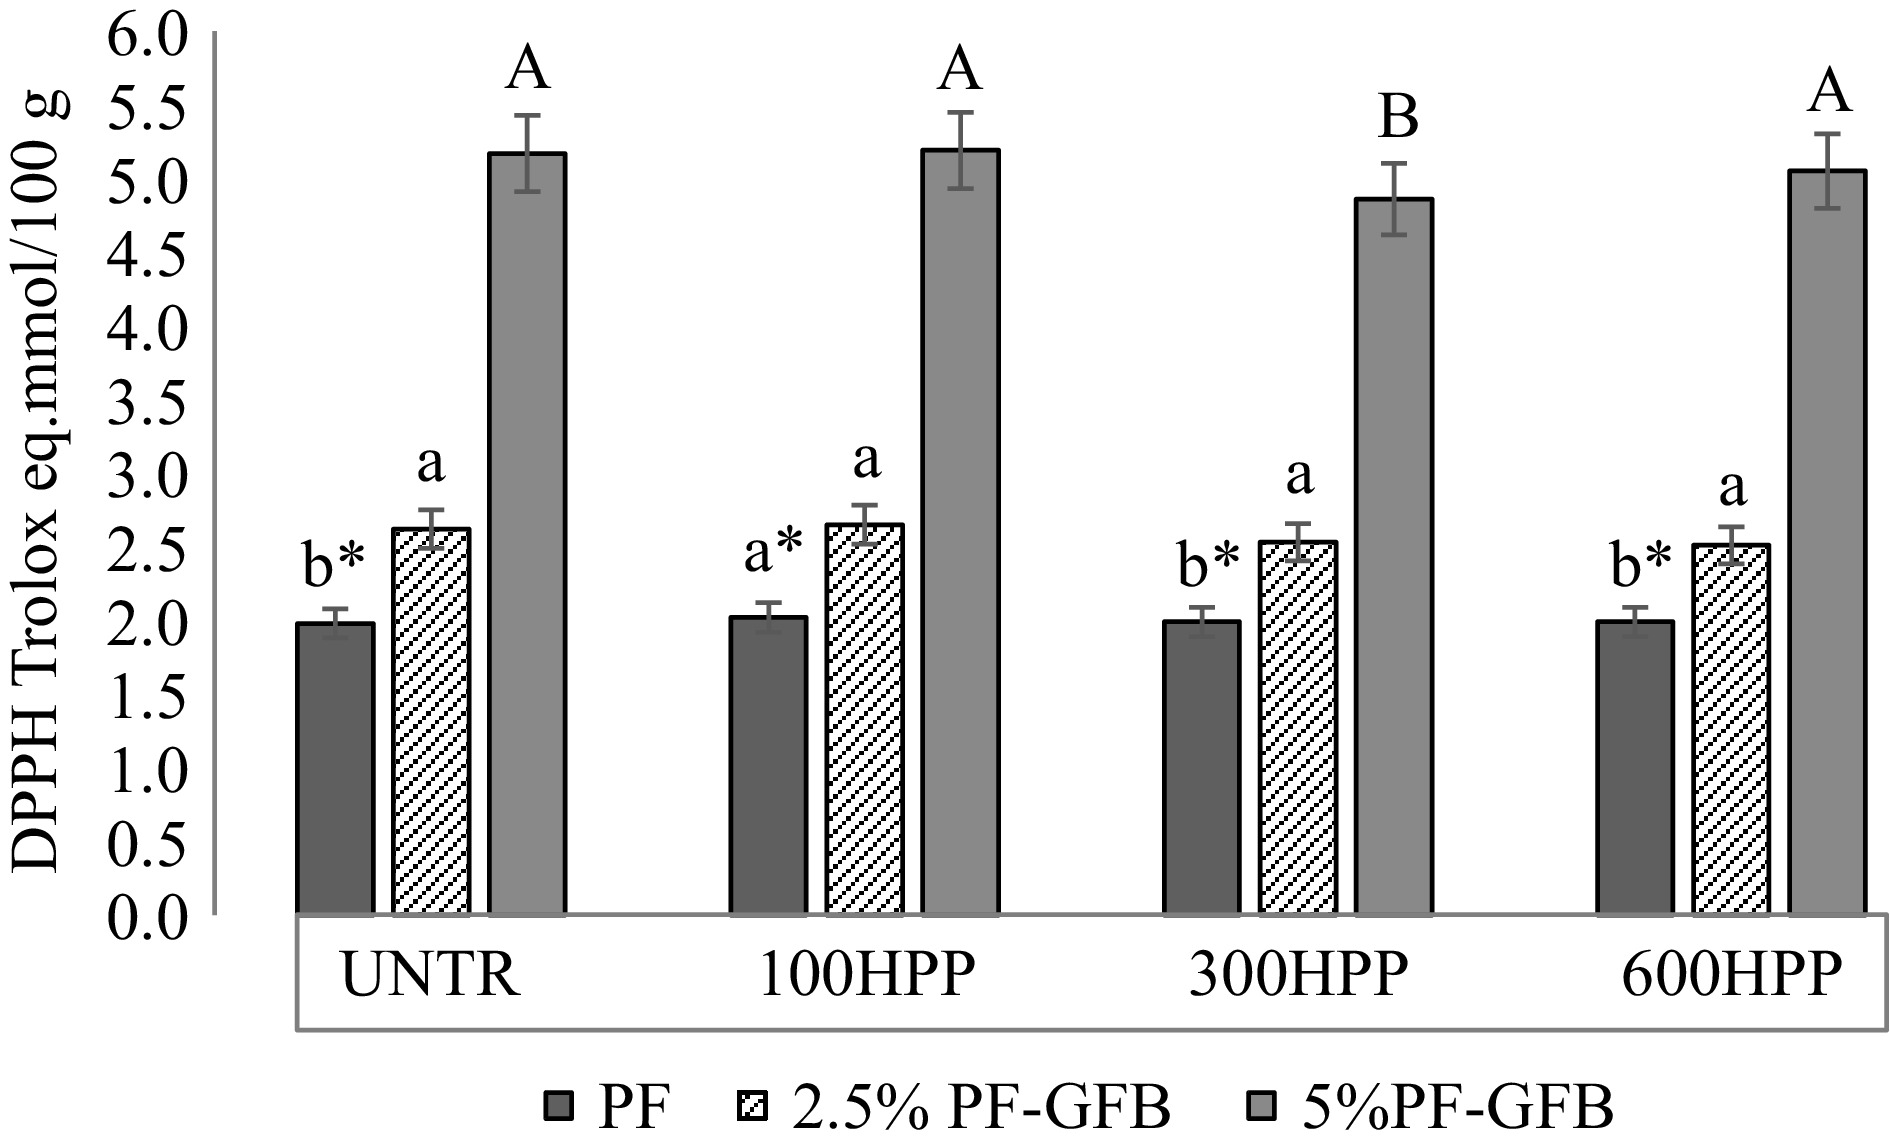
Figure 3.
Total antioxidant capacity of PF GFB made with untreated and treated PF. Data are expressed as the mean ± standard deviation (n = 3). Means in rows followed by different letters, namely (a*, b*) for for 2.5% PF GFB, and (A, B) for 5% PF GFB, differed significantly (p < 0.05) from each other accordign to Tukey's test. UNTR, untreated sample; 100HPP, 300HPP, and 600HPP, samples treated by high-pressure processing.
Quality analyses of GFB supplemented with PF
Specific volume of bread
-
Figure 4 illustrates the effect of PF on the specific volume of bread. The specific volume of the control GFB was 3.25 ± 0.05 mL/g, and this remained unchanged after 3 days of storage. The UNTR bread exhibited a higher volume than the pressure-treated samples; however, after 3 days of storage, the specific volume of the UNTR stored bread decreased with 2.5% PF, whereas the bread volume of HPP-treated samples (100HPP, 300HPP, and 600HPP) at Day 3 was higher than the fresh one at 2.5% PF.
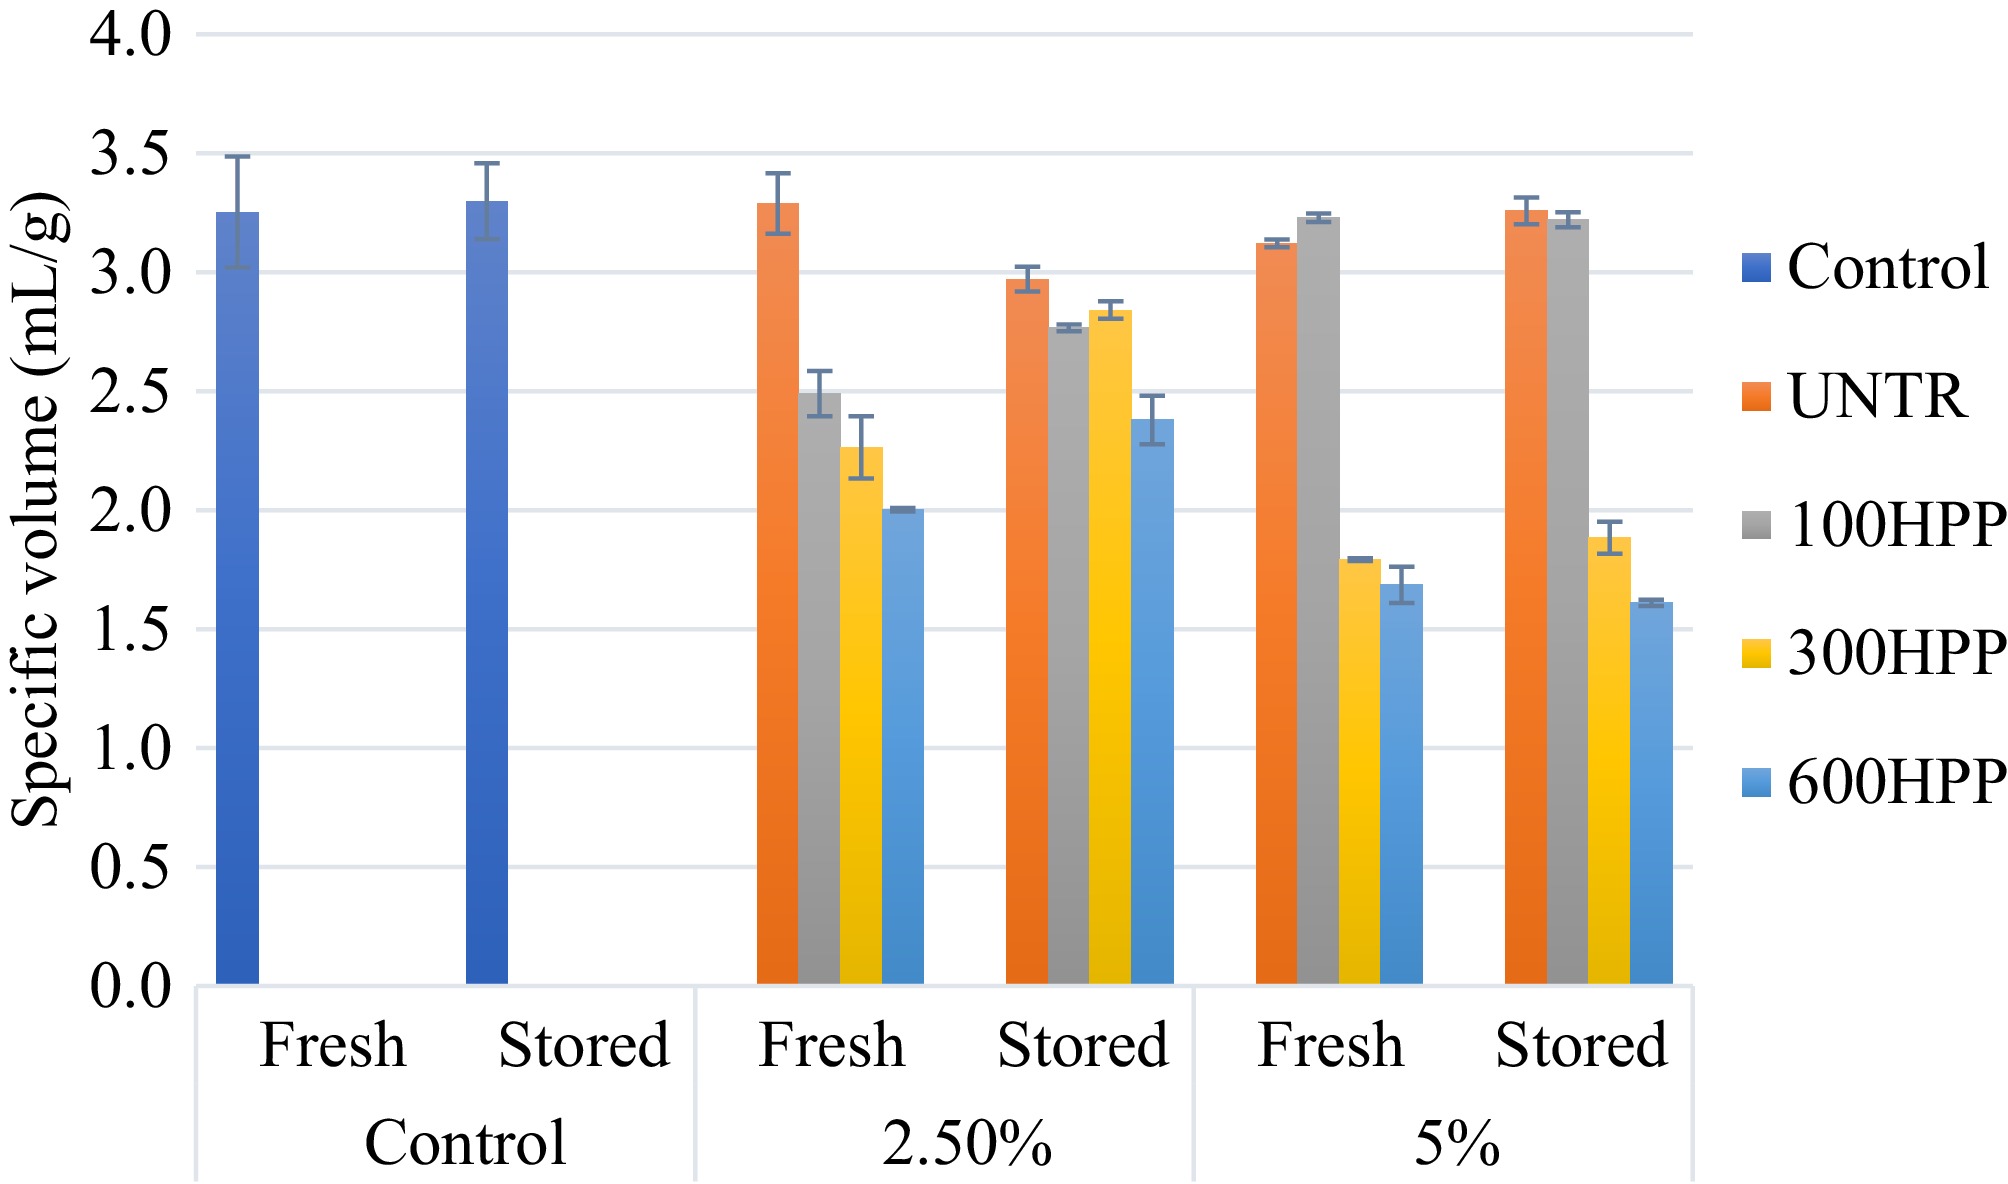
Figure 4.
Specific volume (mL/g) of gluten-free bread incorporating 2.5% and 5% of untreated and treated PF. Data are expressed as the mean ± standard deviation (n = 2). Control: without pumpkin flour; UNTR, untreated sample; 100HPP, 300HPP, and 600HPP: samples treated by high-pressure processing.
Although the fresh bread volume at a 5% PF concentration was slightly lower than that at 2.5%, it was interesting to note that the bread sample with 5% PF treated at 100HPP exhibited a higher specific volume than the 2.5% PF sample, both fresh and after storage. Additionally, no significant volume changes were observed in the 5% PF bread sample using 300HPP, either fresh or stored. However, the volume of the stored 600HPP bread at 5% PF was lower than that of the fresh one (Fig. 4). This could be attributed to the concentration of PF, the storage time, and the pressure treatment, which affect starch granules' availability and modification, and the solubilization of pectin, which influences water absorption[34,60]. In particular, high and low bread volumes can partly be attributed to the pore distribution; for example, larger or more evenly distributed pores can contribute to higher specific volume, although this relationship is not always linear. According to See et al.[15], increasing the amount of PF in bread reduces its specific volume. Overall, the UNTR and 100HPP samples at both concentrations and conditions (2.5% and 5% PF, fresh and stored) exhibited significantly greater specific volume values than the 300HPP and 600HPP samples. Probably, the higher WAI and viscosity, as well as the lower WSI values observed for the 300HPP and 600HPP flours (Table 1), limited the release of water from the crumb and caused premature crust formation that limited volume expansion as a consequence[37,61].
Instrumental color of the bread
-
The addition of PF considerably altered the bread's color profile, as well as the crust's color, as expected (Table 3). At 2.5% of PF, the crust color of the fresh GFB exhibited noticeable variation depending on the treatment applied; specifically, the crust color transitioned from light yellow-orange in the UNTR and 100HPP samples to darker yellow-orange in 300HPP and 600HPP. Furthermore, during the 3 days of storage, the crust's color intensity increased across all the samples compared with fresh crust; however, the differences observed were not statistically significant. However, an opposite trend was observed when PF was incorporated at a higher concentration (5%), as the fresh crust's color intensity was lower for 600HPP than in the UNTR, 100HPP, and 300HPP samples (Fig. 5). Furthermore, after 3 days of storage, the trend observed was similar to that of the fresh crust color (Table 3). According to See et al.[15], the higher color values in the crumb and the lower values in the crust are likely caused by the strong red and yellow hues of pumpkin flour. At 600 MPa (600HPP), the L* value decreased at both concentrations, whereas the a* value increased. Additionally, 100HPP exhibited significantly greater variation compared with 300HPP. The use of HPP-treated PF resulted in significant variations under both conditions and concentrations compared with the control bread and UNTR PF in GFB. In our study, higher pressures (≥ 600 MPa) led to gradual pigment degradation caused by oxidation during storage and structural disruption, exceeding the effects seen in 100HPP[62]. Additionally, water migration from the crumb to the crust during storage may enhance light reflectance, making the pigments appear more concentrated[63,64]. After 3 days of storage, the overall total color difference (ΔE) between all fresh bread samples with 2.5% and 5% PF decreased. Moisture loss and pigment deterioration over time may be the cause of this decrease in ΔE, even though high-pressure treatment initially aids in the preservation of natural pigments; storage can eventually cause pigment breakdown and less surface color variation, which lowers the ΔE values.
Table 3. Instrumental color of the crust and crumb of GFB made with untreated and treated pumpkin flour.
PF 0% 2.5% 5% Control UNTR 100HPP 300HPP 600HPP UNTR 100HPP 300HPP 600HPP Crust Day 0 L* 85.5 ± 0.6aA 78.9 ± 5.8ab 76.1 ± 9.5b 82.4 ± 0.6ab 80.5 ± 2.1ab 79.9 ± 2.0AB 78.5 ± 2.9B 75.5 ± 3.4B 67.7 ± 7.6C a* 0.81 ± 0.06Cd 1.7 ± 0.3c 2.8 ± 0.4a 2.5 ± 0.2ab 2.2 ± 0.18b 4.4 ± 0.6A 3.7 ± 0.4B 3.6 ± 0.1B 3.4 ± 0.29B b* 13.1 ± 0.3Cd 25.4 ± 2.3bc 24.2 ± 3.2c 27.4 ± 1.2ab 30.3 ± 1.7a 34.9 ± 2.3A 34.8 ± 3.0A 31.6 ± 1.9AB 31.2 ± 3.1B ΔE − − 6.3 ± 8.0a 4.3 ± 0.9c 5.6 ± 1.5b − 10.2 ± 2.4B 8.6 ± 1.0C 13.8 ± 6.1A Day 3 L* 83.7 ± 1.1aA 81.8 ± 0.8b 81.8 ± 0.8b 81.8 ± 1.19b 81.6 ± 0.8b 81.4 ± 1.1AB 80.8 ± 1.4AB 78.2 ± 2.3B 64.8 ± 5.4C a* 0.7 ± 0.09cD 2.2 ± 0.19ab 2.3 ± 0.1a 2.4 ± 0.2a 2.03 ± 0.2b 3.2 ± 0.2BC 3.6 ± 0.3A 3.03 ± 0.1C 3.3 ± 0.2B b* 13.1 ± 0.5dC 26.9 ± 0.7c 29.1 ± 0.5a 27.8 ± 0.42b 27.1 ± 0.59c 32.4 ± 1.2AB 33. ± 0.8A 33.6 ± 0.9A 31.5 ± 1.9B ΔE − − 2.4 ± 0.35a 1.3 ± 0.73b 0.9 ± 0.56c − 1.8 ± 0.85C 3.8 ± 1.83B 16.7 ± 1.6A Crumb Day 0 L* 72.4 ± 1.4abA 72.9 ± 2.5a 66.8 ± 2.5d 68.6 ± 2.9cd 69.9 ± 1.8bc 65.3 ± 3.1B 63.7 ± 5.1B 64.3 ± 1.52B 65.7 ± 2.2B a* 1.3 ± 0.2dC 1.9 ± 0.2c 3.5 ± 0.4ab 3.8 ± 0.6a 3.3 ± 0.2b 4.5 ± 0.5B 4.8 ± 0.7B 6.1 ± 0.4A 6.8 ± 1.1A b* 12.9 ± 0.9cC 34.3 ± 2.1a 34.0 ± 1.8a 31.5 ± 1.4b 33.4 ± 2.35ab 36.6 ± 3.8B 36.9 ± 5.8B 37.1 ± 1.6B 52.1 ± 2.2A ΔE − − 15.1 ± 1.6a 12.3 ± 2.62b 12.4 ± 1.95b − 20.5 ± 3.6C 31.7 ± 1.03A 30.4 ± 1.9B Day 3 L* 68.6 ± 2.5abA 70.0 ± 1.4a 67.5 ± 2.5b 66.3 ± 2.2b 68.04 ± 2.06ab 67.5 ± 1.3A 67.6 ± 1.4A 64.1 ± 1.5B 62.7 ± 1.29B a* 1.6 ± 0.3cC 2.6 ± 0.26b 3.3 ± 0.5a 2.9 ± 2.2ab 2.9 ± 0.46ab 4.6 ± 0.4B 4.8 ± 0.4B 7.01 ± 0.5A 7.1 ± 0.8A b* 14.8 ± 1.3cC 37.8 ± 1.2b 41.8 ± 1.4a 38.02 ± 1.7b 38.8 ± 1.8b 38.1 ± 1.5B 38.7 ± 2.1B 52.9 ± 1.13A 51.6 ± 1.8A ΔE − − 5.2 ± 1.8a 4.1 ± 2.1b 3.1 ± 1.6c − 2.3 ± 1.2C 15.4 ± 1.07A 14.5 ± 1.9B Data are expressed as the mean ± standard deviation (n = 10). Means in rows followed by different lowercase superscript letters (a, b, c, d) or different capital letters (A, B, C, D) differed significantly (p < 0.05) from each other according to Tukey's test. Legends: PF, pumpkin flour concentration; Control, without pumpkin flour; UNTR, untreated sample; 100HPP, 300HPP, and600HPP, samples treated by high-pressure processing. 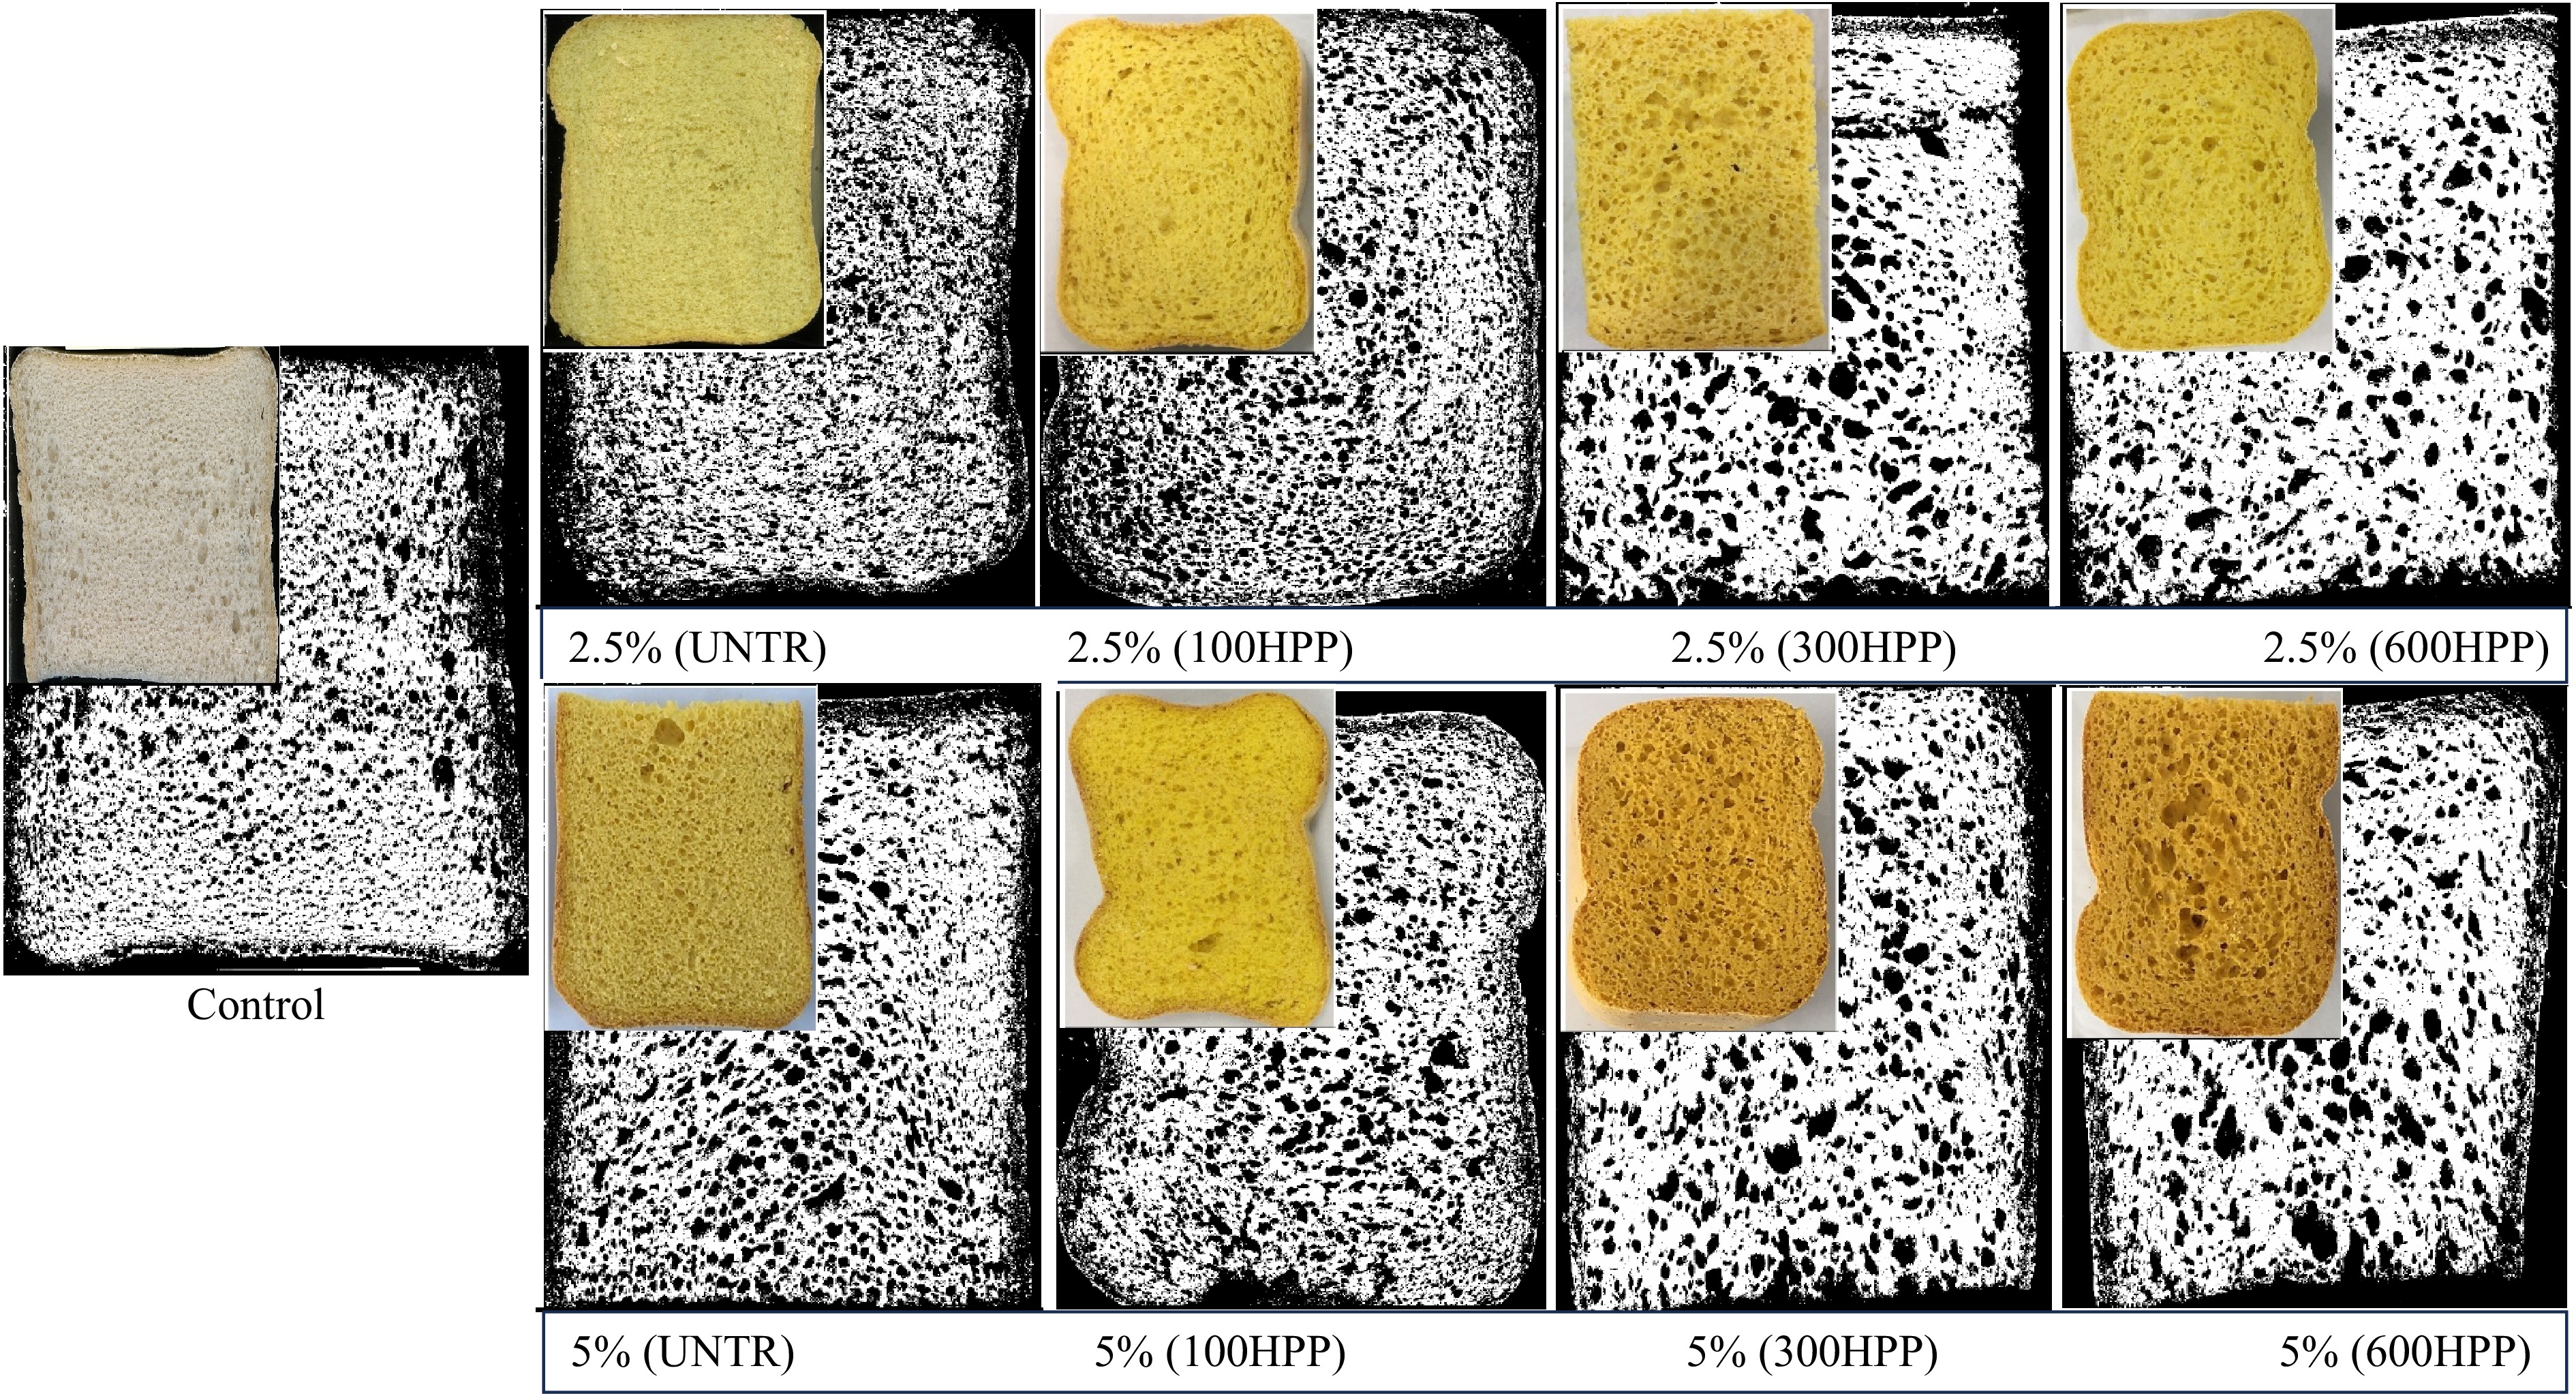
Figure 5.
Effect of adding PF and HPP on GFB. Scanned images showing the external appearance and internal crumb structure of GFB containing 2.5% and 5% PF. The control sample was prepared without pumpkin flour. UNTR refers to the untreated sample; HPP indicates samples treated at 100, 300, or 600 MPa.
Moisture content of bread
-
Moisture content and the amount of PF in bread are correlated (Table 4). At Day 0 and 2.5% PF, the control bread showed a higher moisture content in the crust than the 300HPP and 600HPP bread. The lower moisture content on the crust of 300HPP and 600HPP could explain the observed lower specific volume. At 5% PF, all the HPP-treated samples showed a significantly lower moisture content compared with the control (Table 4). Because PF contains higher dietary fiber[23] and slightly higher moisture than the GF mix, this substitution affects the dough's hydration and consistency. These observations indicate that even small substitutions of PF can influence the dough's moisture distribution and justify careful consideration of dough hydration when incorporating PF. In addition, HPP-induced modifications to the structure of cell walls, starch granules, and pectin solubility may increase the flour's ability to absorb and hold water[65].
Table 4. Moisture content (g/100 g) of fresh and stored GFB's crust and crumb.
Control UNTR 100HPP 300HPP 600HPP UNTR 100HPP 300HPP 600HPP 0% 2.5% 5% Crust Day 0 21.4 ± 0.5aA 17.8 ± 0.9ab 18.6 ± 2.0ab 16.4 ± 1.6b 16.8 ± 1.2b 14.2 ± 1.1C 16.1 ± 1.4BC 15.4 ± 0.3BC 16.9 ± 0.6B Day 3 20.5 ± 1.2bC 24.5 ± 0.9a 23.5 ± 1.4a 24.0 ± 0.8a 22.7 ± 0.4ab 24.9 ± 0.8AB 25.5 ± 0.4A 24.1 ± 1.0AB 22.4 ± 0.8BC Crumb Day 0 51.6 ± 0.5aA 50.0 ± 1.1ab 49.7 ± 0.6b 51.6 ± 0.1a 51.06 ± 0.4ab 49.3 ± 1.0ABC 48.4 ± 1.1BC 47.8 ± 1.1C 50.7 ± 0.7AB Day 3 51.3 ± 0.3bA 52.3 ± 0.1a 52.0 ± 0.1a 52.4 ± 0.04a 51.8 ± 0.3ab 50.4 ± 0.03A 48.6 ± 3.6A 49.0 ± 0.5A 49.1 ± 1.9A Data are expressed as the mean ± standard deviation (n = 3). Means in rows followed by different lowercase superscript letters (a, b, c) for 2.5% PF and uppercase letters (A, B, C) for 5% PF, focusing on 0 days and 3 days separately, significantly differ from each other by Tukey's test (p < 0.05). Legends: Control, without pumpkin flour; UNTR, untreated sample; 100HPP, 300HPP, and 600HPP, samples treated by high-pressure processing. Day 0: fresh bread; Day 3, stored crust and crumb. After 3 days of storage, the crust's moisture content notably increased in HPP-treated bread (2.5% and 5% of PF) (Table 4), likely caused by water migrating from the crust to the crumb, resulting from a lower moisture content at Day 0 and a higher gradient as a consequence. The crumb showed stable moisture content values. ON the contrary, See et al.[15] stated that increasing the PF concentration did not raise the crumb's moisture content.
Texture attributes of bread
-
Crumb hardness is a frequent sign of bread staling, and it has a negative relationship with bread quality[66]. A significant increase in crumb texture was observed with an increase in the pressure used for treating fresh pumpkin to produce PF. At Day 0, the highest crumb hardness values were recorded for 600HPP samples at both 2.5% and 5% PF (Table 5), followed by 300HPP, 100HPP, the control, and UNTR. The highest hardness in the 600HPP samples (at Day 0) can be attributed to pressure-induced structural changes, including cell wall disruption and modification of starch and pectin. These changes likely strengthened the crumb matrix, restricted gas-induced cell expansion during baking, and reduced moisture mobility, leading to a denser and firmer crumb structure. After 3 days of storage, a significant increase in hardness was observed for all samples, as expected. Furthermore, increases in hardness were recorded for the UNTR samples after 3 days of storage, with a hardness that was not significantly different from the other PF samples. Similar findings were reported by Różyło et al.[67], where the addition of pumpkin pulp resulted in an increase in both the hardness and chewiness of the breadcrumbs. The results are in disagreement with Gutiérrez et al.[37], who reported a noticeable increase in crumb hardness and staling in breads made with HPP-treated flours.
Table 5. Means of texture attributes of GFB's crust and crumb made with untreated and treated PF.
Control UNTR 100HPP 300HPP 600HPP UNTR 100HPP 300HPP 600HPP 0% 2.5% 5% Crumb TPA Hardness (N) Day 0 2.7 ± 0.5bcC 1.8 ± 0.4c 3.4 ± 1.0b 3.0 ± 1.2b 10.4 ± 1.3a 2.7 ± 0.5C 2.7 ± 0.8C 7.4 ± 1.0B 10.7 ± 2.0A Resilience 47.5 ± 4.1aA 39.8 ± 3.6bc 44.9 ± 4.8ab 44.3 ± 3.5a 38.4 ± 3.6c 36.7 ± 4.1B 45.5 ± 4.2A 35.7 ± 2.5BC 32.93 ± 3.3C Cohesiveness 0.7 ± 0.03aA 0.7 ± 0.04ab 0.7 ± 0.05b 0.7 ± 0.04ab 0.6 ± 0.04c 0.6 ± 0.04B 0.7 ± 0.05A 0.6 ± 0.03C 0.5 ± 0.03C Springiness 99.3 ± 1.5aA 97.4 ± 0.9b 98.8 ± 0.5ab 98.7 ± 0.6a 96.5 ± 1.01c 98.4 ± 0.8AB 98.1 ± 1.0B 97.3 ± 0.53BC 96.6 ± 1.2C Chewiness 2.0 ± 1.2bC 1.2 ± 0.8c 2.4 ± 0.9b 2.1 ± 0.8b 6.2 ± 1.0a 1.7 ± 0.6C 1.9 ± 0.8C 4.3 ± 1.2B 5.7 ± 0.7A Hardness (N) Day 3 3.1 ± 1.3cC 4.5 ± 1.6bc 4.5 ± 1.1bc 3.9 ± 1.4bc 14.9 ± 2.1a 4.7 ± 1.6C 4.3 ± 2.2C 16.5 ± 3.0B 19.4 ± 3.0A Resilience 21.6 ± 5.5aA 16.4 ± 2.5b 16.7 ± 3.3ab 18.3 ± 2.7ab 14.4 ± 2.7b 12.2 ± 2.0B 12.8 ± 3.4B 11.1 ± 0.9B 13.3 ± 2.04B Cohesiveness 0.4 ± 0.07aA 0.3 ± 0.03b 0.3 ± 0.05b 0.3 ± 0.04ab 0.3 ± 0.04b 0.2 ± 0.03B 0.2 ± 0.06B 0.2 ± 0.09B 0.2 ± 0.03B Springiness 94.3 ± 2.0aA 90.5 ± 2.0b 91.0 ± 1.6b 88.2 ± 5.5bc 88.3 ± 2.6b 80.3 ± 4.3B 82.6 ± 6.5B 79.2 ± 6.2B 83.9 ± 4.6B Chewiness 1.4 ± 0.7aA 1.5 ± 0.6a 1.5 ± 0.8a 1.3 ± 0.7a 1.4 ± 0.9a 1.0 ± 0.6A 0.9 ± 1.5A 2.8 ± 0.7B 4.0 ± 1.0A Crust Penetration Force (N) Day 0 2.53 ± 0.03aBC 3.10 ± 0.01a 2.71 ± 0.91a 2.89 ± 0.80a 2.35 ± 0.63a 6.063 ± 1.71A 3.07 ± 0.68B 2.87 ± 0. 74B 1.75 ± 0.45C Day 3 1.75 ± 0.39bD 1.94 ± 0.50b 1.83 ± 0.41b 2.16 ± 0.33b 2.81 ± 0.71a 2.16 ± 0.58D 3.01 ± 0.83B 3.88 ± 1.09A 2.89 ± 0.60BC Distance (mm) Day 0 2.9 ± 0.5bcA 3.4 ± 0.9b 2.3 ± 0.4c 3.4 ± 1.0b 4.4 ± 0.7a 2.4 ± 0.6A 2.2 ± 0.7A 2.3 ± 0.5A 2.8 ± 1.5A Day 3 2.9 ± 1.3bA 4.3 ± 0.07a 4.2 ± 0.78a 4.0 ± 0.9a 4.0 ± 0.9a 4.0 ± 1.1A 3.7 ± 1.3A 3.3 ± 1.3A 3.3 ± 0.8A Data are expressed as the mean ± standard deviation (n = 10). Means in rows followed by different lowercase superscript letters (a, b, c, d) for 2.5% PF and different capital letters (A, B, C, D) for 5% PF differed significantly (p < 0.05) from each other according to Tukey's test. Legends: Control, without pumpkin flour; UNTR, untreated sample; 100HPP, 300HP, and 600HPP, samples treated by high-pressure processing. Day 0, fresh bread; Day 3, stored crust and crumb. Other texture parameters, including resilience, cohesiveness, and springiness, showed significant reductions after 3 days of storage compared wtih fresh samples at both the 2.5% and 5% PF concentrations. Notably, at Day 0, the highest resilience values were observed in the control and 100HPP samples for 2.5% and 100HPP for 5% (Table 5). HPP-treated pumpkin may have altered moisture retention properties through structural, starch, and pectin changes (the ability to absorb and hold water), leading to less moisture loss and partial starch gelatinization during baking[33,34], which could contribute to a more compact, denser texture. This could result in the bread crumb becoming firmer and more resistant to deformation than the control.
Concerning the crust texture, at 2.5%, no significant differences were observed. However, the 5% UNTR sample exhibited the highest force value, whereas the lowest force values were observed for the control and 600HPP samples. Over a storage period of 3 days, the crust's force values gradually decreased through water migration, with differences between samples demonstrating an effect of PF treatment on water migration. According to the overall texture results, the 5% PF GF bread could meet the requirements for a soft texture, which is a desirable attribute in bread[15].
Crumbs' pore distribution as determined by image analysis
-
Figure 6 shows the scanned images analysis of PF GFB prepared with 2.5% and 5% PF. In this study, statistical analysis revealed no significant differences in some classes; therefore, the final results were based on Class 1 (< 0.2 mm2) and Class 3 (1–10 mm2). At a 2.5% PF concentration, a higher percentage of pore frequency distribution was observed in the UNTR, control, and 100HPP bread samples compared with the 300 and 600HPP samples in fresh bread at the < 0.2 mm2 object size. However, at the same object size but with 5% PF, the 300HPP and 600HPP samples exhibited a higher pore frequency, as a consequence (Fig. 5).
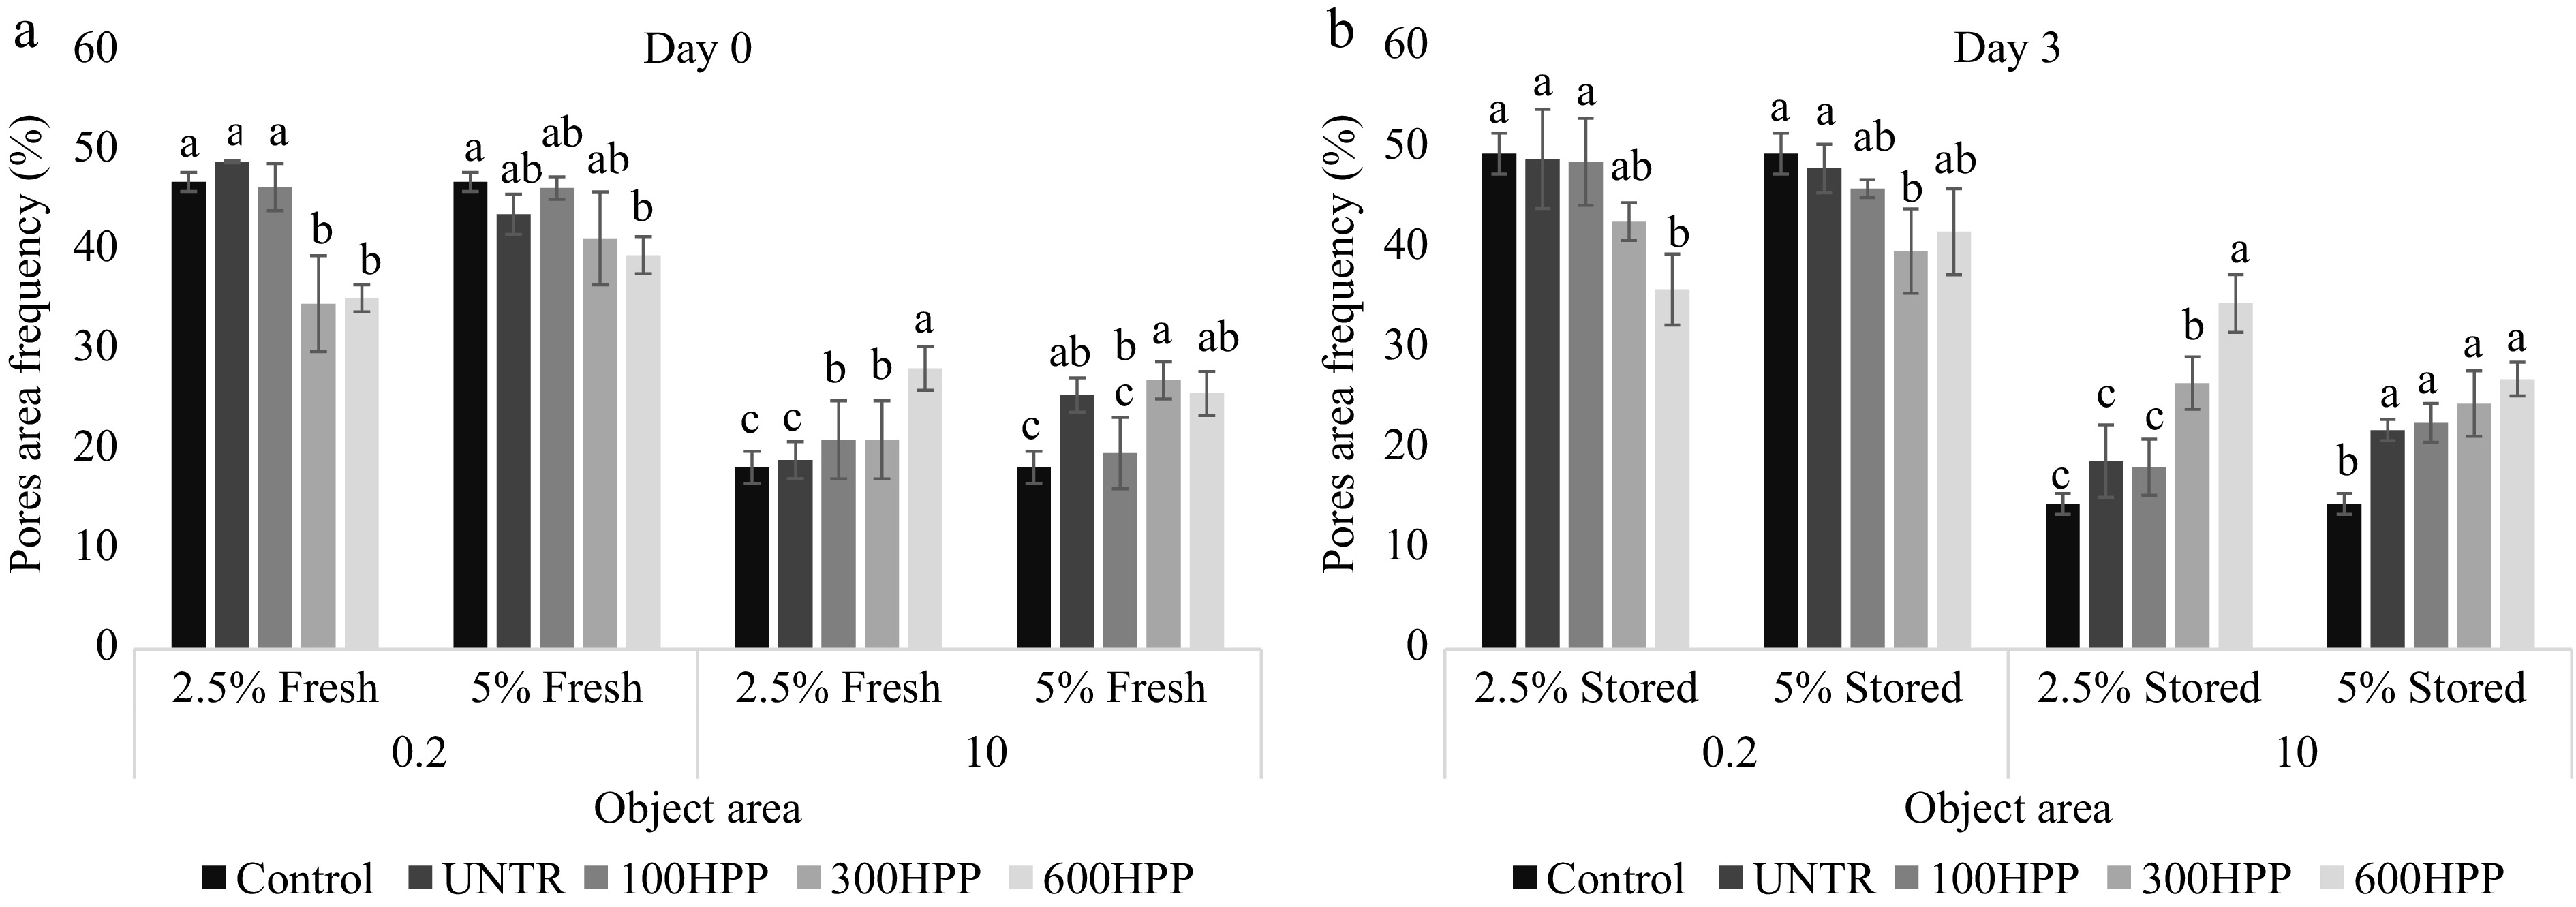
Figure 6.
Pore area frequency (%) fractions of GFB (2.5% and 5% PF concentrations) for < 0.2 and 1.0–10 (mm2) objects. Data are expressed as the mean ± standard deviation (n = 3). Means in rows followed by a different letter (a, b, c) differed significantly (p < 0.05) from each other according to Tukey's test. Legends: Control, without pumpkin flour; UNTR, untreated sample; 100HPP, 300HPP, and 600HPP, samples treated by high-pressure processing. (a) Day 0, fresh bread; (b) crust and crumb after 3 days of storage.
For the 1.0–10 mm2 object size, the 600HPP sample showed a higher percentage of pore frequency for both the 2.5% and 5% PF concentrations compared with the other samples. This trend persisted after storage, as illustrated in Fig. 6a, b, likely caused by the viscosity and viscoelastic properties of PF. The overall crumb structure, including pore size, distribution, and connectivity, plays a key role in loaf expansion, wheras other factors such as ingredient composition and storage conditions also significantly affect bread's volume, texture and pore distribution. The same result was found by Demirkesen et al.[68] in a study on chestnut flour, as the larger fiber content of chestnut flour improves the viscoelastic characteristics and allows more air bubbles to be trapped in GFB, and this study also reported that chestnut flour-containing bread had higher pore area fractions compared with rice bread.
Total antioxidant capacity of GF bread
-
The total antioxidant capacity of bread enriched with PF is shown in Fig. 3. For GF bread with 2.5% PF, no significant differences were observed among the samples. However, at the 5% PF concentration, the total antioxidant capacity of UNTR (5.17 mmol Trolox/100 g), 100HPP (5.19 mmol Trolox/100 g), and 600HPP (5.05 mmol Trolox/100 g) showed the highest values, with the lowest value for 300HPP (4.86 mmol Trolox/100 g). In general, total antioxidant capacity was not significantly affected by pressure; however, it increased with higher levels of the PF formulation. Interestingly, Wahyono et al.[40] reported that incorporating pumpkin powder into bread significantly increased its antioxidant activity, as measured by DPPH radical scavenging, with a minimum addition of 5% pumpkin powder enhancing antioxidant levels compared with the control, with the highest activity (76.59%) observed at 20% pumpkin powder, whereas the control showed the lowest (62.10%). Overall, PF played a key role in enhancing the antioxidant properties of GFB.
-
The application of HPP to fresh pumpkin (at 100, 300, and 600 MPa for 3 min) resulted in the production of PF with improved techno-functional characteristics. The < 300-µm fraction of PF was selected for analyses of the physicochemical, techno-functional, antioxidant, and rheological properties. The HPP treatments significantly impacted the composition and characteristics of PF, with higher pressures (300 and 600 MPa) leading to increased moisture content, water activity, starch, and pectin extractability, as well as changes in WAI and WSI, compared with the UNTR samples. Moreover, pressure treatments greatly influenced the viscosity and color of PF. Bread produced with 5% PF resulted in decreased specific volume and increased crumb hardness, but higher total antioxidant capacity at higher pressure treatments than those with 2.5%. These findings suggest that 100 and 300 MPa are the most effective HPP conditions for pretreating PF to be incorporated into GFB, providing a balanced improvement in both technological and nutritional quality.
These results highlighted the potential of PF, particularly when pretreated with HPP, as a valuable functional ingredient in GFB. Further research should explore the supplementation of PF in other products to enhance their nutritional composition while preserving or even improving their technological and/or physicochemical quality, and could open new opportunities for developing healthier and more nutrient-dense products.
This research did not receive any specific grant from public, commercial, or not-for-profit funding agencies. The authors sincerely thank the University of Parma, Italy, for their valuable support and resources, which greatly facilitated the completion of this study.
-
The authors confirm their contributions to the paper as follows: conceptualization, methodology, data curation, resources, writing – original draft: Dhenge R; visualization, supervision: Rodolfi M; writing – review and editing: Rinaldi M, Ganino T. All authors reviewed the results and approved the final version of the manuscript.
-
The data supporting the findings of this study are available upon reasonable request.
-
The authors declare that no competing interests are associated with this paper, and no substantial financial support or personal relationship could have influenced its results.
- Copyright: © 2026 by the author(s). Published by Maximum Academic Press on behalf of China Agricultural University, Zhejiang University and Shenyang Agricultural University. This article is an open access article distributed under Creative Commons Attribution License (CC BY 4.0), visit https://creativecommons.org/licenses/by/4.0/.
-
About this article
Cite this article
Dhenge R, Ganino T, Rodolfi M, Rinaldi M. 2026. The application of high-pressure processing to improve pumpkin flour's characteristics and utilization in gluten-free bread. Food Innovation and Advances 5(2): 329−340 doi: 10.48130/fia-0026-0027 

The application of high-pressure processing to improve pumpkin flour's characteristics and utilization in gluten-free bread
- Received: 14 November 2025
- Revised: 19 January 2026
- Accepted: 27 March 2026
- Published online: 30 June 2026
Abstract: This study evaluated the effect of high-pressure processing (HPP; 100, 300, and 600 MPa) on fresh pumpkin (Curcubita moschata) used to produce pumpkin flour (PF), and the impact of PF supplementation (2.5% and 5%) on gluten-free bread's quality. The physicochemical, techno-functional, antioxidant properties of the bread were analyzed over 3 days of storage. PF treated at 300 and 600 MPa had more particles < 300 µm, moisture, water activity, and starch–pectin than raw pumpkin (UNTR) and that treated at 100 MPa. The water absorbtion index was highest at 300 MPa, whereas UNTR and PF treated at 100 MPa had a higher water solubility index. All Commission Internationale de l'Eclairage (CIE) color parameters of PF were significantly affected by HPP. The apparent viscosity of PF increased at 300 and 600 MPa because of changes in starch and pectin. A higher specific volume was seen in in UNTR and 100 MPa-treated PF breads at 5% PF than in breads with 600 MPa-treated PF and 2.5% PF. Color intensity was lowest at 600 MPa and decreased further after 3 days. Bread hardness was higher under the 600 MPa treatment at both Day 0 and Day 3. Pore frequency was highest in 600 MPa PF bread at 10 mm2 and lowest at 0.2 mm2. At 5% PF, total antioxidant capacity was lowest under the 300 MPa treatment, with no differences at 2.5% PF. Overall, the inclustion of 5% PF pretreated at 100 or 300 MPa provided a satisfactory balance of technological quality in bread.
-
Key words:
- Functional ingredient /
- Emerging technology /
- Baked food /
- Physico-chemical properties /
- Shelf-life