













-
Peaches (Prunus persica) originated and were domesticated in China[1] and have been in cultivation for over 4,000 years. Peaches are highly favored by consumers because of their attractive appearance, unique aroma, and nutritional and economic value[2,3]. Consequently, they have become one of the most popular fruits worldwide[4]. For decades, breeders have prioritized high yield and disease resistance as primary breeding objectives. This has led to the phenomenon of 'peaches lacking peach flavor'[5], as seen in the stony-hard peach type, which releases almost no aromatic compounds during ripening[6]. In contrast, MF peaches soften rapidly during ripening, resulting in a relatively short harvest window and shelf-life[2]. The SMF trait, which combines the advantages of being 'firm and crisp at ripening' and 'slow-melting after harvest', is a preferred option for balancing fruit texture and flavor. SMF peaches, characterized by relatively high storability and transportability as well as a rich aroma, represent a future trend in peach breeding[7].
Flavor is a crucial element of peach quality, and it is generally composed of aroma and taste[8]. Aroma is a crucial factor in consumers' food preferences[6] and has become an increasingly important focus in fruit breeding programs. In fruit crops, identifying genes responsible for the biosynthesis of volatile organic compounds holds great promise for accelerating fruit flavor improvement[9]. The flavor of modern commercial peach cultivars has significantly declined, which has become a severe problem for both the peach industry and consumers. Therefore, knowing the formation of peach flavor is vital for the genetic improvement of commercial cultivars[10]. The electronic nose can differentiate the overall information of volatile components in samples[11], while GC-MS technology can help researchers analyze the volatile compounds in fruit both qualitatively and quantitatively[12]. More than 100 aroma compounds have been found in peach fruit. Fruit volatiles are secondary metabolites[2]. Lactones are the key components of peach fruit aroma, contributing typical peach-like, creamy, and coconut flavors[13]. Among these, γ-decalactone and δ-decalactone are key substances[12]. The electronic nose can compensate for the subjectivity of sensory evaluation and quantify taste attributes such as sweetness, umami, and bitterness[14]. Flavor profile analysis of yellow peaches revealed that volatile compounds associated with sensor W1C exhibited a grassy aroma, while those linked to sensors W1S and W2S demonstrated a fruity aroma[15].
Currently, research on SMF peach focuses more on identifying which genes regulate the SMF trait. For example, SMF peach 'Big Top' maintained relatively high firmness during the early ripening stage and released ethylene to soften the fruit at its later ripening stage[16]. Comparing firmness changes during ripening between the SMF peach S11-8 and the non-SMF peach M12-10 revealed that S11-8 underwent softening during ripening, but its complete softening occurred later[17]. Comparing post-harvest firmness and ethylene changes between the SMF peach 'Big Top' and MF peach 'Bolero' revealed that the final firmness of the two cultivars was similar, but ethylene release in 'Big Top' was delayed by 5 d[16]. By analyzing the phenotypic data of F1 hybrid offspring, interval mapping (IM) and the Kruskal–Wallis test revealed that qP-MD5 was the core locus that was associated with SMF attributes[7]. In SMF peach, high levels of the receptor protein kinase THESEUS 1 (PpTHE1) inhibit the activity of ethylene response factor (PpERF61) and pectate lyase (PpPL15), thereby suppressing fruit softening[18].
It is essential to explore the genetic mechanisms of SMF peaches and to study their flavor changes during ripening. This will help to better define the characteristics of SMF peaches and apply this knowledge more effectively in breeding and production practices. Consequently, it will enable the development of additional SMF peach cultivars and also enrich the diversity of peach cultivars. In this study, electronic sensory analysis was performed on the SMF peach cultivar 'XM' to identify its key sensory characteristics. The key metabolites during its ripening process were determined by using GC-MS. Finally, key differentially expressed genes related to VOCs were identified through transcriptome analysis.
-
A novel white-fleshed, slow-melting peach cultivar 'Xia Mi' ('XM'), from Shanghai Academy of Agricultural Sciences (SAAS), China (31°29′ N, 121°39′ E), was used in this study. All fruit trees were grown and managed uniformly in the Peach Germplasm Repository of SAAS. Ten healthy fruit of uniform size and consistent color were harvested at 115, 119, 124, 126, 127, 128, 129, 130, and 131 d after full bloom (DAF) (Fig. 1). After the sampled fruit was transported to the laboratory, each fruit was measured individually for physiological indicators, including fruit weight, total soluble solids content (TSS, in Brix unit), ethylene release, fruit firmness, and peel color. Meanwhile, the mesocarp of 10 fruit from each stage was collected, frozen in liquid nitrogen, pooled, and stored in a −80 °C freezer for later multi-omics analysis. Based on statistical analysis of physiological indicators, six ripening stages were finally selected for fruit quality evaluation. They were recorded as r1 (115 DAF), r2 (119 DAF), r3 (124 DAF), r4 (129 DAF), r5 (130 DAF), and r6 (131 DAF), respectively. r1 represented the color transition period, and r3 was the typical commercial harvesting stage for this cultivar, while r4−r6 spanned the climacteric ripening phase. Three intermediate time-points (126−128 DAF) were omitted due to minor phenotypic and metabolic fluctuations.
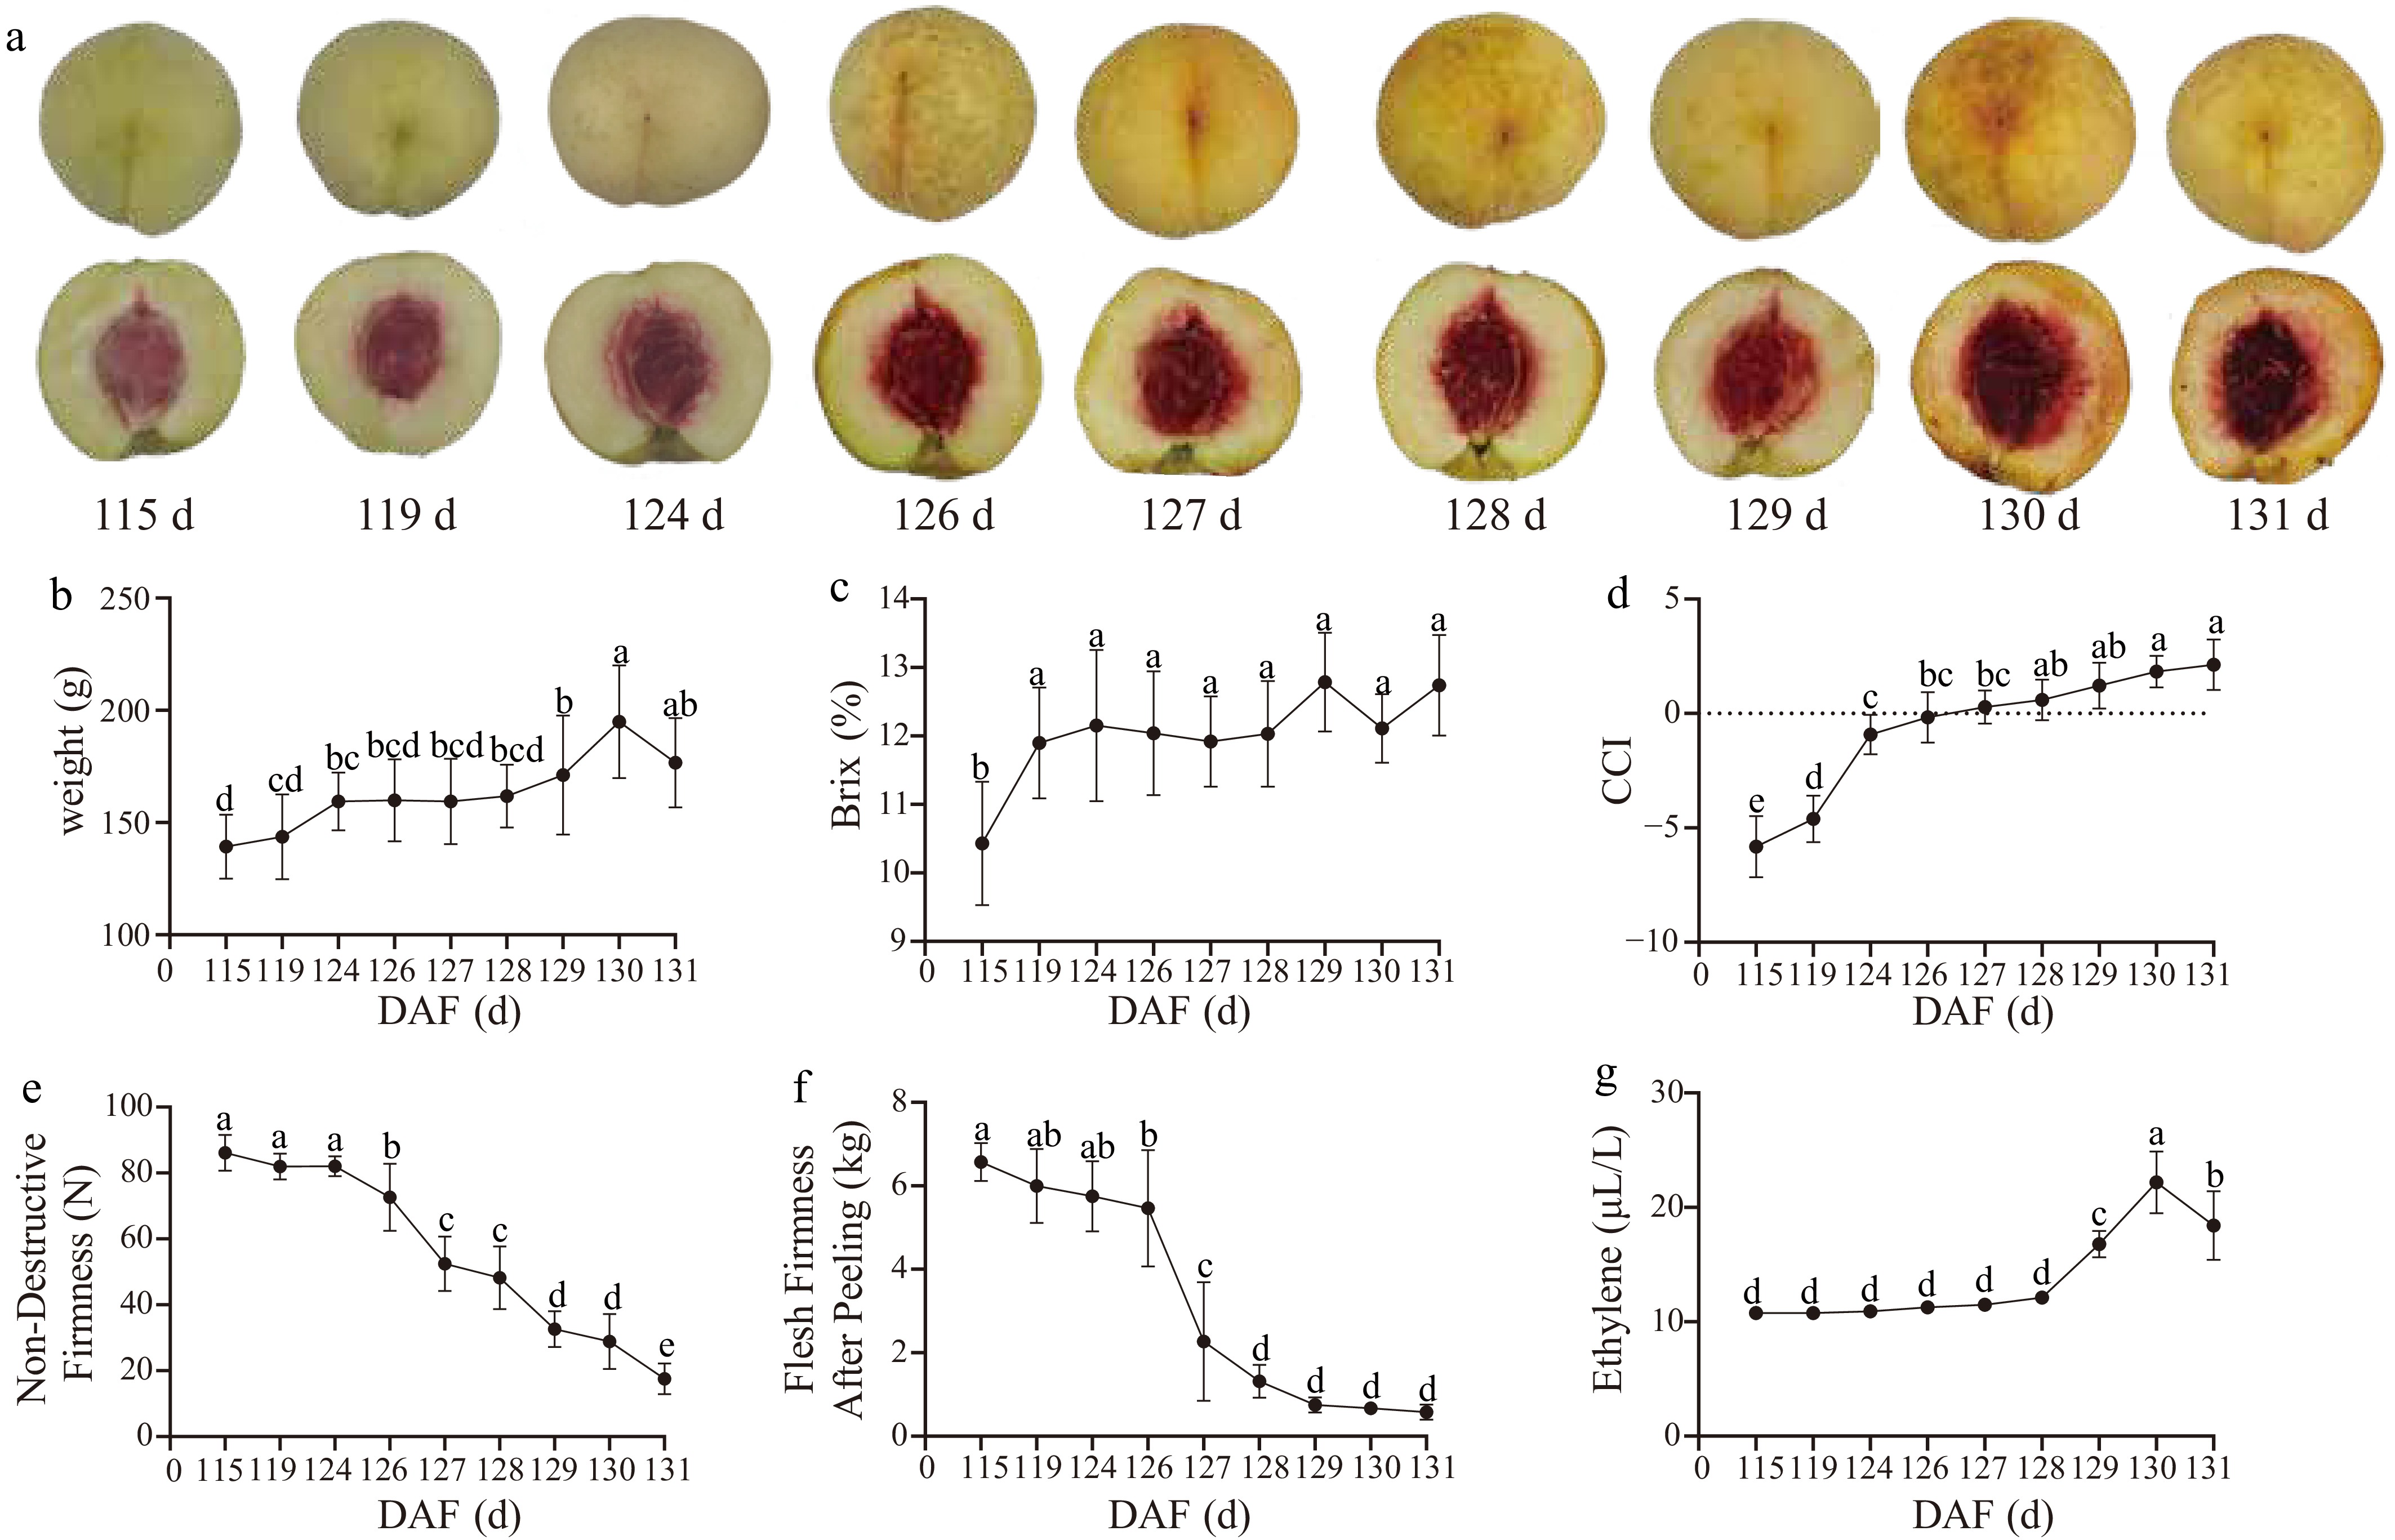
Figure 1.
Phenotype of 'XM'. (a) 'XM' at different ripening stages. (b) Weight of 'XM' at different ripening stages. (c) Brix of 'XM' at different ripening stages. (d) CCI of 'XM' at different ripening stages. (e) Non-destructive firmness of 'XM' at different ripening stages. (f) Flesh firmness after peeling of 'XM' at different ripening stages. (g) Ethylene release of 'XM' at different ripening stages.
Chemicals used in this study
-
A total of 44 standard chemicals bought from Sigma (Shanghai, China), 34 standard chemicals bought from Yuanye (Shanghai, China), and one standard chemical bought from Solarbio (Beijing, China) were used for targeted quantification. Detailed information about each standard chemical is listed (Supplementary Table S1).
Fruit ethylene content and quality determination
-
Ethylene content was determined by using a portable gas analyzer (Felix F-950 Three Gas Analyzer, USA). Non-destructive fruit firmness was measured by using a durometer (Baxlo, 53505/FA, Barcelona, Spain). Flesh firmness after peeling was determined by using a fruit texture analyser (FTA-GS20, South Africa). Total soluble solids content was determined by using a pocket refractometer (ATAGO-PAL-1, Japan). Chromatic aberration was measured using a chroma meter (KONICA MINOLTA, CR-400, Japan). CIE calculations were performed according to McGuire[19]. The Color Confusion Index (CCI) was determined as CCI = 1,000 × a*/(L* × b*).
Electronic sensory measurement
-
Sample preparation and instrumental settings for the E-nose experiment were as described in Wang et al.[20].
The electronic tongue (SA402B type, Intelligent Sensor Technology Co. Ltd, Japan) was used to determine taste variation in 'XM' at different ripening stages. The system has six chemical sensors, which are AE1, AAE, CAO, COO, CTO, and GL1. These sensors are sensitive to astringency, umami, sourness, bitterness, saltiness, and sweetness, respectively. Sample pretreatment and detection for the E-tongue were based on Liu et al.[15]. A 50 g sample was weighed into a beaker, which was then mixed with 100 ml of pure water and stirred thoroughly. The mixture was then placed into a centrifuge at 3,000 rpm for 10 min. After the centrifuging process, the supernatant of the mixture was collected for E-tongue testing.
VOC measurement
-
Sample preparation and instrumental parameters were set as described in Wang et al.[20]. Fiber solid-phase microextraction (SPME) was performed using the MACRO SPME-04-V2 program.
Non-volatile metabolites measurement
-
Sample preparation and instrumental parameters were set as described in Wang et al.[20].
RNA-seq analysis
-
Sample preparation and instrumental parameters were set as described in Wang et al.[20]. Sequencing library construction was completed using the Hieff NGS Ultima Dual-mode mRNA Library Prep Kit that was designed for Illumina (Yeasen Biotechnology [Shanghai] Co., Ltd). The library sequencing was completed on the Illumina NovaSeq platform, which could generate 150 bp paired-end reads. Based on alignment of sequencing reads to the reference genome using HISAT2 (v2.0.4), subsequent transcript assembly was performed with StringTie, coupled with gffcompare, ASprofile, rMATS, and DEXSeq for analyzing transcript structures and alternative splicing. Gene protein sequences, functions, and conserved domains were annotated using diamond, InterProScan, and hmmscan. Differential expression genes were screened with multiple tools including DESeq2 and edgeR, followed by GO/KEGG enrichment analyses using clusterProfiler and topGO. Differential expression genes between the two groups were discovered using DESeq2, which fits a negative binomial model to each gene. To control the false discovery rate and produce adjusted p-values, the Benjamini–Hochberg method was used. Weighted gene co-expression network analysis (WGCNA) was conducted using the pickSoftThreshold function from the WGCNA R package. The key parameters were set as follows: TOMType was unsigned, dendrogram clustering was the dynamic hybrid tree cut algorithm, minModuleSize was set as 30, mergeCutHeight was set as 0.25, and power was set as 1.
Statistical analysis
-
IBM SPSS Statistics 22.0 (SPSS Inc., USA) was used to perform statistical analyses that include the computation of correlations, means, and standard deviations. All figures were produced with GraphPad Prism 9.5 (GraphPad Software, USA) and OriginPro 2024 (OriginLab Corporation, USA). Furthermore, SIMCA 14.1 (Umetrics AB, Sweden) was used to conduct multivariate statistical modeling that included calculating Variable Importance in Projection (VIP) scores. Orthogonal Partial Least Squares Discriminant Analysis (OPLS-DA) was conducted on the Metware Cloud platform (
https://cloud.metware.cn ), and Principal Component Analysis (PCA) was completed on the BMK Cloud platform (www.biocloud.net ). -
In general, the ripening of peach fruit can be determined by several physiological indicators such as fruit weight, TSS, ethylene release, fruit firmness, and peel color (Fig. 1a). During the ripening of 'XM', the mean values of fruit weight, TSS, and CCI showed a significant increasing trend (Fig. 1b–d). The weight exhibited two significant growth periods. The first was from 119 to 124 DAF, with the average value increasing from 143.64 ± 18.86 g to 159.39 ± 12.97 g. The second occurred from 128 to 130 DAF, where the average value increased from 161.78 ± 14.09 g to 194.99 ± 25.24 g (Fig. 1b). The TSS of 'XM' increased significantly from 10.43 ± 0.9 °Brix to 11.9 ± 0.81 °Brix with the highest value at 130 DAF (Fig. 1c). The CCI value increased dramatically from 115 to 124 DAF, with the average value changing from –4.61 ± 1.02 to –0.92 ± 0.87 and then transitioned from negative to positive from 126 to 127 DAF (Fig. 1d). Non-destructive firmness and flesh firmness after peeling significantly declined after 126 DAF (Fig. 1e, f). However, the release of ethylene remained stable before 128 DAF, then increased rapidly from 128 DAF to 130 DAF, and reached the highest level at 130 DAF (Fig. 1g).
VOC changes during the ripening of 'XM'
-
The composition of VOCs was detected and analyzed using GC-MS, and 39 VOCs were specifically targeted and quantified. Eight categories of compounds were found (Fig. 2a). During the ripening of 'XM', VOCs increased significantly from the r3 to the r4 stage (Fig. 2b). Among lactones, γ-decalactone, γ-hexalactone, and δ-decalactone increased markedly, contributing to a significant rise in total VOC content of 'XM' during the r3–r4 stage (Fig. 2c). Benzaldehyde gradually increased during the ripening process of 'XM', while nonanal showed a decreasing trend (Fig. 2d).
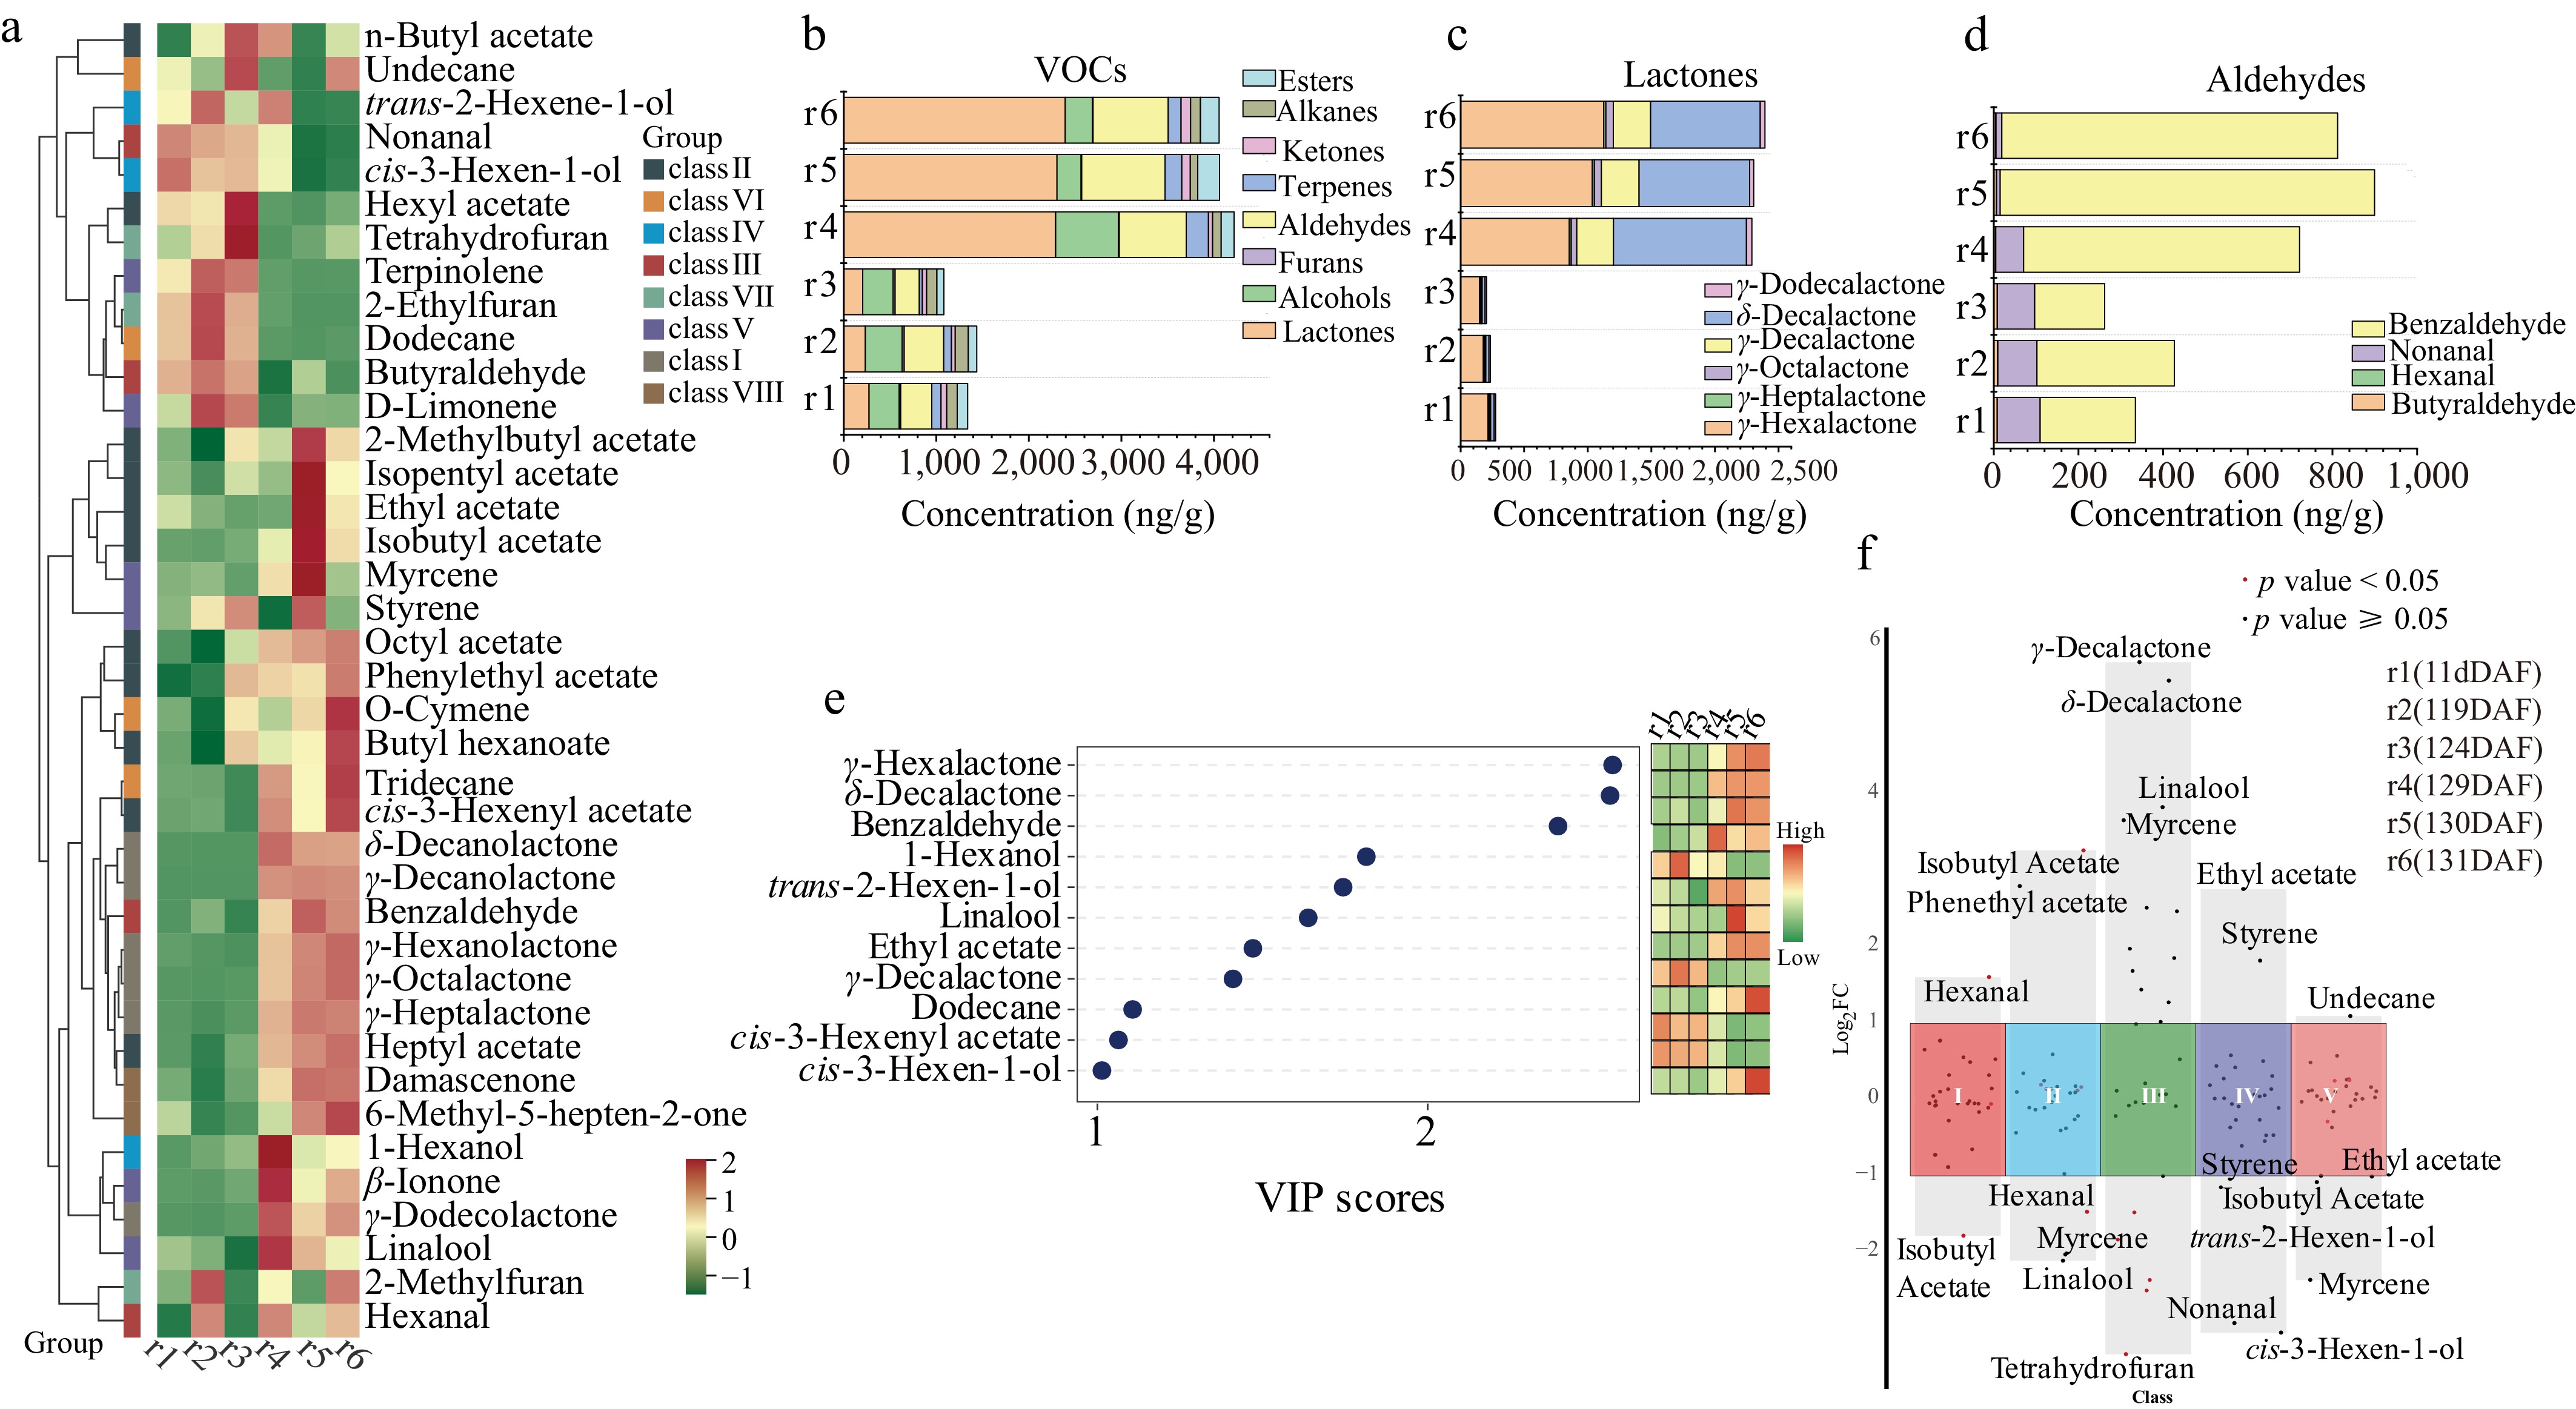
Figure 2.
Analysis of VOCs during 'XM' ripening by GC-MS. (a) Changes in VOC content during ripening. (b) Changes in total VOC content during ripening. (c) Changes in lactone content during ripening. (d) Changes in aldehyde content during ripening. (e) VIP score plot. (f) Differential volcano plot of VOCs during ripening.
VIP value analysis of VOCs identified 11 compounds with VIP > 1 during the ripening of 'XM'. Among them, three compounds (γ-hexalactone, δ-decalactone, and benzaldehyde) had VIP > 2 (Fig. 2e). Based on the multi-group volcano plot (Fig. 2f), the r3–r4 stages showed upregulation of γ-decalactone, δ-decalactone, myrcene, and linalool. The characteristic aroma compounds of 'XM' accumulated rapidly during the r3–r4 stages and remained stable during the r4–r6 stages. A total of 14 VOCs had OAVs > 1 during the ripening process of 'XM' (Table 1). Based on the integrated analysis using OAV > 1 and VIP > 1, a total of seven VOCs, including γ-hexalactone, δ-decalactone, benzaldehyde, 1-hexanol, linalool, ethyl acetate, and γ-decalactone, had OAV > 1 and VIP > 1 during the ripening of 'XM'.
Table 1. Changes in OAV during the ripening process of 'XM'.
VOCs CAS OT r1 r2 r3 r4 r5 r6 Odor γ-Decalactone 706-14-9 1.10 5.21 4.99 4.93 262.08 270.01 265.89 Peach δ-Decalactone 705-86-2 66.00 0.41 0.38 0.53 15.84 13.18 13.06 Peach γ-Dodecalactone 2305-5-7 2.00 5.64 5.45 6.00 21.70 15.69 18.71 Sweet γ-Hexalactone 695-06-7 260.00 0.83 0.69 0.58 3.29 3.98 4.33 Sweet γ-Octalactone 104-50-7 12.00 0.65 0.62 0.66 3.64 4.51 4.88 Coconut 1-Hexanol 111-27-3 5.60 14.29 17.85 22.67 72.94 32.88 37.15 Green Nonanal 124-19-6 1.10 92.08 83.84 80.10 59.74 7.85 12.32 Green Butyraldehyde 123-72-8 2.20 3.72 4.09 3.80 1.90 2.84 2.20 Chocolate Benzaldehyde 100-52-7 750.89 0.30 0.43 0.22 0.87 1.18 1.06 Aromatic Ethyl acetate 141-78-6 5.00 9.00 4.89 3.12 3.80 25.70 12.76 Pineapple Isopentyl acetate 123-92-2 0.15 9.76 9.06 10.38 9.83 13.17 10.79 Fruity Myrcene 123-35-3 1.20 0.69 0.87 0.21 2.71 5.78 1.12 Spicy Linalool 78-70-6 0.22 372.38 299.66 69.52 992.50 715.67 540.59 Flowery β-Ionone 14901-07-6 0.01 446.08 440.17 471.58 934.74 641.03 760.57 Flowery Non-volatile metabolite changes during the ripening of 'XM'
-
Target compounds were detected and analyzed using GC-MS, and 38 non-volatile metabolites were specifically targeted and quantified. A total of five categories of compounds were detected (Fig. 3a). Non-volatile metabolites were mainly composed of soluble sugars (Fig. 3b). Soluble sugars were mainly sucrose and D-sorbitol (Fig. 3c). Fatty acids, primarily stearic acid and palmitic acid, remained almost unchanged during the ripening of 'XM' (Fig. 3d). The trend of organic acids during ripening was consistent with the trend of soluble sugars. The main organic acids were DL-malic acid, citric acid, and D-(-)-quinic acid (Fig. 3e). Amino acids were predominantly composed of L-asparagine (Fig. 3f). VIP analysis of non-volatile compounds identified nine compounds with VIP > 1, including five soluble sugars, three organic acids, and one amino acid. These nine compounds showed different abundance patterns during the ripening stages of 'XM' (Fig. 3g). Pearson correlation analysis revealed that lactones were negatively correlated with multiple compounds, including D-sorbitol (p < 0.001), succinic acid (p < 0.001), citric acid (p < 0.001), L-isoleucine (p < 0.001), L-proline (p < 0.001), glycine (p < 0.001), L-threonine (p < 0.001), and L-tyrosine (p < 0.001). In contrast, lactones were positively correlated with D-galacturonic acid (p < 0.001) and DL-alanine (p < 0.001) (Fig. 3h).
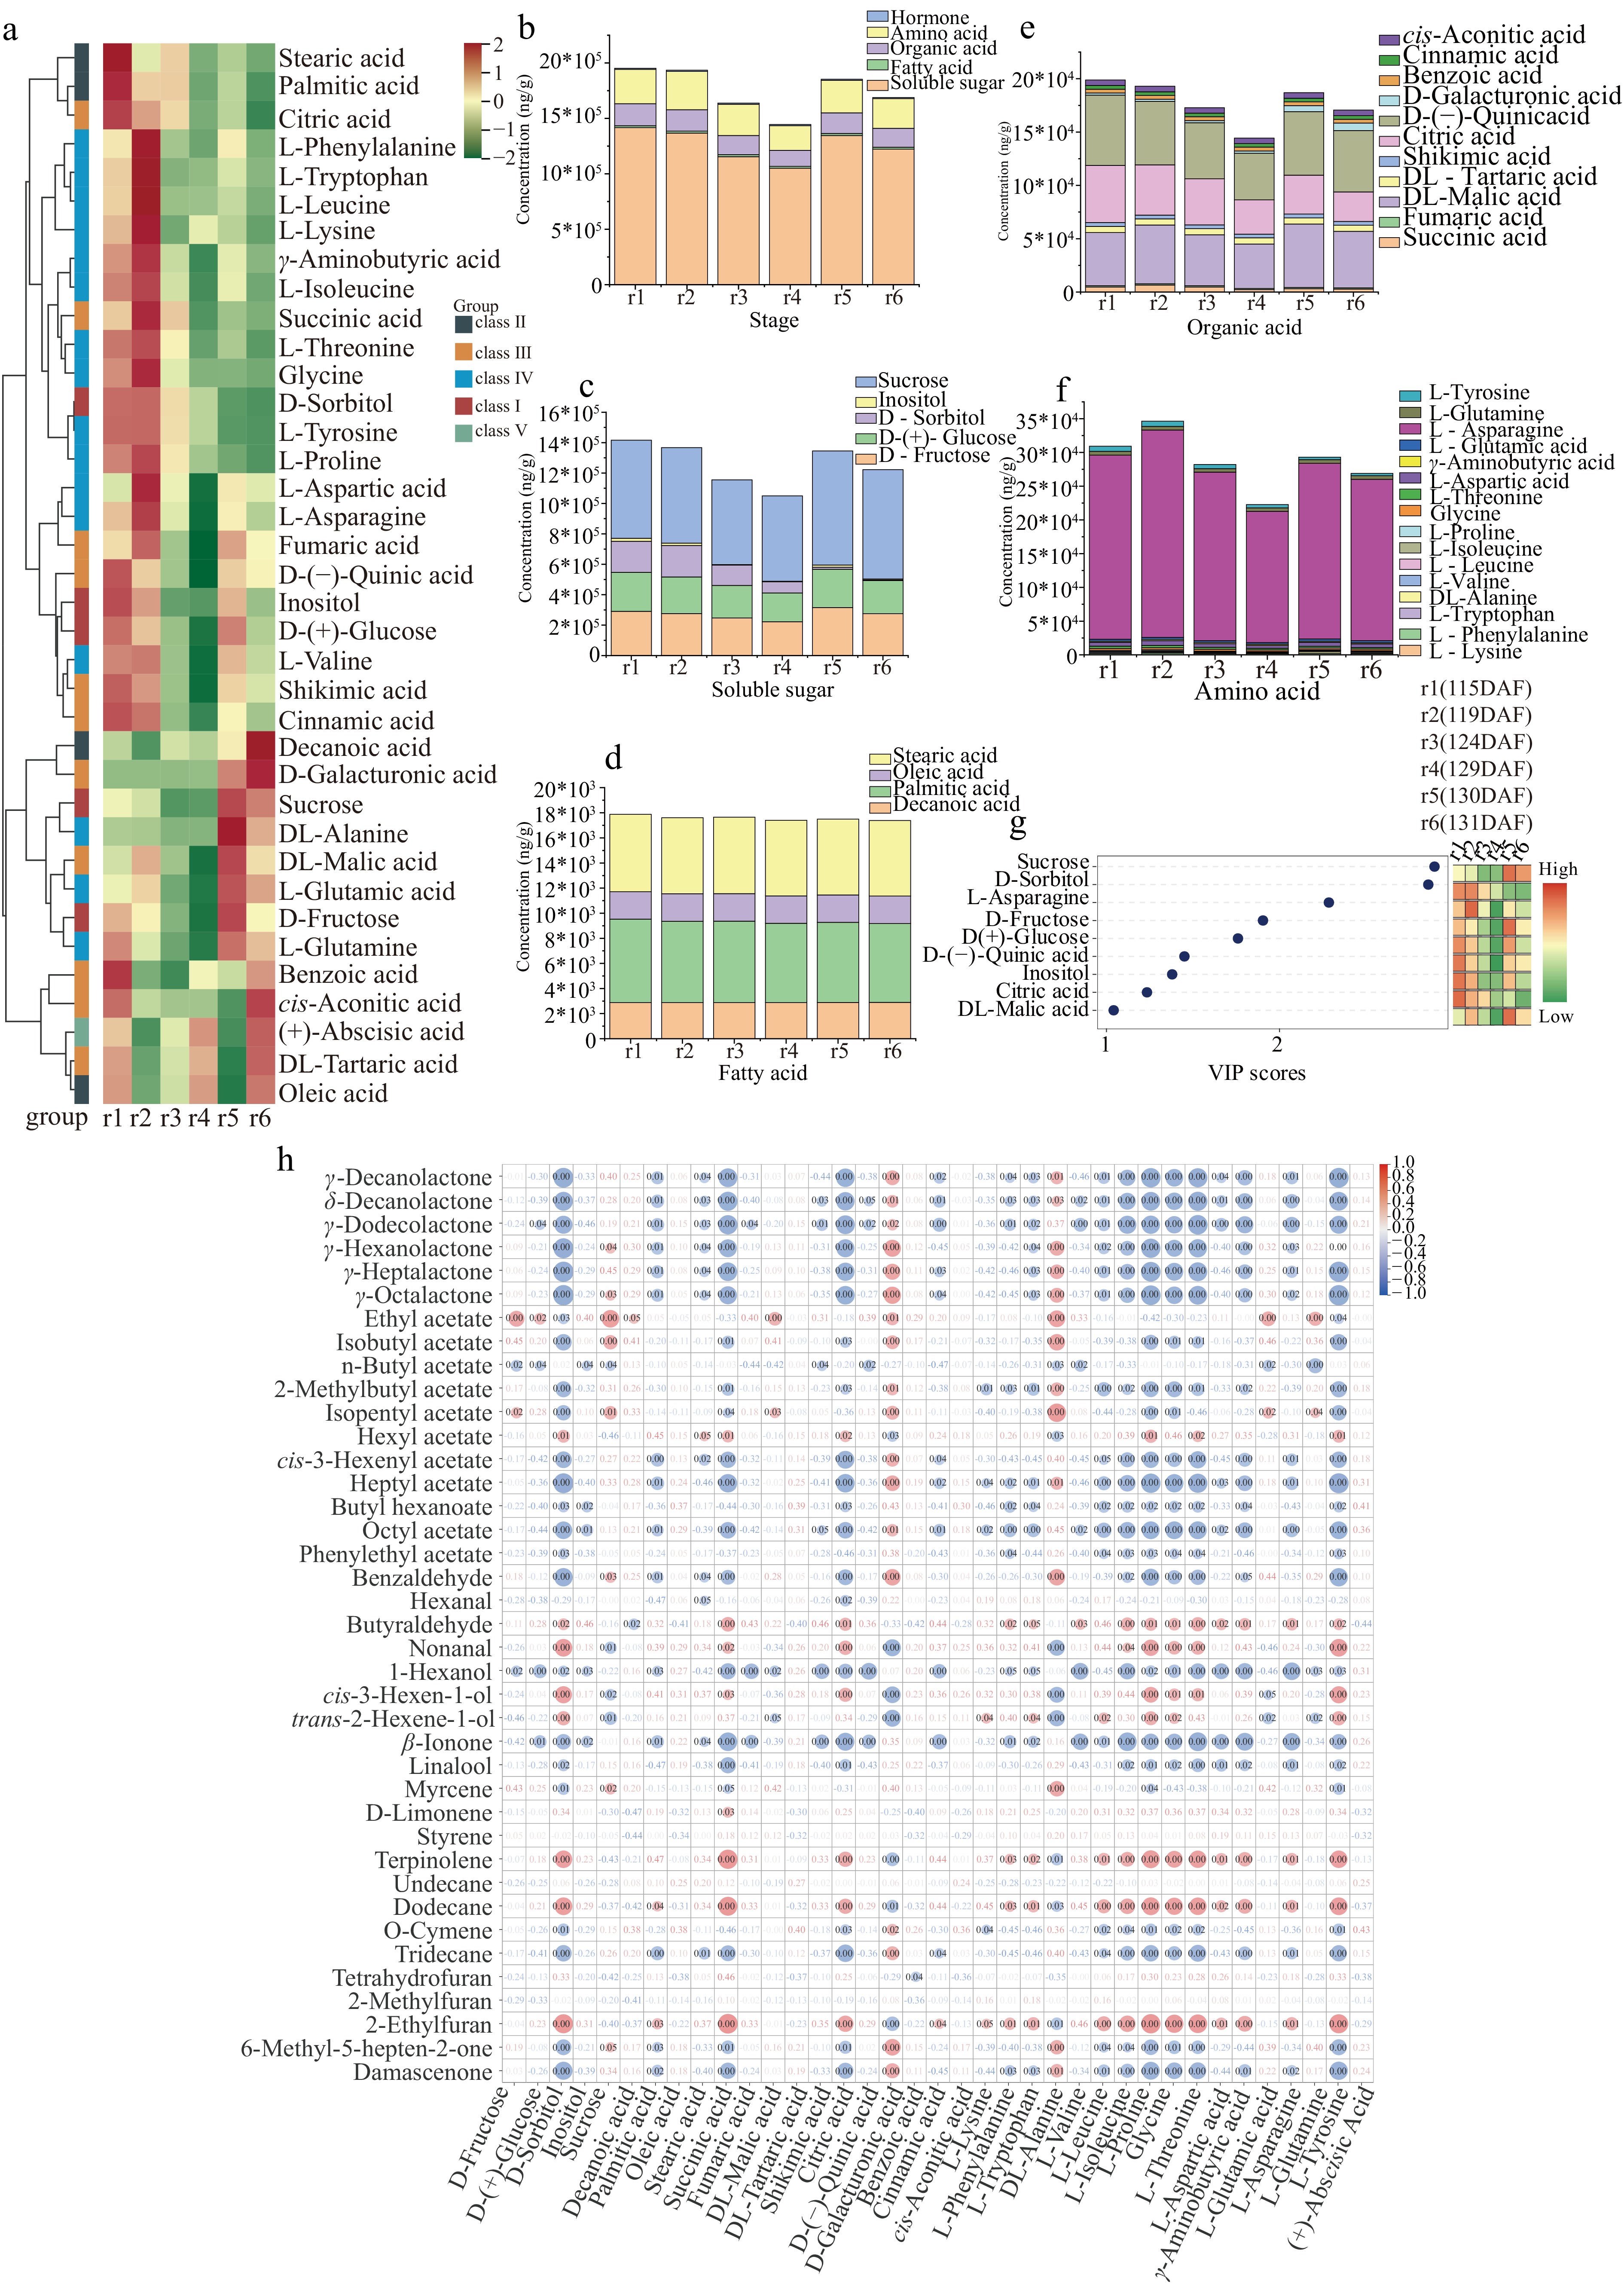
Figure 3.
Analysis of non-volatile compounds during 'XM' ripening by GC-MS. (a) Changes in non-volatile compound content during ripening. (b) Changes in total non-volatile compounds during ripening. (c) Changes in soluble sugar content during ripening. (d) Changes in fatty acid content during ripening. (e) Changes in organic acid content during ripening. (f) Changes in amino acid content during ripening. (g) VIP score plot. (h) Correlation heatmap between VOCs and non-volatile compounds during ripening.
E-nose analysis and the correlation analysis with metabolites
-
E-nose analysis was performed on the volatile substances during the ripening of 'XM', and the response values of 10 sensors at the equilibrium state (237 s) were selected. Radar chart analysis of the response values revealed that during the 'XM' ripening process, the response values of W1W, W1S, W5S, and W6S gradually declined (Fig. 4a). Among the 10 sensors, W1W exhibited the highest response value to volatile substances, with sulfides and terpenes being the major components. VIP analysis (Fig. 4b) revealed that the VIP values of W1W and W1S were greater than 1. Pearson correlation analysis between E-nose response values and VOCs (Fig. 4c) showed that W1W and W2W had similar correlations with aroma substances. They were negatively correlated with all lactones (p < 0.001) and terpenoids that possess sweet aromas. Among the terpenoids, β-ionone showed a correlation with W1W at p = 0.01 and with W2W at p < 0.001, while linalool showed p = 0.01 for both W1W and W2W. In contrast, they were positively correlated with hexyl acetate (p < 0.001), nonanal (p = 0.01 for W1W; p < 0.001 for W2W), and cis-3-hexen-1-ol (p < 0.001), which have green aromas, as well as with 2-ethylfuran (p = 0.01 for W1W; p < 0.001 for W2W), which has a cocoa-like aroma. W1S, W2S, and W5S were all positively correlated with alcohols possessing green aromas, specifically cis-3-hexen-1-ol (p = 0.01 for W1S; p = 0.01 for W2S; and p = 0.03 for W5S), and negatively correlated with esters having sweet and fruity aromas, including isobutyl acetate (p = 0.02 for W1S; p = 0.01 for W2S; p = 0.01 for W5S), isopentyl acetate (p = 0.01 for W1S; p = 0.01 for W2S; p = 0.03 for W5S), octyl acetate (p = 0.02 for W1S; p = 0.02 for W2S; p = 0.01 for W5S), and 2-methylbutyl acetate (p = 0.01 for W1S; p < 0.001 for W2S; p = 0.04 for W5S). Pearson correlation analysis between the electronic nose response values and non-volatile compounds (Fig. 4d) revealed that both W1W and W1S were negatively correlated with D-galacturonic acid (p = 0.01 for W1W; p = 0.02 for W1S), and positively correlated with soluble sugars, including D-sorbitol (p < 0.001 for both W1W and W1S), and free amino acids, including L-tyrosine (p < 0.001 for both) and L-proline (p = 0.01 for both). Additionally, W1W was positively correlated with fatty acids, including palmitic acid (p = 0.01) and stearic acid (p = 0.01), as well as with organic acids, specifically citric acid (p < 0.001).
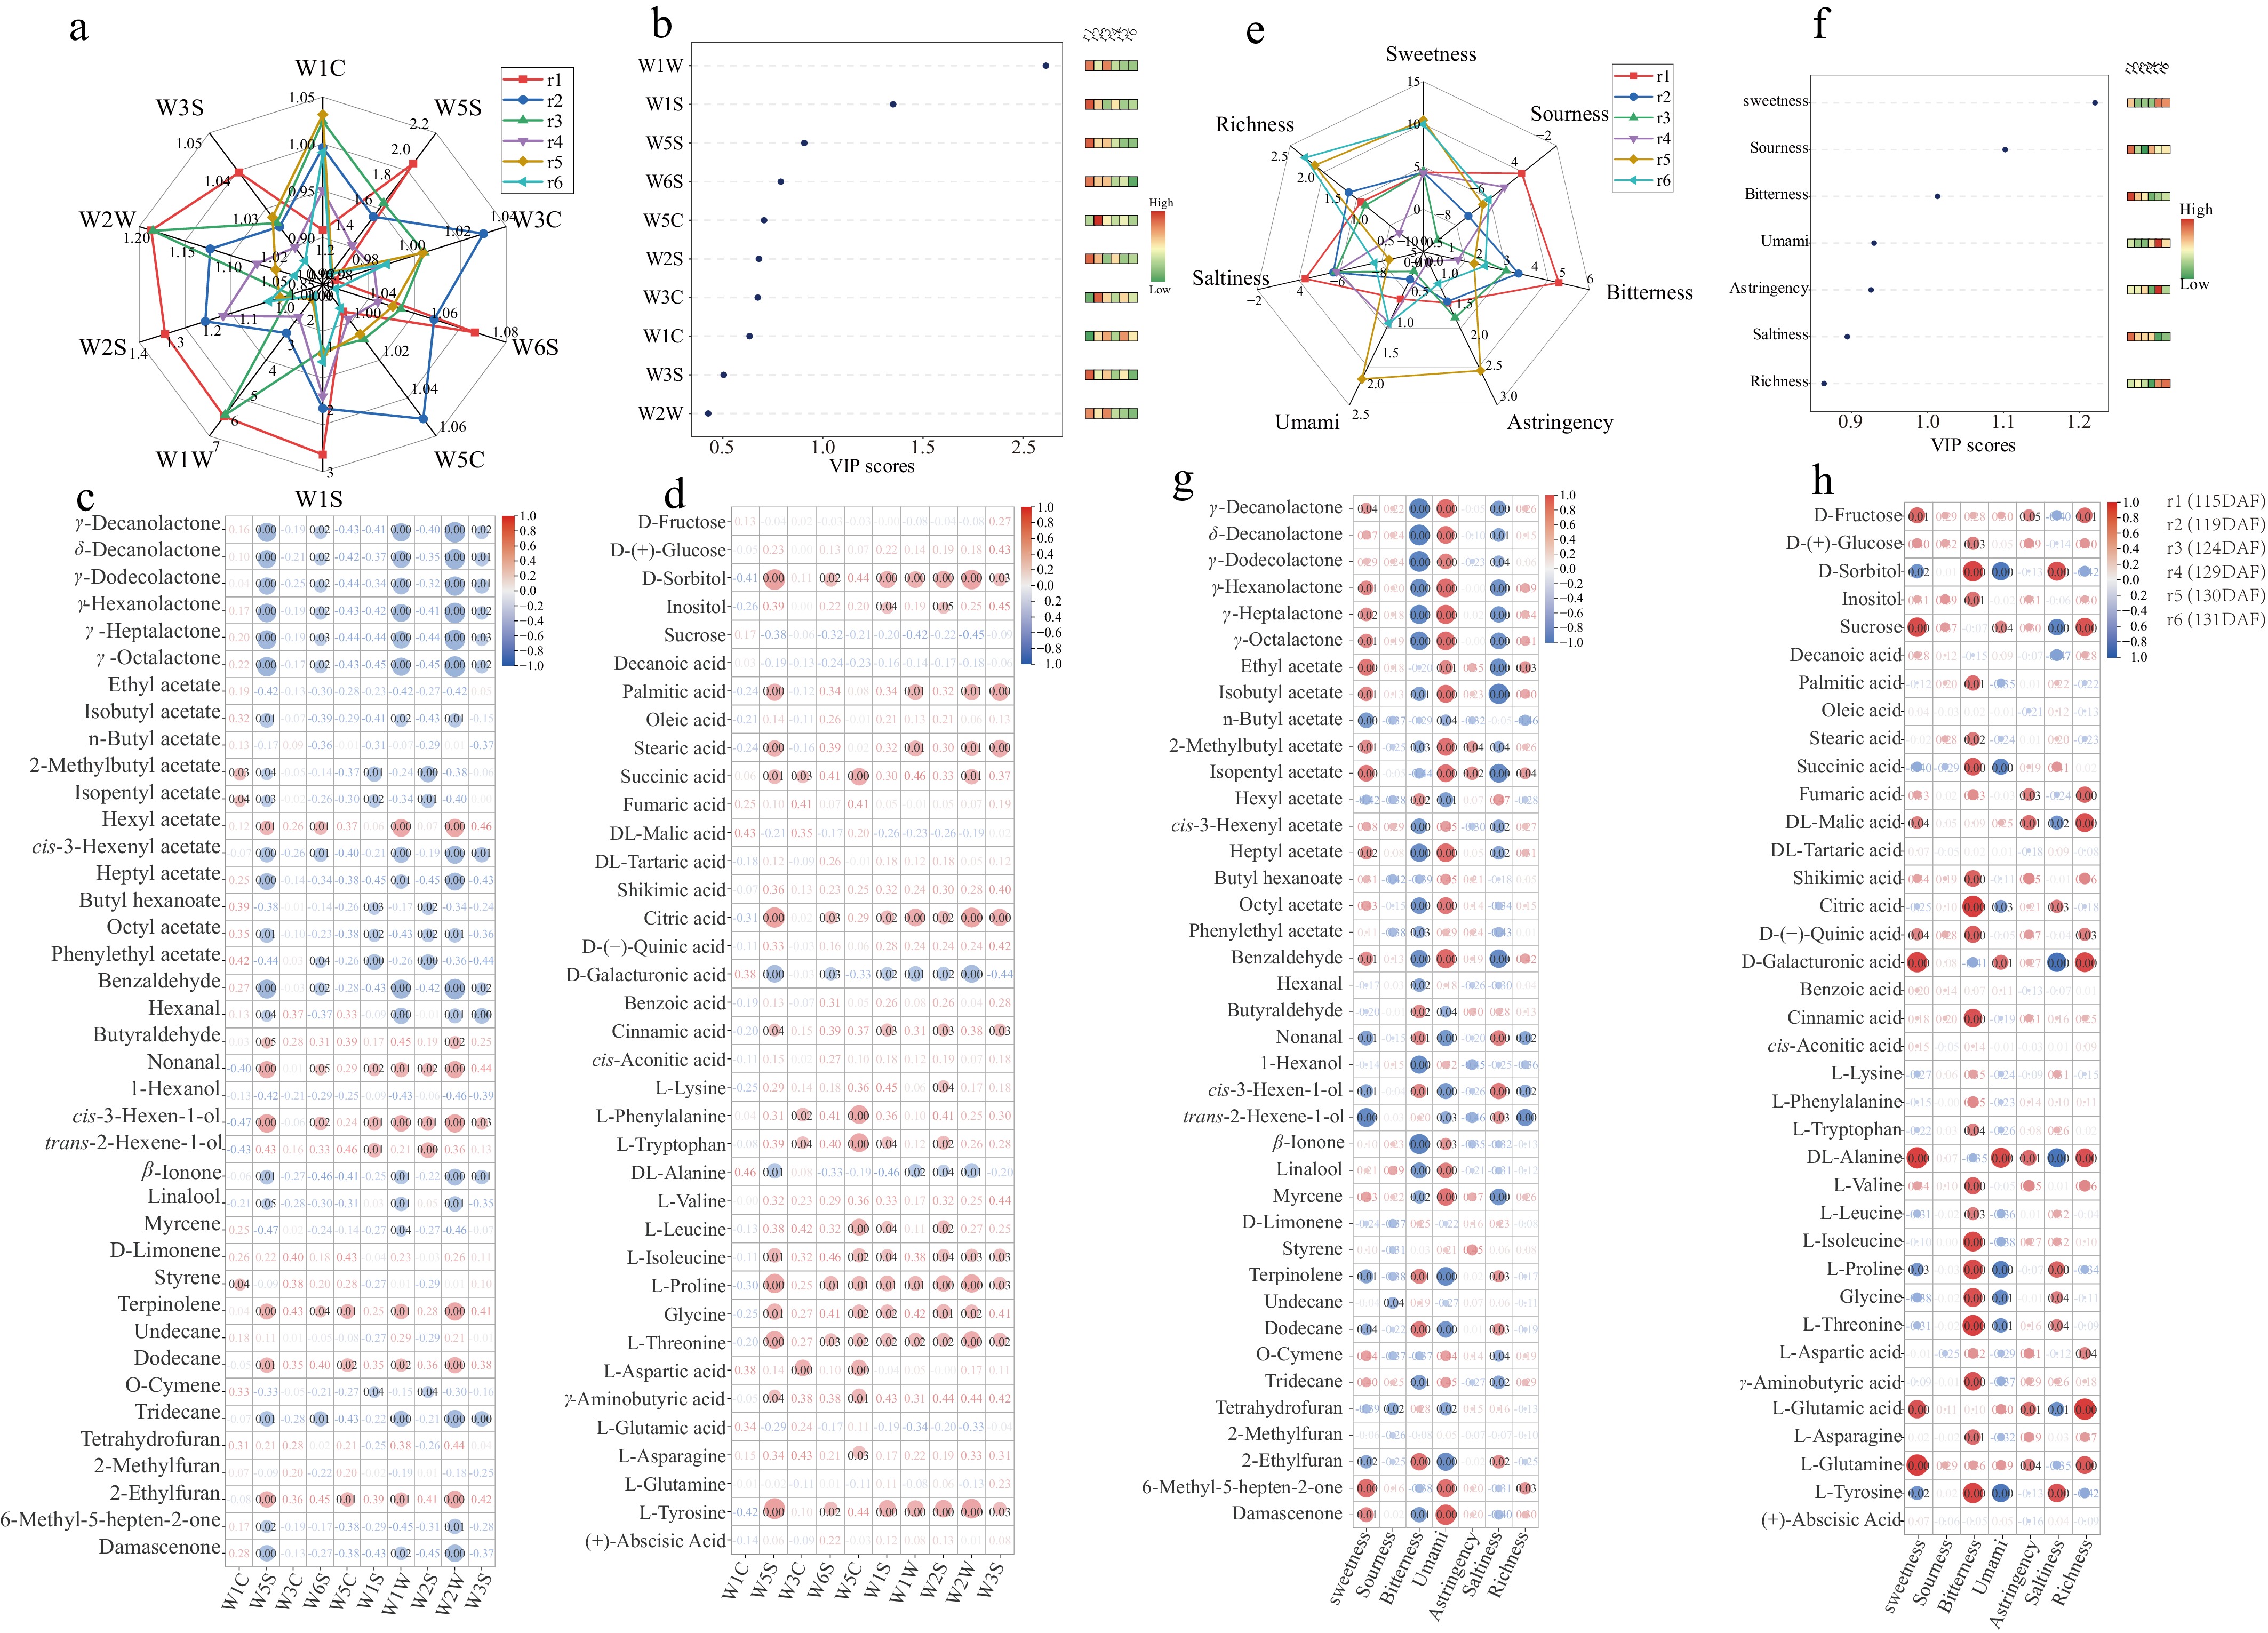
Figure 4.
Sensory analysis of 'XM'. (a) Radar chart of E-nose characteristic attributes of fruit at different ripening stages. (b) VIP score plot for the E-nose. (c) Correlation network diagram between E-nose and VOCs (r > 0.5; p < 0.05). (d) Correlation network diagram between E-nose and non-volatile compounds (r > 0.5; p < 0.05). (e) Radar chart of E-tongue characteristic attributes of fruit at different ripening stages. (f) VIP score plot for the E-tongue. (g) Correlation network diagram between E-tongue and VOCs (r > 0.5; p < 0.05). (h) Correlation network diagram between E-tongue and non-volatile compounds (r > 0.5; p < 0.05).
E-tongue analysis and the correlation analysis with metabolites
-
The sweetness, sourness, bitterness, umami, astringency, richness, and saltiness of 'XM' pulp at different ripening stages were detected using an E-tongue. Analysis of the radar chart (Fig. 4e) revealed that during the ripening process of 'XM', sweetness and umami increased significantly during the r4–r5 stages. VIP analysis revealed that during the ripening of 'XM', the VIP values of sweetness, sourness, and bitterness were all greater than 1 (Fig. 4f). Pearson correlation analysis between the E-tongue and VOCs (Fig. 4g) showed that lactones, including γ-hexalactone (p < 0.001 for umami; p = 0.01 for sweetness; p < 0.001 for bitterness), γ-heptalactone (p < 0.001 for umami; p = 0.02 for sweetness; p < 0.001 for bitterness), γ-decalactone (p < 0.001 for umami; p = 0.04 for sweetness; p < 0.001 for bitterness), γ-octalactone (p < 0.001 for umami; p = 0.01 for sweetness; p < 0.001 for bitterness), as well as esters including isobutyl acetate (p < 0.001 for umami; p = 0.01 for sweetness; p = 0.01 for bitterness), heptyl acetate (p < 0.001 for umami; p = 0.02 for sweetness; p < 0.001 for bitterness), as well as benzaldehyde (p < 0.001 for umami; p = 0.01 for sweetness; p < 0.001 for bitterness), were positively correlated with umami and sweetness and negatively correlated with bitterness. Pearson correlation analysis between E-tongue and non-volatile compounds (Fig. 4h) revealed that soluble sugars, including D-fructose (p = 0.01 for sweetness; p = 0.01 for umami) and sucrose (p < 0.001 for both sweetness and umami); organic acids, including DL-malic acid (p = 0.04 for sweetness; p < 0.001 for umami), D-(-)-quinic acid (p = 0.04 for sweetness; p = 0.03 for umami), and D-galacturonic acid (p < 0.001 for both); and amino acids, including DL-alanine (p < 0.001 for both), L-glutamic acid (p < 0.001 for both), and L-glutamine (p < 0.001 for both), were positively correlated with sweetness and umami. In contrast, D-sorbitol (p = 0.02 for sweetness; p < 0.001 for umami), L-proline (p = 0.03 for sweetness; p < 0.001 for umami), and L-tyrosine (p = 0.02 for sweetness; p < 0.001 for umami) showed negative correlations with sweetness and umami, and positive correlations with bitterness.
DEGs correlated with key VOCs via RNA-seq analysis
-
RNA-seq analysis of 18 peach mesocarp samples from six stages of 'XM' (three technical replicates per stage) yielded a total of 126.56 Gb of clean data. Each sample produced at least 5.97 Gb of clean data, with Q30 base percentages reaching 95.02% or higher. The clean reads from each sample were aligned to the designated reference genome (Prunus persica v2.0.a1,
ftp://ftp.bioinfo.wsu.edu/species/Prunus_persica/Prunus_persica-genome.v2.0.a1/genes ), achieving alignment efficiencies ranging from 91.37% to 97.97%. Based on the alignment results, a total of 1,404 novel genes were identified, among which 782 were functionally annotated. Using Fold Change ≥ 2 and FDR < 0.01 as the criteria for screening differentially expressed genes, 7,297 differentially expressed genes were identified. Differential expression analysis was conducted between adjacent stages. In the comparisons r1 vs r2, r2 vs r3, r3 vs r4, r4 vs r5, and r5 vs r6, a total of 629, 474, 1,734, 296, and 143 DEGs were identified, respectively. Among these, 14,702 DEGs were common across all stage comparisons (Supplementary Fig. S1a). Due to extremely limited residual total RNA after library construction, we were unable to conduct qPCR validation of differentially expressed genes. WGCNA of the 14 key VOCs identified multiple genes associated with key compounds. Specifically, 15 genes were highly correlated with γ-decalactone (r2 = −0.96), γ-hexalactone (r2 = −0.94), γ-octalactone (r2 = −0.94), γ-dodecolactone (r2 = −0.95), δ-decalactone (r2 = −0.96), 1-hexanol (r2 = −0.67), butyraldehyde (r2 = 0.65) and nonanal (r2 = 0.68) (Supplementary Fig. S1b; Table S2). Ten genes were highly correlated with benzaldehyde (r2 = −0.85) (Supplementary Fig. S1c; Table S3). Eleven genes were highly correlated with ethyl acetate (r2 = 0.78) and isopentyl acetate (r2 = 0.90) (Supplementary Fig. S1d; Table S4). Twelve genes were highly correlated with β-ionone (r2 = −0.89) and linalool (r2 = −0.83) (Supplementary Fig. S1e; Table S5). Eight genes were associated with myrcene (r2 = 0.86) (Supplementary Fig. S1f; Table S6). -
During the ripening of SMF peaches, the fruit maintains firmness at its early ripening stage[7]. In this study, 'XM' exhibited relatively high fruit firmness at its early ripening phase, providing favorable conditions for storage and transport, similar to those of stony-hard peaches[21]. The fruit firmness began to decline slowly after 124 DAF. The flesh firmness decreased rapidly from 126 to 127 DAF. From 128 DAF, ethylene production increased, accompanied by a gradual rise in the concentration of VOCs. Ethylene reached its peak at 130 DAF and then declined. 'XM' reached its optimal consumption stage at 130 DAF, which aligned with the changes observed during the ripening of the SMF 'Big Top'[22].
GC-MS identified seven key aroma compounds during the ripening process of 'XM'
-
C6 compounds possess a 'fresh green' or 'unripe fruit' aroma[12]. A multi-omics analysis of 60 different peach cultivars revealed that hexanal, (E)-2-hexenal, hexanol, and (Z)-3-hexenol among C6 compounds were key aroma compounds[23]. In 'XM', the OAV of hexanal was < 1, while that of 1-hexanol was > 1, reaching its peak at the r4 stage. Alcohols and aldehydes exhibited a 'green' aroma[24]. Research in peaches has identified nonanal as a key aroma compound[12,23]. Butyraldehyde and benzaldehyde were key aroma compounds in 'XM'. Benzaldehyde had an OAV < 1 in the early ripening stage but OAV > 1 at the late ripening stage, thus making it a key aroma compound during the ripening process of 'XM'. Esters impart a 'sweet' and 'fruity' aroma[25]. In 'XM', ethyl acetate (pineapple-like) and isopentyl acetate (fruity) have been identified as key aroma compounds. Lactones are the source of the characteristic peach fruit aroma[14]. γ-decalactone and γ-dodecalactone are key compounds contributing to the 'peach-like' aroma[23]. In yellow-fleshed peaches such as 'JinXiu', γ-octalactone and δ-decalactone have been found to be key aroma compounds[12]. Additionally, in 'XM', γ-hexalactone (coumarin and sweet flavor) was identified as a key aroma compound during the ripening process. Three compounds (γ-hexalactone, δ-decalactone, and benzaldehyde) were key VOCs for distinguishing different ripening stages of 'XM'. Terpenoids exhibit a 'floral' aroma[24]. In yellow-fleshed peaches like 'JinXiu', D-limonene, linalool, and β-ionone were key aroma compounds[12]. In 'XM', D-limonene, which has a citrus flavor, showed an OAV < 1, while myrcene, with a spicy flavor, had an OAV > 1 during the late ripening stage. In this study, a total of seven VOCs, including γ-hexalactone, δ-decalactone, benzaldehyde, 1-hexanol, linalool, ethyl acetate, and γ-decalactone, were identified as key aroma substances.
GC-MS identified nine key compounds during the ripening process of 'XM'
-
During peach ripening, soluble sugars accumulate while organic acids decrease, and amino acids serve as precursors for aroma synthesis[15,25]. In 'XM' fruit, nine key flavor metabolites were identified during ripening. These include five soluble sugars (sucrose, D-sorbitol, D-fructose, D (+)-glucose, and inositol), three organic acids (D-(-)-quinic acid, citric acid, and DL-malic acid), and one amino acid (L-asparagine). Among soluble sugars, fructose and glucose were responsible for the sweet taste of peaches[15]. Previous research has established that monosaccharides (D (+)-glucose, D-fructose) and the disaccharide sucrose were the primary soluble sugars in peaches[26]. In 'XM', the levels of D (+)-glucose, D-fructose, and sucrose initially decreased and then increased during ripening, whereas D-sorbitol showed a consistent decline. Organic acids are a key determinant of peach fruit flavor[27], with DL-malic acid, citric acid, and D-(-)-quinic acid being the predominant types[28]. These three acids were the key organic acids in the 'XM' during ripening. Amino acids, such as L-valine, provide precursors for aroma synthesis[15]. L-Asparagine is the most abundant amino acid in peaches, making it the primary form for nitrogen storage and transport within the fruit, supplying nitrogen for development and metabolism[1]. Consequently, L-asparagine was the key amino acid during the ripening of 'XM'.
Electronic sensory analysis during the ripening process of 'XM'
-
E-noses can simulate the olfactory receptor cells in the human nasal cavity to identify specific VOCs[29,30]. E-nose analysis of yellow peaches revealed that volatile compounds associated with W1C exhibited a grassy aroma, while those related to W1S and W2S presented fruity aromas[15]. However, in this study, W1W was negatively correlated with all lactones and terpenes (β-ionone, linalool), which have a sweet aroma, while W1S was positively correlated with alcohols (cis-3-hexen-1-ol, trans-2-hexen-1-ol), which have a green aroma. W1W and W1S were key sensors for distinguishing different ripening stages of 'XM'. Sulfides and terpenes were the main components of 'XM' volatiles. These differences indicate distinct aroma profiles between yellow- and white-fleshed peaches. E-tongues can mimic the human taste system to conduct pattern recognition, as well as the qualitative and quantitative analysis of samples, thereby objectively reflecting the overall taste profile of the samples[31]. Analysis with an E-tongue in yellow peaches revealed that L-norleucine, L-isoleucine, L-tyrosine, L-valine, 4-hydroxybenzaldehyde, cinnamic acid, and rutin were positively correlated with umami and sweetness[15]. Three taste perceptions (sweetness, sourness, and bitterness) could effectively distinguish the different ripening stages of 'XM'. In this study, lactones (γ-hexalactone, γ-heptalactone, γ-decalactone, γ-octalactone) and esters (isobutyl acetate, heptyl acetate, octyl acetate) were positively correlated with umami and sweetness.
DEGs associated with VOCs
-
In peach, multiple genes regulating the synthesis of substances such as γ-decalactone have been identified, including ACS, ACO, and FAD genes[32]. HIBCH encodes a key enzyme for branched-chain amino acid (especially isoleucine) catabolism in photosynthetic organisms, and its overexpression accelerates isoleucine degradation as demonstrated in diatoms and Arabidopsis. A homologous HIBCH gene also exists in the rice genome[33]. L-asparagine was the most abundant free amino acid in peach[4] and a key metabolite during the ripening of 'XM'. It serves as a major form for organic nitrogen transport and storage in plants[4]. In tea plants, CsDQD/SDH has been found to possess 3-dehydroshikimate reductase and shikimate dehydrogenase activities[34]. Shikimate is channeled through the shikimate pathway to synthesize aromatic amino acids such as L-phenylalanine, and PpDHQ-SDH has been shown to regulate this pathway in plants[35]. In this study, PpACS1, PpACO1, PpFAD2, PpHIBCH1, PpASN, and PpDQD/SDH were found to be positively correlated with the synthesis of γ-decalactone and related substances. Knockout studies of PGDH have shown that it is essential for driving L-serine synthesis[36,37], and L-serine is a precursor for the synthesis of substances like cysteine[38]. In Arabidopsis, AtMGL has been shown to be involved in methionine degradation[39]. Methionine is a precursor in amino acid synthesis pathways[40]. In this study, PpPGDH, PpMGL, and PpPGDH1 were found to be negatively correlated with VOCs like γ-decalactone. Benzaldehyde, composed of a benzene ring and a formyl substituent, was a simple aromatic volatile compound[41]. Current research has revealed that the biosynthesis of benzaldehyde began as phenylalanine was transformed to trans-cinnamic acid via the deamination step by the enzyme phenylalanine ammonia lyase (PAL)[42−44]. The trans-cinnamic acid can be converted to benzaldehyde through multiple pathways, with β-oxidative and non-β-oxidative pathways being the primary routes in peach[41,45,46]. Overexpression of glycoside hydrolase (PpGH28BG1, Prupe.4G261900) revealed a triple synergistic function: promoting benzaldehyde biosynthesis, inducing disease resistance genes, and regulating fruit softening, with PpPG1, PpPL4, and PpPME63 being functionally linked to PpGH28BG1 within the pentose and glucuronate interconversions pathway[41,47]. This study identified that PpBBE-like, PpGH28BG1, PpPG1, PpPL4, PpPME63, PpCCR, PpDHQ-SDH, and PpCAD1 were associated with benzaldehyde synthesis. In rice, PpCCR has been confirmed to co-express with PAL and 4CL in the phenylpropanoid pathway[48].
-
In summary, our study found gradually increased ethylene release induced pectin degradation, ultimately resulting in reduced fruit firmness, while ethylene signaling simultaneously reprogramed sugar metabolism (characterized by sucrose, glucose, and fructose accumulation, and sorbitol depletion), promoted organic acid accumulation (malic, citric, and quinic acids), and drove dynamic changes in amino acids, collectively establishing the taste foundation of peach fruit. With an adequate supply of sugar and acid precursors, lactones (γ-decalactone), benzaldehyde, terpenoids (linalool and β-ionone), and esters are rapidly synthesized and accumulated during the r3–r4 stages, thus forming the characteristic peach aroma of 'XM'. These metabolic alterations are governed by upstream transcriptional regulatory networks, and multiple WGCNA-identified genes, including PpACS1, PpACO1, and PpGH28BG1, exhibit strong correlations with the accumulation of key aroma compounds, suggesting that these genes serve as crucial candidates for regulating the aroma quality of 'XM' peach fruit. This provides a theoretical basis for a better understanding of the changes in metabolites and DEGs during the ripening process of SMF peaches. It also has practical implications for breeding SMF peaches.
This study has certain limitations. First, regarding cultivar selection, only a white-fleshed, slow-melting-flesh peach 'XM' was studied, without including yellow-fleshed or red-fleshed slow-melting-flesh peach cultivars; therefore, the generalizability of our conclusions requires further validation. Second, concerning sampling time, this study only examined the on-tree ripening stage before harvest, lacking monitoring of flavor quality changes and metabolite dynamics during postharvest storage, making it difficult to fully reflect the entire process of fruit flavor formation.
To address these shortcomings, future studies can be carried out from the following aspects: on the one hand, yellow-fleshed and red-fleshed slow-melting flesh peach cultivars could be included, and comparative transcriptomic or metabolomic analyses could be employed to reveal potential associations between flesh color and flavor compound accumulation; on the other hand, the sampling timeline should be extended to include the postharvest storage period, and physiological indices combined with flavor-omics could be used to elucidate the molecular mechanisms underlying postharvest flavor deterioration or maintenance. In addition, gene function verification approaches (such as transient or stable transformation) could be applied to confirm the functions of key candidate genes, thereby providing a more solid theoretical basis for quality improvement of slow-melting flesh peaches.
-
The authors confirm their contributions to this study as follows: writing – review and editing, supervision, project administration, methodology, funding acquisition, conceptualization: Ye Z, Li X; investigation: Wang Y, Zhou J, Zhang M, Guo X, Su M, Du J, Zhou H, Zhang X; writing – review and editing: Gao Z, Luo F; formal analysis, data curation: Wang Y, Liu H; writing original draft: Wang Y. All authors reviewed the results and approved the final version of the manuscript.
-
Data generated or analyzed during this study are included in this published article and its supplementary information files. Raw sequencing data are available from the corresponding author upon reasonable request.
-
The authors declare that they have no conflict of interest.
-
accompanies this paper online at: https://doi.org/10.48130/frures-0026-0032.
- Supplementary Table S1 The detailed information for used standard aromatic compounds.
- Supplementary Table S2 Genes associated with γ-decalactone, γ-hexalactone, γ-heptalactone, γ-octalactone, γ-dodecalactone, δ-decalactone, hexyl acetate, 1-hexanol, nonanal, cis-3-hexenyl acetate, octyl acetate, heptyl acetate, 6-methyl-5-hepten-2-one, and damascenone.
- Supplementary Table S3 Genes associated with benzaldehyde.
- Supplementary Table S4 Genes associated with ethyl acetate, isobutyl acetate, isopentyl acetate, trans-2-hexen-1-ol and 2-methylbutyl acetate.
- Supplementary Table S5 Genes associated with β-ionone, linalool and terpinolene.
- Supplementary Table S6 Genes associated with myrcene.
- Supplementary Fig. S1 RNA-seq during the ripening of 'XM'.
- Copyright: © 2026 by the author(s). Published by Maximum Academic Press, Fayetteville, GA. This article is an open access article distributed under Creative Commons Attribution License (CC BY 4.0), visit https://creativecommons.org/licenses/by/4.0/.
-
About this article
Cite this article
Wang Y, Zhou J, Zhang M, Guo X, Ye Z, et al. 2026. The fruit flavor evolution of a slow-melting flesh peach at its ripening stages by targeted flavoromics, sensory, and transcriptomics analysis. Fruit Research 6: e039 doi: 10.48130/frures-0026-0032 

The fruit flavor evolution of a slow-melting flesh peach at its ripening stages by targeted flavoromics, sensory, and transcriptomics analysis
- Received: 10 June 2026
- Revised: 27 July 2026
- Accepted: 11 August 2026
- Published online: 09 September 2026
Abstract: Melting flesh (MF) peach fruit has a short storage period, and its fruit surface can be easily damaged during transportation, while stony hard (SH) peaches lack the characteristic peach aroma. Slow-melting flesh (SMF) peaches combine the advantages of being 'firm and crisp at ripening' and 'slowly melting after harvest'. This study integrated a multi-omics approach to identify differential volatile metabolites and differentially expressed genes (DEGs) at various ripening stages of a new SMF peach 'Xia Mi' ('XM'). The approach included electronic nose (E-nose), electronic tongue (E-tongue), gas chromatography-mass spectrometry (GC-MS), and RNA sequencing (RNA-seq). At later ripening stages, the fruit rapidly softened, and ethylene production increased sharply. Targeted metabolomics analysis indicated that γ-decalactone, γ-hexalactone, δ-decalactone, ethyl acetate, benzaldehyde, 1-hexanol, and linalool were key aromatic compounds during ripening. Five types of soluble sugars, three types of organic acids, and one amino acid were identified as key metabolites during ripening. E-nose analysis revealed that W1W and W1S were key to distinguishing different ripening stages. W1W was negatively correlated with all lactones and terpenes, while W1S was positively correlated with alcohols. E-tongue analysis showed that sweetness, sourness, and bitterness were key taste attributes for distinguishing different ripening stages. Sweetness and umami showed positive correlation with lactones and esters and showed negative correlation with bitterness. RNA-seq analysis revealed that 15 DEGs were associated with γ-decalactone and related compounds, 10 with benzaldehyde, 11 with ethyl acetate and related compounds, 12 with β-ionone and related compounds, and 8 with myrcene. The above findings can serve as a reference for the future breeding of SMF peaches.
-
Key words:
- Peach /
- Slow-melting flesh /
- Flavor /
- Multi-omics analysis