













-
Eleocharis dulcis, a typical horticultural crop of the Cyperaceae family, is widely cultivated for its edible corms, which are prized for their distinctive flavor and texture. Based on starch content and sweetness, E. dulcis cultivars are broadly classified into two types: fresh-consumption type (e.g., 'Fruit_GXNo.3') and starchy type (e.g., 'Starch_GXNo.1'). Notably, 'Fruit_GXNo.3' was developed from 'Starch_GXNo.1' via radiation-induced mutagenesis, resulting in closely related genetic backgrounds. The fresh-consumption type, characterized by high sucrose and low starch levels, possesses a crisp and juicy texture that aligns with contemporary consumer preferences for refreshing produce. However, the genetic mechanisms governing these key quality traits—particularly the molecular basis for the stable inheritance of the high-sugar, low-starch phenotype following mutagenesis—remain largely unknown[1]. E. dulcis is transitioning from a traditional vegetable to a premium fresh-fruit crop. To support this transition, we must elucidate the molecular regulatory network that controls flavor formation—specifically, the dynamic balance between sucrose accumulation and starch synthesis and degradation during corm development.
The core quality of plant storage organs depends critically on the precise regulation of carbohydrate metabolism. Starch, the primary storage polysaccharide, is synthesized and accumulated under the coordinated control of sucrose transport and metabolic processes. Sucrose serves not only as the primary carrier for long-distance transport of photoassimilates from 'source' organs (e.g., leaves) to 'sink' organs (e.g., corms) but also as a key signaling molecule that regulates carbon partitioning and conversion in sink tissues, thereby directly influencing the final flavor, texture, and nutritional quality of the crops[2]. In root and tuber crops, the balance and conversion efficiency between sucrose and starch metabolism represent central research themes in quality formation and key targets for quality-oriented breeding[1].
The transport of sucrose from source to sink organs depends on specific membrane transporter families, primarily comprising sucrose transporters (SUTs/SUCs) and SWEET (Sugars Will Eventually Be Exported Transporters) proteins[3−5]. Previous studies have shown that SWEETs typically mediate the initial efflux of sucrose from phloem parenchyma cells into the apoplast or facilitate passive transport across membranes, whereas SUTs are primarily responsible for active sucrose uptake into the sieve element-companion cell complex or entry into sink cells, thereby completing carbohydrate partitioning[6]. In various crops, impaired function or altered expression of these transporters significantly affects yield and quality. For instance, silencing StSWEET11 and StSUT2 in potato leads to reduced tuber yield[7], and CsSUT1 is essential for sucrose accumulation in cucumber fruit[8]. However, how specific members of the SUT and SWEET families regulate sugar content variation among E. dulcis cultivars remains to be fully elucidated.
Sucrose delivered to sink organs is typically hydrolyzed into monosaccharides (fructose and glucose) by sucrose synthase (SUSY) or invertase (INV) before entering downstream metabolic pathways, including serving as substrates for starch synthesis[9]. Starch biosynthesis involves a cascade of enzymatic reactions: ADP-glucose pyrophosphorylase (AGPase) catalyzes the formation of the direct precursor ADP-glucose, which is subsequently utilized by soluble starch synthases (SSs), granule-bound starch synthase (GBSS), starch branching enzymes (SBEs), and starch debranching enzymes (DBEs) to coordinate chain elongation, branching, and trimming, ultimately forming amylopectin and amylose, respectively[10]. Previous research has established that GBSS is indispensable for amylose biosynthesis[10], whereas distinct SBE isoforms (e.g., SBEI, SBEII, SBEIII) exhibit specific substrate preference and branch chain length determination[11]. In contrast, starch degradation depends on another set of enzyme systems, including glucan water dikinase (GWD) and phosphoglucan water dikinase (PWD) mediating starch phosphorylation, phosphoglucan phosphatases (e.g., SEX4) facilitating dephosphorylation, and enzymes directly catalyzing glycosidic bond hydrolysis like α-amylase (AMY) and β-amylase (BAM)[12]. In many fresh edible organs, accelerated starch degradation during late maturation provides carbon skeletons for the synthesis of sucrose and volatile flavor compounds[13]. The re-accumulation of sucrose in sink organs primarily occurs via two pathways: the irreversible SPS–SPP pathway, involving successive catalysis by sucrose phosphate synthase (SPS) and sucrose phosphate phosphatase (SPP), and the reversible reaction catalyzed by SUS, which can also dominate sucrose synthesis under specific physiological conditions or in certain tissues[14]. In crops such as peach and soybeans, the activities of SPS and SUS are positively correlated with sucrose accumulation in organs[15,16]. However, the dominant role of SUS in E. dulcis corm sucrose accumulation and its synergy with the SPS–SPP pathway remain unclear.
Cyperaceae, the third-largest family in monocotyledons, is renowned for its remarkable species diversity, extensive variation in chromosome numbers (2n = 4–224), and substantial genome plasticity. These characteristics are considered key evolutionary innovations that have facilitated its successful adaptation to diverse habitats, including wetlands, alpine zones, and sandy environments. E. dulcis has undergone adaptation to aquatic environments[17], and its corm development is regulated by both genetic factors and environmental conditions[18]. Although a wild-type telomere-to-telomere (T2T) genome of E. dulcis has recently been released[19], it represents a wild germplasm and does not directly capture the genomic features associated with agronomically important traits in cultivated varieties, particularly the high-sucrose, low-starch phenotype of fresh-consumption types. The scarcity of high-quality reference genomes for cultivated Cyperaceae species has therefore severely hindered in-depth analysis of the genetic basis of important traits, genome evolutionary history, and mechanisms of metabolic adaptive evolution[1]. A chromosome-level genome assembly of a major cultivated cultivar is urgently needed to: (i) identify cultivar-specific structural variations and gene content differences that have arisen during domestication and breeding; (ii) pinpoint candidate genes underlying fresh-consumption quality traits; and (iii) provide a directly applicable reference for marker-assisted selection.
Therefore, this study aims to generate a de novo chromosome-level genome assembly, annotation, and comparative genomics analysis of the representative fresh-consumption type E. dulcis cultivar 'Fruit_GXNo.3', to address the following key scientific questions: (1) The genomic characteristics of E. dulcis and its phylogenetic position and divergence time within Cyperaceae; (2) How lineage-specific genome evolution events (e.g., WGD) have shaped its genome structure and driven the expansion and functional differentiation of gene families related to metabolic pathways; (3) The key metabolic genes responsible for the significant differences in starch components (amylose/amylopectin) and sucrose content in the corms of 'Fruit_GXNo.3' and 'Starch_GXNo.1', and their expression regulation patterns during corm development. The expected outcomes will provide new theoretical insights into the molecular regulatory mechanisms of starch and sucrose accumulation in Cyperaceae plants, deliver crucial candidate genes and molecular markers for the genetic improvement of E. dulcis flavor quality, and establish a solid genetic foundation for molecular design breeding of high-quality E. dulcis.
-
The E. dulcis cultivars used in this study were 'Starch_GXNo.1' and 'Fruit_GXNo.3', which were cultivated at the experimental base of the Biotechnology Research Institute, Guangxi Academy of Agricultural Sciences. Corm samples were collected at eight developmental stages: Leaf Sheath (LS), Shoot Bud (SB), Corm Formation (BF), Early Corm Bulking (BE), Bulking Initial (BI), Bulking Middle (BM), Bulking Late (BL), and Bulking Terminal (BT). Samples were immediately frozen in liquid nitrogen and stored at −80 °C.
DNA extraction and sequencing
-
High-molecular-weight genomic DNA was extracted from young leaves of 'Fruit_GXNo.3' using the DNeasy Plant Mini Kit (Qiagen). DNA quality was assessed by agarose gel electrophoresis, while concentration and quality were assessed using a NanoDrop 2000 spectrophotometer (Thermo Fisher Scientific, USA) and a Qubit fluorometer (Invitrogen, USA), respectively.
Oxford nanopore sequencing
-
Oxford Nanopore Technology (ONT) sequencing was performed by Grandomics Biotech Co., Ltd (Wuhan, China). High-molecular-weight DNA fragments (> 12 kb) were selected using the Sage Sciences BluePippin system. Libraries were prepared using the SQK-LSK109 kit (Oxford Nanopore) and sequenced on a PromethION R9.4.1 flow cell. Base calling was performed using Guppy v2.0.8. Reads with an average quality score (Phred) > 7 were retained. Quality control and adapter trimming were performed using fastp v0.19.7[20], resulting in 87.8 Gb of clean data (181.4 × coverage depth), with an average read length of 21.7 kb and a maximum read length exceeding 242.9 kb (Supplementary Table S1).
Hi-C library construction and sequencing
-
Fresh leaves were fixed with 2% formaldehyde, quenched with glycine, and ground to obtain nuclei. The Purified nuclei were digested with DpnII, ends were labeled with biotin-14-dCTP, ligated, and sheared to 300–600 bp fragments. Following end repair, A-tailing, and streptavidin affinity purification, Hi-C libraries were constructed[21]. Libraries were quantified and sequenced on the MGI-2000 platform, yielding 104.5 Gb of data (215.9 × coverage). Low-quality reads (Phred score < 20), adapters, and reads < 30 bp were filtered using fastp v0.19.7[20] (Supplementary Table S2).
Genome assembly and chromosome scaffolding
-
Initial genome assembly of ONT reads was performed using NextDenovo v2.0-beta.1[22], and polished with Racon[23]. Filtered ONT reads were aligned to the assembly using BWA v0.7.17[24], and redundancy was removed using NextPolish v1.3.1[25], resulting in a 483.9 Mb draft assembly (212 contigs). Hi-C paired-end reads were aligned to the draft assembly using Bowtie2 v2.3.2[26], retaining uniquely mapped read pairs (Supplementary Table S3). Hi-C paired-end reads were aligned to the draft assembly using Bowtie2 v2.3.2 with default parameters, retaining only uniquely mapped read pairs (MAPQ ≥ 30) for downstream analysis. Chromosome scaffolding was performed using the 3D-DNA v180922 pipeline with the --editor-coverage 5 parameter for manual adjustment of misassemblies, followed by manual curation in Juicebox v1.11.08. Valid chromatin interaction pairs were identified using HiC-Pro v2.8.1[27]. These interactions were utilized by LACHESIS to cluster[28], order, and orient scaffolds into pseudochromosomes. Automated scaffolding identified regions with distinct chromatin interaction patterns, which were manually adjusted for position and orientation, ultimately clustering contigs into 111 chromosomal groups. A total of 479.28 Mb (99.05% of the assembly length) was anchored onto these 111 chromosomes, comprising 4,884 contig bins (99.61% of total contigs) (Table 1; Supplementary Table S4). Assembly quality was assessed using BUSCO v5.4.3[29] (embryophyta_odb10) and CEGMA v2.5[30] following established procedures (Supplementary Fig. S1; Supplementary Tables S5, S6).
Table 1. Statistics of the genome assembly for Eleocharis dulcis.
Species Eleocharis dulcis Sequence Numble of contig 212 Maximum contig (bp) 6,537,962 Minimum contig (bp) 12,550 Contig N50 size (bp) 3,736,102 Contig N90 size (bp) 1,569,949 Contig total length (bp) 483,951,997 GC content (%) 33.42 Pseudochromosome Number 111 Anchored rate (%) 99.18 Size range (bp) 728,420–8,635,493 Assembly size (bp) 479,996,839 Genome annotation
-
Repetitive elements were identified using RepeatModeler, with LTR retrotransposons further identified using LTR_retriever. Non-coding RNAs, including microRNAs and rRNAs, were annotated based on the mirBase and Rfam v12.0 databases, while tRNAs were predicted using tRNAscan-SE v1.3.1. Overlapping annotations were merged, and redundant entries were removed (Supplementary Table S7).
Protein-coding genes were annotated by integrating de novo prediction, homology-based alignment, and RNA-seq-assisted prediction. For de novo gene prediction, SNAP and AUGUSTUS were used. Orthologous gene sets from Arabidopsis thaliana, Oryza sativa, Zea mays, and Sorghum bicolor were aligned, followed by refinement using GeneWise. Transcript evidence derived from PacBio long reads and Illumina short-read RNA-seq data was integrated via PASA alignment. EvidenceModeler was used to integrate predictions.
Functional annotation of protein-coding genes was performed using BLAST v2.5.0 against Swiss-Prot, KEGG Orthology (KO), KEGG, Pfam, and Nr databases with an E-value cutoff of 1e-5 (Supplementary Table S8). Visualization of gene density, GC content, repeat elements, and Gypsy/Copia transposon density on pseudochromosomes was performed using the Circlize package in R.
Evolutionary analysis
-
OrthoFinder v2.5.5[31] was used to cluster E. dulcis and A. thaliana with 15 other monocot species for phylogenetic analysis and divergence time estimation. Single-copy orthologous genes common to all 17 species were identified and aligned using suitable multiple sequence alignment tools. Sequences were realigned and trimmed using SeqKit v2.6.1[32] and Gblocks v0.91b[33], respectively. A phylogenetic tree was constructed using IQ-TREE 2[34] to reveal evolutionary relationships, with A. thaliana as the outgroup.
Divergence times for each node were estimated using the MCMCTree module of the PAML package. After evaluating various molecular models, a Bayesian approach was used to construct the phylogeny and estimate divergence times. Fossil calibration was performed using TIMETREE. Gene family expansion and contraction events were detected using CAFE v4.2.1[35], and p-values were calculated to determine the significance of each contraction or expansion event along a given branch. The Viterbi p-value was used to assess the reliability of each event. GO enrichment analysis for genes involved in these events was performed using ClusterProfiler v4.0.
Homologous genes identified from whole-genome sequencing were aligned using BLAST (E-value ≤ 1e-5). Syntenic blocks were identified using MCScanX software. The downstream analysis tool 'add_ka_and_ks_to_collinearity.pl' from MCScanX was used to calculate Ks values for genes within syntenic blocks. The distribution of Ks values was plotted using the ggplot2 package in R to analyze species duplication events. LTR retrotransposon insertion times were estimated using LTRvest and LTRdigest[36].
Karyotype evolution analysis was performed using the WGDI toolkit. Briefly, the ancestral monocot karyotype (AMKA, excluding Cyperaceae) was obtained from previous research. WGDI was then used to perform ancestral karyotype inference for the eight Cyperaceae species in this study. Finally, the '-km' parameter of WGDI was applied to map the AMKA karyotype results onto the eight species.
To distinguish WGD from segmental or tandem duplications, we retained collinear blocks containing at least five gene pairs (MCScanX -s 5). Ks peaks were identified using Gaussian mixture modeling (wgd v1.0), requiring ≥ 100 gene pairs per peak for WGD assignment. Tandem duplicates (within 200 kb, ≥ 70% identity) were excluded from WGD candidate pools.
For karyotype evolution analysis, we used WGDI with the -km parameter to map the inferred ancestral monocot karyotype (AMKA) protochromosomes onto the chromosomes of each sampled species. Chromosomal fusions were identified using the -sf parameter, which detects shared fusion events based on collinearity patterns at fusion breakpoints. The identified fusion events were classified into three types: end-to-end joining (EEJ), reciprocal translocation of chromosome arms (RTA), and nested chromosome fusion (NCF), following established criteria.
RNA extraction, sequencing, and transcriptome assembly
-
We extracted total RNA from fresh leaves and roots of the same E. dulcis individual used for genome sequencing using an RNA extraction kit (Tsingke, Shanghai, China). For each sample, Illumina libraries were constructed from 1 µg of total RNA using the TruSeq RNA Library Preparation Kit (Illumina, USA) and sequenced in paired-end mode on the Illumina Novaseq platform. Using these RNA-seq data, a de novo transcriptome assembly was generated using Trinity[37]. The assembled transcripts were then aligned to the genome and annotated using PASA[38].
Transcriptome sequencing and analysis
-
Transcriptome sequencing was performed for eight corm developmental stages of 'Starch_GXNo.1' and 'Fruit_GXNo.3'. All libraries were aligned to the reference genome using HISAT2 v2.2.1 with default parameters. The alignment rate for these transcriptomes exceeded 70%, indicating sufficient quality for downstream analysis. Transcript abundance was quantified using StringTie v2.1.4 and normalized as Transcripts Per Million (TPM). Differentially expressed genes (DEGs) between cultivars and across developmental stages were identified using criteria of |log2(fold change)| ≥ 1 and a false discovery rate (FDR) < 0.05.
qRT-PCR analysis
-
We analyzed gene expression patterns in E. dulcis corms by qRT-PCR following MIQE guidelines[39]. Total RNA was extracted from corm tissue using the TRIzol reagent kit (Takara, Dalian, China) according to the manufacturer's protocol. RNA quality was evaluated by agarose gel electrophoresis. Residual DNA was removed using DNase I, and 2 µL of total RNA was reverse-transcribed into cDNA using the PrimeScript RT Reagent Kit (Perfect Real Time; Takara). High-quality cDNA samples were used for qRT-PCR on a LightCycler 480II system (Roche, Germany). The 20 µL reaction mixture contained 5 ng cDNA. The qRT-PCR program was: pre-incubation at 95 °C for 5 min; 35 cycles of denaturation at 95 °C for 3 s, annealing at 60 °C for 10 s, and extension at 72 °C for 30 s. The Actin gene was used as an internal reference for normalization. Primer amplification efficiency was calculated using LinRegPCR. Relative gene expression levels were calculated using the 2−ΔΔCᴛ method. Primers used for qRT-PCR are listed in Supplementary Table S9.
Starch content determination
-
Amylose content was determined using the iodine colorimetric method[40]. A 100 mg sample was placed in a 50 mL conical flask, followed by the addition of 1 mL of 95% ethanol and 9 mL of 1 N NaOH. Starch was gelatinized by heating the mixture in a boiling water bath for 10 min, cooled to room temperature, and transferred to a 100 mL volumetric flask. Distilled water was added to bring the volume to 100 mL. A 5 mL aliquot of this solution was pipetted into another 100 mL volumetric flask, followed by the addition of 1 mL of 1 N glacial acetic acid and 2 mL of iodine solution (prepared by dissolving 0.2 g iodine and 2.0 g potassium iodide in 100 mL water), mixed well. The mixture was diluted to 100 mL, thoroughly mixed, allowed to stand for 20 min, and absorbance was measured at 620 nm using a spectrophotometer. To assess changes in starch components during the CDase I-5 reaction, E. dulcis starch was dissolved in 90% dimethyl sulfoxide to create the reaction substrate. A 0.5% starch solution was incubated with CDase I-5 (1U/mg substrate) in 50 mM sodium phosphate buffer. Amylose, amylopectin, and reducing sugar contents were determined after 10, 30, and 60 min of reaction. Amylose content was determined using the iodine absorption method, and reducing sugar content was determined using the DNS method with maltose as the standard. Amylopectin content was estimated by subtracting the sum of amylose and reducing sugar content from the total starch content.
Determination of total soluble sugars and sugar components
-
Total soluble sugar content and sugar components in E. dulcis corms were analyzed using the anthrone colorimetric method and ultra-performance liquid chromatography (UPLC), respectively, as described[41]. One gram of corm tissue was ground into a fine powder and mixed with 4 mL of 80% ethanol (v/v). The mixture was heated in an 80 °C water bath for 30 min, cooled to room temperature, and centrifuged at 5,000 × g for 10 min. The supernatant was collected in a 10 mL centrifuge tube. This extraction process was repeated four times. The combined supernatants were evaporated using a rotary evaporator; the residue was dissolved in 3.00 mL of distilled water and filtered through a 0.45 µm membrane for subsequent analysis. For total soluble sugar determination, 0.50 mL of the filtrate was mixed with 1.50 mL of distilled water, 0.50 mL of anthrone reagent (dissolved in ethyl acetate), and 5.00 mL of concentrated sulfuric acid. The mixture was shaken thoroughly, immediately placed in a 100 °C water bath for 10 min, and then cooled to room temperature. Anthrone fluorescence intensity was measured at an excitation wavelength of 488 nm and an emission wavelength of 510 nm using an M200PRO microplate reader (Tecan, Männedorf, Switzerland).
Sugar component composition was analyzed using a WATERS 2998 UPLC system (ACQUITY, Waters, USA) equipped with an ACQUITY UPLC BEH Amide column (2.1 × 100 mm, 1.7 µm). The mobile phase consisted of acetonitrile:water (86:14, v/v), with the aqueous phase containing 0.1% ammonia. The injection volume was 2 µL, the flow rate 0.2 mL/min, and the column temperature was maintained at 37 °C. The ELSD detector conditions were set at 55 °C with a gas flow rate of 1.2 mL/min.
Enzyme activity assays
-
GBSS (Granule-Bound Starch Synthase)[42]: Corm tissue was blanched at 105 °C for 1 h, dried at 60 °C to constant weight, and ground to a fine powder. A 0.5 g sample of tissue was mixed with 1 mL of extraction buffer (50 mM HEPES-NaOH pH 7.4; 5 mM EDTA; 0.1 mM DTT; 0.2 mM KCl; 1% PVP), homogenized in an ice bath, and centrifuged at 13,000 × g for 10 min at 4 °C. The supernatant was discarded, and the pellet was resuspended in 1 mL of extraction buffer. A sample amount of 80 µL was added to 500 µL of reaction mixture containing 100 mM glycine-NaOH buffer (pH 8.5); 10 mM KCl; 2.5 mM MgCl2; 0.5 mM EDTA; and 1 mM ADPG, and incubated at 30 °C for 20 min. The reaction was stopped by heating at 95–100 °C for 2 min and centrifuged (10,000 × g, 10 min, 4 °C). The supernatant was mixed with a solution containing 100 mM glycylglycylglycine-NaOH (pH 8.5); 100 mM KCl; 2.5 mM MgCl2; 0.5 mM EDTA; 0.2 mM phosphoenolpyruvate; 0.1 mM NADH; 11.5 IU pyruvate kinase; and 2.5 IU lactate dehydrogenase. After standing at 25 °C for 15 min, absorbance was measured at 340 nm. One unit of enzyme activity was defined as the production of 1 nmol NADPH per gram of tissue per minute. Enzyme activity values were normalized against reactions lacking the substrate.
SBE (Starch Branching Enzyme): As described previously[43], 0.5 g of tissue was added to 1 mL of extraction buffer (containing 100 mM N-Tris(hydroxymethyl)methylglycine-NaOH pH 7.5; 8 mM MgCl2; 2 mM EDTA; 12.5% glycerol; 1% PVP-40; 50 mM β-mercaptoethanol) and homogenized. After centrifugation (10,000 × g, 10 min), 10 µL of crude extract was added to 150 µL of reaction buffer (50 mM HEPES-NaOH pH 7.0; 5 mM glucose-1-phosphate; 1.25 mM AMP; 5.4 IU phosphorylase and incubated at 37 °C for 10 min. The reaction was terminated by boiling for 5 min. After cooling, 100 µL of DMSO and 140 µL of iodine-potassium iodide solution (0.1% I2 and 1% KI) were added. After color development at room temperature for 10 min, absorbance was recorded at 660 nm. One unit of activity was defined as a 1% decrease in absorbance per gram of tissue. Data were normalized against reactions without substrate.
BAM (β-Amylase): Following[44], 0.5 g of tissue was extracted with 1.5 mL of 20 mM sodium phosphate buffer (pH 6.0) containing 0.3% NaCl, 0.2% CaCl2, and 0.005 M β-mercaptoethanol. After filtration and centrifugation (13,200 × g, 10 min), the supernatant was sequentially precipitated with 20% and 80% ammonium sulfate and centrifuged. The final precipitate was dissolved in 35 mL of phosphate buffer (pH 6.0), centrifuged (15,000 × g, 15 min), and desalted using a Sephadex G-50 column equilibrated with 50 mM sodium acetate. One millilitre was taken and diluted with 4 mL of distilled water. Then, 70 µL of this preparation was reacted with 0.5 mL of 1% soluble starch in 5 mM acetate buffer (pH 6.0) and 0.04% NaCl at 40 °C for 5 min. The reaction was terminated by adding DNS reagent (1.0 mL) and boiling in a water bath for 5 min. After cooling, absorbance was measured at 540 nm. Unit activity was defined as the production of 1 µg maltose per gram of tissue per minute.
PHS (Phosphorylase): According to Dauvillée et al.[45], 0.5 g of tissue was homogenized in 1 mL of extraction buffer (100 mM N-Tris(hydroxymethyl)methylglycine-NaOH pH 7.5; 8 mM MgCl2; 2 mM EDTA; 1 mM DTT; 10% ethylene glycol). After centrifugation (10,000 × g, 10 min, 4 °C), 50 µL of supernatant was mixed with 1 mL of reaction buffer containing 50 mM MES-NaOH (pH 6.5) and 20 mM Glc-1-P, and incubated at 37 °C for 20 min. Then, 50 µL of the reaction mixture was transferred to a 96-well plate and mixed with 500 µL of reagent solution containing 50 mM Tris-HCl; 120 mM MgCl2; 0.05 mM glucose-1,6-bisphosphate; 0.5 mM NADP; 4 units of glucophosphorylase; and 2 units of glucose-6-phosphate dehydrogenase. Absorbance was measured at 340 nm. One unit of enzyme activity was defined as the production of 1 nmol NADPH per gram of tissue per minute.
SuSy (Sucrose Synthase) and SPS (Sucrose Phosphate Synthase): As described by Samkumar et al.[44], 0.5 g of tissue was homogenized with 1 mL of extraction buffer (50 mM HEPES-NaOH pH 7.5; 10 mM MgCl2; 2.5 mM DTT; 1 mM EDTA; 0.05% Triton X-100; 0.1% BSA; 0.1% β-mercaptoethanol; 2% PVPP), and centrifuged at 12,000 × g for 10 min at 4 °C. A 20 µL sample of supernatant was added to a reaction mixture containing 0.5 M HEPES-NaOH (pH 7.5); 0.14 M MgCl2; 0.028 M disodium EDTA; 0.042 M UDP-glucose; and 0.084 M fructose (for SuSy activity) or 0.112 M fructose-6-phosphate (for SPS activity). After reaction at 37 °C for 20 min, the reaction was stopped with 1 M NaOH. For SPS, samples were further boiled for 10 min. Then, 0.25 mL of 0.1% resorcinol in ethanol and 0.75 mL of 35% HCl were added. After heating at 95 °C for 20 min and cooling, a 200 µL aliquot was transferred to a 96-well plate, and absorbance was measured at 480 nm. One unit of activity was defined as the production of 1 µg sucrose per gram of tissue per minute.
Yeast heterologous expression
-
The full-length coding sequence of EduSWEET3a.1 cDNA was inserted into the pDRf1-GW vector. The recombinant plasmid was introduced into the hexose transporter-deficient yeast strain EBY.VW4000 and the sucrose transporter-deficient yeast mutant SUSY7/ura3 using a PEG/LiAc-based transformation method. EBY.VW4000 and SUSY7/ura3 transformants containing EduSWEET3a.1 were cultured on SD/-Ura selection medium containing 2% maltose or glucose for 2–3 d. Transformed yeast strains were inoculated into the corresponding SD liquid medium and cultured until OD600 reached 0.2. The cultures were then diluted (10-fold, 100-fold, 1,000-fold) and spotted onto the corresponding SD solid medium supplemented with 2% glucose, 2% fructose, or 2% sucrose. The spotted media were incubated at 30 °C for 2–4 d[46].
Statistical analysis
-
Smudgeplot v0.2.3 was used for ploidy estimation based on 21-mer k-mer pairs. Heterozygous k-mer pairs were extracted from the genome sequencing reads, and the resulting smudgeplot was interpreted following the recommended guidelines. Confidence scores for different ploidy configurations (AB, AABB, etc.) were calculated based on the relative abundance of k-mer pair types, as implemented in the Smudgeplot pipeline. All experimental data represent the mean of at least three independent replicates and are expressed as mean ± standard error (s.e.). Statistical comparisons between two groups were performed using two-tailed Student's t-test. For multiple-group comparisons, one-way analysis of variance (ANOVA) followed by Tukey's HSD post-hoc test was applied. Significance levels are indicated as * p < 0.05, ** p < 0.01, and *** p < 0.001.
-
We generated a de novo chromosome-level genome assembly for the fresh-consumption type E. dulcis 'Fruit_GXNo.3'. Oxford Nanopore long-read sequencing yielded 87.8 Gb of high-quality clean data, with an average read length of 21.7 kb and a maximum read length exceeding 242.9 kb (Supplementary Table S1). The base call quality (Q30) reached 93.22% (Supplementary Table S2). After alignment with Bowtie2, 232,161,440 read pairs were uniquely mapped to the genome (Supplementary Table S3). The initial assembly resulted in a draft containing 212 contigs, with contig N50 and N90 values of 3.73 and 1.56 Mb, respectively (Table 1; Supplementary Table S4). Chromosome-scale scaffolding utilizing Hi-C data anchored 479.28 Mb (99.05%) of the assembly onto 111 pseudochromosomes, encompassing 4,884 Contig Bins (99.61% of all contigs) (Table 1; Supplementary Table S4). BUSCO assessment showed that the assembled genome contained 1,519 complete BUSCO genes (94.1% completeness) (Supplementary Fig. S1a; Supplementary Table S5). CEGMA evaluation further detected 240 complete core eukaryotic genes (96.77% completeness) and 246 partial genes (99.19% completeness) (Supplementary Fig. S1b; Supplementary Table S5), indicating that the genome assembly is highly complete and contiguous, suitable for subsequent in-depth analysis.
Genome feature analysis revealed that gene density was positively correlated with GC content, while the distribution of repetitive sequences was negatively correlated with both (Fig. 1a). The distribution patterns of the two major long terminal repeat (LTR) families, Gypsy and Copia, were consistent with the overall trend of repetitive sequence distribution (Fig. 1b). Genome annotation identified 217.93 Mb of repetitive sequences, representing 45.03% of the assembled genome. Transposable elements (TEs) constituted the largest proportion (41.58%), with Class I TEs (retrotransposons) and Class II TEs (DNA transposons) accounted for 26.9% and 14.67% of the genome, respectively. Among retrotransposons, LTRs, LINEs, and SINEs accounted for 23.93%, 2.69%, and 0.28% of the genome, respectively. Gypsy and Copia elements within LTRs accounted for 5.9% and 5.0%, respectively. DNA transposons were the predominant Class II TEs, representing 10.84% of the genome (Supplementary Table S6). Homology-based sequence divergence analysis indicated that LTRs exhibited the greatest sequence divergence among all TE types, followed by DNA transposons, LINEs, and SINEs (Supplementary Fig. S2).
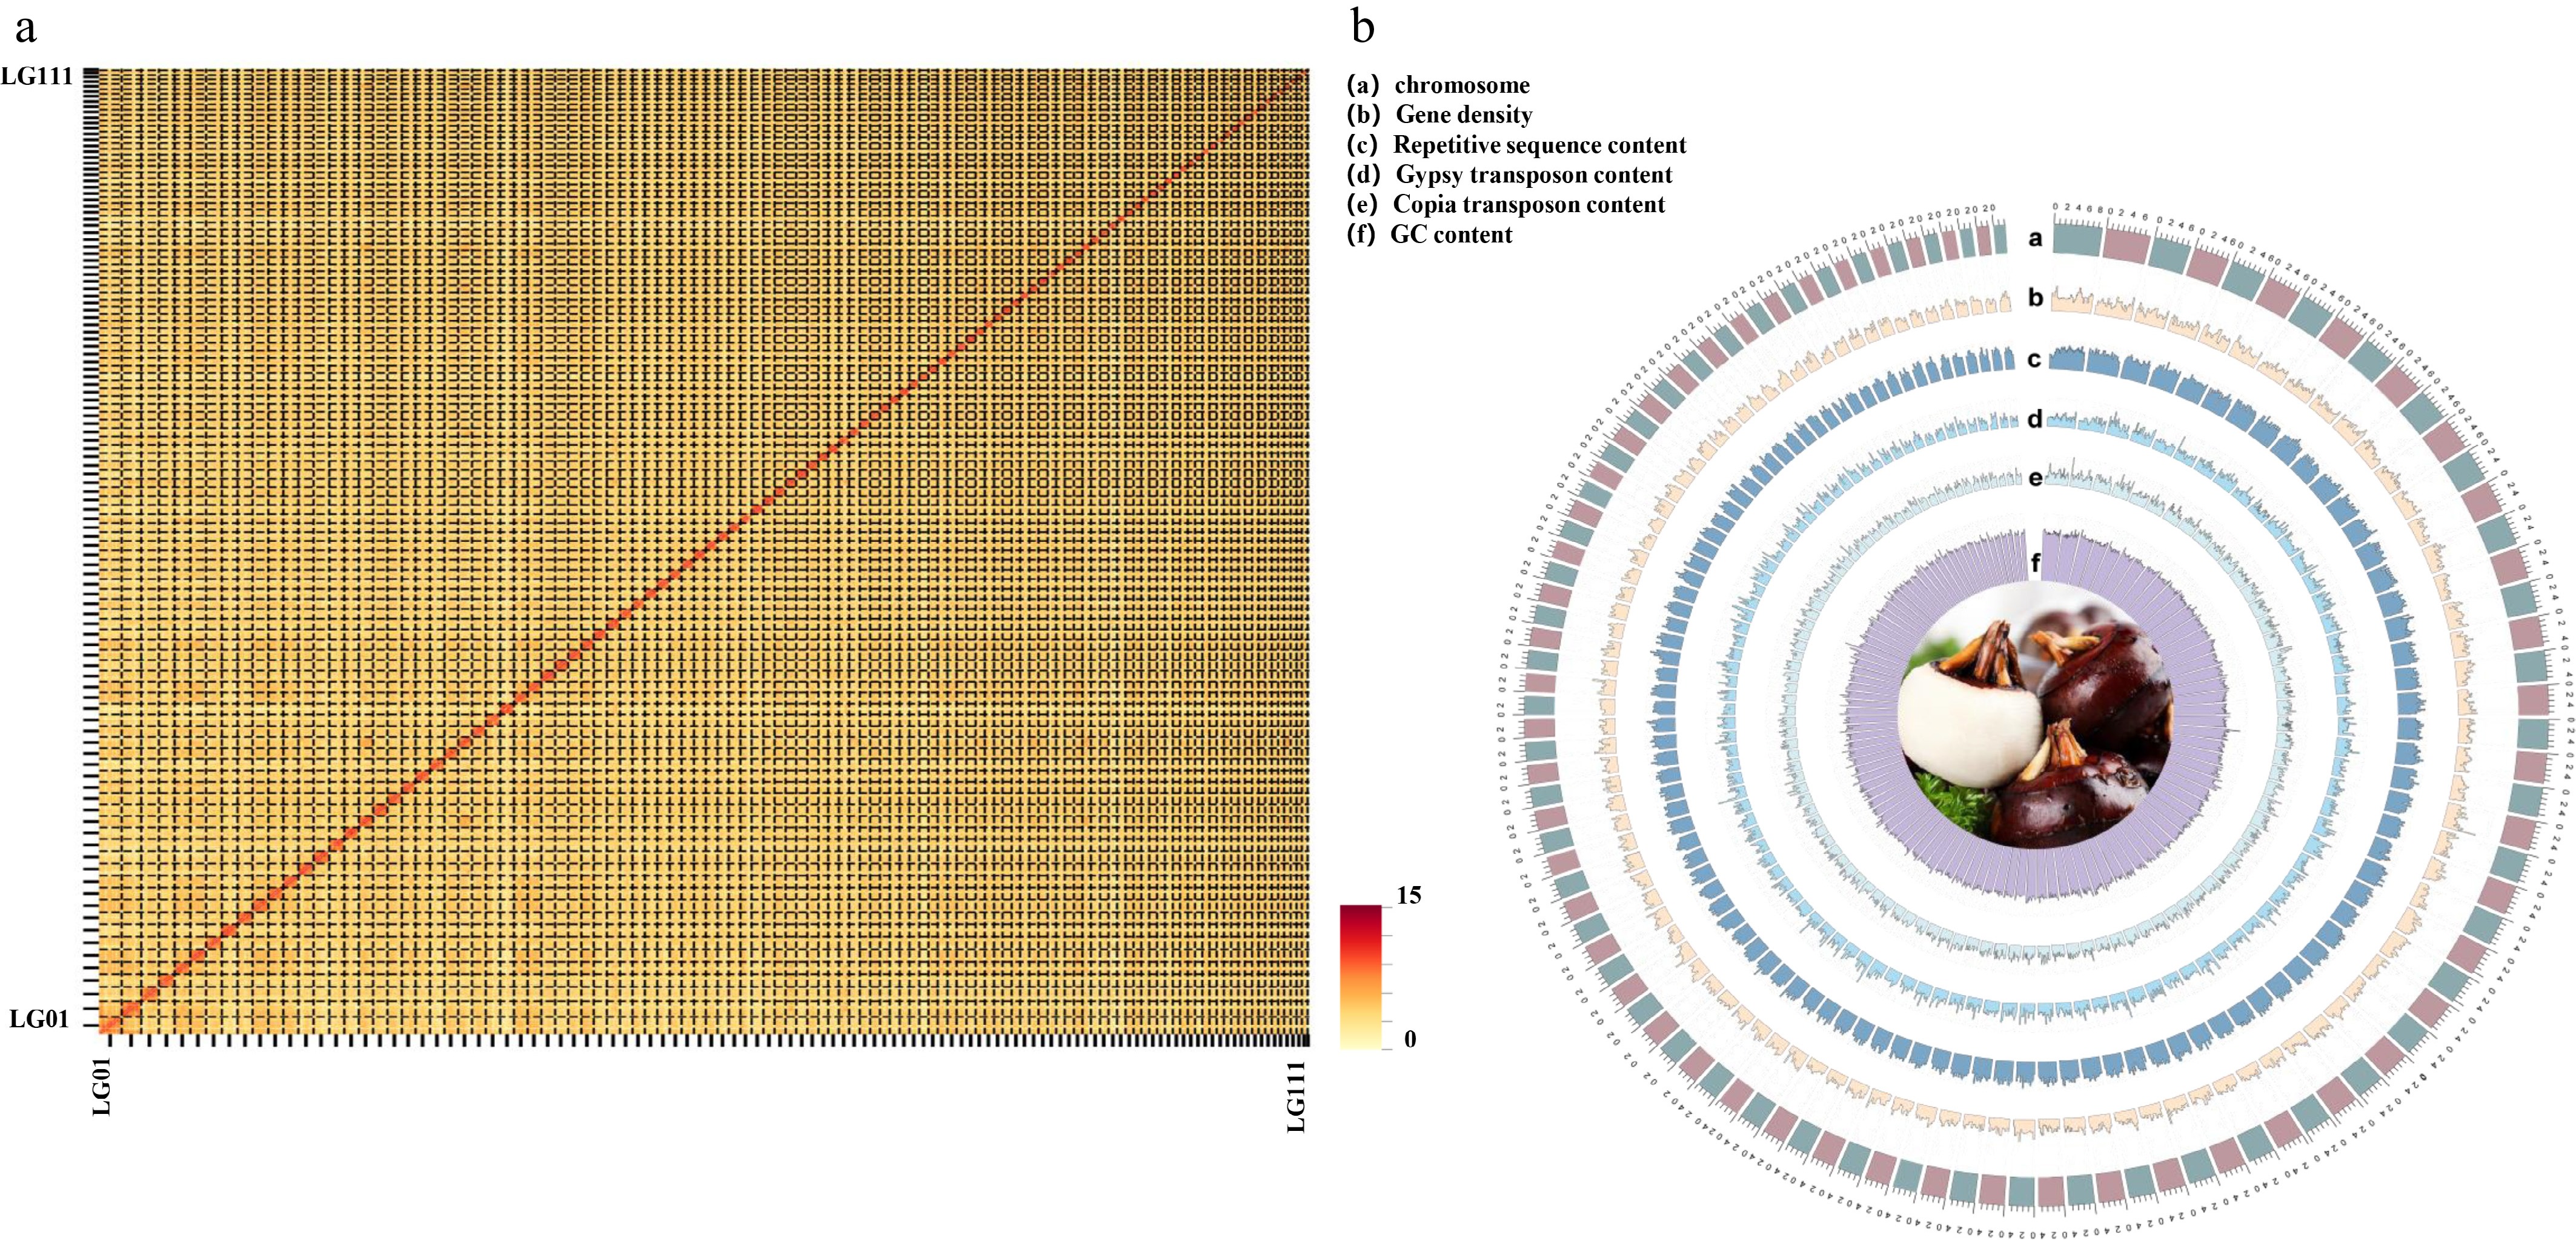
Figure 1.
E. dulcis genome assembly features. (a) Heatmap of Hi-C data for 111 pseudochromosomes of the E. dulcis genome. According to the Hi-C-based final assembly of the chromosome-level genome, the number of Hi-C read pairs between any two bins was used as the intensity signal of the interaction between two bins. Heatmap coordinates represent the pseudochromosomes, with the color of each dot representing the log value of the interaction intensity of the corresponding genomic bin pair (yellow to deep red). (b) Genome-scale features of E. dulcis pseudochromosomes. The letters (a–f) represent the chromosome, gene density, repeat sequence content, Gypsy transposon content, Copia transposon content, and GC content, respectively.
De novo prediction identified 37,251 protein-coding genes in the E. dulcis genome. The average gene length, CDS length, exon length, and intron length were 3,239.9, 1,164.79, 214.65, and 468.8 bp, respectively. The average gene contained 5.43 exons and 4.43 introns (Supplementary Table S7). In addition, 1,440 non-coding RNAs were annotated, comprising 130 rRNAs, 649 tRNAs, and 654 miRNAs (Supplementary Table S8). Functional annotation of the predicted protein-coding genes using multiple databases, including NR, GO, KEGG, KOG, and SwissProt, successfully annotated 35,407 genes, with an annotation rate of 92.05% (Supplementary Table S9).
Evolutionary analysis of the E. dulcis genome
-
To clarify the phylogenetic position of E. dulcis within monocots, a phylogenetic tree was constructed based on 374 single-copy genes, using A. thaliana as the outgroup, and including eight Cyperaceae species (Bolboschoenus planiculmis, Cyperus esculentus, Carex cristatella, Carex scoparia, Carex littledalei, Rhynchospora breviuscula, Rhynchospora tenuis, and E. dulcis) and eight other monocots (Musa acuminata, Elaeis guineensis, Ananas comosus, Oryza sativa, Zea mays, Sorghum bicolor, Juncus effusus, Juncus inflexus). The phylogeny indicated that Cyperaceae and Juncaceae diverged approximately 80.2 million years ago (Mya). Within Cyperaceae, E. dulcis diverged from B. planiculmis and C. esculentus approximately 39.5 Mya (Fig. 2a). Subsequent to this divergence, the E. dulcis genome experienced expansion of 1,871 gene families and contraction of 160 gene families (Supplementary Table S10). Notably, E. dulcis exhibited the highest number of expanded gene families and the lowest number of contractions among the analyzed Cyperaceae species. Gene Ontology (GO) enrichment analysis revealed that expanded gene families were significantly associated with biosynthetic processes, transporter activity, and calcium ion binding (Fig. 2b), whereas contracted gene families were primarily enriched in processes such as proteolysis, serine-type endopeptidase activity, and ADP binding (Fig. 2c).
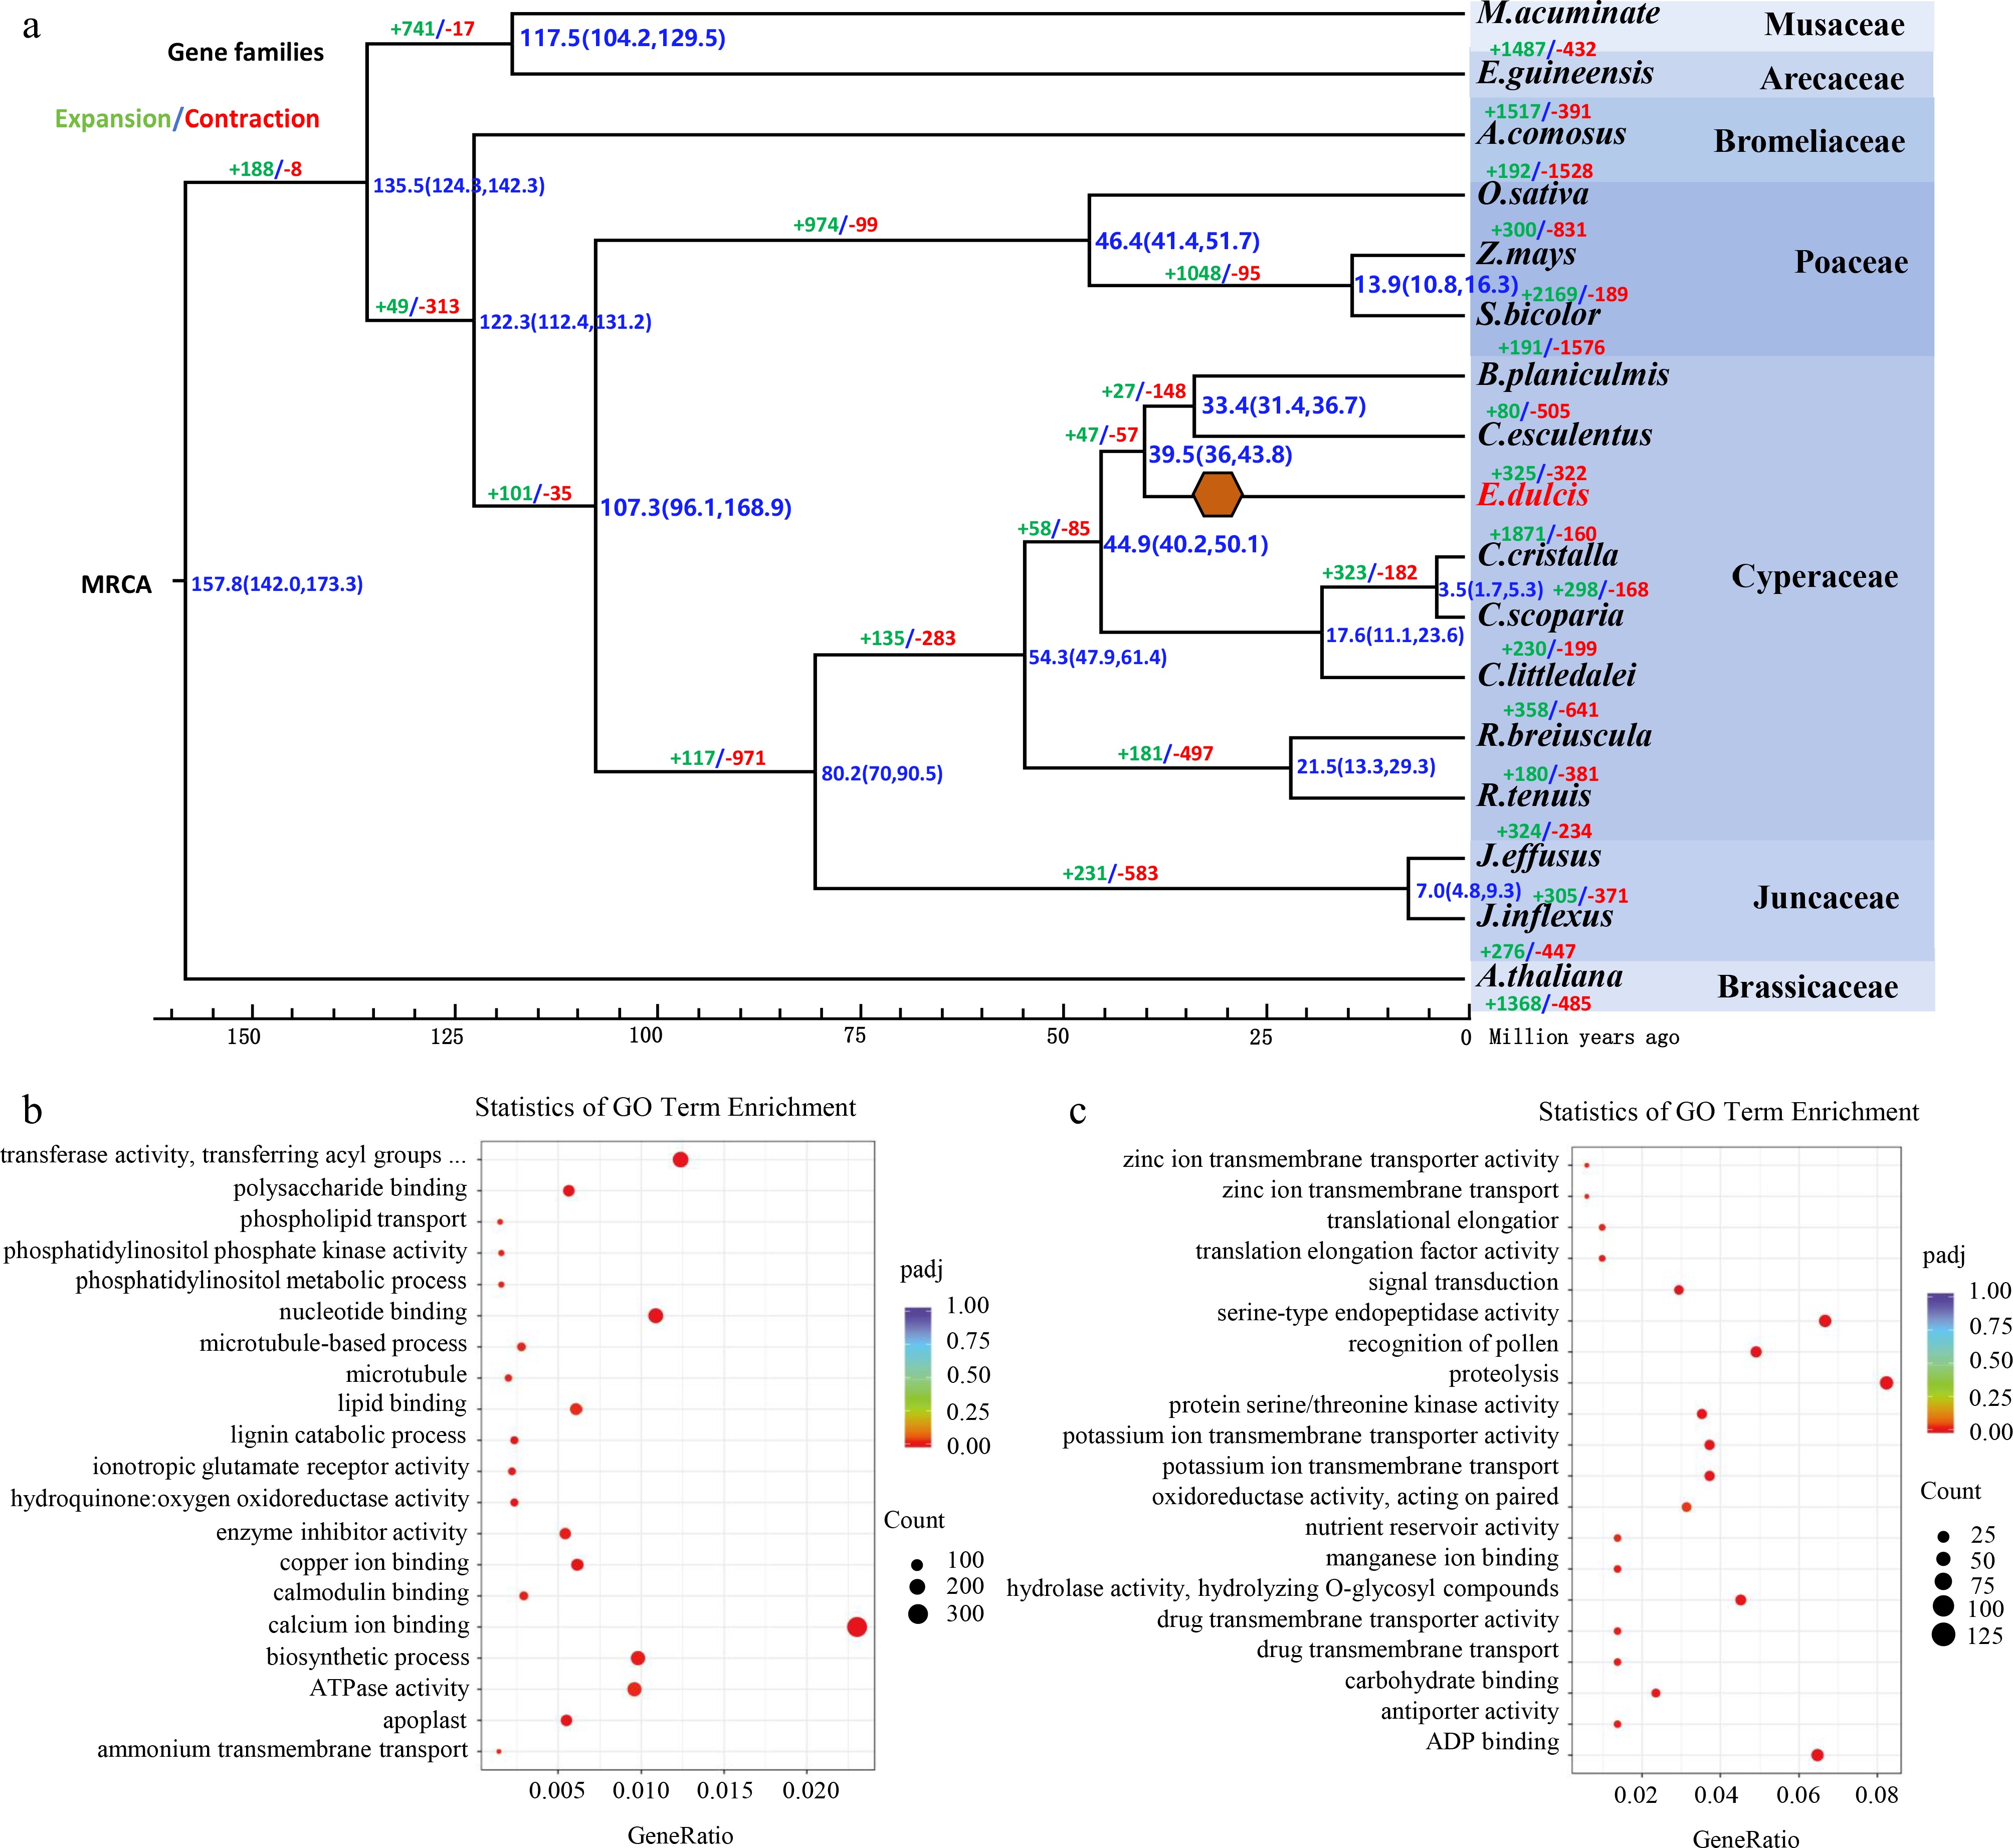
Figure 2.
Gene family expansion and contraction in E. dulcis. (a) Phylogenetic relationships and divergence times of E. dulcis and 16 other plant species, as well as contracted and expanded gene families. Blue numbers at each node represent the divergence time (million years ago; Mya), whereas the numbers in parentheses represent the 95% confidence intervals of the divergence times. Green and red numbers indicate expanded and contracted gene families, respectively. MCRA, most recent common ancestor. The 17 species are divided into the following seven families: Musaceae, Arecaceae, Bromeliaceae, Poaceae, Cyperaceae, Juncaceae, and Brassicaceae. (b) Enriched GO functional terms assigned to expanded E. dulcis gene family members. (c) Enriched GO functional terms assigned to contracted E. dulcis gene family members. The abscissa presents the rich factor (percentage of annotated genes), whereas the ordinate presents the enrichment. The size of each point represents the number of genes annotated with the enriched GO term, whereas the color represents the q-value (low values indicate significance). Whole-genome duplications are marked by orange hexagons.
Notably, the genome size and gene number of E. dulcis were significantly larger than those of other Cyperaceae species (Fig. 3a, b), indicative of substantial genome expansion during its evolution. Synteny analysis further indicated a marked increase in the number of syntenic blocks associated with whole-genome duplication (WGD) in the E. dulcis genome (Fig. 3c). Based on the distribution of synonymous substitution (Ks) values for paralogous and orthologous genes, we detected a recent WGD event in the E. dulcis genome (Fig. 3d). A distinct peak at Ks = 0.12 (95% CI: 0.08–0.16) was identified, comprising 1,247 collinear gene pairs across 186 syntenic blocks. This peak was absent from all other Cyperaceae species examined under the same analytical pipeline (Fig. 3d). However, whether this WGD event is truly specific to the cultivated lineage or represents a feature shared with other Eleocharis accessions awaits confirmation through sequencing of additional germplasm, including the starchy-type cultivar and wild relatives. Tandem duplicates (within 200 kb) showed no similar peak, and the whole-paranome background distribution lacked this signal, confirming its WGD origin rather than segmental or tandem duplications. For instance, while the SBE2 and SBE3 subfamilies typically maintain single copies in other Cyperaceae species, WGD in E. dulcis resulted in duplicated paralogs (SBE2.2 and SBE3.2) located on pseudochromosomes 3 and 76, respectively (Fig. 3e–g). Karyotype evolution analysis indicated that the transition from the ancestral monocot karyotype (AMKA, with only 7 chromosomes, excluding Cyperaceae) to Cyperaceae species (2n = 2–222) involved drastic karyotype rearrangements. We compared the karyotype evolution patterns between the AMKA and the eight Cyperaceae genomes in this study (Supplementary Figs S3–S10). In Rhynchospora tenuis (with only two chromosomes), its karyotype evolution involved multiple breaks and fusions of ancestral chromosomes, mediated by mechanisms including reciprocal translocation arms (RTA), end-to-end joining (EEJ), and nested chromosome fusion (NCF). In contrast, synteny analysis revealed 23 chromosomes with fusion patterns consistent with EEJ, five with RTA-like patterns, and three with NCF-like patterns. However, a WGD from n = 54 would be expected to yield n = 108; the observed 111 pseudochromosomes exceed this number by three, which may reflect assembly-related clustering issues, small derivative chromosomes, or inaccuracies in the reference karyotype. These fusion mechanisms should therefore be considered as synteny-based hypotheses rather than validated chromosomal events.
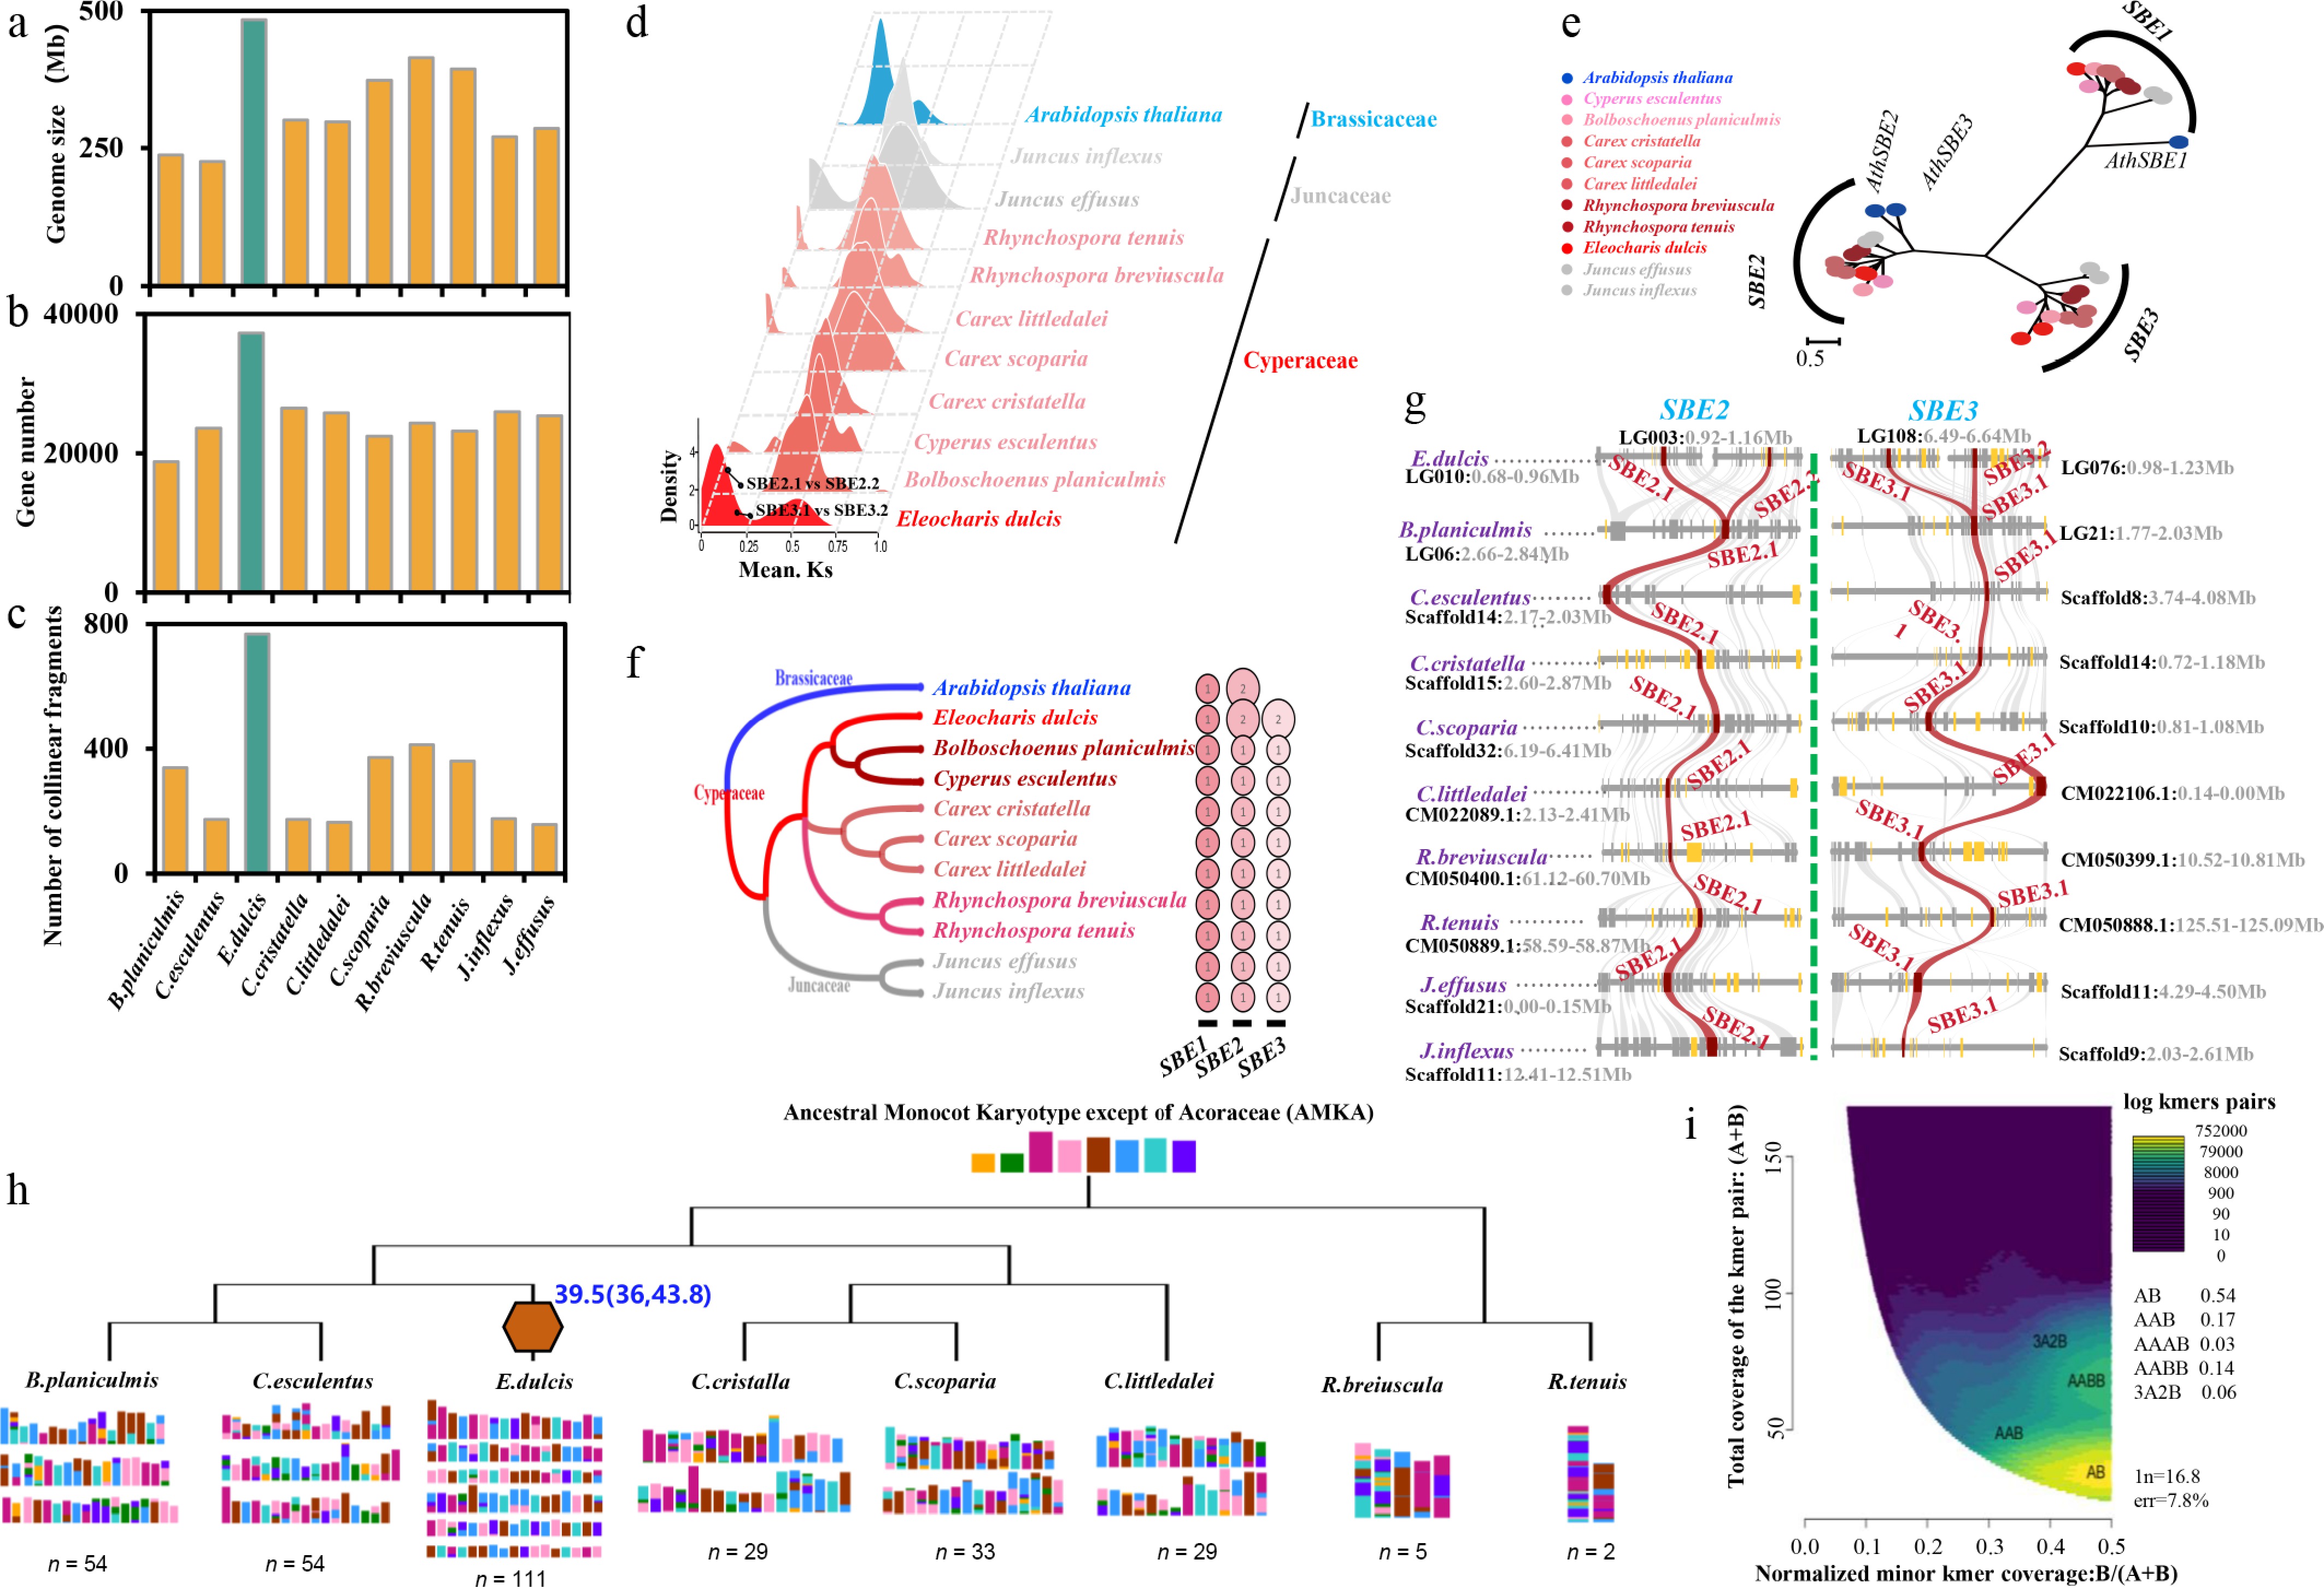
Figure 3.
Evidence for whole-genome duplication (WGD) in the E. dulcis genome. Comparison between E. dulcis and 10 closely related species in terms of (a) genome size, (b) gene number, (c) number of collinear fragments, and (d) whole-genome Ks values. Peaks represent potential whole-genome duplication events. (e) Phylogenetic analysis of the SBE gene family. Alignment of the amino acid sequences encoded by 34 SBE genes from Arabidopsis, nine Cyperaceae species, and two Juncaceae species using MAFFT. A phylogenetic tree was constructed using IQ-TREE 2 (1,000 bootstrap replicates). The analyzed SBE genes were regrouped into three subfamilies. (f) Number of members in SBE gene subfamilies. (g) Collinearity analysis of SBE2 and SBE3 in the E. dulcis genome and the genomes of 10 closely related species. The collinearity analysis was performed, and the generated data were visualized using MCScanX and JCVI (MCScanX Python version). Red lines indicate collinear relationships between SBE2 and SBE3 small cluster genes across genomes, whereas gray lines indicate collinear relationships of non-SBE genes. Genes in gold represent non-collinear genes. (h) Ideograms are based on the published chromosome-level genome assemblies and their origins reconstructed using the WGDI. Schematic phylogenetic relationships follow the phylogenetic analyses. Whole-genome duplications are marked by orange hexagons. (i) Smudgeplot-predicted genome group ploidy on the basis of 21-mers.
Smudgeplot ploidy analysis showed higher confidence for the AB model (0.54 vs 0.14 for AABB), with no clear AABB peak. This pattern is consistent with a trend towards diploidization following the WGD event, although this interpretation remains tentative and requires cytogenetic validation. This observation is consistent with a trend towards diploidization following the WGD event, although definitive conclusions regarding the current ploidy level require further cytogenetic validation. The insertion times of orthologous LTR retrotransposons further revealed a large-scale transposon insertion event approximately 69 Mya (Supplementary Fig. S11), which likely contributed to genome reorganization and provided genetic material for neofunctionalization over evolutionary time. This inference is consistent with the identification of 521 species-specific gene families in E. dulcis, which potentially enhance its adaptation to aquatic hypoxia and pathogen stress (Fig. 2).
Key genes underlying differences in starch and sugar content between starch-type and fresh-consumption-type E. dulcis corms
-
E. dulcis represents a typical tuber crop with both starchy-type and fresh-consumption-type cultivars, where differences in corm starch and sugar content directly affect processing quality and edible properties. Composition analysis revealed that the total starch content in mature corms of 'Fruit_GXNo.3' was significantly lower than that of 'Starch_GXNo.1' (Fig. 4a). Further analysis of starch components revealed that this difference was primarily driven by variation in amylopectin content. Notably, the amylose content of 'Fruit_GXNo.3' was higher than that of 'Starch_GXNo.1' (Fig. 4a), and the elevated amylose-to-amylopectin ratio may contribute to its characteristically crisp texture. Although the total starch content of 'Fruit_GXNo.3' showed an increasing trend during corm development, its overall increase was smaller than that of 'Starch_GXNo.1', and a decrease in total starch content was observed at maturity (Fig. 4b), suggesting starch degradation occurs in 'Fruit_GXNo.3' at maturity, potentially providing precursors for sugar accumulation. In both cultivars, amylopectin content increased with total starch content, whereas 'Fruit_GXNo.3' maintained a consistently higher amylose level throughout the developmental stages (Fig. 4b).
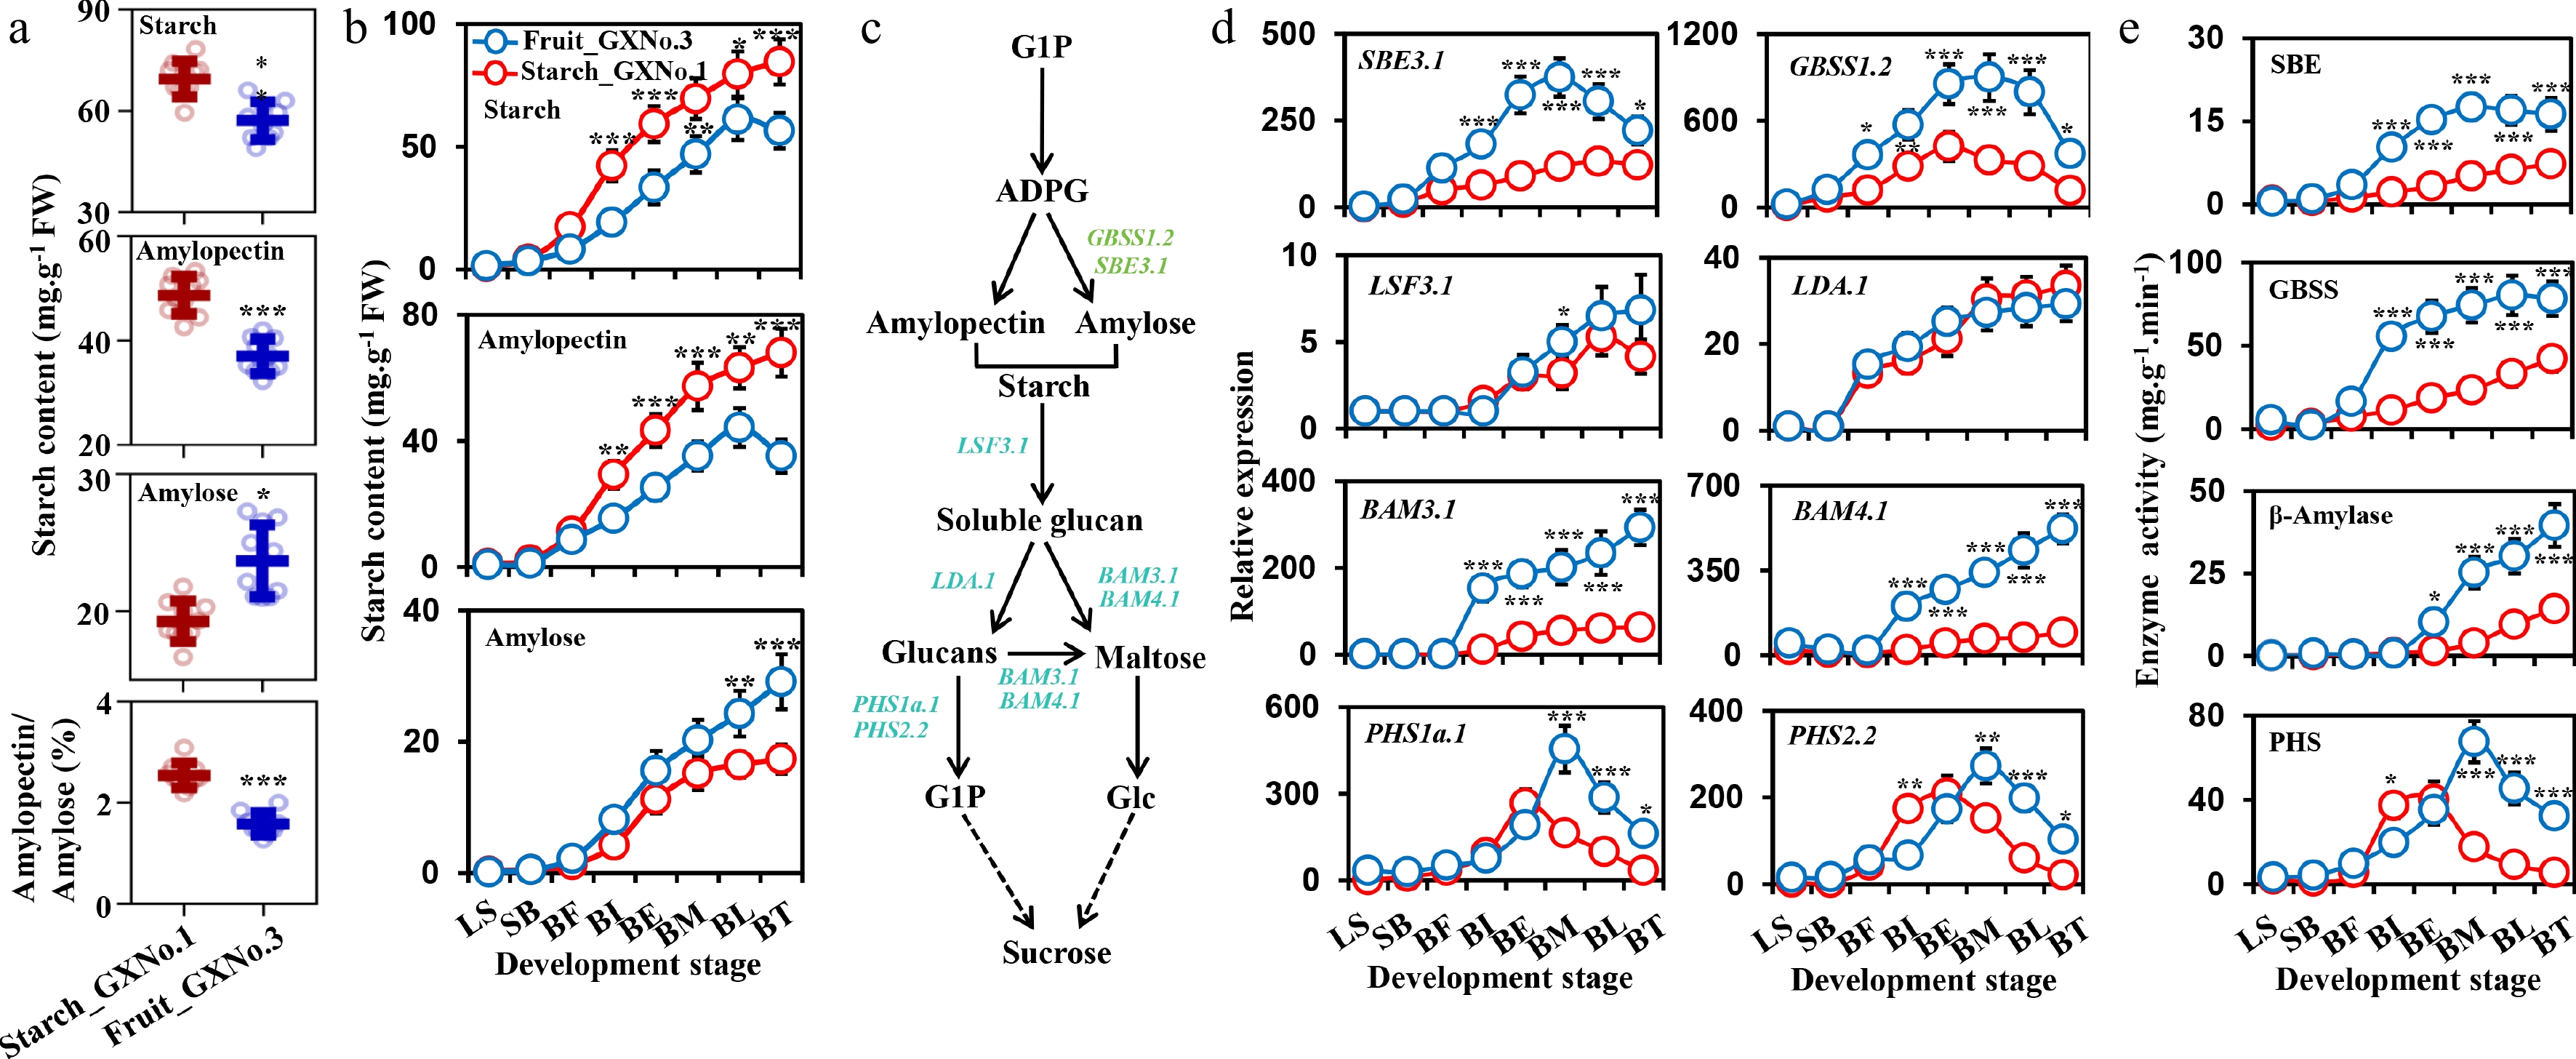
Figure 4.
Identification of starch composition and related metabolic genes in 'Starch_Gxno.1' and 'Fruit_Gxno.3' E. dulcis corms. (a) Comparison of total starch, amylopectin, and amylose contents and the amylopectin:amylose ratio between 'Starch_GXNo.1' and 'Fruit_GXNo.3' mature corms. Ten biological replicates were analyzed for each comparison. (b) Model of the accumulation of total starch, amylopectin, and amylose during 'Starch_GXNo.1' and 'Fruit_GXNo.3' corm growth and development. Ten biological replicates were analyzed for each developmental stage. (c) Diagram of starch metabolism pathways. Green and cyan genes are starch synthesis and starch degradation genes that were differentially expressed according to transcriptome data. (d) qRT-PCR analysis of differentially expressed candidate starch metabolism-related genes in the developing corms of two varieties. (e) Analysis of the activities of the enzymes encoded by the differentially expressed candidate starch metabolism-related genes in the developing corms of two varieties. Five biological replicates were analyzed for each developmental stage in panels (d) and (e). Data are presented as the mean ± SD for the biological replicates. *, **, and *** represent significant differences at p < 0.05, p < 0.01, and p < 0.001, respectively, according to Tukey's multiple comparisons test after ANOVA.
We performed transcriptome profiling for key genes involved in starch synthesis (SBE, GBSS) and degradation (LSF, LDA, BAM, PHS) pathways (Supplementary Fig. S12; Fig. 4c). qRT-PCR analysis confirmed that during late corm development, the expression levels of GBSS1.2 and SBE3.1, both involved in amylose synthesis, as well as BAM3.1, BAM4.1, PHS1a.1, and PHS2.2, implicated in amylopectin degradation, were significantly elevated in 'Fruit_GXNo.3' compared to 'Starch_GXNo.1' (Fig. 4d). These transcriptional differences were strongly corroborated by corresponding enzyme activity assays (Fig. 4e). Thus, enhanced amylose synthesis mediated by GBSS1.2 and SBE3.1, coupled with accelerated amylopectin degradation mediated by BAM3.1, BAM4.1, PHS1a.1, and PHS2.2, collectively form the molecular basis for the differences in starch metabolism between the two cultivars.
Analysis of soluble sugars revealed a significantly higher total soluble sugar content in mature corms of 'Fruit_GXNo.3' compared to 'Starch_GXNo.1' (Fig. 5a). This difference was primarily attributed to sucrose accumulation, as fructose and glucose levels did not differ significantly between the two cultivars (Fig. 5a). Throughout corm development, fructose and glucose accumulated similarly in both cultivars. In contrast, 'Fruit_GXNo.3' displayed a significantly higher sucrose accumulation rate as early as the bulking initial (BI) stage (Fig. 5b), indicating that rapid sucrose accumulation during early development is the major reason for the high sugar content in 'Fruit_GXNo.3'.
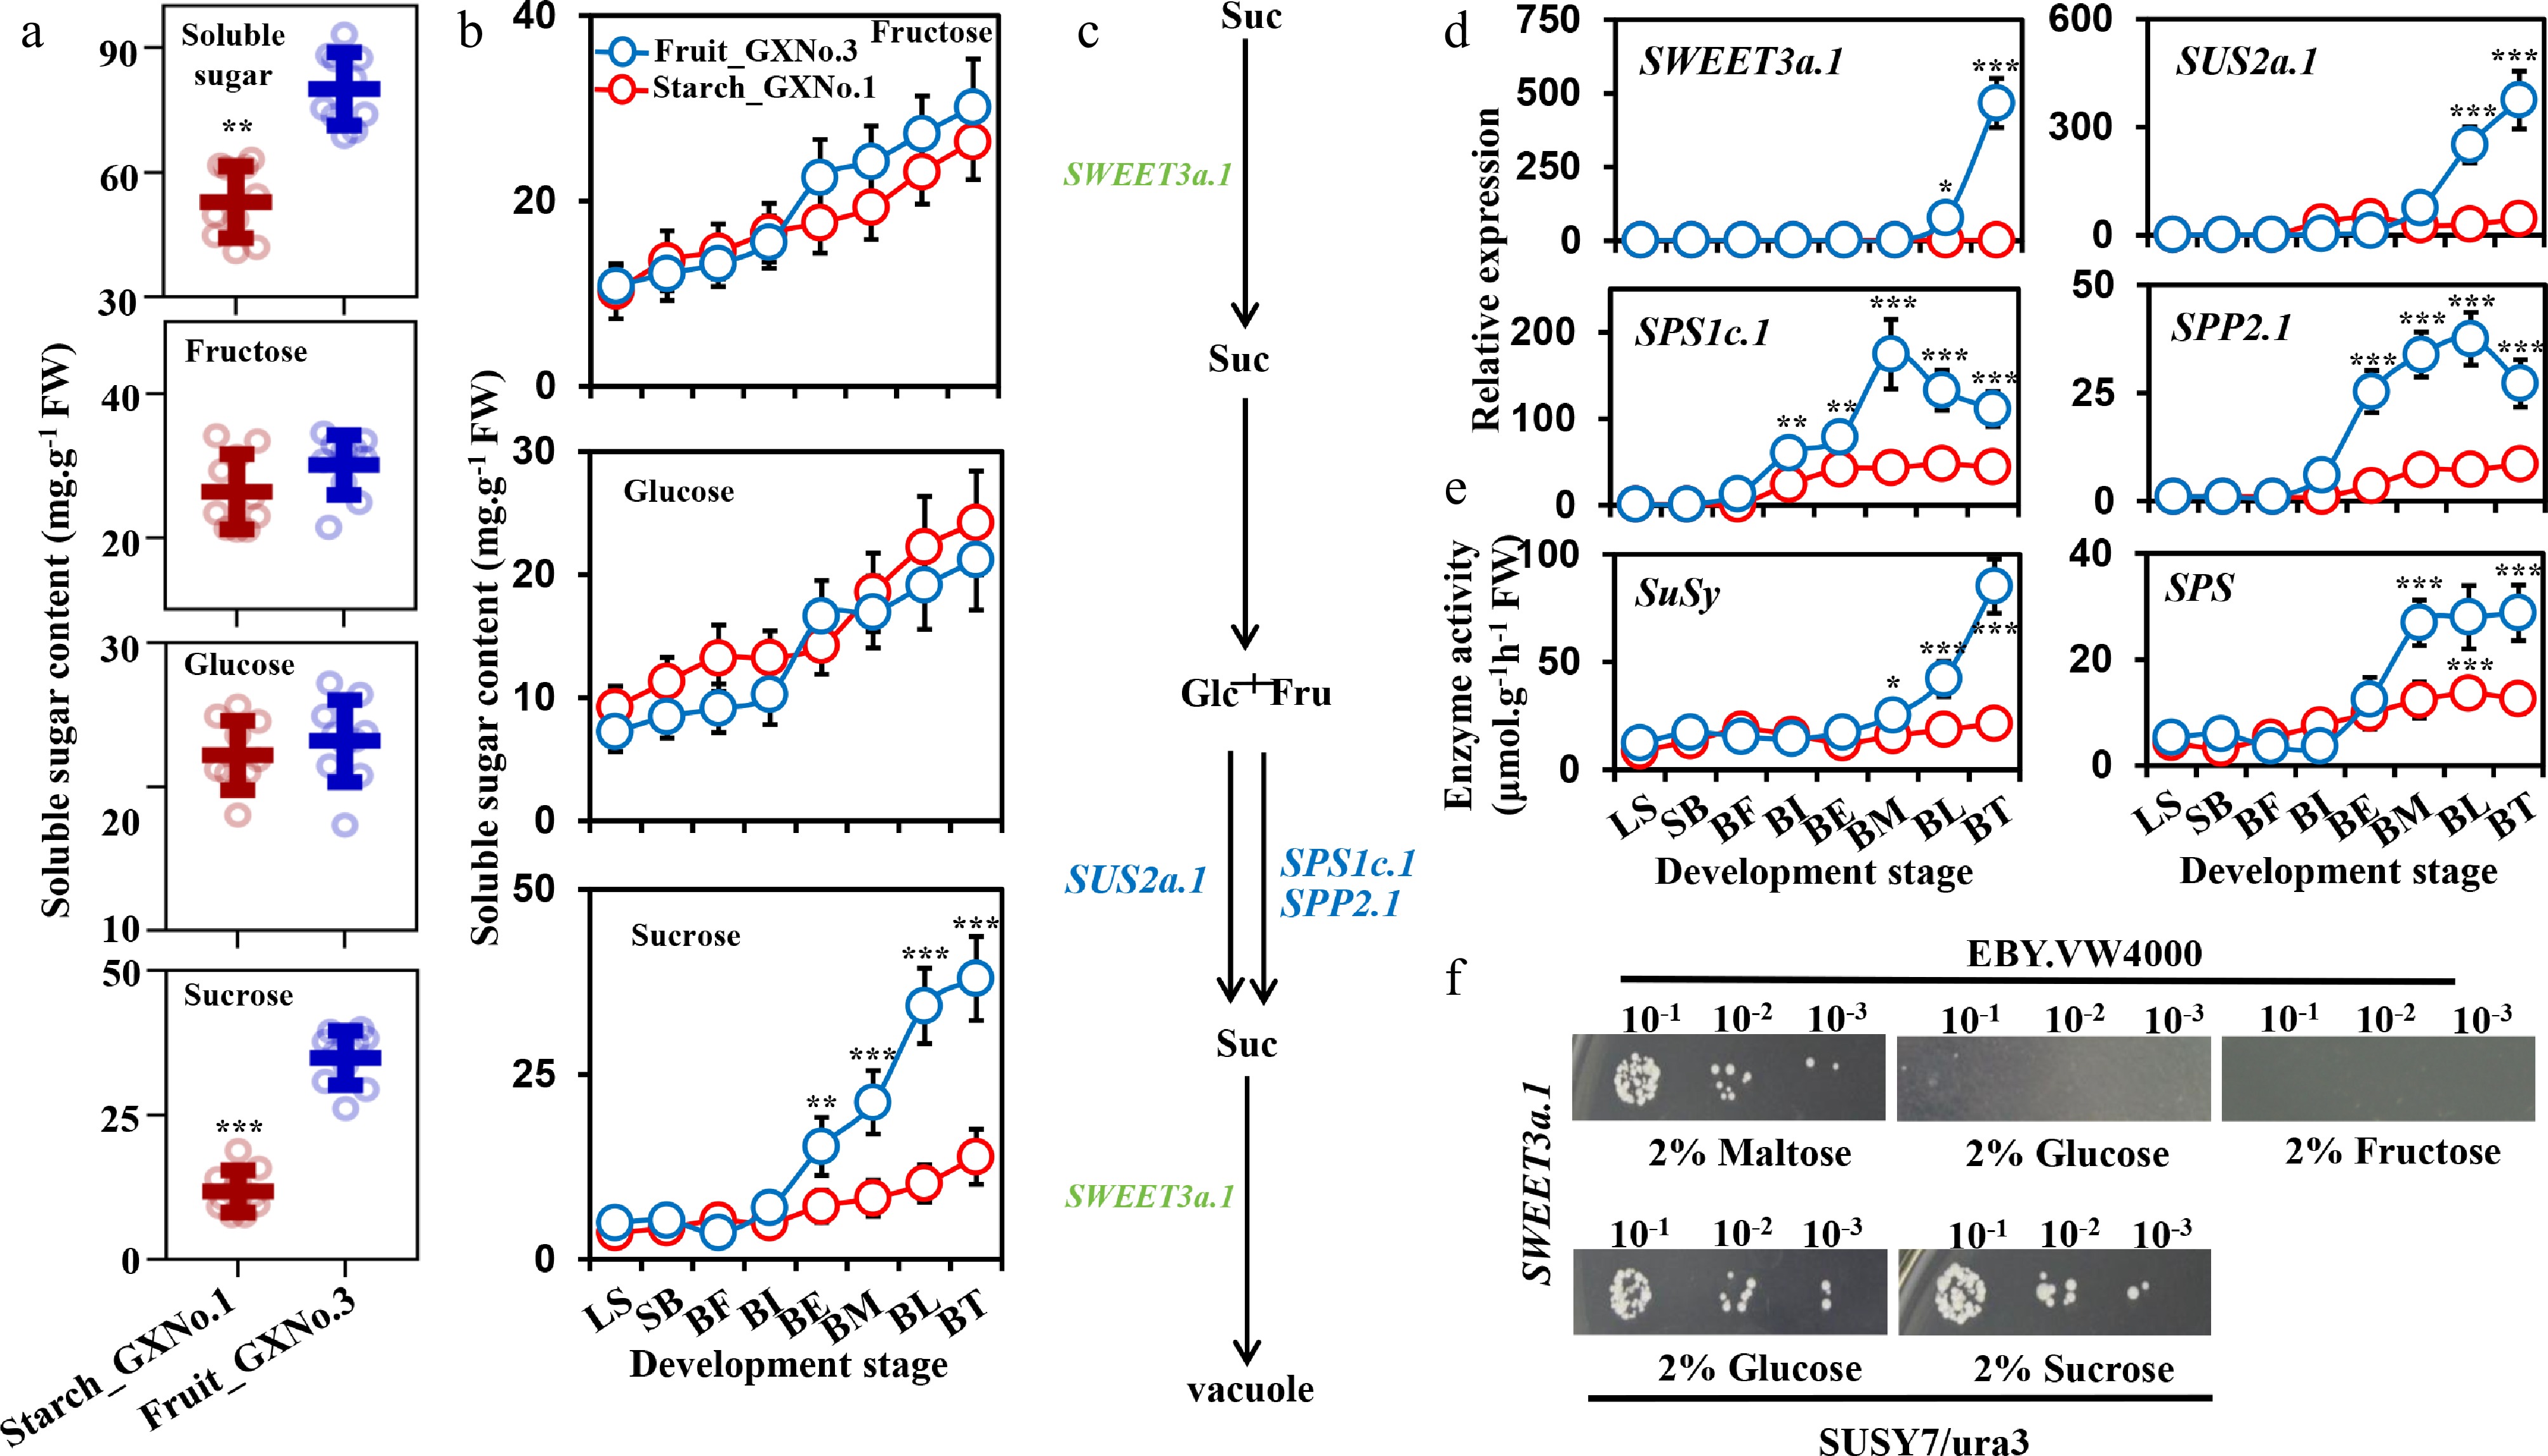
Figure 5.
Identification of sugar composition and related metabolic genes in 'Starch_Gxno.1' and 'Fruit_Gxno.3' E. dulcis corms. (a) Quantification of soluble sugars, including fructose, glucose, and sucrose, in mature corms of 'Starch_GXNo.1' and 'Fruit_GXNo.3'. Ten biological replicates were analyzed for each comparison. (b) Model depicting the accumulation patterns of fructose, glucose, and sucrose during the growth and development of corms in the two varieties. Ten biological replicates were analyzed at each developmental stage. (c) Diagram of the sucrose metabolism pathway. Genes highlighted in green and blue represent differentially expressed genes involved in sucrose transport and synthesis, respectively, as revealed by transcriptomic analysis. (d) qRT-PCR analysis of selected differentially expressed sucrose metabolism-related genes in developing corms of the two varieties. (e) Enzyme activity assays of the proteins encoded by the differentially expressed sucrose metabolism-related genes in developing corms of the two varieties. Five biological replicates were analyzed at each developmental stage in panels (d) and (e). Data are presented as mean ± SD of biological replicates. Asterisks (*, **, ***) denote statistically significant differences at p < 0.05, p < 0.01, and p < 0.001, respectively, based on Tukey's multiple comparisons test following ANOVA. (f) Functional analysis of SWEET3a.1 in yeast. Complementation of the hexose transporter-deficient yeast mutant strain EBY.VW4000 on SD/−Ura medium supplemented with 2% maltose, 2% glucose, or 2% fructose. Complementation of the sucrose transporter-deficient yeast mutant SUSY7/ura3 on SD/−Ura medium supplemented with 2% glucose or 2% sucrose. Numbers indicate serial dilutions (10-, 100-, and 1,000-fold) of the yeast suspension.
In plants, sucrose is transported from source organs to sink organs via transporters such as SWEET and SUT. It can then be hydrolyzed into monosaccharides by sucrose-degrading enzymes (e.g., SUS, INV), or resynthesized and stored in sink tissue via the SUS and SPS–SPP pathways, thereby influencing flavor quality (Fig. 5c). Transcriptome and qRT-PCR analyses confirmed that in the late stages of corm development, the expression levels of SWEET3a.1, involved in sucrose transport, and SUS2a.1, SPS1c, and SPP2, involved in sucrose synthesis, were significantly upregulated in 'Fruit_GXNo.3' (Supplementary Fig. S13; Fig. 5d). Enzyme activity assays further showed that the key enzyme activities of the two sucrose synthesis pathways in 'Fruit_GXNo.3' during late development were significantly higher than those in 'Starch_GXNo.1' (Fig. 5e). Functional complementation experiments demonstrated that EduSWEET3a.1 could restore sucrose transport function in the sucrose transport-deficient yeast mutant SUSY7/ura3, but could not support the growth of the hexose transporter-deficient strain EBY.VW4000 (Fig. 5f), confirming that SWEET3a.1 specifically functions as a sucrose transporter. In summary, enhanced sucrose transport via SWEET3a.1, synergistic with elevated sucrose synthesis mediated by SUS2a.1, SPS1c, and SPP2, collectively drives the rapid sucrose accumulation in 'Fruit_GXNo.3' corms at late developmental stages.
-
Fresh-consumption type E. dulcis cultivars, characterized by high sugar and low starch content, satisfy the market demand for sweetness and non-mealy texture, and their crisp and juicy attributes align with modern consumer preferences. Breeding such cultivars supports the transition of E. dulcis from a traditional vegetable to a high-value fresh fruit crop, thereby enhancing cultivation profitability. Elucidating the mechanisms underlying differential sugar and starch accumulation among varieties has become a central goal in breeding research, as it is crucial for developing targeted improvement strategies. In this study, we assembled a high-quality genome of the fresh-consumption type cultivar 'Fruit_GXNo.3', which diverged from B. planiculmis and C. esculentus approximately 39.5 Mya and subsequently underwent an independent WGD event. The superior flavor of its corms is primarily attributed to reduced total starch and amylopectin content, coupled with elevated amylose and sucrose levels. Differential expression of starch metabolism-related genes (GBSS1.2, SBE3.1, BAM3.1, BAM4.1, PHS1a.1, PHS2.2) and sucrose metabolism-related genes (SWEET3a.1, SUS2a.1, SPS1c, SPP2.1), along with corresponding changes in enzyme activities during late corm development, are key to the differences in starch and sucrose content between 'Fruit_GXNo.3' and 'Starch_GXNo.1' (Fig. 6). These results provide novel insights into the regulation of starch and sucrose accumulation in plant storage organs and establish a molecular foundation for improving corm quality in E. dulcis.
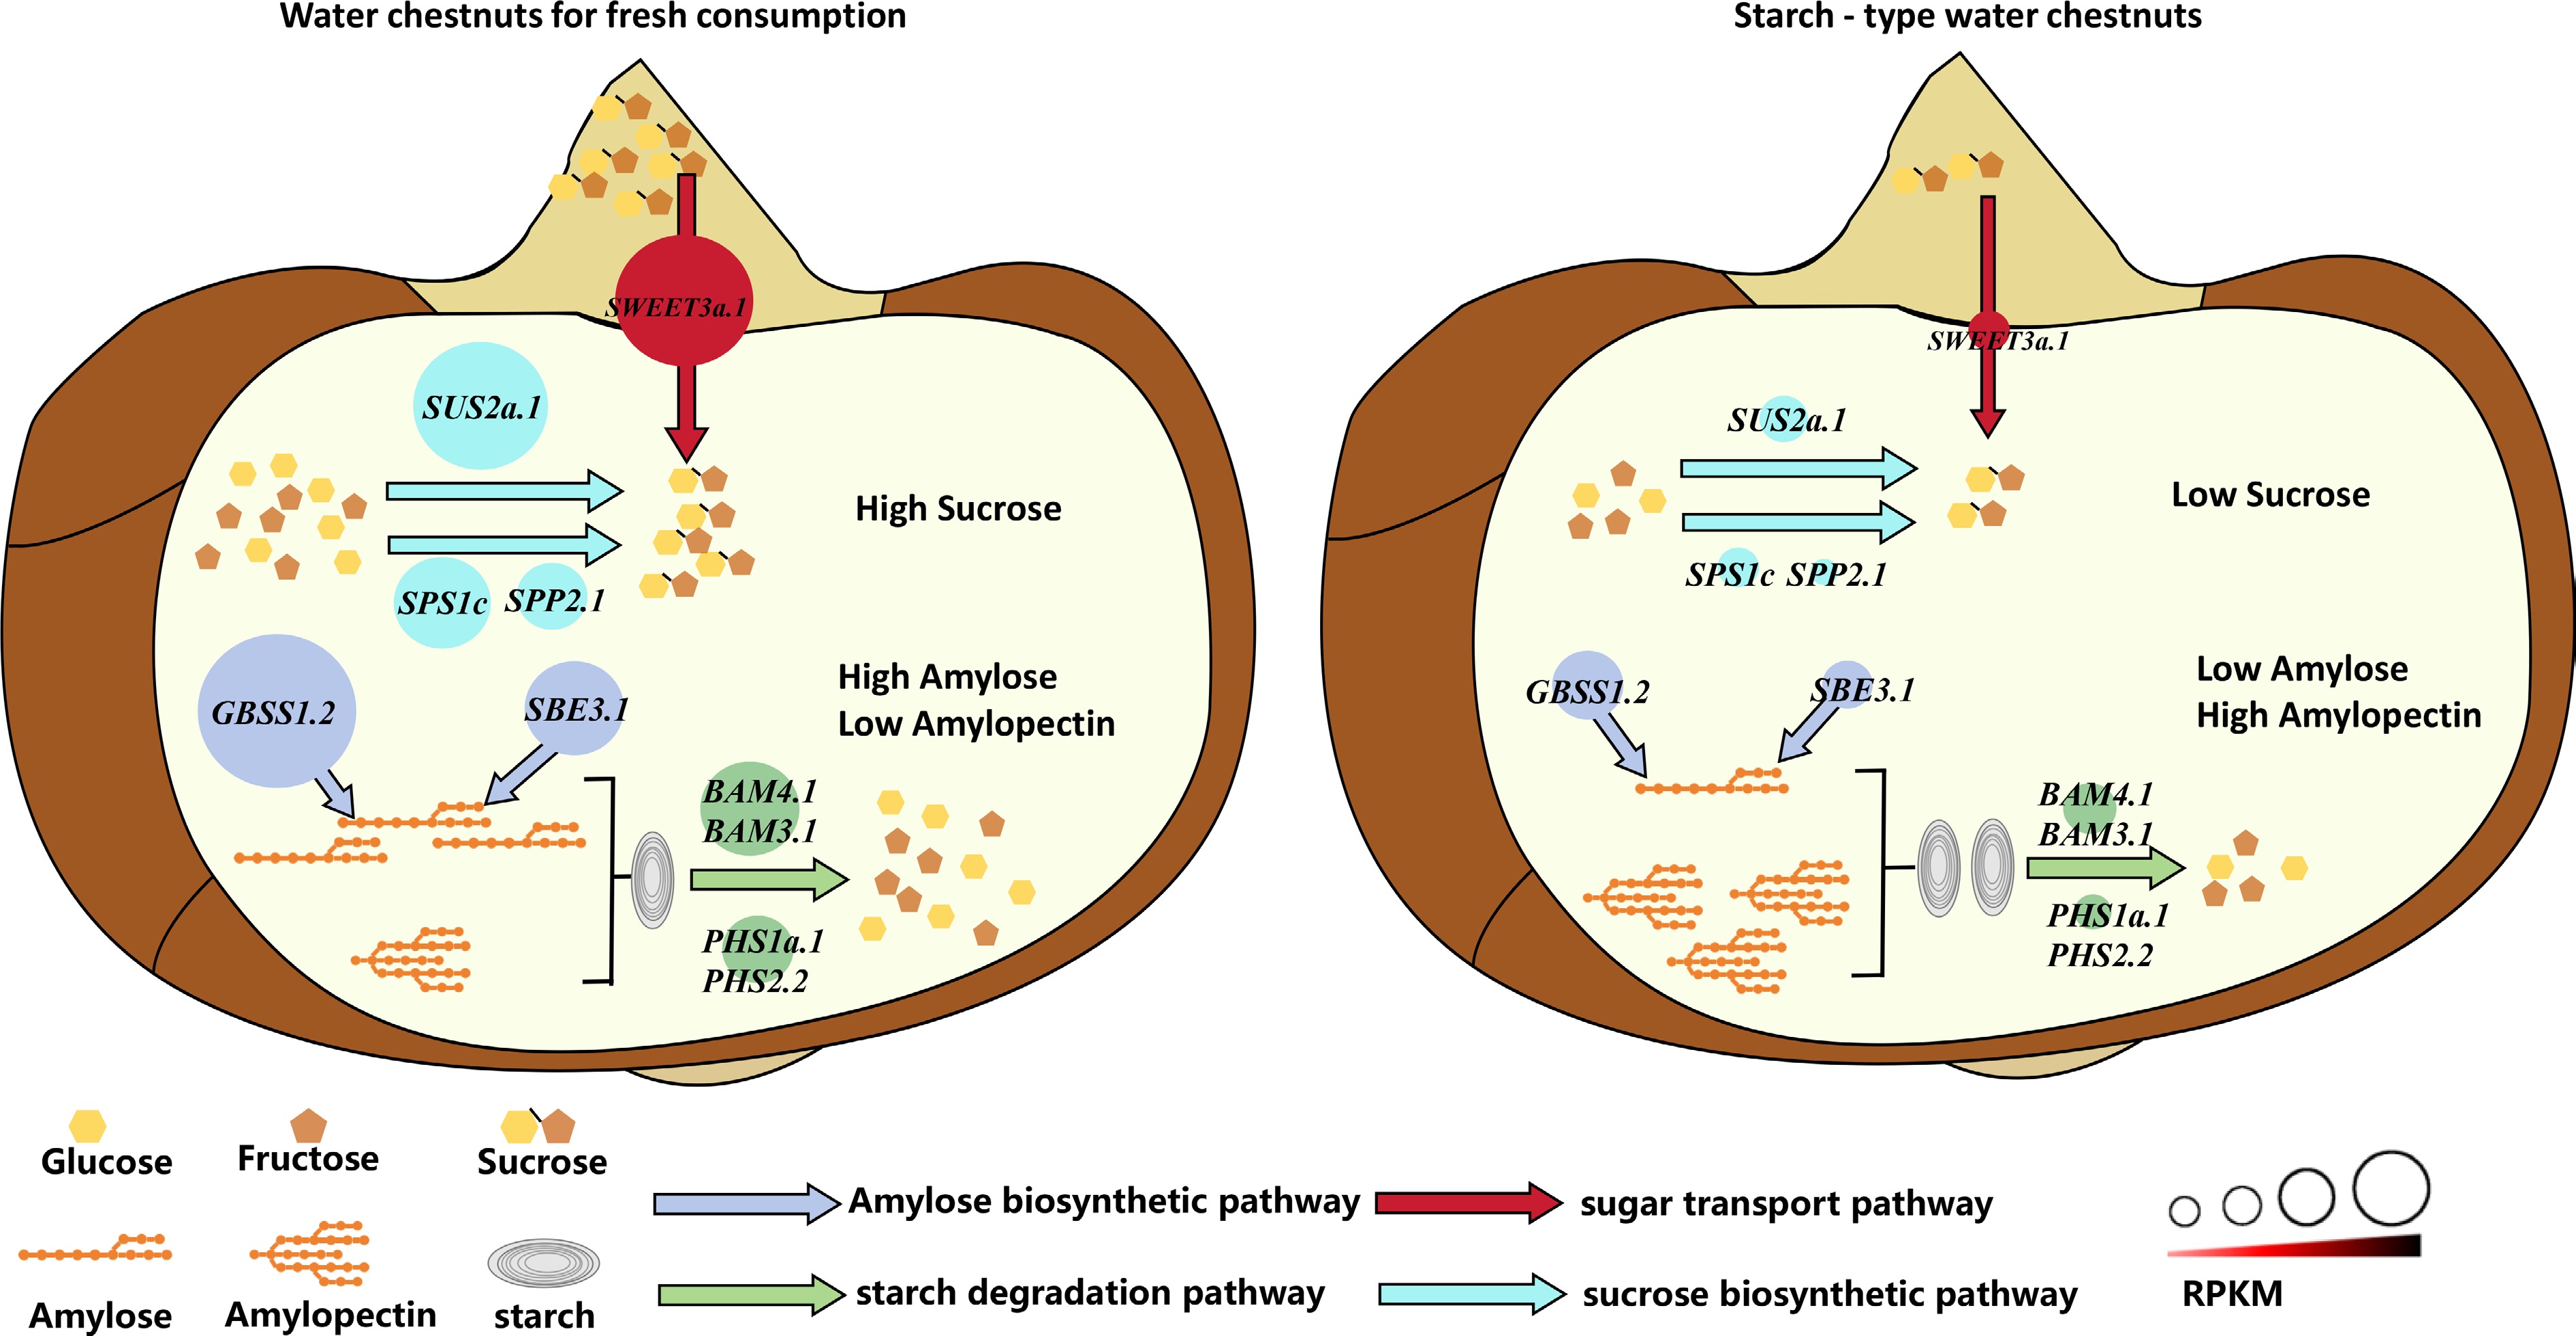
Figure 6.
Proposed model for quality formation in fresh fruit-type and starch-type E. dulcis corms. The high expression of amylose synthesis-related genes (GBSS1.2 and SBE3.1), starch degradation-related genes (BAM3.1, BAM4.1, PHS1a.1, and PHS2.2), the sucrose transporter gene (SWEET3a.1), and sucrose synthesis-related genes (SUS2a.1, SPS1c, and SPP2.1) plays a crucial role in the development of crisp and sweet fresh E. dulcis corms.
Chromosome-level assembly of cultivated E. dulcis reveals WGD-driven evolutionary mechanisms
-
The recently published wild-type T2T genome of E. dulcis (521.12 Mb)[19] represents a notable technical achievement. Our assembly of the cultivated fresh-consumption variety 'Fruit_GXNo.3' (483.88 Mb, 111 pseudochromosomes) offers three contributions that the T2T genome alone cannot provide.
First, our assembly directly represents the genetic background of a major Chinese cultivated cultivar, allowing us to identify cultivar-specific genomic features. We identified 521 species-specific gene families enriched in stress response and carbohydrate metabolism pathways, which may contribute to the unique agronomic performance of this fresh-consumption type. Among the expanded gene families, we found 42 genes enriched in the hypoxia response pathway (GO:0001666), including three ethylene response factors (ERFs), and 18 genes enriched in osmoregulation (GO:0006972), including six SWEET transporter paralogs. These expanded families may offer preliminary molecular clues for adaptation to aquatic environments, though their functional relevance to submerged growth and corm development requires experimental validation. The gene number (37,251) and repetitive element landscape (45.03% of the genome) further indicate a genome structure shaped by both ancient transposon activity and recent selection.
Second, we uncovered a recent WGD event (~0.69 Mya) not detected in the wild T2T assembly. This WGD directly doubled the chromosome number from n = 54 in B. planiculmis to n = 111 in E. dulcis (Fig. 3), supported by a distinct Ks peak at 0.12 (95% CI: 0.08–0.16) comprising 1,247 collinear gene pairs across 186 syntenic blocks—a signal absent from all other Cyperaceae species examined. The doubling involved distinct fusion mechanisms: end-to-end joining (EEJ, e.g., Chr7, 11, 18; 23 chromosomes), reciprocal translocation of chromosome arms (RTA; five chromosomes), and nested chromosome fusion (NCF; three chromosomes, including Chr36), as identified by WGDI based on collinearity patterns at breakpoints. Chromosomes formed via different mechanisms exhibited distinct Hi-C contact patterns—sharp boundaries for EEJ vs more complex interchromosomal contacts for RTA-NCF-derived chromosomes. Despite extensive rearrangements, eight chromosomes (Chr 2, 3, 4, 5, 6, 8, 9, 10) retained a configuration highly similar to the ancestral monocot karyotype. This WGD-driven expansion likely provided genetic raw material for the neofunctionalization of genes controlling carbohydrate metabolism, including SBE2.2, SBE3.2, and SWEET3a.1. The karyotype interpretation presented here is based solely on computational inference from a single genome assembly and lacks cytogenetic validation (e.g., FISH, karyotyping). We therefore frame these conclusions as a working hypothesis rather than as demonstrated chromosomal events.
Third, we identified and functionally validated key metabolic genes that directly explain the high-sucrose, low-starch phenotype of fresh-consumption E. dulcis. The differential expression of GBSS1.2, SBE3.1, BAM3.1, BAM4.1, PHS1a.1, PHS2.2, SWEET3a.1, SUS2a.1, SPS1c, and SPP2.1 during corm development, together with corresponding enzyme activity changes, provide a molecular framework for understanding quality formation. These candidate genes are not available from the wild-type T2T genome and offer direct targets for marker-assisted breeding.
Smudgeplot analysis suggested a trend towards diploidization after WGD (AB configuration confidence 0.54; Fig. 3j), accompanied by gene loss and functional differentiation to maintain genome stability[47], a pattern similar to the rediploidization process in Brassicaceae polyploids[48]. The large-scale LTR retrotransposon insertion event at approximately 69 Mya (Supplementary Fig. S3) and the recent WGD event at ~0.69 Mya occurred on distinctly different evolutionary timescales. The ancient transposon burst likely contributed to long-term genome restructuring and provided repetitive sequence resources, while the much more recent WGD directly drove chromosome doubling and recent gene family expansion. These two events appear to have independently shaped the water chestnut genome at different evolutionary stages, rather than representing a direct causal chain. Collectively, this independent WGD event corroborates polyploidization as a central mechanism driving karyotype diversity and aneuploidy (2n = 2–224) in Cyperaceae[49], while reinforcing its key role in aquatic niche adaptation.
The WGD event occurred ~0.69 Mya, long before the recent mutagenesis breeding that generated 'Fruit_GXNo.3'. Thus, it did not directly cause the high-sucrose phenotype. Rather, the WGD likely provided genetic redundancy that served as raw material for subsequent regulatory divergence, while the phenotypic differences between cultivars are primarily explained by differential gene expression (Figs 4, 5). We also acknowledge that whether this WGD is unique to the cultivated lineage or shared with other germplasm remains unresolved without additional genome assemblies.
The karyotype interpretation presented here is based solely on computational inference from a single genome assembly and lacks cytogenetic validation (e.g., FISH, karyotyping). We therefore frame these conclusions as a working hypothesis rather than as demonstrated chromosomal events.
Metabolic gene-mediated differences in starch components contribute to taste variation between cultivars
-
Starch is a major component of plant storage organs, where its accumulation influences tissue turgor and firmness. In many fresh fruits like apples, bananas, and kiwifruit, sugars are synthesized into starch during early development, which is degraded into soluble sugars during ripening[13]. High-amylose starch is known to confer lower water-holding capacity and slower hydrolysis, traits associated with crispness and firmness[50]. Granule-bound starch synthase (GBSS) is the key enzyme exclusively responsible for amylose synthesis, and its absence leads to a lack of amylose[51]. Amylopectin synthesis relies on starch branching enzymes (SBEs). SBEII prefers amylopectin as a substrate, while SBEI utilizes amylose more efficiently[52]; in vitro studies show SBEII can act on long amylose chains (DP ~6,000)[53]. GBSSI and SBEI compete for common substrates, responsible for amylose chain elongation and branching formation, respectively[54]. These results align with the established model that GBSS is indispensable for amylose chain elongation and that specific SBE isoforms contribute to branch formation[54]. The elevated expression and enzymatic activity of GBSS1.2 and SBE3.1 in 'Fruit_GXNo.3' corms therefore provide a direct molecular explanation for its higher amylose content, which is a key determinant of its crisp texture.
Soluble sugar accumulation largely depends on starch degradation, in which β-amylase (BAM) serves as a central regulatory enzyme. BAM activity is modulated by key phytohormones involved in organ maturation, particularly abscisic acid (ABA) and ethylene, which promote starch degradation in maturing, fresh-consumption-type organs[54]. For example, in poplar, ABA induces PtrBAM3 expression via activation of the PtrABF4-PtrABR1 transcription factor complex, leading to enhanced starch breakdown and increased soluble sugar content[55]. Similarly, ethylene treatment significantly upregulates AaBAM3 and AaBAM9, promoting starch degradation during pineapple fruit ripening[56]. Phosphorylase (PHS) acts downstream in the starch degradation pathway, working synergistically with BAM to hydrolyze amyloglucans to neutral sugars[57]. These sugars are then transported into the cytoplasm by specific transporters. In the cytoplasm, PHS acts cooperatively with disproportionating enzyme (DPE) to generate isoglucan—heteropolysaccharides containing two or more monosaccharides—and glucose-1-phosphate. These metabolites subsequently enter sucrose synthesis or other cellular metabolic pathways[58]. Concurrently, the upregulation of BAM3.1, BAM4.1, PHS1a.1, and PHS2.2 in 'Fruit_GXNo.3' indicates an enhanced starch degradation flux. BAMs initiate the hydrolysis of amylopectin side chains, while PHS acts downstream to convert linear glucans into glucose-1-phosphate, which can feed into sucrose biosynthesis[57,58]. The simultaneous enhancement of both amylose synthesis and amylopectin degradation pathways in 'Fruit_GXNo.3' is therefore a distinctive metabolic strategy that simultaneously increases sweetness precursors (via degradation) and maintains firmness (via high amylose). These metabolic differences likely underpin the variation in starch components between the two cultivars. We also attempted to identify transcription factors (TFs) co-expressed with the starch metabolism-related structural genes using a stringent Pearson correlation threshold (|r| ≥ 0.9). Even under this high-stringency criterion, each structural gene was associated with more than 10 potential TFs (up to 50) across multiple families (MYB, bZIP, ERF, NAC), with little convergence among independent replicate datasets. This result suggests that the current transcriptome data lack sufficient resolution to confidently predict the key regulatory TFs governing starch metabolism. Future studies with finer spatiotemporal sampling and experimental validation (e.g., DAP-seq, Y1H) are needed to elucidate the transcriptional regulatory network.
SWEET, SUS, SPS, and SPP are key genes mediating sucrose accumulation differences in edible organs across crop cultivars
-
Sucrose serves as the primary storage carbohydrate in most plants. In this study, we identified sucrose as the dominant sugar accumulating in 'Fruit_GXNo.3' corms. Notably, the difference in sucrose content was the key factor determining the flavor distinction between 'Fruit_GXNo.3' and 'Starch_GXNo.1'. Sucrose accumulation is a complex biological process involving the coordinated regulation of gene families related to sucrose transport, synthesis, and metabolism. SWEET gene family members significantly influence sucrose accumulation. For instance, in tomato, SlSWEET15 regulates sucrose release from phloem cells and subsequent uptake by storage cells[59]. In apple, MdSWEET9b promotes sucrose transmembrane transport, enhancing sugar accumulation in fruit[60]. The upregulation of SWEET3a.1 during late corm development, concurrent with a sharp rise in sucrose levels, mirrors the behavior of orthologous sucrose transporters in other crops. This suggests a conserved function of SWEET transporters in governing sucrose allocation to storage organs across diverse plant species. As the expansion rate of the storage organ slows, monosaccharides are no longer essential for cell expansion but are instead provided by polysaccharide degradation to promote sucrose synthesis. The late-stage starch degradation observed in 'Fruit_GXNo.3' likely provides a local pool of monosaccharides that feed into both the reversible SUS pathway and the irreversible SPS–SPP pathway. This two-pathway synergy has been documented in other sink organs such as citrus and potato tubers[61,62], and our data extend this model to E. dulcis corms. Previous studies support these findings: for example, increased CitSUSA expression accompanies sucrose accumulation during Satsuma mandarin fruit ripening[61]. Similarly, silencing NtSPP via RNAi in tobacco significantly reduces leaf sucrose content[62]. These findings suggest conserved roles for SUS, SPS, and SPP genes in plant sucrose biosynthesis and accumulation. In this study, increased expression of SWEET3a.1 in late corm development enhanced sucrose transport. Simultaneously, the two sucrose biosynthetic pathways mediated by SUS2a.1, SPS1c.1, and SPP2.1 were activated, promoting sucrose accumulation and influencing corm flavor. The higher expression level of SPS1c.1 relative to SPP2.1 during late bulking further supports that the SPS–SPP pathway operates as a major driver of net sucrose synthesis in E. dulcis corms, consistent with the well-established regulatory role of Suc6P hydrolysis in shifting the equilibrium toward sucrose production[62].
-
This study systematically deciphered the molecular mechanisms of starch and sucrose accumulation in 'Fruit_GXNo.3' and 'Starch_GXNo.1' (Fig. 6). The data indicate that high expression of GBSS1.2 and SBE3.1 promotes amylose synthesis, whereas upregulation of BAM3.1, BAM4.1, PHS1a.1, and PHS2.2 accelerates starch degradation, collectively contributing to the crisp texture of 'Fruit_GXNo.3'. Their sweet taste is attributed to sucrose accumulation driven by increased expression of SWEET3a.1, SUS2a.1, SPS1c.1, and SPP2.1. It should be emphasized that the phenotypic differences between 'Fruit_GXNo.3' and 'Starch_GXNo.1' are primarily attributable to differential gene expression rather than to the presence or absence of the WGD event per se. The WGD likely provided genomic raw material for regulatory evolution, but the immediate drivers of the high-sucrose, low-starch phenotype are the expression changes documented in this study. The assembled E. dulcis genome and comprehensive annotation generated in this study will serve as a valuable resource for future evolutionary studies in Cyperaceae evolution and molecular breeding of wetland plants. The immediate drivers of the high-sucrose, low-starch phenotype are the expression changes documented in this study, rather than the presence or absence of the WGD event per se.
-
The authors confirm their contributions to this study as follows: Gao M and Chen J conceived and designed the experiments, analyzed the data, and wrote the manuscript; Jiang W, Huang C, and Liu J analyzed the data and wrote the manuscript. Liu J, Hu S, Dong X, Li Q, and Lin C performed the experiments and analyzed the data; Chen J revised the manuscript. Hu Y and Lin Z re-analyzed the data during the revision process. All authors reviewed the results and approved the final version of the manuscript.
-
Public data for Arabidopsis thaliana were downloaded from The Arabidopsis Information Resource (www.arabidopsis.org). Genome data for other dicot species can be downloaded from the NCBI database (www.ncbi.nlm.nih.gov) and the plantGIR database (http://plantgir.cn)[63]. Gene identity information is provided in Supplementary Table S1.
-
The authors declare that they have no known competing financial interests or personal relationships that could have appeared to influence the work reported in this paper.
-
accompanies this paper online at: https://doi.org/10.48130/frures-0026-0033.
-
# Authors contributed equally: Meiping Gao, Chengmei Huang, Chen Lin
- Supplementary Table S1 Nanopore sequencing summary.
- Supplementary Table S2 Statistical analysis of data filtering.
- Supplementary Table S3 Statistics of valid paired-end reads.
- Supplementary Table S4 Contig clustering - statistics of chromosome lengths for 111 chromosomes.
- Supplementary Tables S5 Statistical results of genome assembly evaluation using BUSCO.
- Supplementary Table S6 Statistical results of genome assembly evaluation using CEGMA.
- Supplementary Table S7 Statistics of repetitive sequences.
- Supplementary Table S8 Statistics of non-coding RNA assembly.
- Supplementary Table S9 Statistics of gene function prediction.
- Supplementary Table S10 Statistical analysis of gene families.
- Supplementary Fig. S1 Genome assembly quality assessment.
- Supplementary Fig. S2 Sequence divergence of different transposon types in E. dulcis.
- Supplementary Fig. S3 LTR insertion time analysis for E. dulcis and four related species.
- Supplementary Fig. S4 Inferred karyotype evolution between AMAK and E. dulcis.
- Supplementary Fig. S5 Inferred karyotype evolution between AMAK and B. planiculmis.
- Supplementary Fig. S6 Inferred karyotype evolution between AMAK and C. esculentus.
- Supplementary Fig. S7 Inferred karyotype evolution between AMAK and C. cristalla.
- Supplementary Fig. S8 Inferred karyotype evolution between AMAK and C. scoparia.
- Supplementary Fig. S9 Inferred karyotype evolution between AMAK and C. littledalei.
- Supplementary Fig. S10 Inferred karyotype evolution between AMAK and R. breiuscula.
- Supplementary Fig. S11 Inferred karyotype evolution between AMAK and R. tenuis.
- Supplementary Fig. S12 Screening of starch metabolism-related genes based on transcriptome: Differentially expressed genes during corm development in 'Starch_Gxno.1' and 'Fruit_Gxno.3'.
- Supplementary Fig. S13 Screening of sucrose metabolism-related genes based on transcriptome: Differentially expressed genes during corm development in 'Starch_Gxno.1' and 'Fruit_Gxno.3'.
- Copyright: © 2026 by the author(s). Published by Maximum Academic Press, Fayetteville, GA. This article is an open access article distributed under Creative Commons Attribution License (CC BY 4.0), visit https://creativecommons.org/licenses/by/4.0/.
-
About this article
Cite this article
Gao M, Huang C, Lin C, Liu J, Hu S, et al. 2026. A high-quality Eleocharis dulcis genome provides insights into the regulation of starch and sucrose content in Cyperaceae. Fruit Research 6: e042 doi: 10.48130/frures-0026-0033 

A high-quality Eleocharis dulcis genome provides insights into the regulation of starch and sucrose content in Cyperaceae
- Received: 28 May 2026
- Revised: 03 July 2026
- Accepted: 09 July 2026
- Published online: 29 September 2026
Abstract: Eleocharis dulcis (water chestnut) is a horticultural crop cultivated for its corms. Based on starch content and sweetness, two types are recognized: fresh-consumption (e.g., 'Fruit_GXNo.3') and starchy (e.g., 'Starch_GXNo.1') types. However, the genetic basis for these differences remains unknown. This study sequenced, assembled, and anchored the genome of the fresh-consumption type E. dulcis cultivar 'Fruit_GXNo.3' (483.88 Mb) onto 111 pseudochromosomes, revealing 37,251 protein-coding genes and 1,440 non-coding RNAs. E. dulcis diverged from Bolboschoenus planiculmis and Cyperus esculentus approximately 39.5 million years ago (Mya) and possesses 521 unique gene families and 1,871 expanded gene families. This expansion is associated with a recent whole-genome duplication (WGD) event detected in the E. dulcis genome, which has not been observed in other Cyperaceae species analyzed to date. The fresh fruit flavor of 'Fruit_GXNo.3' corms is associated with lower total and amylopectin starch content, and higher amylose and sucrose content. Differential expression of starch metabolism-related genes (GBSS1.2, SBE3.1, BAM3.1, BAM4.1, PHS1a.1, PHS2.2) and sucrose metabolism-related genes (SWEET3a.1, SUS2a.1, SPS1c, SPP2.1) during the later stages of corm development primarily explains the starch and sucrose content differences between 'Fruit_GXNo.3' and 'Starch_GXNo.1'. These findings provide important insights into the regulation of starch and sucrose accumulation and may contribute to improving E. dulcis corm quality by providing candidate genes for marker-assisted breeding.
-
Key words:
- Eleocharis dulcis /
- Genome /
- Starch /
- Sucrose /
- Whole-genome duplication /
- Corm quality