


-
Pancreatic cancer has an extremely poor prognosis with a five-year survival rate of only 12%[1]. It is predicted to overtake breast cancer in Europe as the third leading cause of cancer death by 2025[2]. Surgery remains the only curative treatment option but unfortunately, almost half of the patients have metastatic disease at diagnosis. Metastatic pancreatic cancer (mPC) is generally considered incurable and is treated palliatively with chemotherapy (ChT)[3]. Although the survival advantage was modest, single-agent gemcitabine has demonstrated mainly clinical benefit over 5-fluorouracil (5-FU) and was considered the standard-of-care first-line approach for over a decade[4]. Subsequently, in pivotal phase III trials, FOLFIRINOX (the combination of 5-FU, oxaliplatin, and irinotecan) and nab-paclitaxel plus gemcitabine (Nab-G) showed markedly better clinical outcomes than gemcitabine monotherapy for first-line treatment[5,6]. Because of concerns about toxicity with the FOLFIRINOX (FFX) dosage schedule, a modified form of FFX (mFFX) with a reduced dose of irinotecan and omission of bolus 5-FU is commonly used in daily practice[7]. More recently, the NAPOLI-3 trial compared NALIRIFOX (the combination of 5-FU, leucovorin, liposomal irinotecan, and oxaliplatin) with Nab-G in the first-line setting and demonstrated a survival benefit, making it a candidate for a new treatment strategy[8]. While these regimens are recommended treatment alternatives in the first-line setting; randomized, head-to-head comparison studies are limited. Treatment is chosen based on the patient's performance status (PS), comorbidities, and toxicities[9].
The real-world practice is often different from the context in which the clinical trial was studied. Clinical trials often select fit patients but is not representative of the real world. In addition, preferences for first-line treatment differ among countries, depending on reimbursement and drug accessibility[10]. Therefore, retrospective data representing the real-world experience are crucial in evaluating the efficacy and safety of treatment strategies. In this study, we aimed to analyze the efficacy and safety of mFFX and Nab-G as first-line treatments in mPC patients treated in real-life settings.
-
This was a retrospective, cohort study conducted in Antalya Training and Research Hospital (Türkiye). The medical records of patients with histologically proven pancreatic cancer who were treated and followed up between September 2015 and September 2022 were reviewed. Patients with inadequate archive records, a pathological diagnosis other than adenocarcinoma, nonmetastatic disease, ineligible for treatment after diagnosis for certain reasons (poor PS, treatment refusal, etc.), or receiving ChT other than mFFX or Nab-G as first-line treatments were excluded. Finally, a total of 71 patients aged ≥18 years old who had received at least one cycle of mFFX or Nab-G as first-line treatment for mPC were included in the study.
Treatment and response assessment
-
mFFX consisted of a 2-h intravenous infusion of oxaliplatin 85 mg/m2, a 90-min intravenous infusion of irinotecan 150 mg/m2, a 2-h infusion of leucovorin 400 mg/m2, and a 46-h continuous infusion of 5-FU 2,400 mg/m2, administered every two weeks. Nab-G consisted of a 30-min intravenous infusion of nab-paclitaxel at a dose of 125 mg/m2 followed by gemcitabine at a dose of 1,000 mg/m2 on days 1, 8, and 15, every four weeks. Tumor response was assessed every 8−12 weeks using computed tomography or positron emission tomography. Response Evaluation Criteria in Solid Tumors (RECIST) version 1.1 was used for grading the best response as complete response (CR), partial response (PR), stable disease (SD), or progressive disease (PD). Patients with PD received second-line treatment or were followed with the best supportive care according to their first-line therapy, PS, toxicity profile, and physician preference. Toxicity was evaluated by Common Terminology Criteria for Adverse Events (CTCAE) version 4.0.
Study endpoints
-
Progression-free survival (PFS) was defined as the time from the initiation of first-line ChT until the progression date or death from any cause whichever occurred first. Overall survival (OS) was defined as the time from the mPC diagnosis until death or the last follow-up time.
Statistical analysis
-
SPSS version 25.0 (IBM Corp, Armonk, NY, USA) was used for statistical analyses. Descriptive statistics were presented as numbers (n) and percentages (%) for categorical variables and median (IQR or min-max) for continuous variables. The Mann-Whitney U test was used to compare data that were not normally distributed. The Chi-square test or Fisher's exact test, as appropriate, was performed to compare categorical variables. The Kaplan-Meier method was used to estimate OS and PFS, and the log-rank test was used to compare groups. Univariate analyses were performed separately for each prognostic variable using the Cox-regression test. As no statistically significant variables were identified in the univariate analysis, multivariate Cox regression analysis could not be performed. A p-value less than 0.05 was considered to be statistically significant.
-
Of the 71 patients included in the study, 54 were treated with mFFX, and 17 were treated with Nab-G as the first-line treatment. The median cycle number of mFFX was 8.5 and the median cycle number of Nab-G was 3 (p < 0.001). The male gender was approximately twice that of females, but there was no statistical difference between the two treatment groups (p = 0.241). The median tumor diameter was 4.5 cm in both groups and there was no difference between the groups according to median diameter (p = 0.839). Overall, baseline characteristics were comparable between the two groups (Table 1).
Table 1. Baseline demographic and clinicopathologic characteristics of the patients.
Variables Total
(n = 71)mFFX
(n = 54)Nab-G
(n = 17)p-value Age, median (min-max) 63.0 (37−82) 63.0 (37−82) 63.0 (42−77) 0.762 Gender, n (%) Female 25 (35.2) 17 (31.5) 8 (47.1) 0.241 Male 46 (64.8) 37 (68.5) 9 (52.9) ECOG PS, n (%) 0 14 (19.7) 13 (24.1) 1 (5.9) 0.197 1 40 (56.3) 30 (55.6) 10 (58.8) 2 17 (23.9) 11 (20.4) 6 (35.3) T stage, n (%) T2 19 (26.8) 17 (31.5) 2 (11.8) 0.207 T3 35 (49.3) 26 (48.1) 9 (52.9) T4 17 (23.9) 11 (20.4) 6 (35.3) Median tumor diameter, cm (IQR) 4.5 (2.7) 4.5 (2.9) 4.5 (1.8) 0.267 Tumor diameter, cm, n (%)* ≤ 4.50 38 (53.5) 29 (53.7) 9 (52.9) 0.839 > 4.50 31 (43.6) 23 (42.6) 8 (47.1) Primary tumor location, n (%) Head 35 (49.3) 24 (44.4) 11 (64.7) 0.443 Corpus 18 (25.4) 15 (27.8) 3 (17.6) Tail 18 (25.4) 15 (27.8) 3 (17.6) CA 19.9 (U/ml), median (IQR) 1,361 (4,882.6) 1,506.6 (4,956.8) 698.8 (6,364.1) 0.370 Liver metastasis, n (%) No 21 (29.6) 18 (33.3) 3 (17.6) 0.055 Yes 50 (70.4) 36 (66.7) 14 (82.4) Lung metastasis, n (%) No 57 (80.3) 42 (77.8) 15 (88.2) 0.493 Yes 14 (19.7) 12 (22.2) 2 (11.8) Bone metastasis, n (%) No 65 (91.5) 50 (92.6) 15 (88.2) 0.625 Yes 6 (8.5) 4 (7.4) 2 (11.8) Lymph node metastasis, n (%) No 23 (32.4) 16 (29.6) 7 (41.2) 0.375 Yes 48 (67.6) 38 (70.4) 10 (58.8) Other metastasis sites, n (%) No 60 (84.5) 43 (79.6) 17 (100) 0.055 Yes** 11 (15.5) 11 (20.4) 0 (0) mFFX, modified FOLFIRINOX; Nab G, Nab-paclitaxel + Gemcitabine; ECOG PS, Eastern Cooperative Oncology Group Performance Status. * The maximum tumor diameter of two patients on imaging was not specified, ** Periton or surrenal gland metastasis. Efficacy and prognostic factors
-
First-line treatment response and efficacy data are shown in Table 2. Regarding the best response, the disease control rate (DCR) in the mFFX group was significantly higher than in the Nab-G group (64.8% vs 29.4%, respectively) (p = 0.01). Five patients (9.3%) experienced CR with mFFX. There was no CR in the Nab-G group and 70.6% of patients developed PD.
Table 2. Efficacy of first-line treatments.
Best response, n (%) First-line treatment p-value mFFX Nab-G Objective response rate (CR + PR) 22 (40.7) 4 (23.5) 0.199 Disease control rate (CR + PR + SD) 35 (64.8) 5 (29.4) 0.010 SD 13 (24.1) 1 (5.9) 0.068 PR 17 (31.5) 4 (23.5) CR 5 (9.3) 0 (0) PD 19 (35.2) 12 (70.6) mFFX, modified FOLFIRINOX; Nab-G, nab-paclitaxel + Gemcitabine; SD, stable disease; PR, partial response; CR, complete response; PD, progressive disease; the number in bold indicates statistical significance. The median follow-up time was 10 months (range, 2−55). At the last follow-up date, eight patients in the mFFX group and three patients in the Nab-G group were still alive. The median PFS was 5.7 months (95% CI, 4.2–7.3) and the 12-months PFS was 13.7% in all patients. According to first-line ChT groups median PFS was significantly higher in the mFFX group than in the Nab-G group (6.3 months [95% CI, 5.5–7] vs 3.6 months [95% CI, 3–4.1]) (p = 0.021) (Fig. 1). The median OS was 11.2 months (95% CI, 9.3–13.1), and the 12-months OS was 40% in all patients. The median OS was statistically higher in the mFFX group (11.5 months [95% CI, 10–12.9]) than in the Nab-G group (7.6 months [95% CI, 4.4–10.8]) (p = 0.013) (Fig. 2).
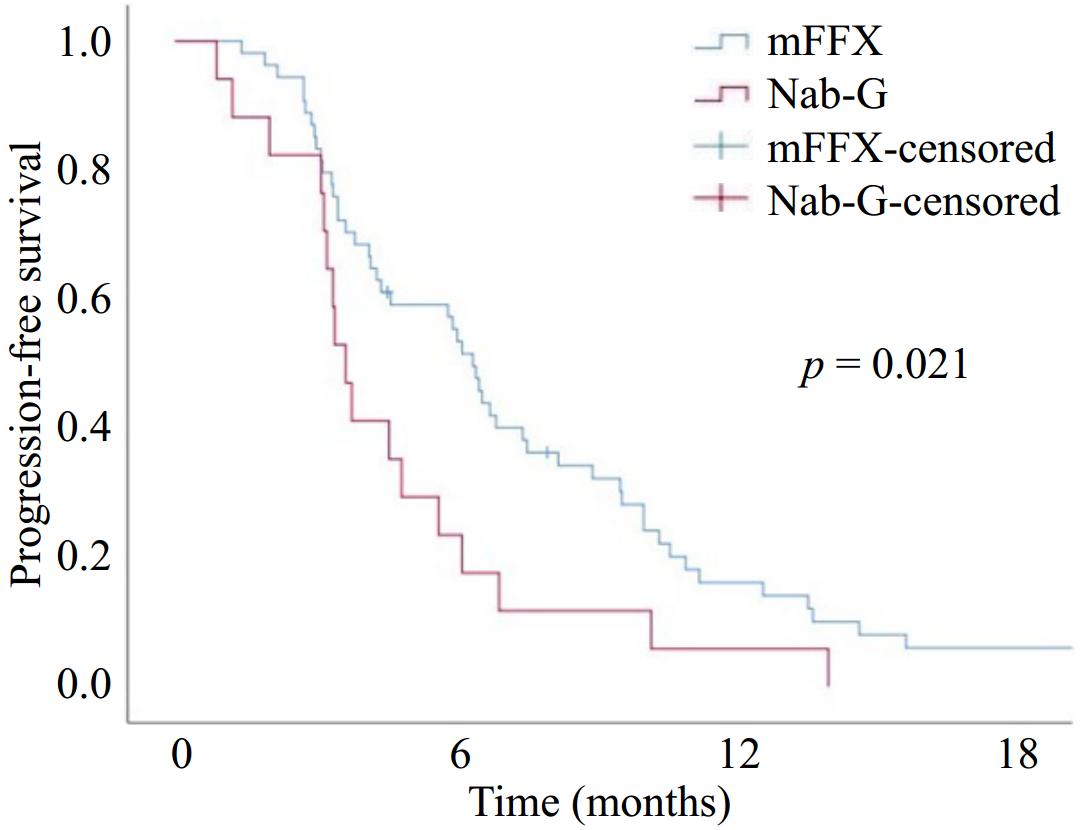
Figure 1.
Progression-free survival with modified FOLFIRINOX (mFFX) and Nab-paclitaxel + Gemcitabine (Nab-G).
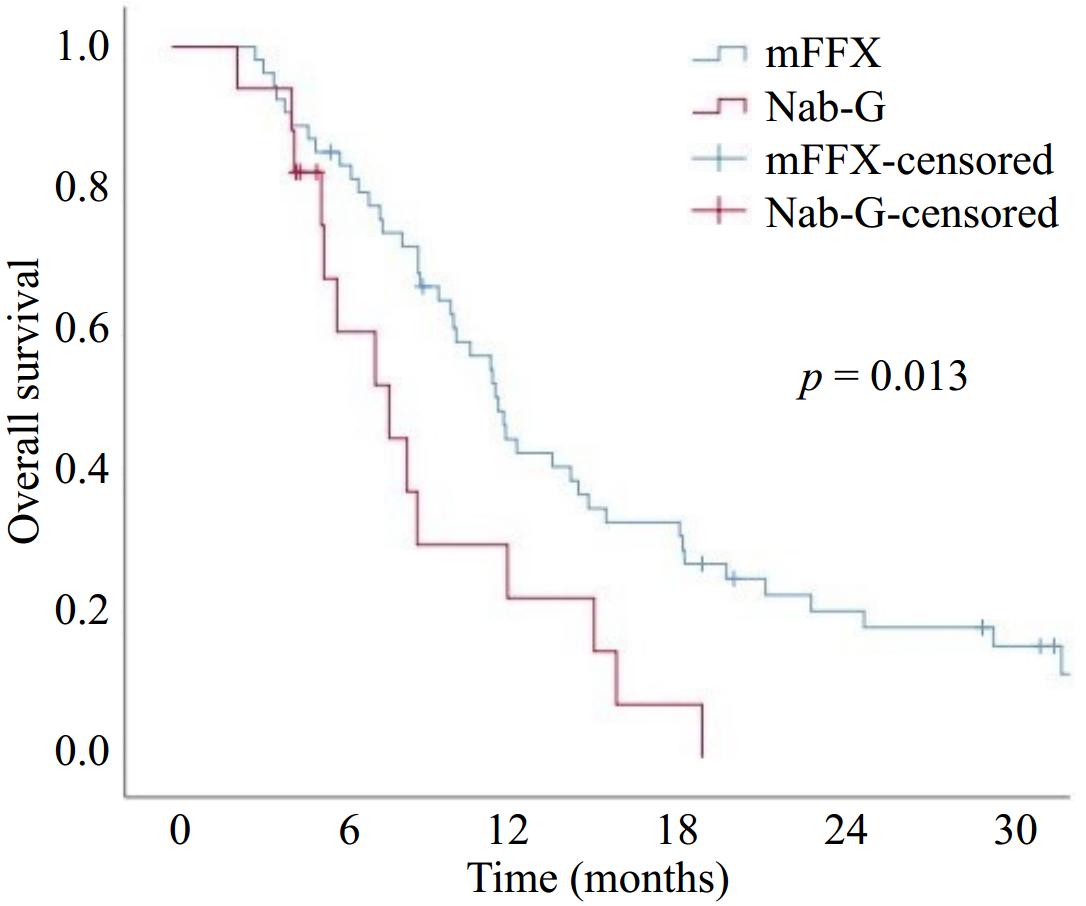
Figure 2.
Overall survival with modified FOLFIRINOX (mFFX) and Nab-paclitaxel + Gemcitabine (Nab-G).
Regarding Eastern Cooperative Oncology Group (ECOG) PS, Kaplan-Meier analysis estimated that the OS decreased from PS 0 to 2 (12.1, 11.2, and 8.6 months for PS 0, 1, and 2, respectively), but this decrease was not statistically significant (0 vs 1; p = 0.625), (0 vs 2; p = 0.053), and (1 vs 2; p = 0.070). Estimated PFS was decreased from PS 0 to 2 (5.9, 5.5, and 4.3 months for PS 0, 1, and 2, respectively), but this decrease was also not statistically significant (0 vs 1; p = 0.858), (0 vs 2; p = 0.142), and (1 vs 2; p = 0.126).
Univariate Cox regression analysis to evaluate the effect of clinicopathologic factors on survival showed that none of the factors had a statistically significant impact on PFS and OS (p > 0.05) (Table 3).
Table 3. Univariate Cox regression analysis for progression-free survival and overall survival.
Variables Univariate analysis (PFS) Univariate analysis (OS) HR (95% CI) p-value HR (95% CI) p-value Gender (ref: male) 1.20 (0.73−1.98) 0.472 1.41 (0.82−2.41) 0.210 Age 1.01 (0.98−1.03) 0.731 1.02 (0.99−1.04) 0.129 ECOG PS (ref: 0) 0.244 0.101 1 0.94 (0.50−1.76) 0.852 0.85 (0.44−1.61) 0.621 2 1.55 (0.75−3.18) 0.230 1.70 (0.81−3.56) 0.157 T stage (ref: T2) 0.934 0.622 T3 0.95 (0.54−1.72) 0.887 0.79 (0.42−1.47) 0.465 T4 1.07 (0.51−2.11) 0.845 1.06 (0.51−2.22) 0.879 Tumor diameter, cm (ref: ≤ 4.50) 0.77 (0.47−1.26) 0.308 1.02 (0.60−1.72) 0.930 Primary tumor location (ref: head) 0.352 0.339 Corpus 0.68 (0.37−1.23) 0.207 0.87 (0.46−1.65) 0.678 Tail 0.72 (0.40−1.30) 0.278 0.62 (0.33−1.17) 0.142 CA 19.9 level (ref: < 1361 U/ml) 0.85 (0.51−1.42) 0.547 0.77 (0.44−1.34) 0.364 Liver metastasis (ref: no) 0.94 (0.56−1.58) 0.836 0.80 (0.46−1.39) 0.433 Lung metastasis (ref: no) 1.20 (0.66−2.19) 0.540 1.51 (0.80−2.85) 0.198 Bone metastasis (ref: no) 1.05 (0.45−2.46) 0.904 1.47 (0.62−3.44) 0.376 Lymph node metastasis (ref: no) 1.26 (0.75−2.13) 0.370 1.13 (0.65−1.98) 0.657 PFS, progression−free survival; OS, overall survival; HR, hazard ratio; CI, confidence interval; ref, reference; ECOG PS, Eastern Cooperative Oncology Group Performance Status. As no statistically significant variables were identified in the univariate analysis, multivariate analysis was not performed. Second-line treatment
-
Three patients did not develop progression after first-line treatment. Among the patients who progressed, 47% in the mFFX group and 88.2% in the Nab-G group failed to receive second-line treatment. Second-line treatments are listed in Table 4. Patients with any grade of anemia in the first-line had a significantly higher rate of failure to receive second-line treatment (p = 0.038). There was no statistically significant difference in terms of failure to receive second-line treatment in patients experiencing any degree of neutropenia or thrombocytopenia during first-line treatment (p = 0.914 and p = 0.168, respectively). The OS was significantly longer in the patients who received second-line therapy compared to those who did not (median OS 14 vs 8.6 months, respectively) (p = 0.007) (Fig. 3).
Table 4. Second-line treatments.
First-line treatment Second-line treatment n (%) mFFX None 24 (47) Nab-G 18 (35.3) Gemcitabine 6 (11.8) Cisplatin + Gemcitabine 3 (5.9) Nab-G None 15 (88.2) mFFX 1 (5.9) mFOLFOX6 1 (5.9) mFFX, modified FOLFIRINOX; Nab-G, nab-paclitaxel + Gemcitabine. 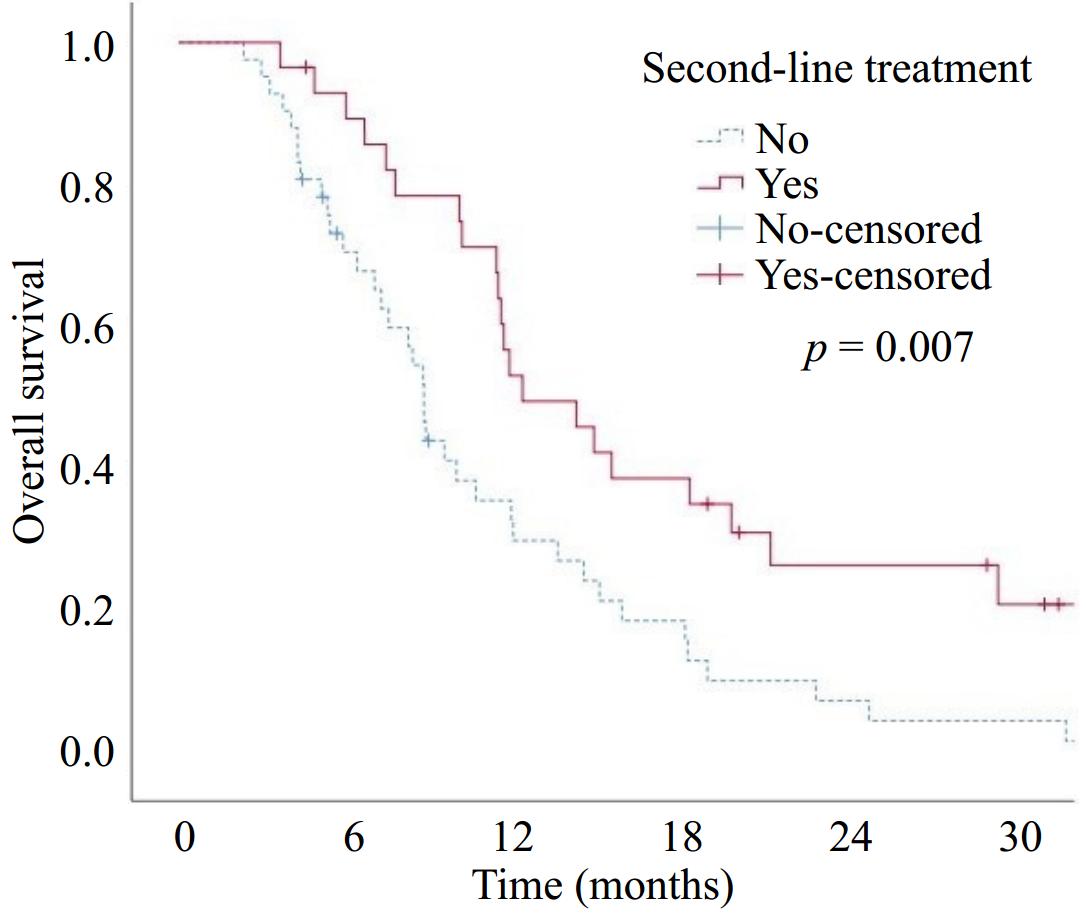
Figure 3.
Overall survival according to second-line treatment.
Safety profile
-
Toxicities are presented in Table 5. Grade 3−4 hematologic toxicities were statistically similar in both groups. There was not any case of febrile neutropenia in patients treated with Nab-G. The fatigue rate was higher in the Nab-G group than mFFX group (82% vs 52%, respectively). Although the safety profile was comparable between treatment groups, dose reduction was significantly higher in the mFFX group (57% vs 18%, p = 0.004).
Table 5. Safety profile of first-line treatment options.
Adverse event, n (%) mFFX (n = 54) Nab-G (n = 17) p-value Grade 1−2 Grade 3−4 Grade 1−2 Grade 3−4 Hematologic Neutropenia 9 (17) 18 (33) 2 (12) 5 (29) 0.596 Anemia 14 (26) 6 (11) 7 (41) 3 (18) 0.669 Thrombocytopenia 16 (29) 7 (13) 3 (18) 5 (29) 0.206 Non-hematologic Fatigue 27 (50) 1 (2) 12 (70) 2 (12) 0.254 Nausea 15 (28) 7 (13) 8 (47) 1 (6) 0.379 Vomiting 17 (31) 3 (5) 6 (35) 1 (6) 1.000 Diarrhea 5 (9) 0 0 0 N/A Stomatitis/mucositis 8 (15) 1 (2) 3 (18) 1 (6) 1.000 mFFX Nab-G p-value Febrile neutropenia 2 (4) 0 0.631 Dose reduction 31 (57) 3 (18) 0.004 Dose delay 32 (59) 12 (70) 0.401 Hospitalization 14 (26) 6 (35) 0.540 mFFX, modified FOLFIRINOX; Nab-G, nab-paclitaxel + Gemcitabine; N/A, not applicable. Fisher's Exact test; numbers in bold indicate statistical significance. -
Our study demonstrated that mFFX is a better first-line option than Nab-G in terms of disease control and survival in patients with mPC. Furthermore, an improvement in survival rates was also noted among patients who could receive second-line treatment.
The Dutch pancreatic cancer group presented their large patient database, demonstrating a median OS of approximately six months, which was much worse than our results[11,12]. However, all patients in their studies received treatment before 2018, and approximately one-fifth of the patients received single-agent gemcitabine. Patients who received FFX or Nab-G had more unfavorable baseline demographic and clinicopathologic characteristics compared to our study. Furthermore, 80% of patients who received FFX and 83% of patients who received Nab-G failed to receive second-line treatment[12]. Although our cohort had a higher proportion of patients with ECOG PS 2, survival was not as poor as expected. Most PS 2 patients treated with mFFX were able to receive six or more cycles of treatment. Possibly due to the rapid tumor response and shrinkage, these patients were able to continue treatment without complications. Another possible cause is that the physician evaluating the patient before first-line treatment may have underestimated the PS due to the mPC tumor burden and/or recorded it as PS 2 due to higher subjective complaints. As mentioned above, the rapid tumor response may have helped the patients stay on treatment and resulted in better survival than expected.
Results of retrospective studies comparing the two treatment regimens were conflicting. Some studies have shown that FFX has better survival results[13,14], while others have reported comparable PFS and OS[15−17]. In a study by Williet et al. using the propensity score matching (PSM) method to minimize the bias; after adjusting the groups for characteristics such as age, PS, metastasis sites, and liver metastasis, the FFX was associated with improved OS[18]. Another retrospective study using the PSM method also found longer PFS and OS with FFX[19]. These results were also obtained with mFFX in our study. For patients with mPC, maintaining effective treatment for as long as possible is critical to prolonging survival. Approximately half of patients with mPC could receive second-line treatment[20]. For patients treated with a 5-FU-based regimen in the first-line setting, Nab-G may be an effective second-line option. Conversely, patients receiving gemcitabine-based regimens in the first-line setting have more toxic and difficult-to-adhere-to second-line 5-FU-based treatment options[12,21]. In our study, Nab-G could be used in the second-line setting in 35% of patients who received mFFX in the first line, but the access rate to effective second-line treatment after first-line Nab-G remained extremely low. This may explain the survival results favoring first line mFFX. Moreover, the survival results of mFFX in our study (median PFS 6.3 months and median OS 11.5 months) were in line with the results of the phase III PRODIGE4/ACCORD11 trial (median PFS 6.4 months and median OS 11.1 months).
The mFFX group showed a higher DCR than the Nab-G group in our study, consistent with the findings of a retrospective study conducted on Turkish patients[22]. The superior DCR observed with mFFX was primarily because there were five CR patients and a higher proportion of patients with SD in the mFFX group, as well as a higher proportion of patients with PD in the Nab-G group. Among factors that may be prognostic and lead to poor treatment compliance, the proportion of PS 2 patients and patients with liver metastases was higher in the Nab-G group, although not statistically significant. Dose modification was higher in the mFFX group, which may have allowed more patients to adhere to the treatment schedule and receive effective treatment for a longer period of time than in the Nab-G group. Although it was not statistically significant, the Nab-G group had a higher rate of hospitalizations and ChT dose delays. This may have meant that patients on Nab-G were treated for a shorter period of time and had difficulty adhering to their treatment plans, which could have led to progression. A similar trend was observed, although it did not reach statistical significance, with grade 3 or 4 fatigue being proportionally more common in the Nab-G group. By potentially affecting adherence, this could also be a potential factor leading to reduced efficacy of Nab-G.
The treatment duration is an important determinant of its efficacy. In our study, patients received a median of 8.5 cycles of mFFX and 3 cycles of Nab-G. We observed that early progression or toxicity led to early treatment discontinuation, especially in the Nab-G group. However, comparable median treatment cycles have been published in the literature[19,23−25].
With improved survival of mPC in recent decades, treatment sequencing has become an important concern. There is no established standard of care for second-line ChT, as no randomized trials are evaluating subsequent treatment after failure of first-line mFFX or Nab-G. Similar to the retrospective data[10,26], we observed that patients who received mFFX in the first-line setting were treated with gemcitabine-based regimens in the second-line. In our study, 88% of the Nab-G group failed to receive second-line treatment either because they died during or immediately after progression on first-line treatment, because of poor performance after first-line treatment, or due to their refusal to receive therapy. Consistent with data showing that effective subsequent treatment after progression on first-line therapy can provide relatively prolonged survival[27], the OS was significantly longer in patients receiving second-line therapy in our study.
According to results of pivotal studies, triplet ChT showed higher toxicity rates, with increased high-grade neutropenia (45.7% vs 38%), fatigue (23.6% vs 17%), and diarrhea (12.7% vs 6%) when compared to gemcitabine monotherapy[5,6]. Meta-analyses and retrospective studies generally concluded an increase in hematologic toxicity with mFFX and neuropathy with Nab-G[28,29]. While others reported a similar safety profile[22,30,31]. In our study, we found no statistical difference between mFFX and Nab-G treatment regimens, especially in terms of grade 3−4 toxicities; but due to lack of data on neuropathy questioning and recording, neuropathy could not be reported. Although febrile neutropenia is expected to be high with mFFX[29,30], our results did not show a marked difference in the incidence of febrile neutropenia. This could be related to the effective use of prophylactic G-CSF in the mFFX group.
Current guidelines recommend both FFX or mFFX and Nab-G regimens in first-line treatment, considering patient characteristics[9,32]. The prospective GENERATE trial was the first to aim to compare mFFX, Nab-G, and S-IROX (a regimen most commonly used in Asia that replaces continuous intravenous 5-FU with oral administered fluoropyrimidine of S-1) in a head-to-head analysis. This trial suggested that Nab-G should be considered as a superior first-line treatment in terms of OS[33]. It is crucial to highlight that, in contrast to other pivotal studies, this was a single-nation, Asian study. Additionally, the response rates in the mFFX arm were in line with previous data, but the high ORR observed with Nab-G is difficult to interpret.
Our study had some limitations. It was a single-center, retrospective, nonrandomized study with a relatively small sample size. A notable limitation is the relatively small number of patients in the Nab-G arm, which can be attributed to the challenges in accessing nab-paclitaxel across our country. In addition, safety profiles in our analysis may have missing data due to a lack of recording of adverse events as a result of the retrospective nature of the analysis.
-
The findings of our study indicated that the first-line administration of mFFX in the treatment of mPC was associated with superior DCR and prolonged survival in eligible patients compared to the Nab-G regimen, with a comparable side effect profile. Furthermore, we observed that survival was significantly improved in patients who were able to receive second-line treatment. However, prospective, multinational randomized studies are required to confirm these findings.
-
All procedures were reviewed and preapproved by the Ethics Committee of Antalya Training and Research Hospital (Identification No. 1/7, approval date: 12/01/2023). Because of the retrospective nature of the study written informed consent was waived by the committee.
-
The authors confirm contribution to the paper as follows: study conception and design: Kivrak Salim D, Arici MO; data collection: Arici MO; analysis and interpretation of results: Kivrak Salim D; draft manuscript preparation: Kivrak Salim D, Arici MO. Both authors reviewed the results and approved the final version of the manuscript.
-
The datasets generated during and/or analyzed during the current study are not publicly available due to their containing information that could compromise the privacy of research participants and ethical restrictions.
-
The authors declare that they have no conflict of interest.
- Copyright: © 2025 by the author(s). Published by Maximum Academic Press, Fayetteville, GA. This article is an open access article distributed under Creative Commons Attribution License (CC BY 4.0), visit https://creativecommons.org/licenses/by/4.0/.
-
About this article
Cite this article
Arici MO, Kivrak Salim D. 2025. Comparison of two standard first-line treatments in metastatic pancreatic cancer. Gastrointestinal Tumors 12: e007 doi: 10.48130/git-0025-0008 

Comparison of two standard first-line treatments in metastatic pancreatic cancer
- Received: 22 October 2024
- Revised: 19 March 2025
- Accepted: 08 April 2025
- Published online: 29 April 2025
Abstract: FOLFIRINOX or modified FOLFIRINOX (mFFX) and nab-paclitaxel plus gemcitabine (Nab-G) are both standard first-line treatment options in metastatic pancreatic cancer (mPC). This study aimed to analyze the efficacy and safety of mFFX and Nab-G as first-line treatments in real-life situations. mPC patients treated with either mFFX or Nab-G as first-line were retrospectively analyzed. The Kaplan-Meier method was used to estimate progression-free survival (PFS) and overall survival (OS), and the log-rank test was used to compare groups. There were 54 and 17 patients in the mFFX and Nab-G groups respectively. Baseline characteristics were comparable. The disease control rate (DCR) was 64.8% in the mFFX group and 29.4% in the Nab-G group (p = 0.01). The median PFS (mFFX: 6.3 months vs Nab-G: 3.6 months; p = 0.021) and the median OS (mFFX: 11.5 months vs Nab-G: 7.6 months; p = 0.013) were statistically higher in the mFFX group. The median OS was prolonged in patients who received second-line treatment (14 vs 8.6 months; p = 0.007). There was no significant difference between the two groups in terms of grade 3−4 toxicity. Our study demonstrated better DCR and increased survival outcomes with mFFX vs Nab-G with comparable toxicity profiles.
-
Key words:
- Pancreatic cancer /
- FOLFIRINOX /
- Nab-paclitaxel /
- Gemcitabine