













-
Colorectal cancer (CRC) is one of the most prevalent malignancies of the digestive tract. According to 2024 data from the WHO International Agency for Research on Cancer[1], CRC accounted for approximately 10.2% of all new cancer cases globally in 2022, ranking third in incidence. It accounted for approximately 9.3% of total cancer-related deaths, ranking second worldwide.
During cancer treatment, family members serve as the primary caregivers for patients. First-degree relatives (FDRs) of CRC patients include parents, children, and siblings. Due to shared living environments and lifestyle habits[2,3], FDRs often develop concerns about their own health status. Confronted with the sudden malignancy in a family member, relatives must endure substantial financial and psychological stress. This includes bearing the risks associated with treatment procedures and worrying about therapeutic outcomes. Also, relatives must maintain a calm and optimistic demeanor in front of the patient. They assume the role of caregiver while experiencing intense internal emotional conflict. As first-degree relatives, they are particularly susceptible to anxiety and depression. International studies indicate that approximately 42%−80% of family members experience anxiety during a patient's hospitalization or intensive care unit stay[4]. The prevalence of anxiety among family caregivers of stroke patients is reported to be 21.4%[5]. Among cancer patient caregivers, 51% experience anxiety, and 30% experience depression[6]. Song et al.[7] found that relatives bearing primary caregiving responsibilities for cancer patients exhibit significantly higher levels of anxiety and depression compared to the general population. Applebaum et al.[8] found that caregiver anxiety and depression levels are equivalent to, or even exceed, those of the patients themselves. The anxiety experienced by caregivers is considerable. FDRs not only face negative physical and psychological consequences while caring for patients. They also encounter long-term challenges such as chronic insomnia and temporary social disconnection. Factors including busy caregiving schedules, lack of communication, and family financial burdens can exacerbate stress and contribute to anxiety. Anxiety and depression among primary caregivers of cancer patients have garnered widespread attention from researchers globally. However, reported prevalence rates vary considerably. This variation stems from differences in cancer type, cultural and geographical contexts, sample size, and the specific assessment scales and criteria employed. To date, there are very few studies on the FDRs of CRC patients. The anxiety status of this population remains poorly understood. This study aimed to investigate the current state of anxiety among FDRs of CRC patients. It also sought to analyze influencing factors and construct a predictive model. The findings are intended to provide a scientific basis for routine intervention, particularly psychological support, for this specific population.
-
A convenience sampling method was employed. A total of 380 FDRs of CRC patients were recruited consecutively from the medical oncology department of a Grade A tertiary hospital in Nanjing between June 2023 and June 2025. The inclusion criteria were: (1) FDRs of an individual with a pathologically confirmed diagnosis of CRC; (2) age ≥ 18 years; and (3) adequate communication skills and literacy (listening, speaking, reading, and writing). The exclusion criteria were: personal history of malignancy or psychiatric illness. This study was approved by the hospital's Medical Ethics Committee (Approval No. KY20180604-05-KS-01). All participants provided written informed consent.
Methods
Survey instruments
-
(1) General Information Questionnaire: Developed by the research team based on literature review and clinical experience. It collected data on the relative's gender, age, educational level, occupation, relationship to the patient, monthly household income per capita, and method of medical expense payment.
(2) Hamilton Anxiety Scale (HAMA): This internationally standardized scale was developed by Hamilton in 1959. It comprises 14 items rated on a five-point Likert scale. Scores range from 0 (asymptomatic) to 4 (very severe). Total scores are interpreted as follows: < 7 indicates no anxiety; 7–13 suggests possible anxiety; 14–20 indicates definite anxiety; 21–28 indicates significant anxiety; and ≥ 29 indicates severe anxiety[9]. The Cronbach's α coefficient for this scale in the present study was 0.875.
(3) CRC Risk Perception Assessment Tool: This tool assesses individual perceived risk of developing CRC with a single question: 'What do you think is your risk of developing colorectal cancer?' The scale was developed and applied by Lee et al.[10] in a study published in The Breast in 2020. It explores individual cancer risk perception, relationships between risk perception and health behaviors, and comparisons between perceived and objective risk. A five-point Likert scale is used. Perceived risk is categorized as very low, low, moderate, high, and very high. Scores ≤ 2 indicate low risk; a score of 3 indicates moderate risk; and scores ≥ 4 indicate high risk. This tool is convenient, intuitive, and easy to understand.
(4) CRC Health Belief Scale: The original scale was developed by Jacobs[11] in 2002 to assess FDRs of CRC patients. It was translated into Chinese and validated by Wu[12] in 2020 for use with relatives of CRC patients. The scale's content validity index is 0.980; test-retest reliability is 0.848; and Cronbach's α coefficient is 0.881. The scale comprises 36 items across six dimensions: perceived susceptibility, perceived severity, perceived benefits, perceived barriers, health motivation, and self-efficacy. A five-point Likert scale is used. Total scores range from 36 to 180. Higher scores indicate stronger health beliefs regarding CRC.
(5) Pittsburgh Sleep Quality Index (PSQI): The PSQI is a self-rated sleep quality assessment tool developed by Buysse et al.[13] in 1989. The scale's Cronbach's α coefficient is 0.84. It uses a four-point Likert scale. A total score > 7 indicates the presence of a sleep disorder. The Cronbach's α coefficient for this scale in the present study was 0.817.
(6) Charlson Comorbidity Index (CCI): The CCI was proposed by Charlson in 1987. It comprises three components: disease evaluation, severity assessment, and a scoring system. Disease evaluation covers 19 conditions, including myocardial infarction, congestive heart failure, and peripheral vascular disease. Severity is weighted with scores of 1, 2, 3, or 6. The CCI includes age adjustment. One point is added for each decade of age starting from 50–59 years[14]. The CCI is used to assess the impact of comorbid conditions on the ten-year survival of patients with a primary disease. Higher scores indicate poorer prognosis and lower survival rates. This study used the patient Charlson Comorbidity Index (CCI) to collect comorbidity data for CRC patients.
Data collection
-
All recruitment activities were performed by uniformly trained nurses. The research team first contacted the proband (the patient). After obtaining informed consent from the patient, permission was sought to contact eligible FDRs (parents, children, or siblings). Upon receiving explicit authorization on the day of the patient's visit, the research team obtained contact information for relatives. The team introduced themselves and explained the source of the information. For those who agreed to participate, informed consent was obtained in a private consultation room to ensure confidentiality. All data were anonymized. Each FDR was assigned a unique study identifier, which was kept separate from the main database. No personally identifiable information was included during data entry, analysis, or manuscript preparation. According to scale development principles, the sample size should be five to ten times the number of scale items[15]. This study involved 40 items. Therefore, the required sample size was 200–400 cases. Accounting for a 10% rate of invalid assessments, 410 questionnaires were distributed. A total of 380 valid questionnaires were returned, yielding an effective response rate of 92.7%. Disease-related data were collected from electronic medical records and verified by two independent researchers.
Statistical analysis
-
Data were analyzed using SPSS version 26.0. Normally distributed enumeration data are presented as mean ± standard deviation; group comparisons used independent samples t-tests. Non-normally distributed data are expressed as median (P25, P75) and compared using the Mann-Whitney U test. Categorical data are expressed as percentages (%) and compared using the Chi-square test or Fisher's exact test. Variables showing statistical significance in univariate analysis and those deemed clinically relevant were entered into a multivariate stepwise logistic regression model (Backward LR method) to establish the predictive model.
-
No statistically significant differences were observed in baseline characteristics between the model development and validation groups (p > 0.05). See Table 1.
Table 1. Comparison of baseline characteristics between model development and validation cohorts.
Variables Total (n = 380) Validation (n = 114) Model development (n = 266) Statistic p-Value Anxiety, n (%) χ2 = 0.197 0.657 No 78 (20.526) 25 (21.930) 53 (19.925) Yes 302 (79.474) 89 (78.070) 213 (80.075) Educational level, n (%) χ2 = 0.334 0.953 Junior high or below 106 (27.895) 31 (27.193) 75 (28.195) High school/junior college 120 (31.579) 36 (31.579) 84 (31.579) Undergraduate 122 (32.105) 36 (31.579) 86 (32.331) Postgraduate or above 32 (8.421) 11 (9.649) 21 (7.895) Payment method, n (%) − 1 Self-pay 6 (1.579) 2 (1.754) 4 (1.504) Rural social endowment insurance 38 (10.000) 11 (9.649) 27 (10.150) Public health insurance 8 (2.105) 2 (1.754) 6 (2.256) Medical insurance 326 (85.789) 99 (86.842) 227 (85.338) Commercial insurance 2 (0.526) 0 (0.00) 2 (0.752) Family history, n (%) χ2 = 0.504 0.478 No 113 (29.737) 31 (27.193) 82 (30.827) Yes 267 (70.263) 83 (72.807) 184 (69.173) Occupation, n (%) χ2 = 4.595 0.204 Unemployed/farmer 34 (8.947) 9 (7.895) 25 (9.398) Enterprise/institution 105 (27.632) 26 (22.807) 79 (29.699) Self-employed 175 (46.053) 62 (54.386) 113 (42.481) Retired 66 (17.368) 17 (14.912) 49 (18.421) Gender, n (%) χ2 = 0.018 0.893 Male 192 (50.526) 57 (50.000) 135 (50.752) Female 188 (49.474) 57 (50.000) 131 (49.248) Relative type, n (%) χ2 = 3.884 0.143 Parent 46 (12.105) 14 (12.281) 32 (12.030) Sibling 183 (48.158) 63 (55.263) 120 (45.113) Child 151 (39.737) 37 (32.456) 114 (42.857) Health belief group, n (%) χ2 = 0.555 0.758 Low (36–84 points) 38 (10.000) 13 (11.404) 25 (9.398) Medium (85–132 points) 290 (76.316) 87 (76.316) 203 (76.316) High (133–180 points) 52 (13.684) 14 (12.281) 38 (14.286) Age group, n (%) χ2 = 2.529 0.282 18–45 207 (54.474) 56 (49.123) 151 (56.767) 45–60 131 (34.474) 46 (40.351) 85 (31.955) 60–80 42 (11.053) 12 (10.526) 30 (11.278) Sleep quality group, n (%) χ2=2.978 0.395 Very good (0–5 points) 9 (2.368) 5 (4.386) 4 (1.504) Fairly good (6–10 points) 44 (11.579) 12 (10.526) 32 (12.030) Average (11–15 points) 208 (54.737) 62 (54.386) 146 (54.887) Very poor (16–21 points) 119 (31.316) 35 (30.702) 84 (31.579) Income per capita, n (%) − 0.643 ≤ 3,000 37 (9.737) 11 (9.649) 26 (9.774) 3,000–6,000 283 (74.474) 89 (78.070) 194 (72.932) 6,000–9,000 53 (13.947) 12 (10.526) 41 (15.414) > 9,000 7 (1.842) 2 (1.754) 5 (1.880) CCI group, n (%) χ2 = 0.049 0.976 Mild (1–2 points) 114 (30.000) 34 (29.825) 80 (30.075) Moderate (3–4 points) 52 (13.684) 15 (13.158) 37 (13.910) Severe (≥ 5 points) 214 (56.316) 65 (57.018) 149 (56.015) Risk perception group, n (%) χ2 = 0.340 0.844 Low (1–2 points) 175 (46.053) 54 (47.368) 121 (45.489) Moderate (3 points) 104 (27.368) 32 (28.070) 72 (27.068) High (4–5 points) 101 (26.579) 28 (24.561) 73 (27.444) Household size, n (%) χ2 = 7.560 0.182 One person 52 (13.684) 13 (11.404) 39 (14.662) Two persons 48 (12.632) 20 (17.544) 28 (10.526) Three persons 183 (48.158) 59 (51.754) 124 (46.617) Four persons 56 (14.737) 13 (11.404) 43 (16.165) Five persons 31 (8.158) 8 (7.018) 23 (8.647) ≥ Six persons 10 (2.632) 1 (0.877) 9 (3.383) χ2: Chi-square test, −: Fisher exact. Comparison of clinical characteristics between anxious and non-anxious groups
-
In the model development group of 266 FDRs, 213 (80.08%) experienced anxiety. Statistically significant differences between the anxious and non-anxious groups were observed for educational level, relative type, age, health belief, Charlson Comorbidity Index (CCI), and risk perception (p < 0.05). See Table 2.
Table 2. Comparative analysis of characteristics in the training group.
Variables Total (n = 266) Non-anxious (n = 53) Anxious (n = 213) Statistic p-Value Educational level, n (%) χ2 = 40.601 < 0.001 Junior high or below 75 (28.195) 33 (62.264) 42 (19.718) High school/junior college 84 (31.579) 7 (13.208) 77 (36.150) Undergraduate 86 (32.331) 8 (15.094) 78 (36.620) Postgraduate or above 21 (7.895) 5 (9.434) 16 (7.512) Payment method, n (%) − 0.804 Self-pay 4 (1.504) 0 (0.00) 4 (1.878) Rural social endowment insurance 27 (10.150) 5 (9.434) 22 (10.329) Public health insurance 6 (2.256) 0 (0.00) 6 (2.817) Medical insurance 227 (85.338) 48 (90.566) 179 (84.038) Commercial insurance 2 (0.752) 0 (0.00) 2 (0.939) Family history, n (%) χ2 = 1.231 0.267 No 82 (30.827) 13 (24.528) 69 (32.394) Yes 184 (69.173) 40 (75.472) 144 (67.606) Occupation, n (%) χ2 = 1.518 0.678 Unemployed/farmer 25 (9.398) 4 (7.547) 21 (9.859) Enterprise/institution 79 (29.699) 13 (24.528) 66 (30.986) Self-employed 113 (42.481) 26 (49.057) 87 (40.845) Retired 49 (18.421) 10 (18.868) 39 (18.310) Gender, n (%) χ2 = 0.076 0.783 Male 135 (50.752) 26 (49.057) 109 (51.174) Female 131 (49.248) 27 (50.943) 104 (48.826) Relative type, n (%) χ2 = 6.895 0.032 Parent 32 (12.030) 11 (20.755) 21 (9.859) Sibling 120 (45.113) 26 (49.057) 94 (44.131) Child 114 (42.857) 16 (30.189) 98 (46.009) Health belief group, n (%) χ2 = 12.594 0.002 Low (36–84 points) 25 (9.398) 11 (20.755) 14 (6.573) Medium (85–132 points) 203 (76.316) 39 (73.585) 164 (76.995) High (133–180 points) 38 (14.286) 3 (5.660) 35 (16.432) Age group, n (%) χ2 = 20.123 < 0.001 18–45 151 (56.767) 17 (32.075) 134 (62.911) 45–60 85 (31.955) 23 (43.396) 62 (29.108) 60–80 30 (11.278) 13 (24.528) 17 (7.981) Sleep quality group, n (%) − 0.274 Very good (0–5 points) 4 (1.504) 0 (0.00) 4 (1.878) Fairly good (6–10 points) 32 (12.030) 8 (15.094) 24 (11.268) Average (11–15 points) 146 (54.887) 24 (45.283) 122 (57.277) Very poor (16–21 points) 84 (31.579) 21 (39.623) 63 (29.577) Income Per Capita, n (%) − 0.48 ≤ 3,000 26 (9.774) 8 (15.094) 18 (8.451) 3,000–6,000 194 (72.932) 37 (69.811) 157 (73.709) 6,000–9,000 41 (15.414) 7 (13.208) 34 (15.962) > 9,000 5 (1.880) 1 (1.887) 4 (1.878) CCI Group, n (%) χ2 = 59.712 < 0.001 Mild (1–2 points) 80 (30.075) 39 (73.585) 41 (19.249) Moderate (3–4 points) 37 (13.910) 2 (3.774) 35 (16.432) Severe (≥ 5 points) 149 (56.015) 12 (22.642) 137 (64.319) Risk perception group, n (%) χ2 = 37.635 < 0.001 Low (1–2 points) 121 (45.489) 44 (83.019) 77 (36.150) Moderate (3 points) 72 (27.068) 4 (7.547) 68 (31.925) High (4–5 points) 73 (27.444) 5 (9.434) 68 (31.925) Household size, n (%) χ2 = 2.948 0.708 One person 39 (14.662) 6 (11.321) 33 (15.493) Two persons 28 (10.526) 4 (7.547) 24 (11.268) Three persons 124 (46.617) 24 (45.283) 100 (46.948) Four persons 43 (16.165) 10 (18.868) 33 (15.493) Five persons 23 (8.647) 6 (11.321) 17 (7.981) Six persons or more 9 (3.383) 3 (5.660) 6 (2.817) χ2: Chi-square test, −: Fisher exact. p-Values in boldface indicate the statistical significance Univariate logistic regression analysis of factors influencing anxiety in FDRs
-
Univariate logistic regression analysis indicated that educational level, relative type, age, health belief, CCI score, and risk perception were statistically significant factors associated with anxiety (p < 0.05). See Table 3.
Table 3. Univariate logistic regression analysis of factors influencing anxiety.
Variables β S.E Z p-Value OR (95% CI) Educational level, n (%) Junior high or below 1.000 (Ref.) High school/junior college 2.157 0.458 4.707 < 0.001 8.643 (3.521–21.217) Undergraduate 2.036 0.438 4.648 < 0.001 7.661 (3.246–18.079) Postgraduate or above 0.922 0.563 1.639 0.101 2.514 (0.835–7.575) Payment method, n (%) Self-pay 1.000 (Ref.) Rural social endowment insurance −16.084 1978.090 −0.008 0.994 0.000 (0.000–Inf) Public health insurance 0.000 2553.703 0.000 1.000 1.000 (0.000–Inf) Medical insurance −16.250 1978.090 −0.008 0.993 0.000 (0.000–Inf) Commercial insurance 0.000 3426.153 0.000 1.000 1.000 (0.000–Inf) Family history, n (%) No 1.000 (Ref.) Yes −0.388 0.351 −1.105 0.269 0.678 (0.341–1.350) Occupation, n (%) Unemployed/farmer 1.000 (Ref.) Enterprise/institution −0.034 0.624 −0.054 0.957 0.967 (0.284–3.287) Self-employed −0.450 0.590 −0.764 0.445 0.637 (0.201–2.024) Retired −0.297 0.651 −0.457 0.648 0.743 (0.208–2.659) Gender, n (%) Male 1.000 (Ref.) Female −0.085 0.307 −0.276 0.783 0.919 (0.503–1.677) Relative type, n (%) Parent 1.000 (Ref.) Sibling 0.639 0.433 1.474 0.140 1.894 (0.810–4.426) Child 1.166 0.460 2.536 0.011 3.208 (1.303–7.898) Health belief group, n (%) Low (36–84 points) 1.000 (Ref.) Medium (85–132 points) 1.195 0.441 2.713 0.007 3.304 (1.393–7.835) High (133–180 points) 2.216 0.724 3.060 0.002 9.167 (2.218–37.890) Age group, n (%) 18–45 1.000 (Ref.) 45–60 −1.073 0.355 −3.024 0.002 0.342 (0.171–0.686) 60–80 −1.796 0.449 −3.997 < 0.001 0.166 (0.069–0.400) Sleep quality group, n (%) Very good (0–5 points) 1.000 (Ref.) Fairly good (6–10 points) −14.467 727.699 −0.020 0.984 0.000 (0.000–Inf) Average (11–15 points) −13.940 727.699 −0.019 0.985 0.000 (0.000–Inf) Very poor (16–21 points) −14.467 727.699 −0.020 0.984 0.000 (0.000–Inf) Income per capita, n (%) ≤ 3,000 1.000 (Ref.) 3,000–6,000 0.634 0.463 1.372 0.170 1.886 (0.762–4.669) 6,000–9,000 0.770 0.594 1.296 0.195 2.159 (0.674–6.915) > 9,000 0.575 1.196 0.481 0.630 1.778 (0.171–18.534) CCI group, n (%) Mild (1–2 points) 1.000 (Ref.) Moderate (3–4 points) 2.812 0.761 3.697 < 0.001 16.646 (3.749–73.923) Severe (≥ 5 points) 2.385 0.375 6.359 < 0.001 10.860 (5.207–22.650) Risk perception group, n (%) Low (1–2 points) 1.000 (Ref.) Moderate (3 points) 2.274 0.548 4.148 < 0.001 9.714 (3.318–28.441) High (4–5 points) 2.050 0.500 4.097 < 0.001 7.771 (2.914–20.723) Household size −0.203 0.126 −1.620 0.105 0.816 (0.638–1.044) OR: Odds Ratio, CI: Confidence Interval. p-Values in boldface indicate the statistical significance. Multivariate logistic regression analysis of factors influencing anxiety in FDRs
-
Educational level, age, CCI score, and risk perception were identified as independent influencing factors for anxiety (p < 0.05). See Table 4.
Table 4. Multivariate logistic regression analysis of factors influencing anxiety.
Variables β S.E Z p OR (95% CI) Intercept −0.837 0.463 −1.808 0.071 0.433 (0.175–1.073) Education level, n (%) Junior high or below 1.000 (Ref.) High school/junior college 1.486 0.551 2.695 0.007 4.418 (1.500–13.015) Undergraduate 1.344 0.547 2.457 0.014 3.833 (1.313–1.196) Postgraduate or above 0.897 0.694 1.292 0.196 2.452 (0.629–9.563) Age group, n (%) 18–45 1.000 (Ref.) 45–60 −1.080 0.480 −2.251 0.024 0.340 (0.133–0.870) 60–80 −1.239 0.597 −2.077 0.038 0.290 (0.090–0.933) CCI group, n (%) Mild (1–2 points) 1.000 (Ref.) Moderate (3–4 points) 3.007 0.852 3.529 < 0.001 20.232 (3.807–107.522) Severe (≥ 5 points) 2.410 0.452 5.335 < 0.001 11.132 (4.593–26.980) Risk perception group, n (%) Low (1–2 points) 1.000 (Ref.) Moderate (3 points) 2.101 0.640 3.283 0.001 8.177 (2.332–28.667) High (4–5 points) 1.361 0.615 2.213 0.027 3.902 (1.168–13.031) OR: Odds Ratio, CI: Confidence Interval. p-Values in boldface indicate the statistical significance. Variables showing statistical significance in univariate analysis and those deemed clinically relevant were entered into the multivariate stepwise logistic regression model (Backward LR method). It was found that 'health belief' and 'relative type' had p-values > 0.05 and were excluded from the final model (Table 4). The above four indicators were included in the final model and significantly influenced anxiety (p < 0.05).
Evaluation of the model's predictive performance and generalizability in training and validation cohorts
-
The predictive performance of the model in both the training and validation cohorts. The AUC was 0.910 in the training set and 0.846 in the validation set, indicating good discrimination and generalizability (Table 5).
Table 5. Predictive performance of the model in training and validation cohorts.
Data AUC (95% CI) Accuracy (95% CI) Sensitivity (95% CI) Specificity (95% CI) PPV (95% CI) NPV (95% CI) Training 0.910 (0.873–0.948) 0.808 (0.756–0.854) 0.906 (0.827–0.984) 0.784 (0.729–0.839) 0.511 (0.410–0.612) 0.971 (0.946–0.996) Validation 0.846 (0.751–0.940) 0.763 (0.674–0.838) 0.760 (0.593–0.927) 0.764 (0.676–0.852) 0.475 (0.320–0.630) 0.919 (0.857–0.981) Development of a nomogram predictive model for anxiety in FDRs
-
A nomogram predictive model was constructed based on the four independent influencing factors identified in the multivariate logistic regression analysis. The model indicated that the CCI exerted the greatest influence on anxiety, followed by risk perception, educational level, and age (see Fig. 1).
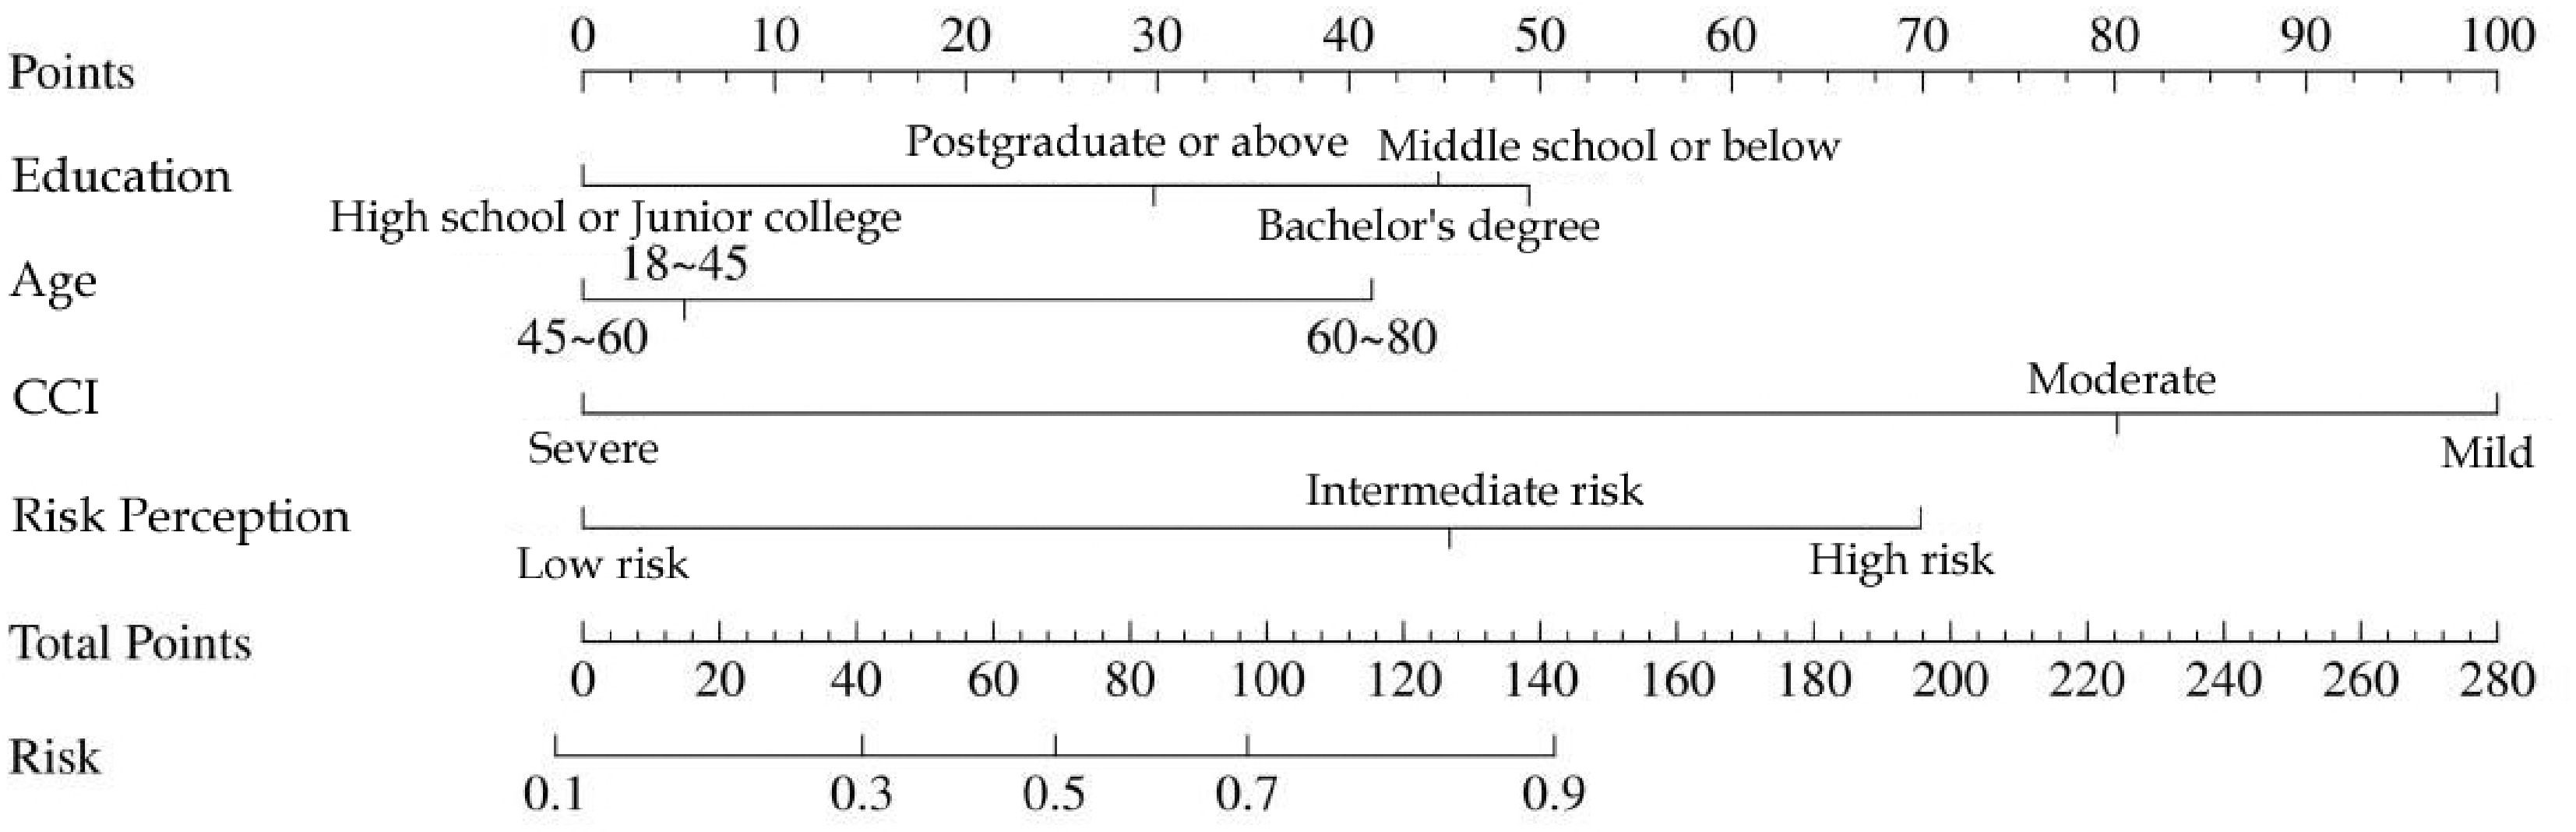
Figure 1.
Nomogram.
Calibration curves for both the training and validation cohorts demonstrated slopes close to 1. This finding indicates good consistency between the nomogram-predicted probability of anxiety and the actual observed probability. The predicted curve closely matched the actual values, suggesting excellent predictive performance. See Figs. 2 and 3. The Hosmer-Lemeshow test yielded a chi-square value of 6.597 (p = 0.488) for the training group and a chi-square value of 4.913 (p = 0.667) for the validation cohorts. These results confirm satisfactory model calibration. Receiver operating characteristic (ROC) curve analysis revealed an area under the curve (AUC) of 0.910 (95% CI: 0.873–0.948) for the training group, with a sensitivity of 90.6% and a specificity of 78.4%. For the validation group, the AUC was 0.846 (95% CI: 0.751–0.940), with a sensitivity of 76.0% and a specificity of 76.4%. These results indicate good model discrimination. See Figs. 4 and 5.
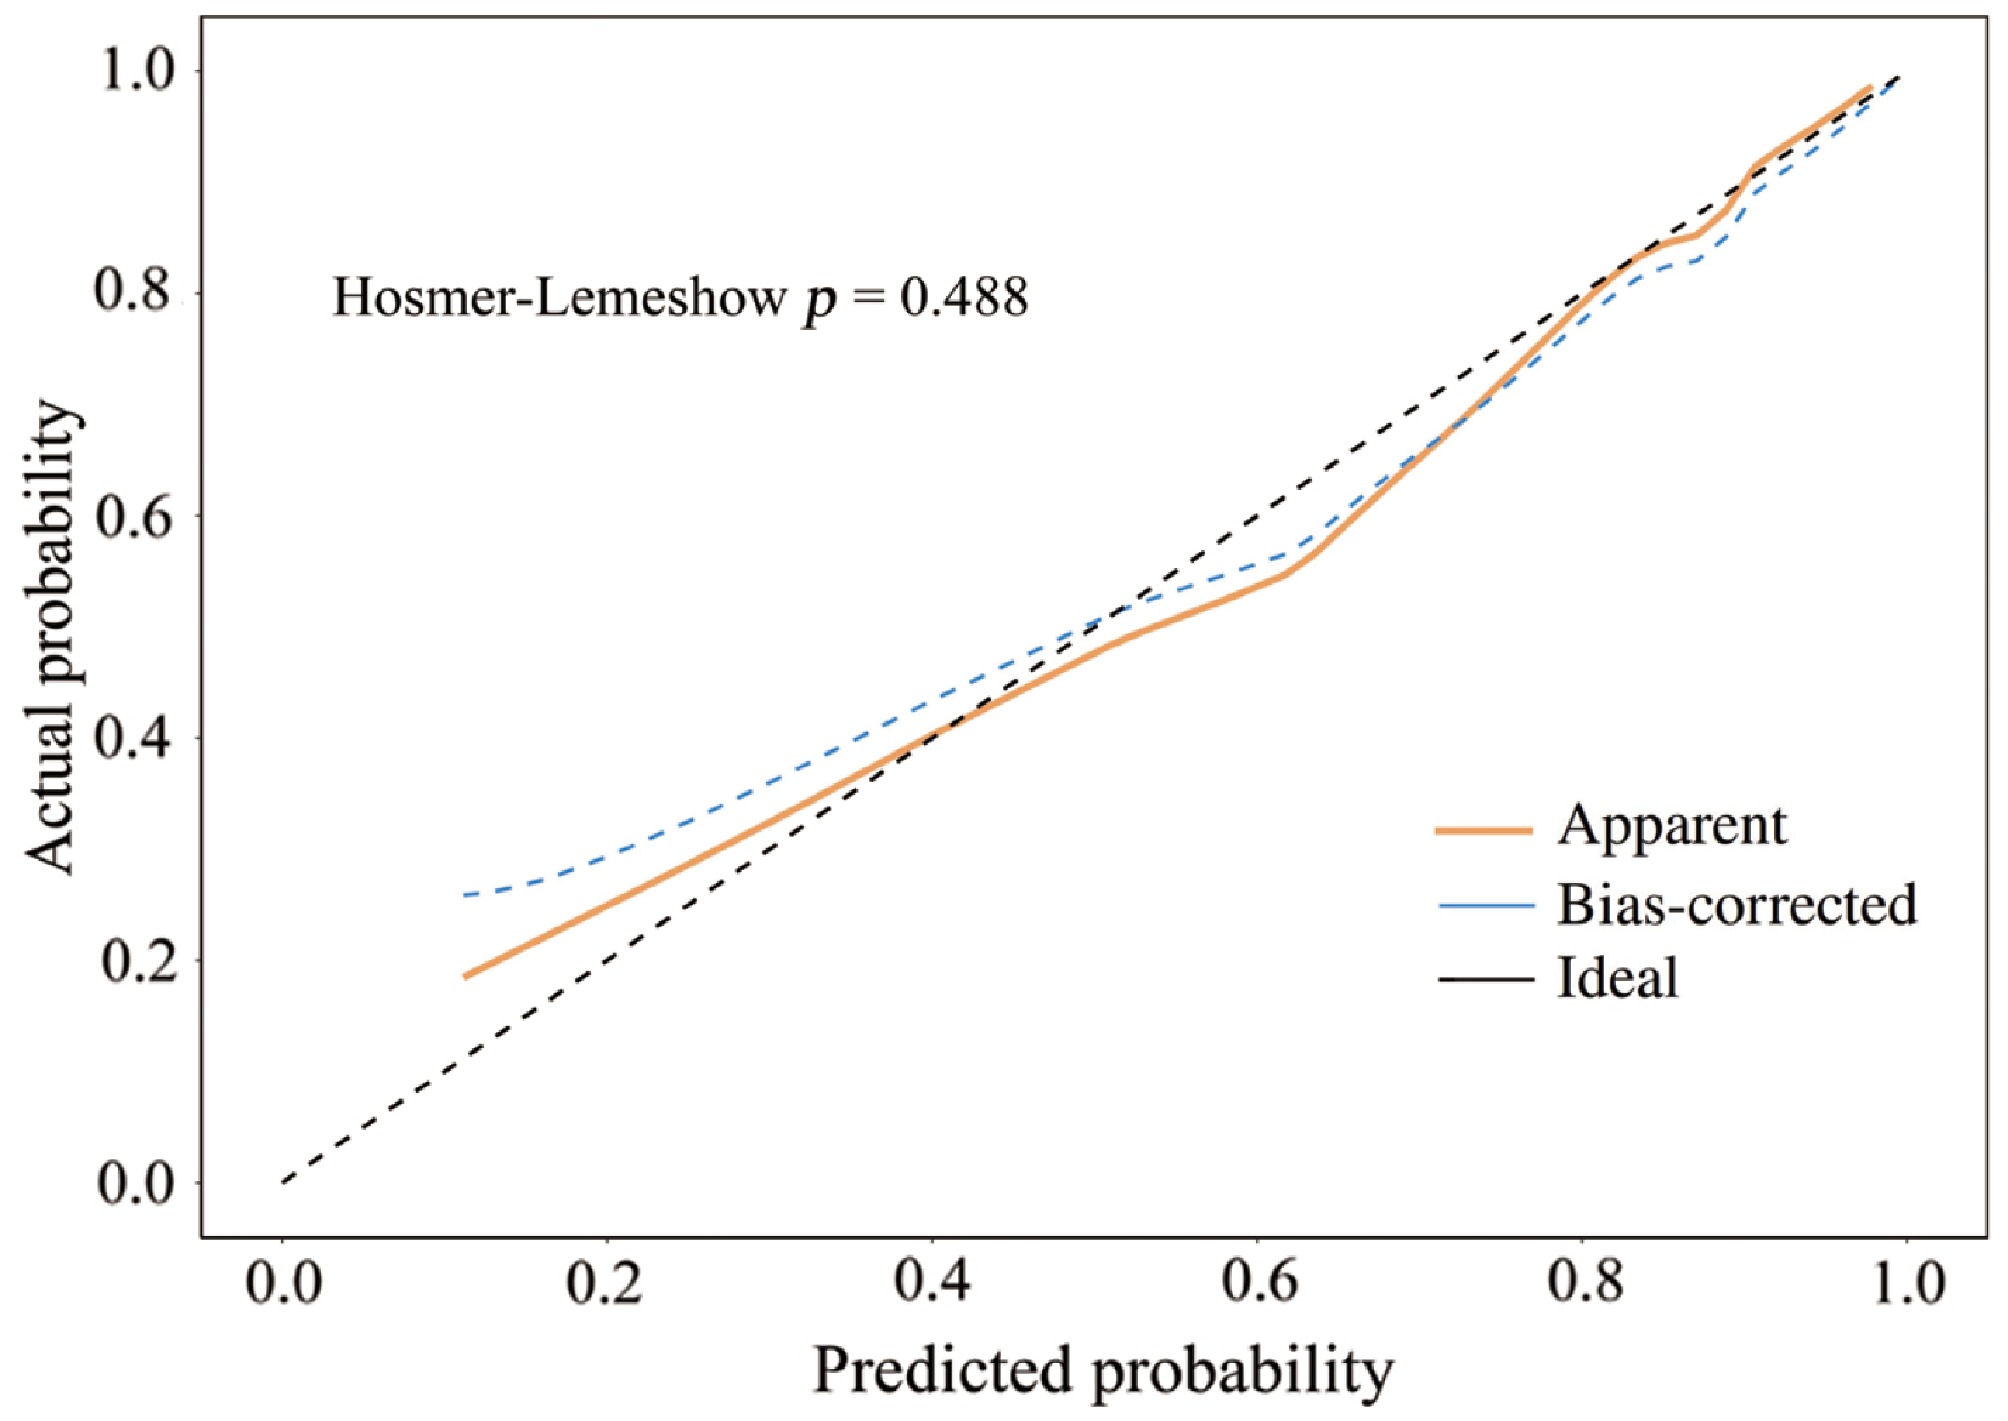
Figure 2.
Calibration plot for the training group. The predicted curve closely matches the actual values. χ2 = 6.597, p = 0.488.
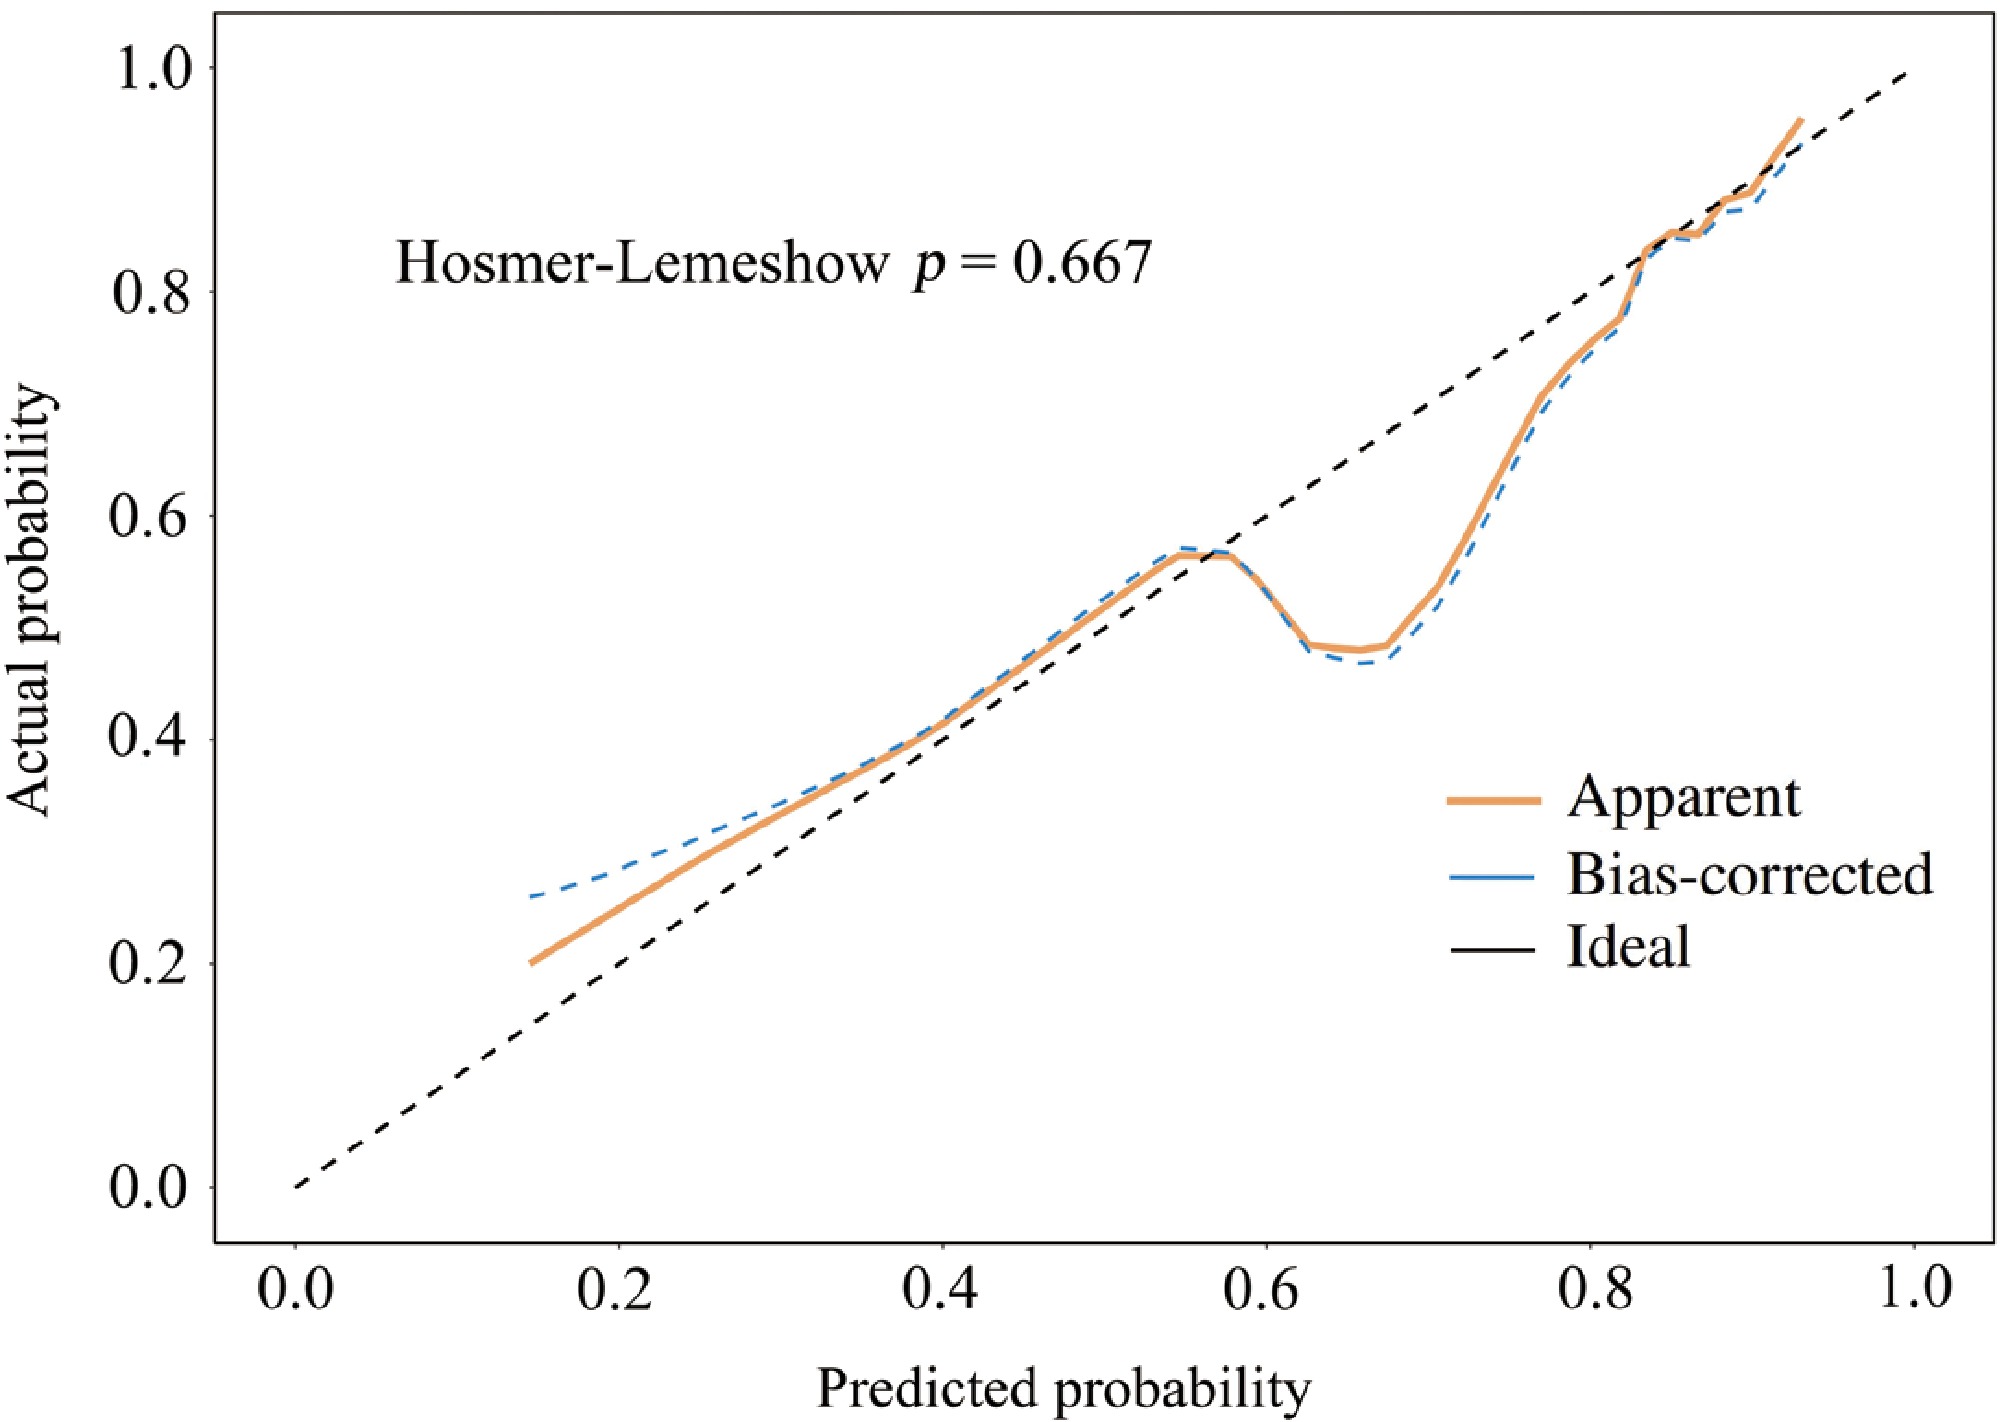
Figure 3.
Calibration plot for the validation cohorts. The predicted curve closely matches the actual values. χ2 = 4.913, p = 0.667.
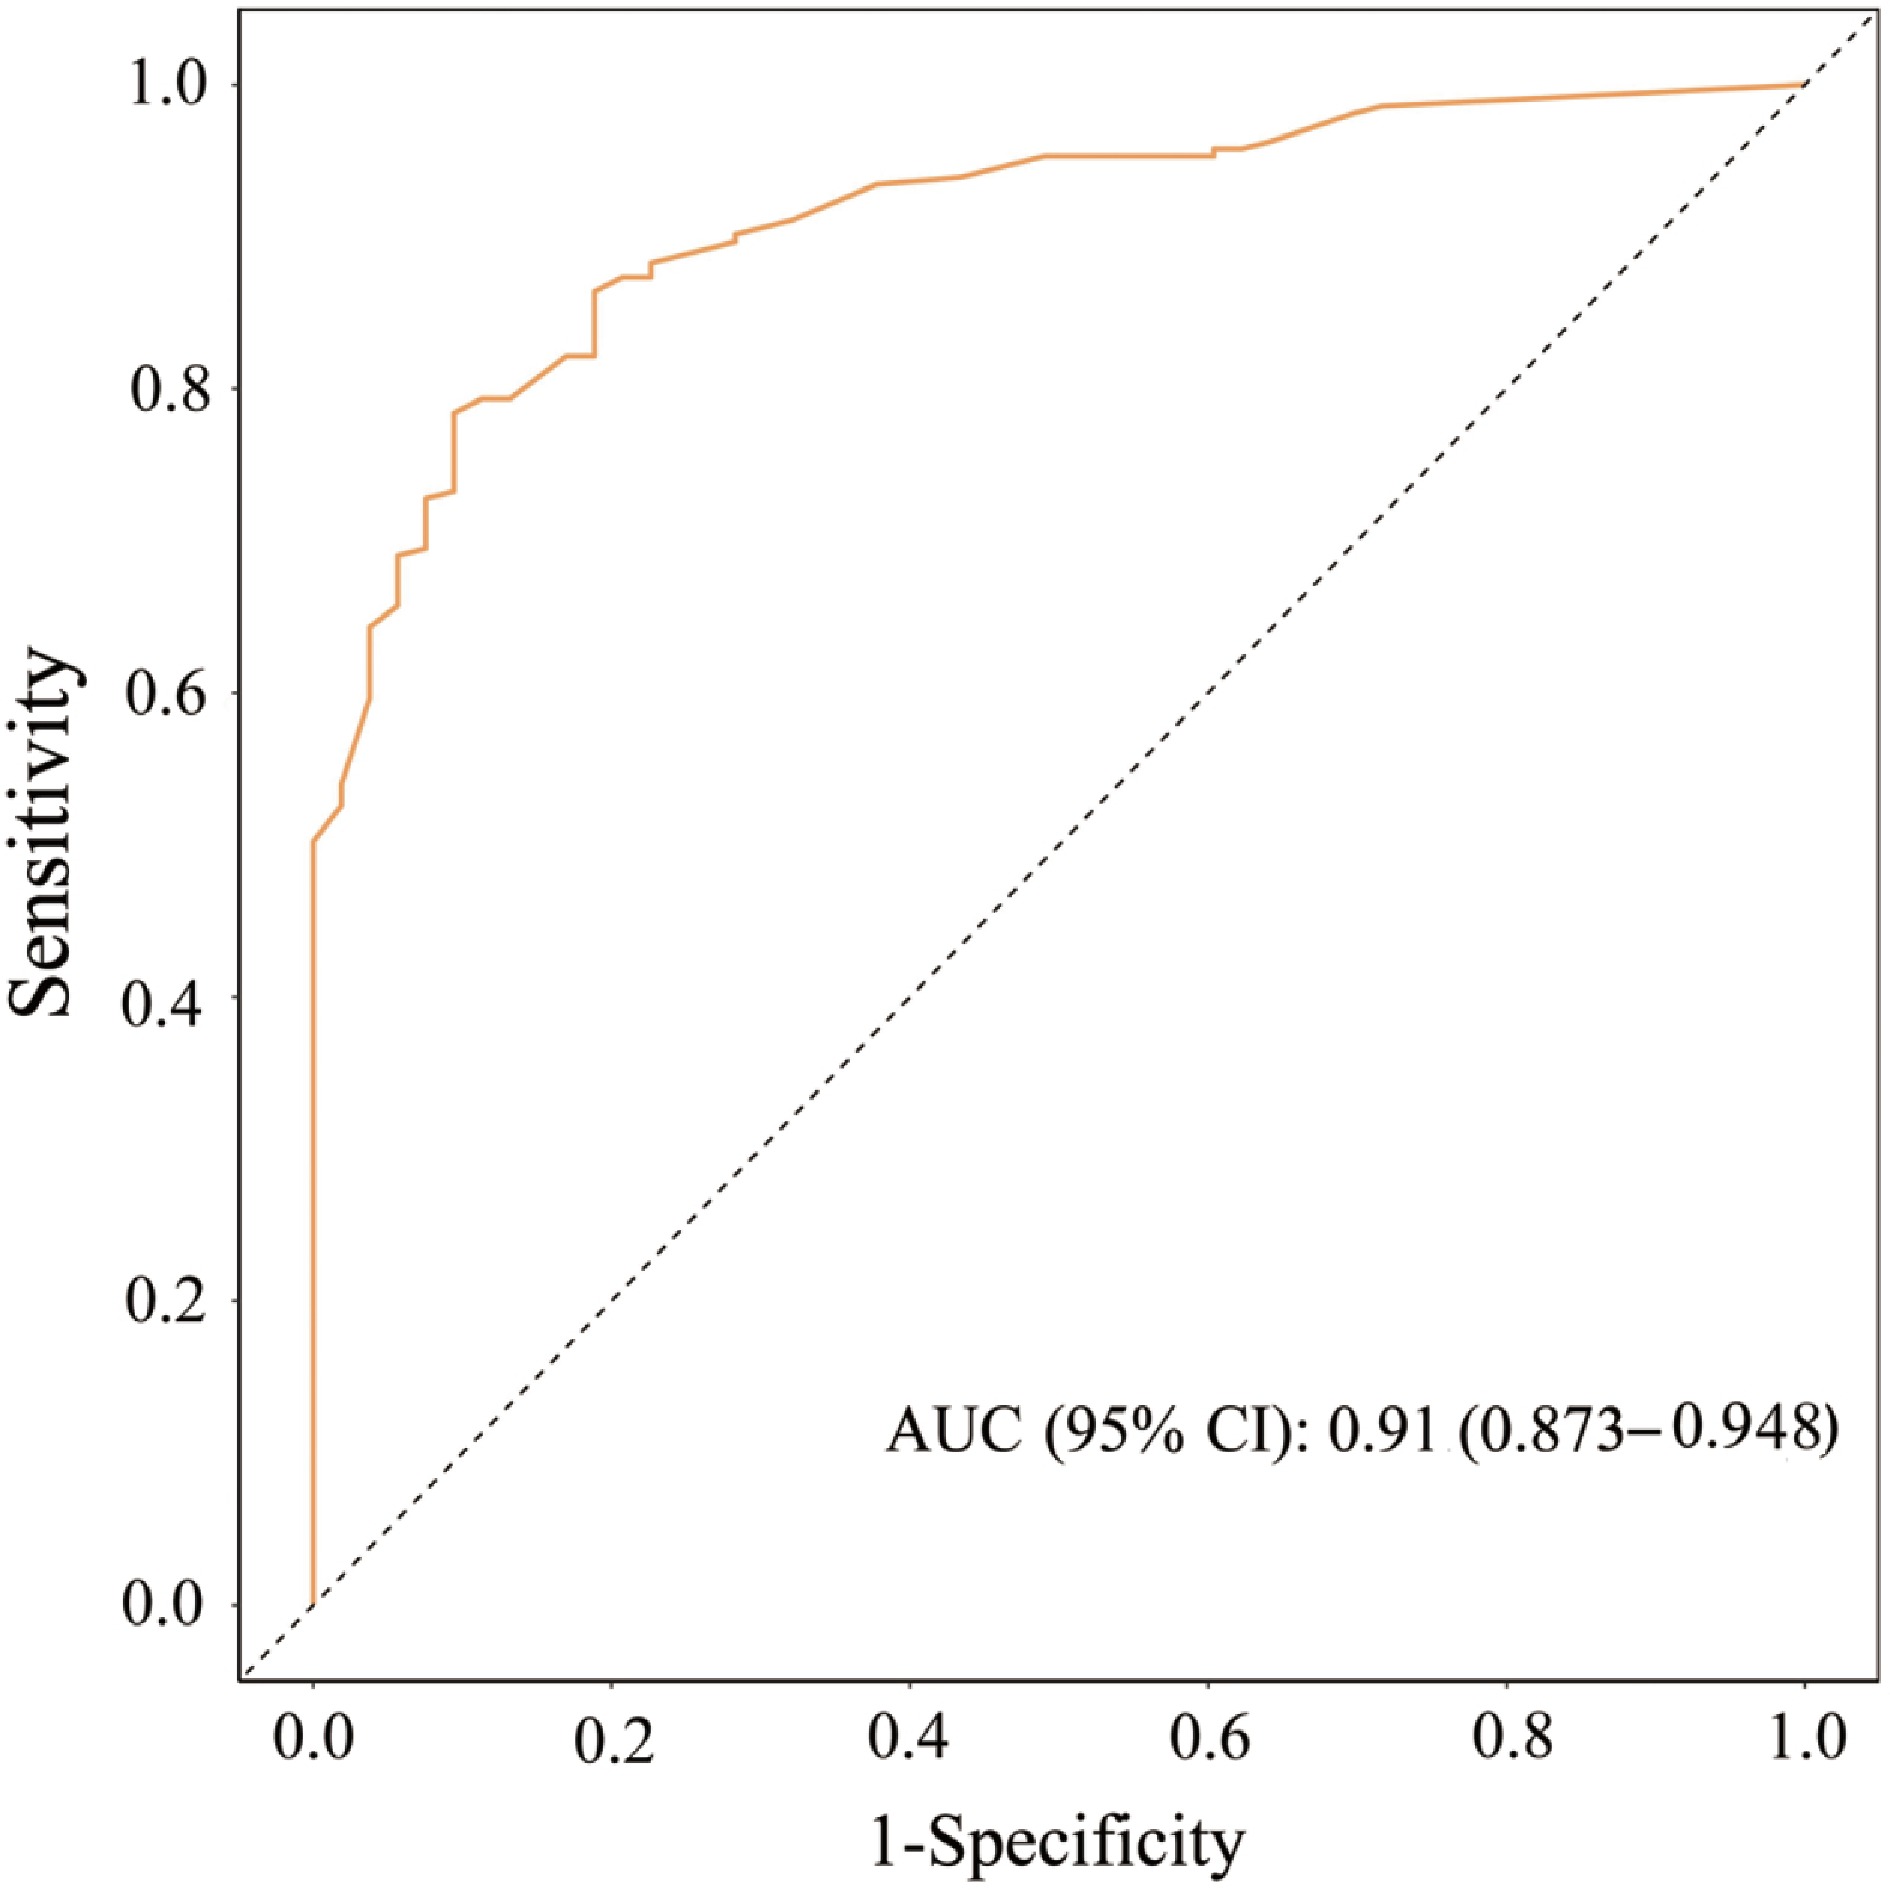
Figure 4.
ROC curve for the training group. AUC = 0.910 (95% CI: 0.873–0.948), indicating good discrimination.
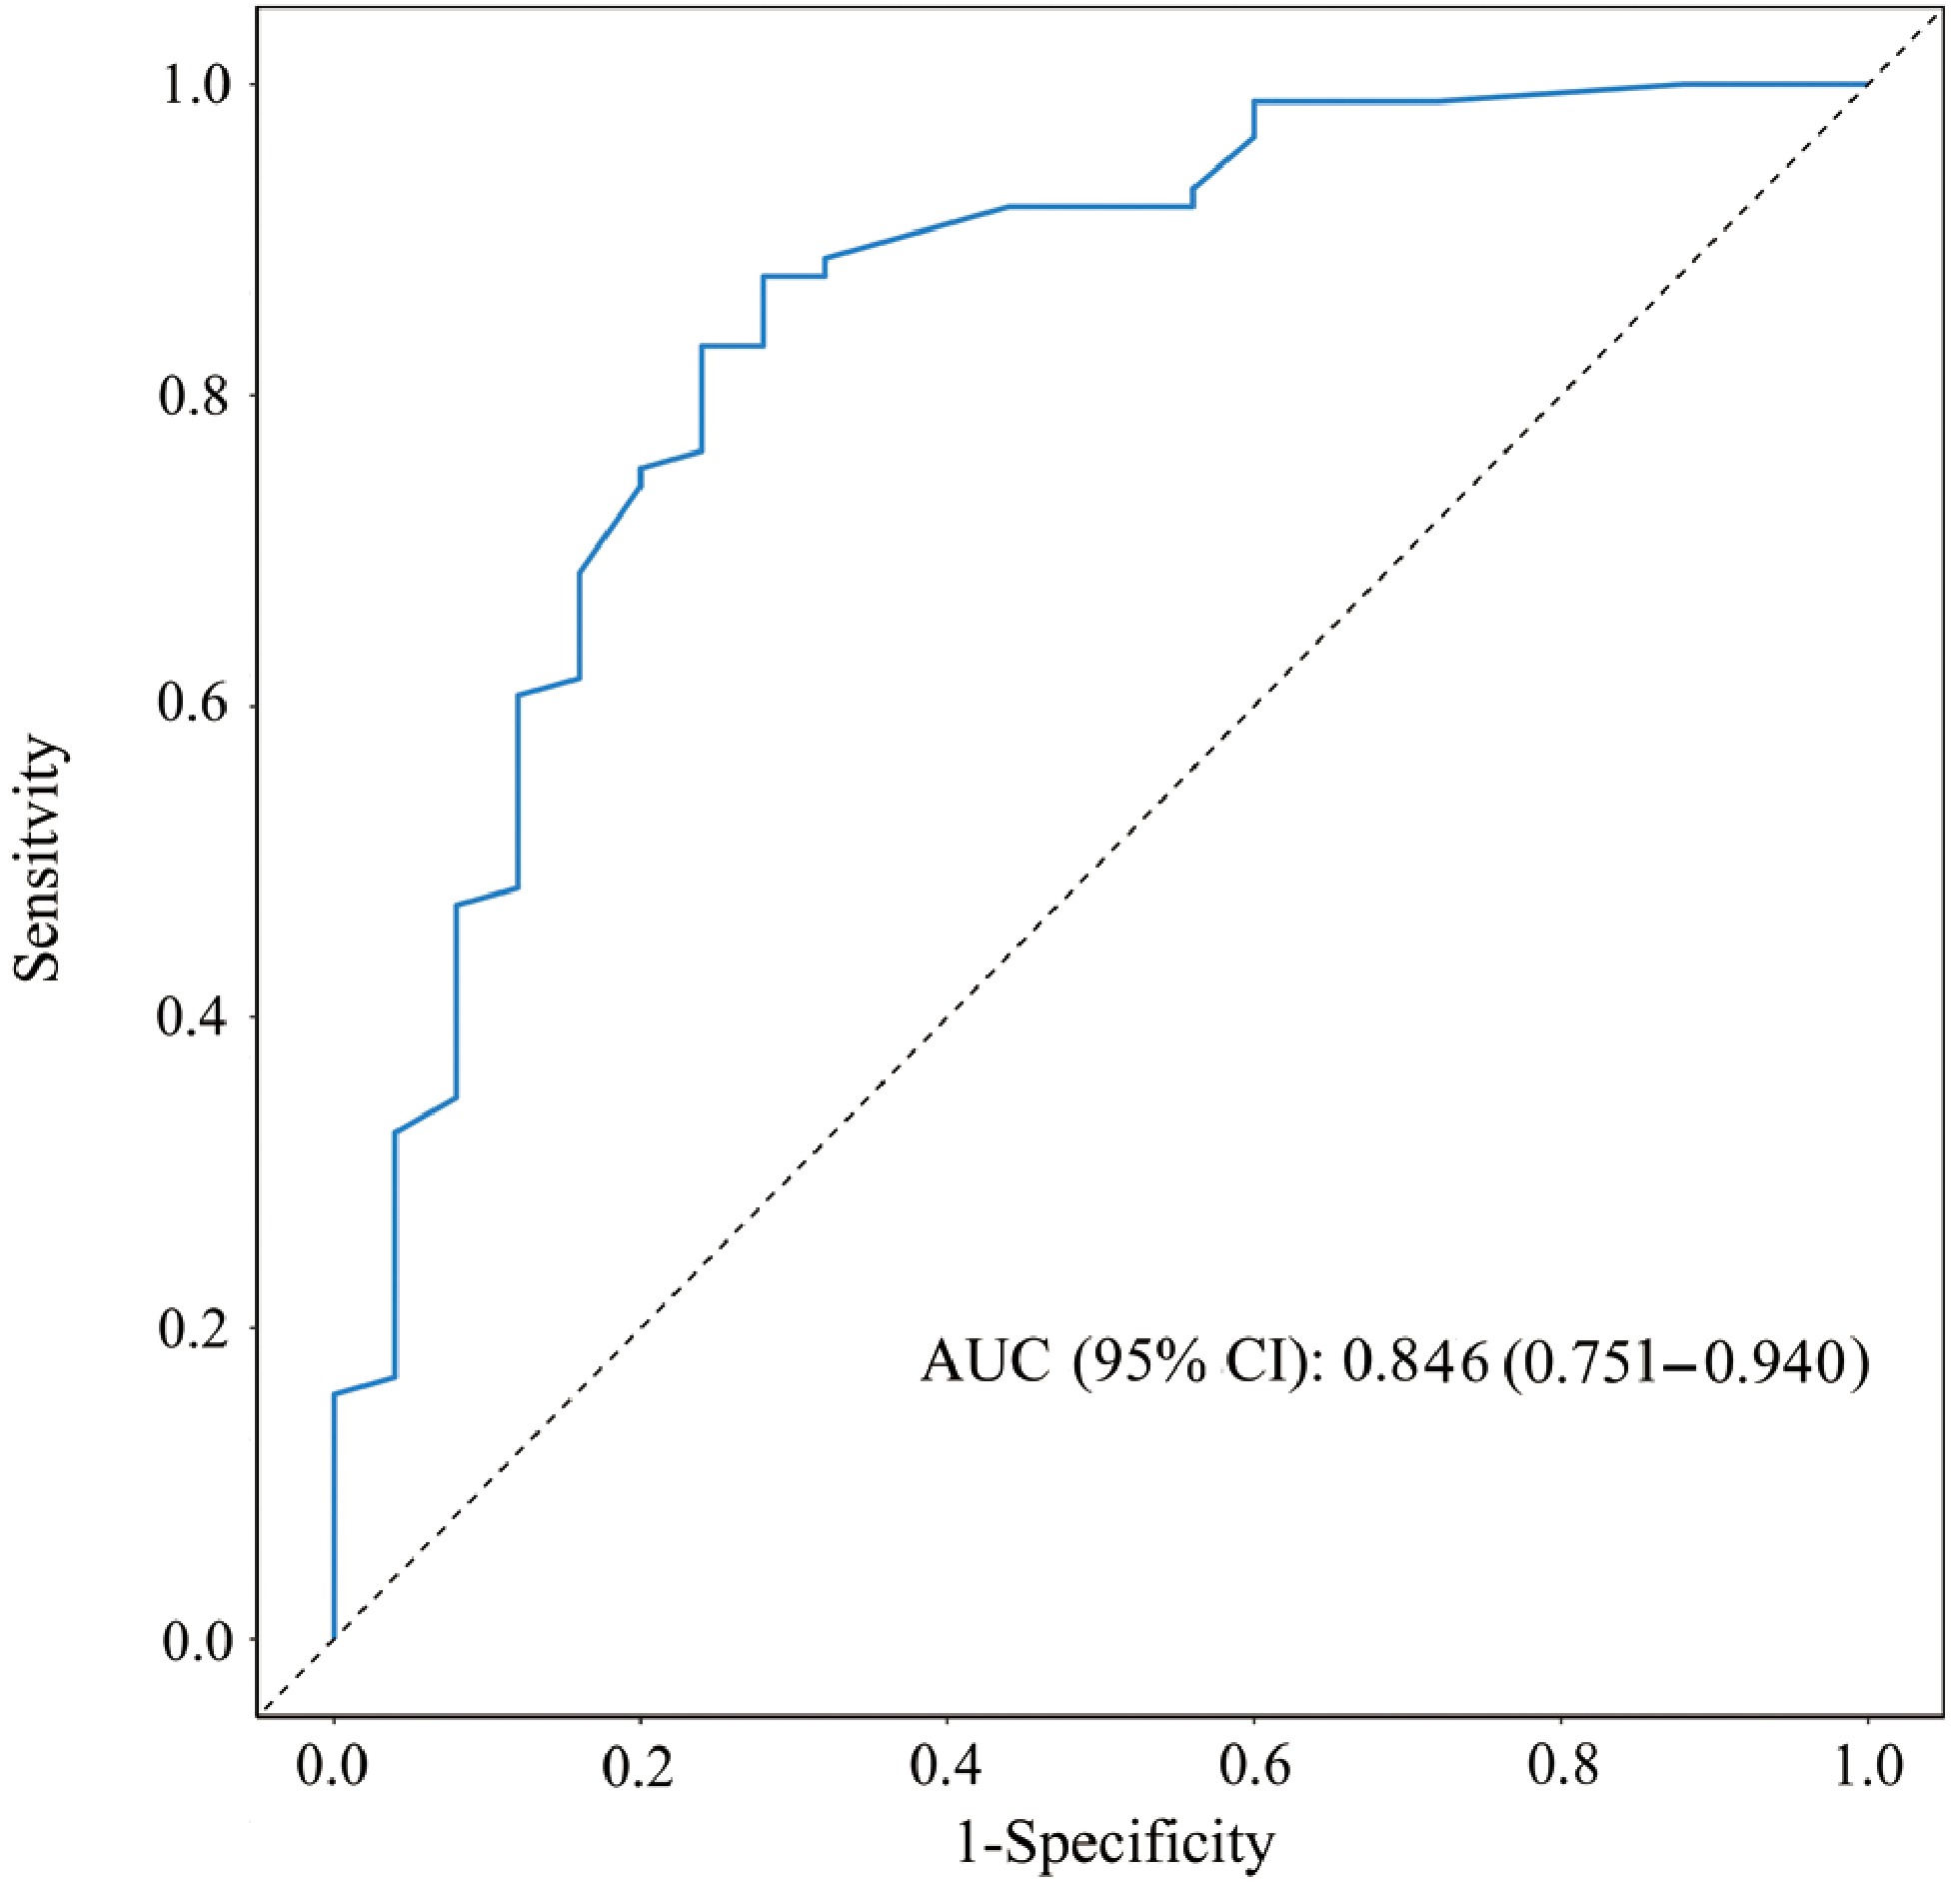
Figure 5.
ROC curve for the validation set. AUC = 0.846 (95% CI: 0.751–0.940), indicating good discrimination.
-
The results of this study indicated that 213 out of 266 individuals (80.08%) in the training group experienced anxiety. This prevalence is higher than that reported in some previous literature. The elevated rate may be attributed to the timing of data collection, which occurred upon the patient's hospital admission. Several factors may explain this high prevalence: (1) The study specifically enrolled FDRs of CRC patients during hospital visits. This acute care context may trigger heightened anxiety levels; (2) This study classified mild, moderate, and severe anxiety as 'anxiety', which likely contributed to a higher detection rate; (3) Sampling bias cannot be ruled out. FDRs who actively chose to participate may have had inherently higher anxiety levels. Additionally, the single-center sample may have limited representativeness.
A cancer diagnosis constitutes a profoundly negative life event for both the patient and their family. Within the context of Chinese cultural traditions, physicians often communicate disease-related information to the patient's first-degree relatives first. These key family members bear significant psychological pressure. They must weigh concerns about the patient's condition, disease prognosis, and multiple other factors[16]. Confronted with the new diagnosis, relatives—as the closest individuals to the patient—often feel overwhelmed and helpless. This uncertainty predisposes them to anxiety. On one hand, unfamiliarity with the treatment process, uncertainty about prognosis, and the substantial financial burden of care contribute to feelings of helplessness and fear. These factors foster anxiety. On the other hand, FDRs of CRC patients are involved throughout the entire care trajectory. This includes diagnosis, treatment, rehabilitation, and even end-of-life care. They are not only chronically exposed to the patient's treatment environment. They also face an elevated personal risk of developing cancer. Their physical, psychological, social, and economic well-being is challenged. This constellation of stressors triggers associated anxiety[17]. Furthermore, relatives must provide both practical and emotional support to the patient while managing their own work responsibilities and household duties. They are often stretched thin, commuting between the hospital, workplace, and home. Throughout cancer treatment, patients endure significant physical and psychological distress. They may exhibit mood swings and often direct negative emotions toward their caregivers. Caregivers, in turn, have limited outlets for their own distress. The accumulation of such unexpressed negative emotions over time predisposes them to psychological problems. This study revealed that anxiety levels among FDRs of CRC patients were higher than the national norm in China.
Analysis of influencing factors for anxiety
Educational level
-
An educational level of junior college or higher was identified as a risk factor for anxiety. This finding aligns with the results of Shi & Yang and Lü et al.[18,19]. Educational level was positively correlated with anxiety scores. In other words, higher educational attainment was associated with a greater likelihood of anxiety. Several studies have demonstrated that highly educated individuals are more susceptible to anxiety[20,21]. Relatives often desire detailed information about the disease and its treatment. When the information provided by healthcare professionals fails to meet their needs, their anxiety increases[22]. A possible explanation is that individuals with higher education possess greater capacity for information reception, assimilation, and comprehension. They consequently have stronger needs for detailed disease and caregiving information. This heightened information-seeking behavior may render them more susceptible to anxiety. The lack of statistical significance for postgraduate education may be due to the small sample size within that subgroup. This finding suggests that clinical healthcare workers should proactively provide disease-related information to relatives. Where feasible, institutions might offer educational brochures or videos to enhance understanding of the disease and its complications. Community nursing, home-based care, and transitional care programs may also help bridge information gaps. Such interventions could alleviate anxiety levels and reduce its occurrence.
Risk perception
-
Risk perception refers to an individual's subjective experience of a health threat. Appropriate risk perception can motivate individuals to adopt proactive health management behaviors and improve decision-making efficacy. In this study, higher risk perception was positively associated with anxiety. Regarding the relationship between risk perception and mental health, prior research has indicated that higher levels of risk perception are associated with poorer mental health outcomes[23]. Excessively high risk perception can amplify negative emotions such as stress, anxiety, and depression. It may also trigger irrational behaviors that further exacerbate harm. Under conditions of high risk perception, individuals become acutely sensitive to bodily changes. Common physiological occurrences like occasional bloating or altered bowel habits may be misinterpreted as early signs of cancer. This repetitive self-monitoring and suspicion persistently deplete psychological reserves. Consequently, anxiety levels rise. When relatives witness a parent or sibling—with whom they share high genetic similarity—suffer from CRC, they may develop a sense of identification. Thoughts such as 'That will be me in the future' can emerge, precipitating anxiety. During efforts to understand the disease, relatives may encounter an abundance of negative information or extreme case reports. Such exposure can deepen fear and apprehension. Even if screening reduces objective risk, some individuals may remain preoccupied with the possibility of missed lesions or future occurrences. This state of requiring long-term vigilance can foster chronic anxiety. Given the heritable component of CRC, relatives may harbor significant concerns about their own susceptibility. This concern can further elevate the incidence of anxiety[24,25]. These findings underscore the need for healthcare professionals to strengthen disease education for patients' relatives. Enhancing understanding of the disease, guiding appropriate health screening, promoting healthy dietary habits, and instructing on preventive measures can collectively help alleviate tension and anxiety.
Age
-
Several studies have demonstrated[26,27] that age is an influential factor in caregiver anxiety and depression. This study indicated that older FDRs were more prone to experiencing anxiety. This may be because older relatives, who are themselves in a suboptimal state of health, face substantial physical and emotional demands in caring for and comforting the patient. They worry about the patient while also being concerned about their own well-being. Alternatively, it is possible that younger relatives of cancer patients exhibit higher levels of benefit finding. They may be more proactive in seeking positive meaning within the traumatic event. While caregiving responsibilities can significantly impact younger relatives' career choices and social needs, their capacity for adjustment and coping tends to be relatively robust. Given that younger patients generally possess stronger physical resilience, both the patient and their younger caregivers may harbor greater expectations for functional recovery. This observation aligns with the findings of Manne et al.[28]. However, Janda et al.[29] reported that younger caregivers (< 60 years) are more likely to experience subclinical or clinical anxiety/depression and have poorer quality of life. This discrepancy might relate to relatives' expectations for prolonged survival and high quality of life for the patient. Concurrently, younger relatives possibly have not established robust social support systems. They may lack sufficient social resources and coping experience. Consequently, they may be less able to provide adequate disease-related support for themselves and their families. Also, younger relatives are often navigating demanding life and career phases. They must balance caregiving duties with their own professional and domestic responsibilities. This dual burden can precipitate anxiety. Therefore, younger caregivers require adequate time to adapt to their multifaceted roles. For caregivers of older patients, guidance on arranging reasonable caregiving schedules and fostering communication among family members can help alleviate physical and psychological stress. Should the patient's cancer recur, the life and career trajectories of younger relatives may be further disrupted. This prospect can itself become a source of anxiety[30].
Patient comorbidity index
-
A higher patient comorbidity index was associated with more severe anxiety and depression among FDRs. Research indicates that comorbidities significantly influence the decision-making process for anti-cancer therapy, treatment efficacy, adverse effects, and patient prognosis[31−33]. These factors contribute to elevated stress levels and diminished social support for relatives. When a patient suffers from multiple diseases, the relatives worry about disease progression and prognosis, and they endure prolonged mental stress[9]. Managing multiple conditions concurrently often necessitates complex medication regimens. This increases the patient's 'pill burden' and the complexity of self-management. It can easily lead to confusion, forgetfulness, or deliberate non-adherence. Such difficulties further amplify the stress experienced by relatives. In light of this, clinical practice should prioritize the early identification of FDRs of CRC patients with multiple comorbidities. Necessary support should be provided. When appropriate, involving other family members to share caregiving responsibilities may be recommended.
Economic factors
-
Prior studies have indicated that family caregivers with lower personal monthly income exhibit higher anxiety levels compared to those with higher income[34,35]. However, no significant difference was observed in the present study. A possible explanation is that the overwhelming majority of patients in this investigation were covered by medical insurance. Given China's medical insurance policies and specific payment schemes for cancer patients, out-of-pocket expenses for patients may not be substantial. Additionally, this study was conducted at a Grade A tertiary hospital in Nanjing, an area with relatively favorable economic conditions. These factors may have mitigated the expected economic disparities.
In summary, anxiety among FDRs is associated with educational level, age, comorbidity index, and risk perception. The nomogram model in this study showed high accuracy and discrimination in predicting anxiety among FDRs of CRC patients. However, the sample size and number of influencing factors included were limited, which may introduce bias. Future studies should incorporate larger samples and more factors to refine the predictive model. This study has several limitations. First, all measurement instruments were self-report scales. Data collection therefore carries inherent limitations. The study variables primarily relied on subjective, self-reported written measures. Although the scales underwent reliability and validity testing, the data essentially represent subjective perceptions. They lack corroboration from objective physiological indicators or behavioral logs. Respondents may have been subject to recall bias or social desirability bias during completion. This could lead to reporting bias in the responses. Future studies could incorporate objective measurement methods, such as wearable devices or behavioral experiments, alongside subjective scales. This would enhance the multidimensionality and accuracy of the data.
Second, risk perception was assessed using a single item. The measurement did not capture the emotional dimensions of worry or fear related to the disease. Future studies should consider developing and utilizing more comprehensive, specialized scales.
-
This study found a high incidence of anxiety (80.08% in the model development group) among FDRs of CRC patients. The prevalence exceeded rates reported in previous literature. Anxiety was influenced by multiple factors. Higher educational level (junior college or above), higher risk perception, younger age, and higher comorbidity index were independent risk factors for anxiety. Economic factors did not show a significant association in this study. The predictive model constructed based on these factors demonstrated good accuracy and discrimination. It can be used clinically for early identification of high-risk FDRs. Clinical practice should emphasize psychological support for FDRs of CRC patients. Personalized health education should be provided, tailored to age, educational background, and risk perception level. Attention should also be directed toward the caregiving burden in families of patients with comorbidities.
This study has limitations. Model validation relied on internal random splitting. External validation across independent centers or time periods is needed. Anxiety assessment and certain variables (e.g., risk perception) utilized subjective scales or single items. This may introduce recall bias or oversimplification. Future studies should incorporate objective physiological markers (e.g., heart rate variability, cortisol levels) to assess anxiety more comprehensively and improve measurement accuracy. Furthermore, the single-center design limits generalizability. Future prospective cohort studies across multiple centers and different timeframes are warranted. Independent external or temporal validation should be employed to evaluate the model's generalizability.
-
The study was conducted in accordance with the Declaration of Helsinki, and the protocol was approved by Nanjing First Hospital Ethics Committee (KY20180604-05-KS-01) on January 6, 2020 Written consent was obtained from all participants.
-
The authors confirm their contributions to the paper as follows: conceptualization, methodology: Chen J, Ren X; software, writing – original draft, funding acquisition: Chen J; data curation, validation: Ren X; investigation, supervision: Ren X, Liu C; resources, data curation: Fan J. All authors reviewed the results and approved the final version of the manuscript.
-
The datasets supporting the findings of this study are available from the corresponding author upon reasonable request.
-
The authors declare that they have no conflict of interest.
- Copyright: © 2026 by the author(s). Published by Maximum Academic Press, Fayetteville, GA. This article is an open access article distributed under Creative Commons Attribution License (CC BY 4.0), visit https://creativecommons.org/licenses/by/4.0/.
-
About this article
Cite this article
Chen J, Ren X, Liu C, Fan J. 2026. Development and validation of a predictive model for anxiety in first-degree relatives of patients with colorectal cancer. Gastrointestinal Tumors 13: e013 doi: 10.48130/git-0026-0012 

Development and validation of a predictive model for anxiety in first-degree relatives of patients with colorectal cancer
- Received: 10 March 2026
- Revised: 25 April 2026
- Accepted: 21 July 2026
- Published online: 02 September 2026
Abstract: To develop and validate a predictive model for anxiety in first-degree relatives (FDRs) of patients with colorectal cancer (CRC). A total of 380 FDRs of CRC patients were enrolled and randomly divided into a model development group (n = 266) and a validation group (n = 114) at a 7:3 ratio. A predictive model was established using multivariate logistic regression. Model performance was evaluated using receiver operating characteristic (ROC) curves. The incidence of anxiety was 80.08%. Educational level, age, Charlson comorbidity index (CCI), and risk perception were identified as independent influencing factors for anxiety (p < 0.05). Calibration curves showed good agreement between predicted and observed probabilities, with curves closely following the 45-degree reference line. The Hosmer-Lemeshow test yielded p-values of 0.488 and 0.667, respectively. The area under the ROC curve (AUC) was 0.91 for the model development group, with a sensitivity of 90.6% and a specificity of 78.4%. For the validation group, the AUC was 0.846, with a sensitivity of 76.0% and a specificity of 76.4%. Anxiety in FDRs of CRC patients is associated with educational level, age, CCI, and risk perception. The model demonstrates good discrimination and may help identify high-risk individuals for targeted interventions.
-
Key words:
- Colorectal cancer /
- First-degree relatives /
- Anxiety /
- Risk factors