


-
Bangladesh, the land of rivers, harbors some of the most productive freshwater fisheries in South Asia, supported by 6,27,731 hectares of closed and 40,24,934 hectares of open water bodies[1]. Among cultured freshwater species, the stinging catfish, Heteropneustes fossilis (Shing), is commercially important due to its high protein content, firm flesh, and medicinal properties. Its tolerance to hypoxia, high stocking density, and environmental stress further enhances its aquaculture potential[2−4].
In response to rising consumer demand, hatchery-based propagation of H. fossilis has expanded rapidly across the country. However, intensive hatchery practices often compromise genetic quality[5−7]. Limited broodstock size, repeated use of the same parental lines, and inadequate genetic management can lead to inbreeding depression, reduced heterozygosity, and morphological alterations associated with domestication[8−10]. These conditions may ultimately result in reduced growth, deformities, and lower fitness in hatchery populations compared with wild populations[2,11,12]. In contrast, wild stocks retain higher genetic variability and phenotypic plasticity due to natural selection and environmental heterogeneity, making them more resilient and adaptable[13,14]. Therefore, assessing morphological and genetic differentiation between hatchery and wild populations is essential for maintaining broodstock quality and ensuring sustainable aquaculture development[2,11,15].
Morphological traits are widely used indicators of population structure, adaptive variation, and environmental influences in fish[16−18]. Geometric morphometrics, which quantify shape using anatomical landmarks, provide a powerful, precise, and cost-effective approach for detecting subtle differences among stocks[19−24]. This technique is increasingly applied in aquaculture to evaluate domestication effects, guide broodstock management, and prevent genetic deterioration[15,25,26].
Given the economic importance of H. fossilis and widespread reliance on hatchery seed in Bangladesh, understanding morphological variation between hatchery-reared and wild populations is crucial for management interventions aimed at restoring genetic diversity and improving aquaculture performance.
The aim of this study was to assess intraspecific morphological variation in H. fossilis using landmark-based geometric morphometrics, comparing three hatchery populations with a wild riverine population. Specifically, we tested the null hypothesis (H0) that hatchery stocks do not differ significantly in body shape from wild populations, against the alternative hypothesis (H1) that measurable morphological differences exist between the groups.
-
The experimental study was conducted over nine months (October 2024 to June 2025) at the Fisheries Biology and Genetics Laboratory, Hajee Mohammad Danesh Science and Technology University (HSTU), Dinajpur, Bangladesh. A total of 114 specimens of H. fossilis were collected from four geographically isolated locations representing both hatchery and wild environments. Hatchery specimens were obtained from aquaculture farms in Bogura (Kahalu), Dinajpur (Sadar), and Mymensingh (Muktagacha), while wild specimens were collected from the Garbheswari River, a natural riverine habitat (Fig. 1).
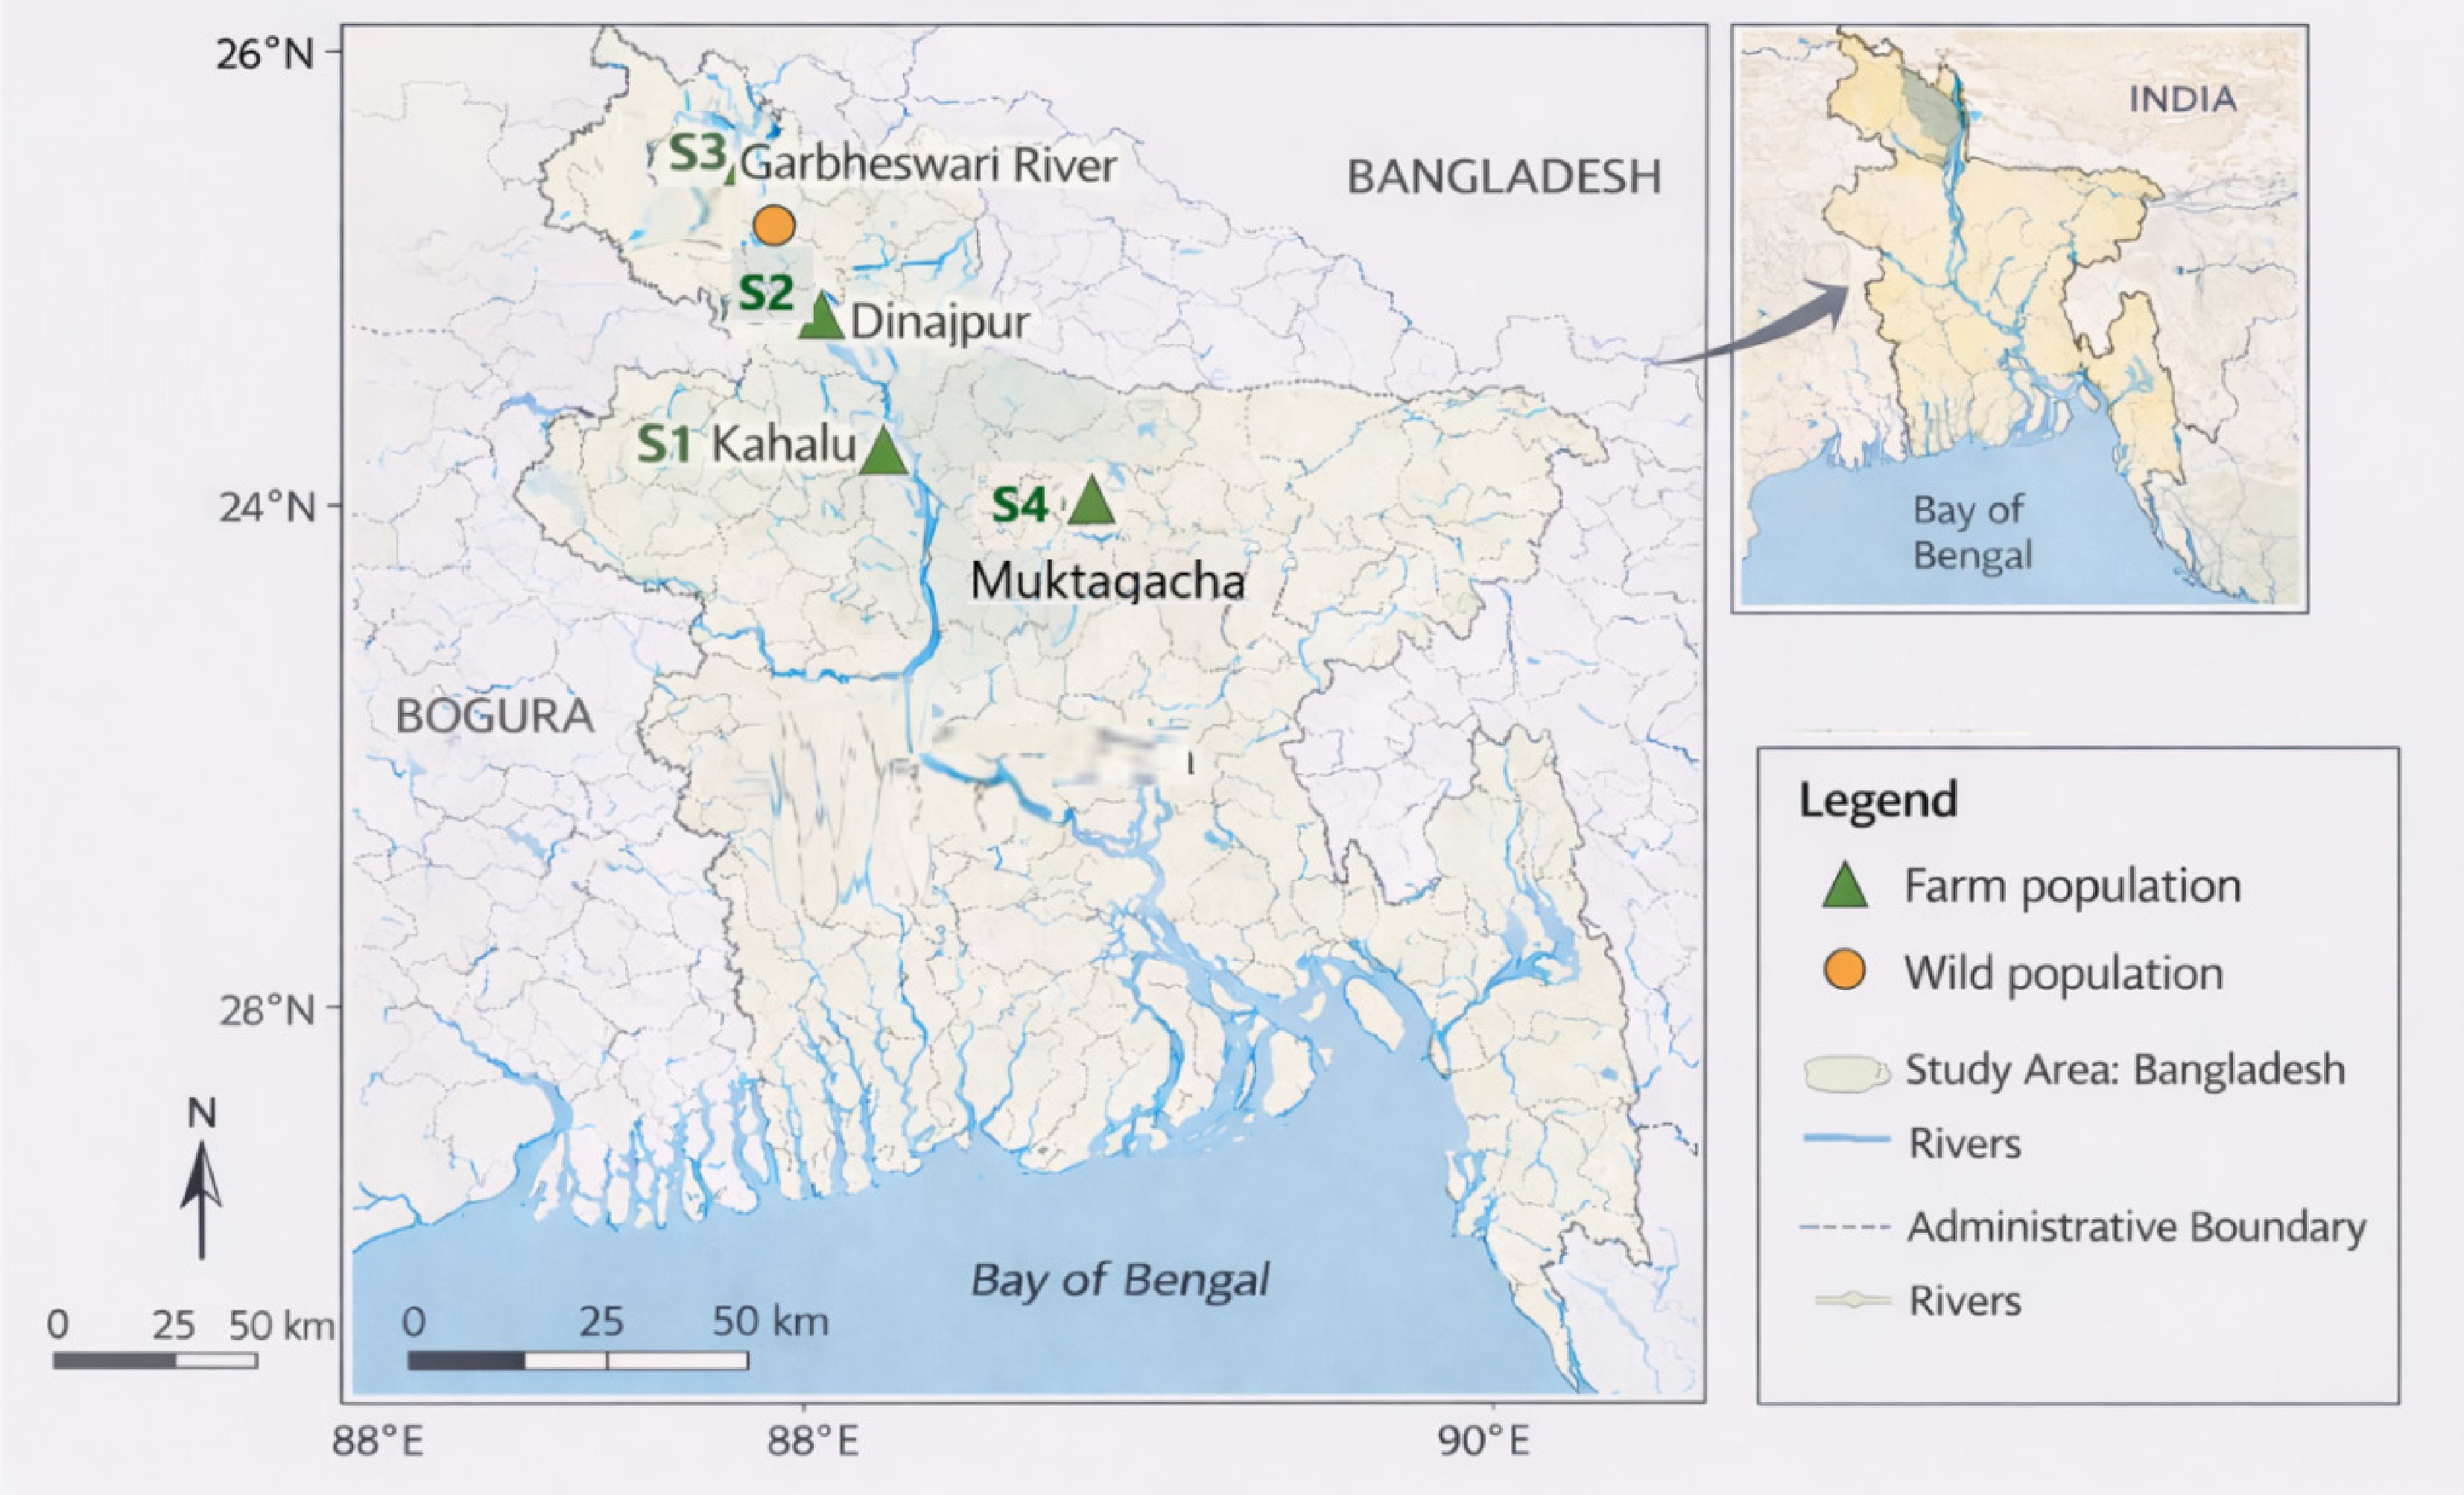
Figure 1.
Sampling locations of farmed and wild populations of Heteropneustes fossilis in Bangladesh. Source: Created by the authors using sampling coordinates and GIS datasets from the Global Map Initiative and LGED, Bangladesh.
Sampling sites were selected to represent distinct ecological and hydrological conditions across Bangladesh, ensuring broad spatial coverage for morphometric variation analysis. Mymensingh and Bogura are recognized as major aquaculture hubs in Bangladesh and represent established hatchery-based populations of H. fossilis. Dinajpur, characterized by relatively semi-arid conditions, was included due to its high potential for expansion of H. fossilis culture owing to the species' short life cycle and environmental tolerance. The Garbheswari River was selected to represent a natural population because it is relatively geographically isolated, enabling assessment of morphological traits in wild stocks with minimal hatchery influence. GPS coordinates were recorded for each site to facilitate reproducibility and geo-referencing. Details of sampling locations and specimen numbers are provided in Table 1. Specimens were captured using standard fishing gear, including cast nets, gill nets, and seine nets, depending on local habitat conditions.
Table 1. Sampling sites and geographical coordinates of H. fossilis specimens.
Serial no. Sampling site Latitude and longitude Specimens number 01 Bogura (Kahalu) farm 24.835225302963003 N; 89.26866417906673 E 30 02 Dinajpur (Sadar) farm 25.515162905939953 N; 88.61912356122421 E 30 03 Garbheswari River 25.725668118276733 N; 88.68229494916801 E 30 04 Mymensingh (Muktagacha) farm 24.78422504560068 N; 90.25608648359352 E 24 Immediately after capture, total length (TL) was measured using a digital caliper (± 0.01 mm), and body weight (BW) was measured using an electronic balance (± 0.01 g). Approximately 30 individuals per site were selected to ensure adequate statistical power. Fish were euthanized following institutional ethical guidelines. Standardized lateral photographs were taken for morphometric analysis, and specimens were preserved in 10% buffered formalin for archival reference.
Digital image acquisition and standardization
-
Standardized digital images were captured using a high-resolution DSLR camera (Canon EOS700D) mounted on a fixed tripod to maintain consistent focal distance and minimize parallax error. Each fish was placed on its left lateral side on a flat reflective surface, with fins gently stretched using soft pins or plastic rulers to prevent deformation. A metric scale bar was included in each frame for calibration. Uniform illumination was ensured using LED panel lights to minimize shadows and reflections. All images were saved in high-resolution JPEG format (300 dpi) and labeled with sample ID, date, sampling site, and population type.
Landmark selection and digitization
-
Fifteen homologous anatomical landmarks were selected to capture body shape variation (Fig. 2). Landmarks were chosen based on the criteria and were selected for clear, repeatable anatomical structures relevant to hydrodynamics, feeding mechanics, and overall morphology. Coordinates were digitized using tpsDig2 (version 2.31), and a subset of images was re-digitized to verify repeatability[27].
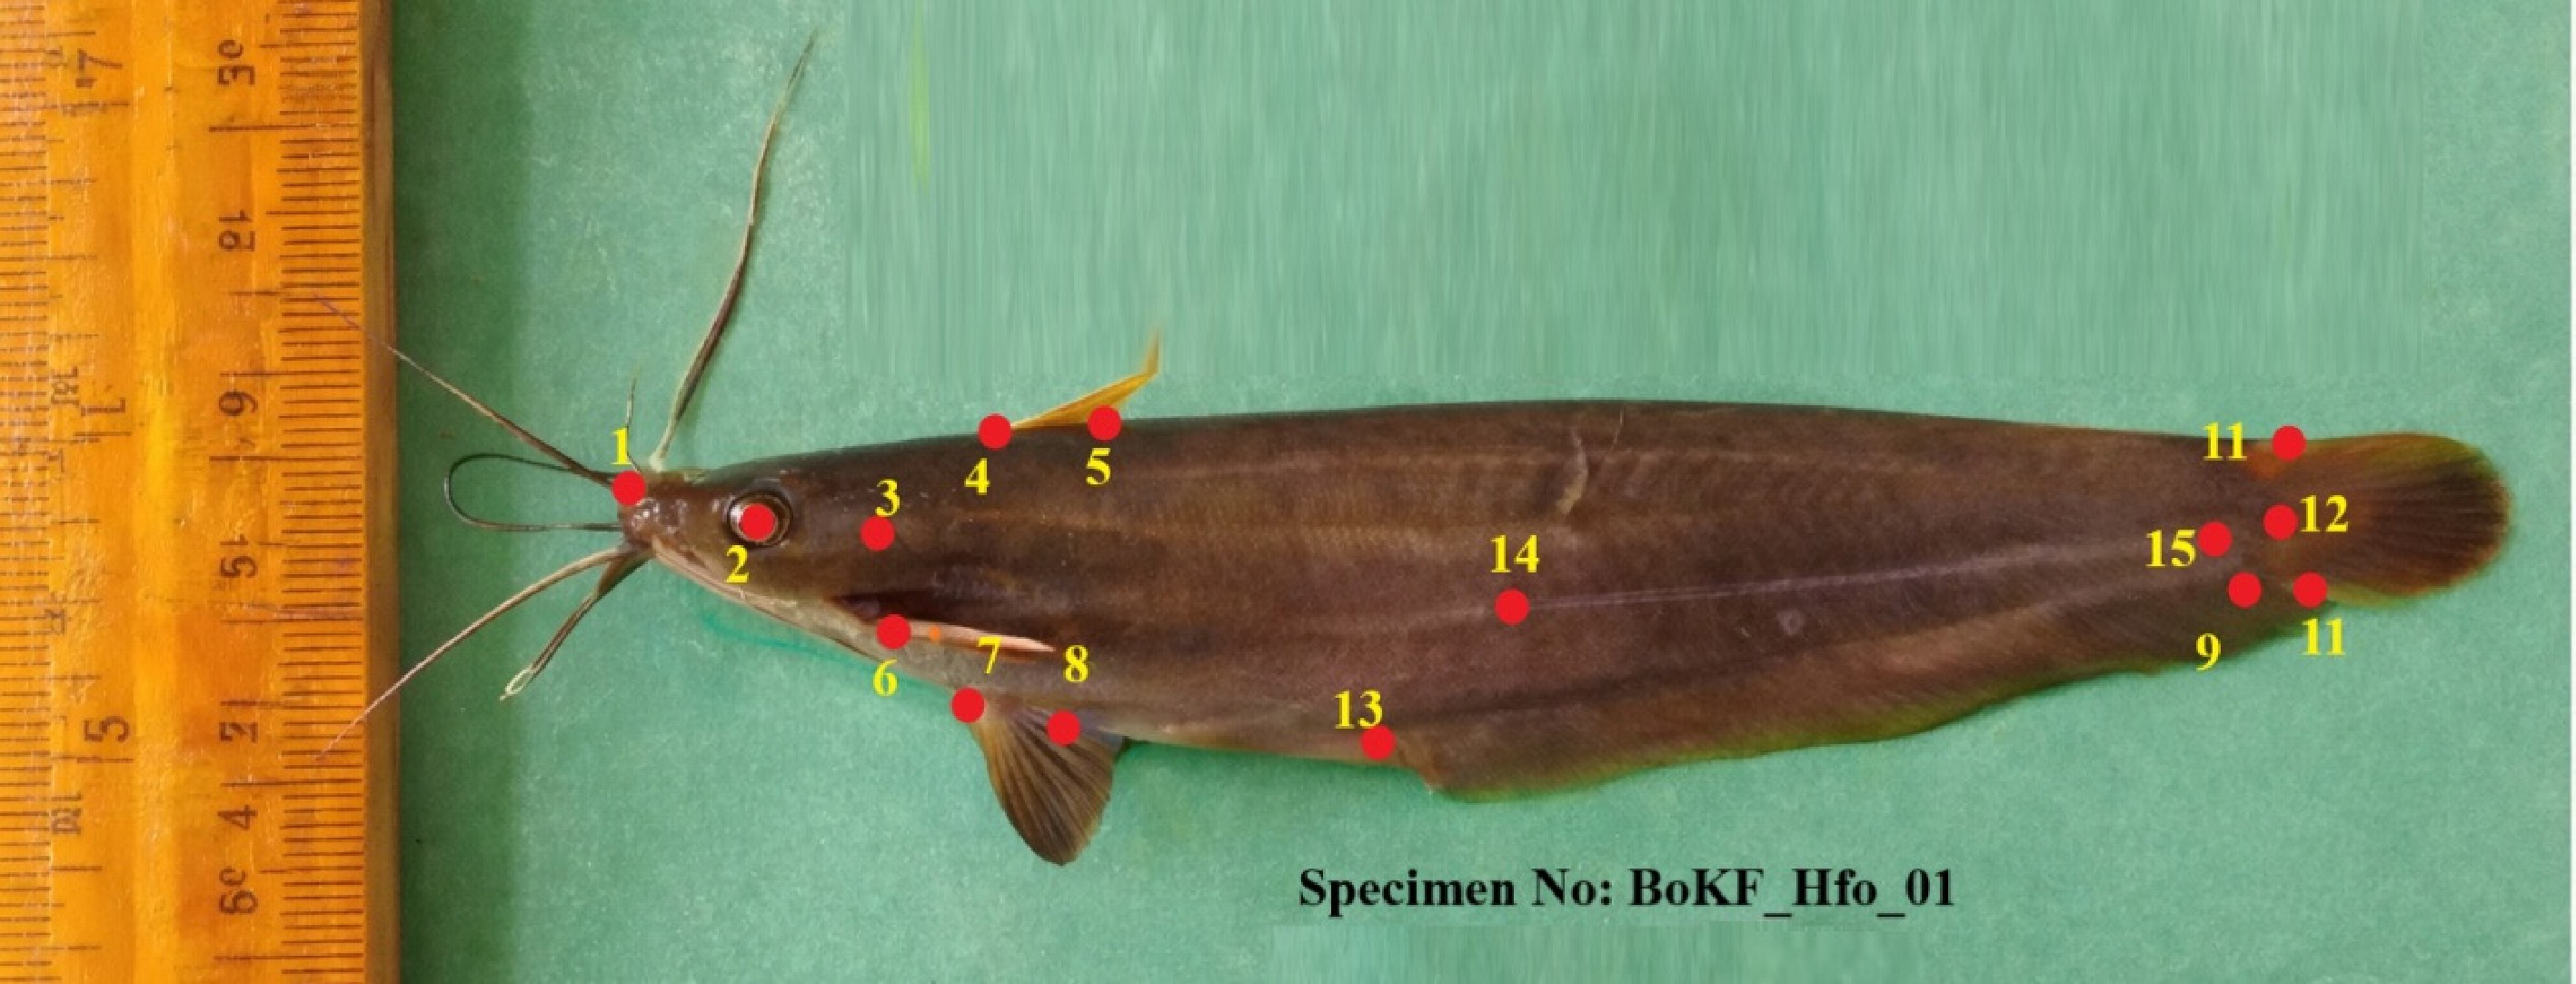
Figure 2.
Digital image acquisition and geometric morphometric landmark configuration of H. fossilis: Landmarks: 1, tip of snout (anterior-most point of upper jaw); 2, center of eye; 3, posterior margin of operculum; 4, origin of dorsal fin; 5, end of dorsal fin base; 6, origin of pectoral fin; 7, origin of pelvic fin; 8, origin of anal fin; 9, end of anal fin base; 10, dorsal insertion of caudal fin; 11, ventral insertion of caudal fin; 12, center of caudal fin (hypural plate tip); 13, point above anus between pelvic and anal fins; 14, mid-body point along lateral line; 15, posterior termination of lateral line or posterior belly margin.
Data preprocessing and size standardization
-
Generalized Procrustes Analysis (GPA) was applied to remove non-shape variation associated with differences in size, position, and orientation among specimens. Centroid size was calculated for each individual as a measure of overall body size. To account for potential allometric effects, Procrustes shape coordinates were regressed against centroid size using multivariate regression. Residuals from this regression were extracted as size-adjusted shape variables for subsequent analyses. GPA and allometric correction were performed using MorphoJ and tpsRelw.
Multivariate shape analysis
Relative warp analysis (RWA)
-
RWA, analogous to principal component analysis, was used to summarize major axes of shape variation among populations. RWA scores were used to visualize morphological dispersion and identify shape gradients.
Canonical variate analysis (CVA)
-
CVA was performed to assess and visualize shape differences between predefined populations. Deformation grids were generated to illustrate the variation in body shapes across groups.
Mahalanobis and procrustes distances
-
Pairwise mahalanobis and procrustes distances were calculated to quantify morphological divergence between populations. Statistical significance of distance values was assessed using permutation tests with 1,000 iterations.
Discriminant function analysis (DFA)
-
DFA was applied to classify individuals into their original populations based on shape variables. A leave-one-out cross-validation procedure was used to prevent overfitting and evaluate the predictive accuracy of the classification model.
Statistical analysis
-
Statistical analyses were performed using multiple software platforms to ensure robust evaluation of morphometric and size-related variation. PAST version 5.2.2 was used for GPA, CVA, DFA, and calculation of mahalanobis and procrustes distances. The software also performed descriptive statistics, multivariate analysis of variance (MANOVA), and permutation-based significance testing (1,000 permutations) to minimize Type I errors. SPSS version 25.0 was used for correlation, regression, and analysis of variance (ANOVA) on morphometric measurements and size variables to assess population-level differences. Statistical significance was set at p < 0.05, unless otherwise indicated.
-
One-way ANOVA of centroid size revealed no significant differences in overall body size among populations (F = 2.83, df = 3,110, p = 0.082), indicating that the observed morphological variation primarily reflects shape differences rather than size effects.
Within-population morphological variation
-
The coefficient of variation (CV) analysis revealed pronounced differences in within-population morphological variability across the 15 homologous landmarks (Fig. 3a, b). The CV heatmap (Fig. 3a) indicated elevated variability at several head- and trunk-associated landmarks (notably L1, L8, L12, and L13) in the Garbheswari River population, whereas all farmed stocks exhibited comparatively stable landmark expressions across most measurements. Population-level contrasts were further supported by the CV distribution boxplot (Fig. 3b), which showed consistently higher dispersion in riverine individuals compared with the three farm populations. Farmed stocks from Bogura (Kahalu), Dinajpur (Sadar), and Mymensingh (Muktagacha) displayed narrower CV ranges, reflecting morphometric homogeneity likely associated with controlled rearing conditions. In contrast, the broader variability observed in wild individuals suggests greater environmental heterogeneity and phenotypic plasticity. Overall, these CV-based visualizations underscore strong differences in developmental and environmental influences shaping morphometric variability among populations and provide an important baseline for subsequent multivariate analyses.
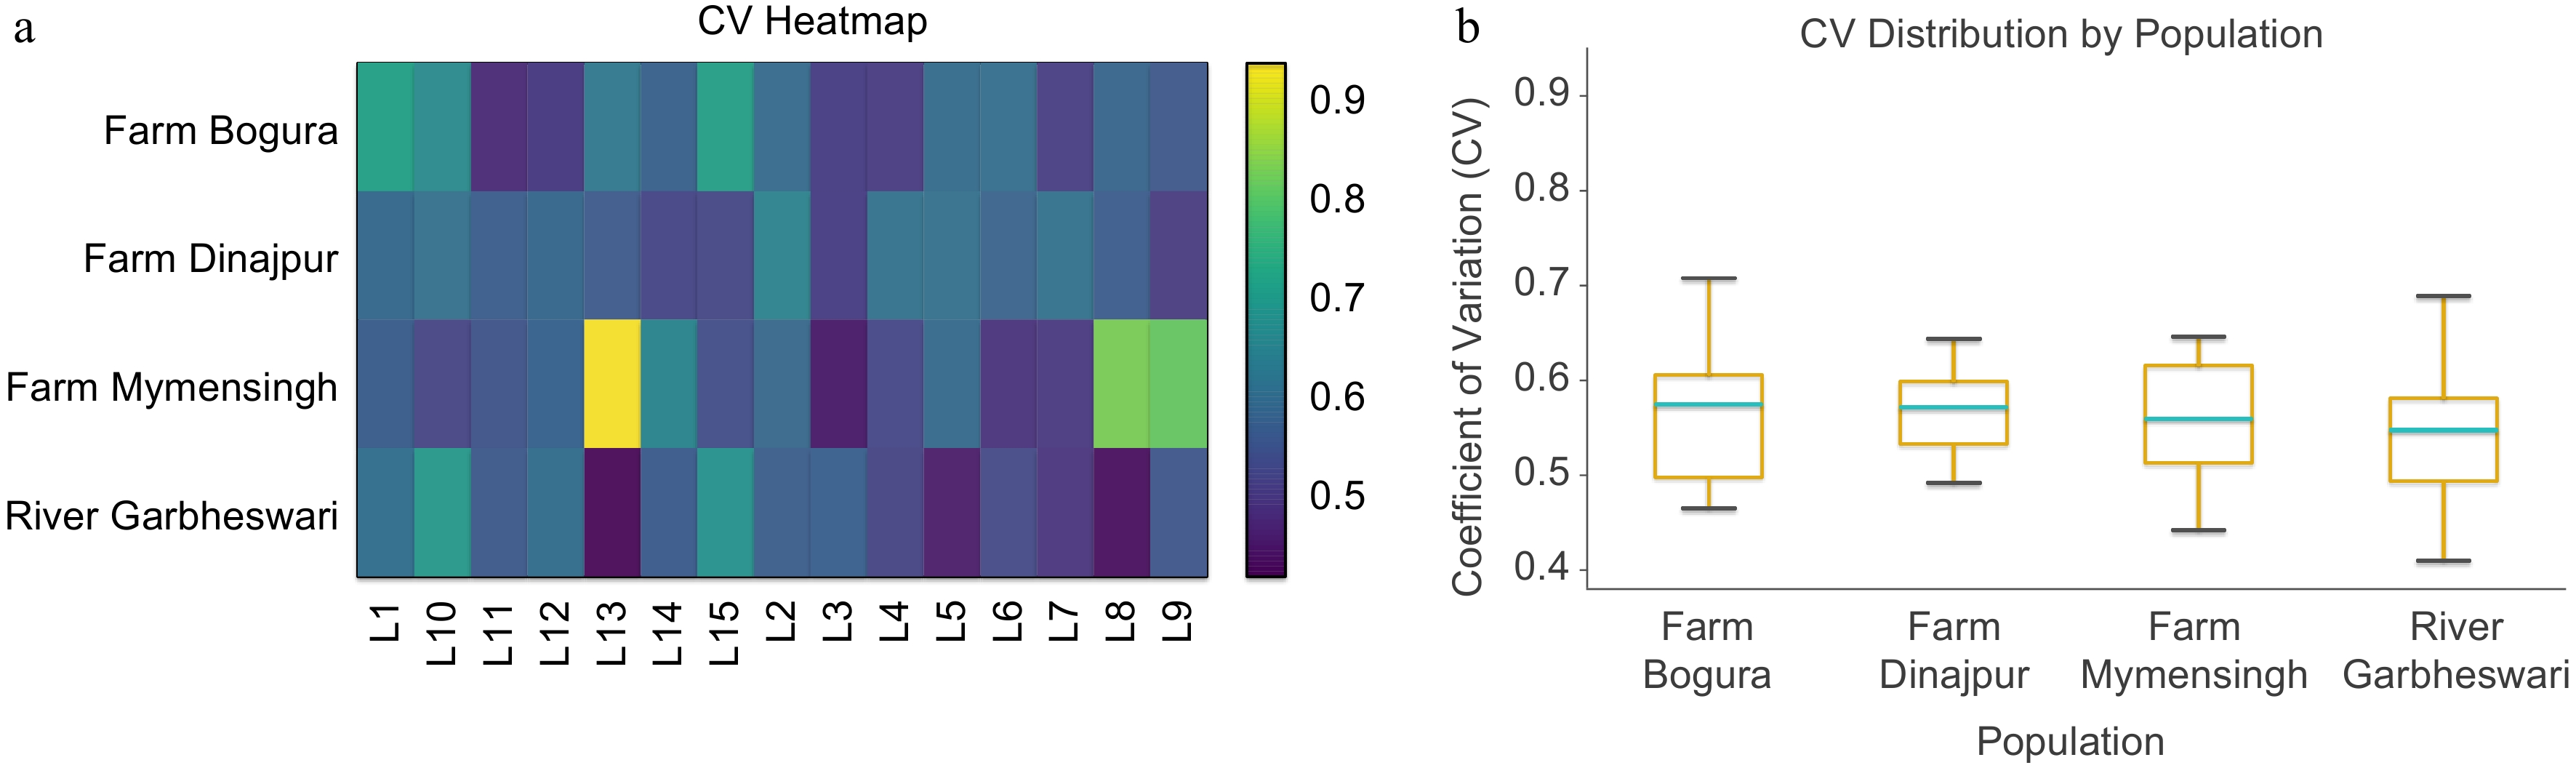
Figure 3.
(a) Heatmap, and (b) boxplot showing CV-based morphological variability in 15 landmarks among four H. fossilis populations. Both visualizations reveal clear population-level differences, with river fish exhibiting greater trait variation than farmed stocks.
Shape differentiation (PCA, multivariate, pairwise patterns, MDS, and UPGMA)
-
Principal component analysis of Relative Warp scores resolved clear shape differentiation among the four H. fossilis populations (Fig. 4). The first two principal components explained 94.31% of total shape variation, with PC1 contributing 88.18% and PC2 6.13% (Table 2). Variation along PC1 reflected differences in body depth, head profile, and fin-base position, whereas PC2 captured variation in caudal peduncle tapering, opercular width, and anal-fin base length.
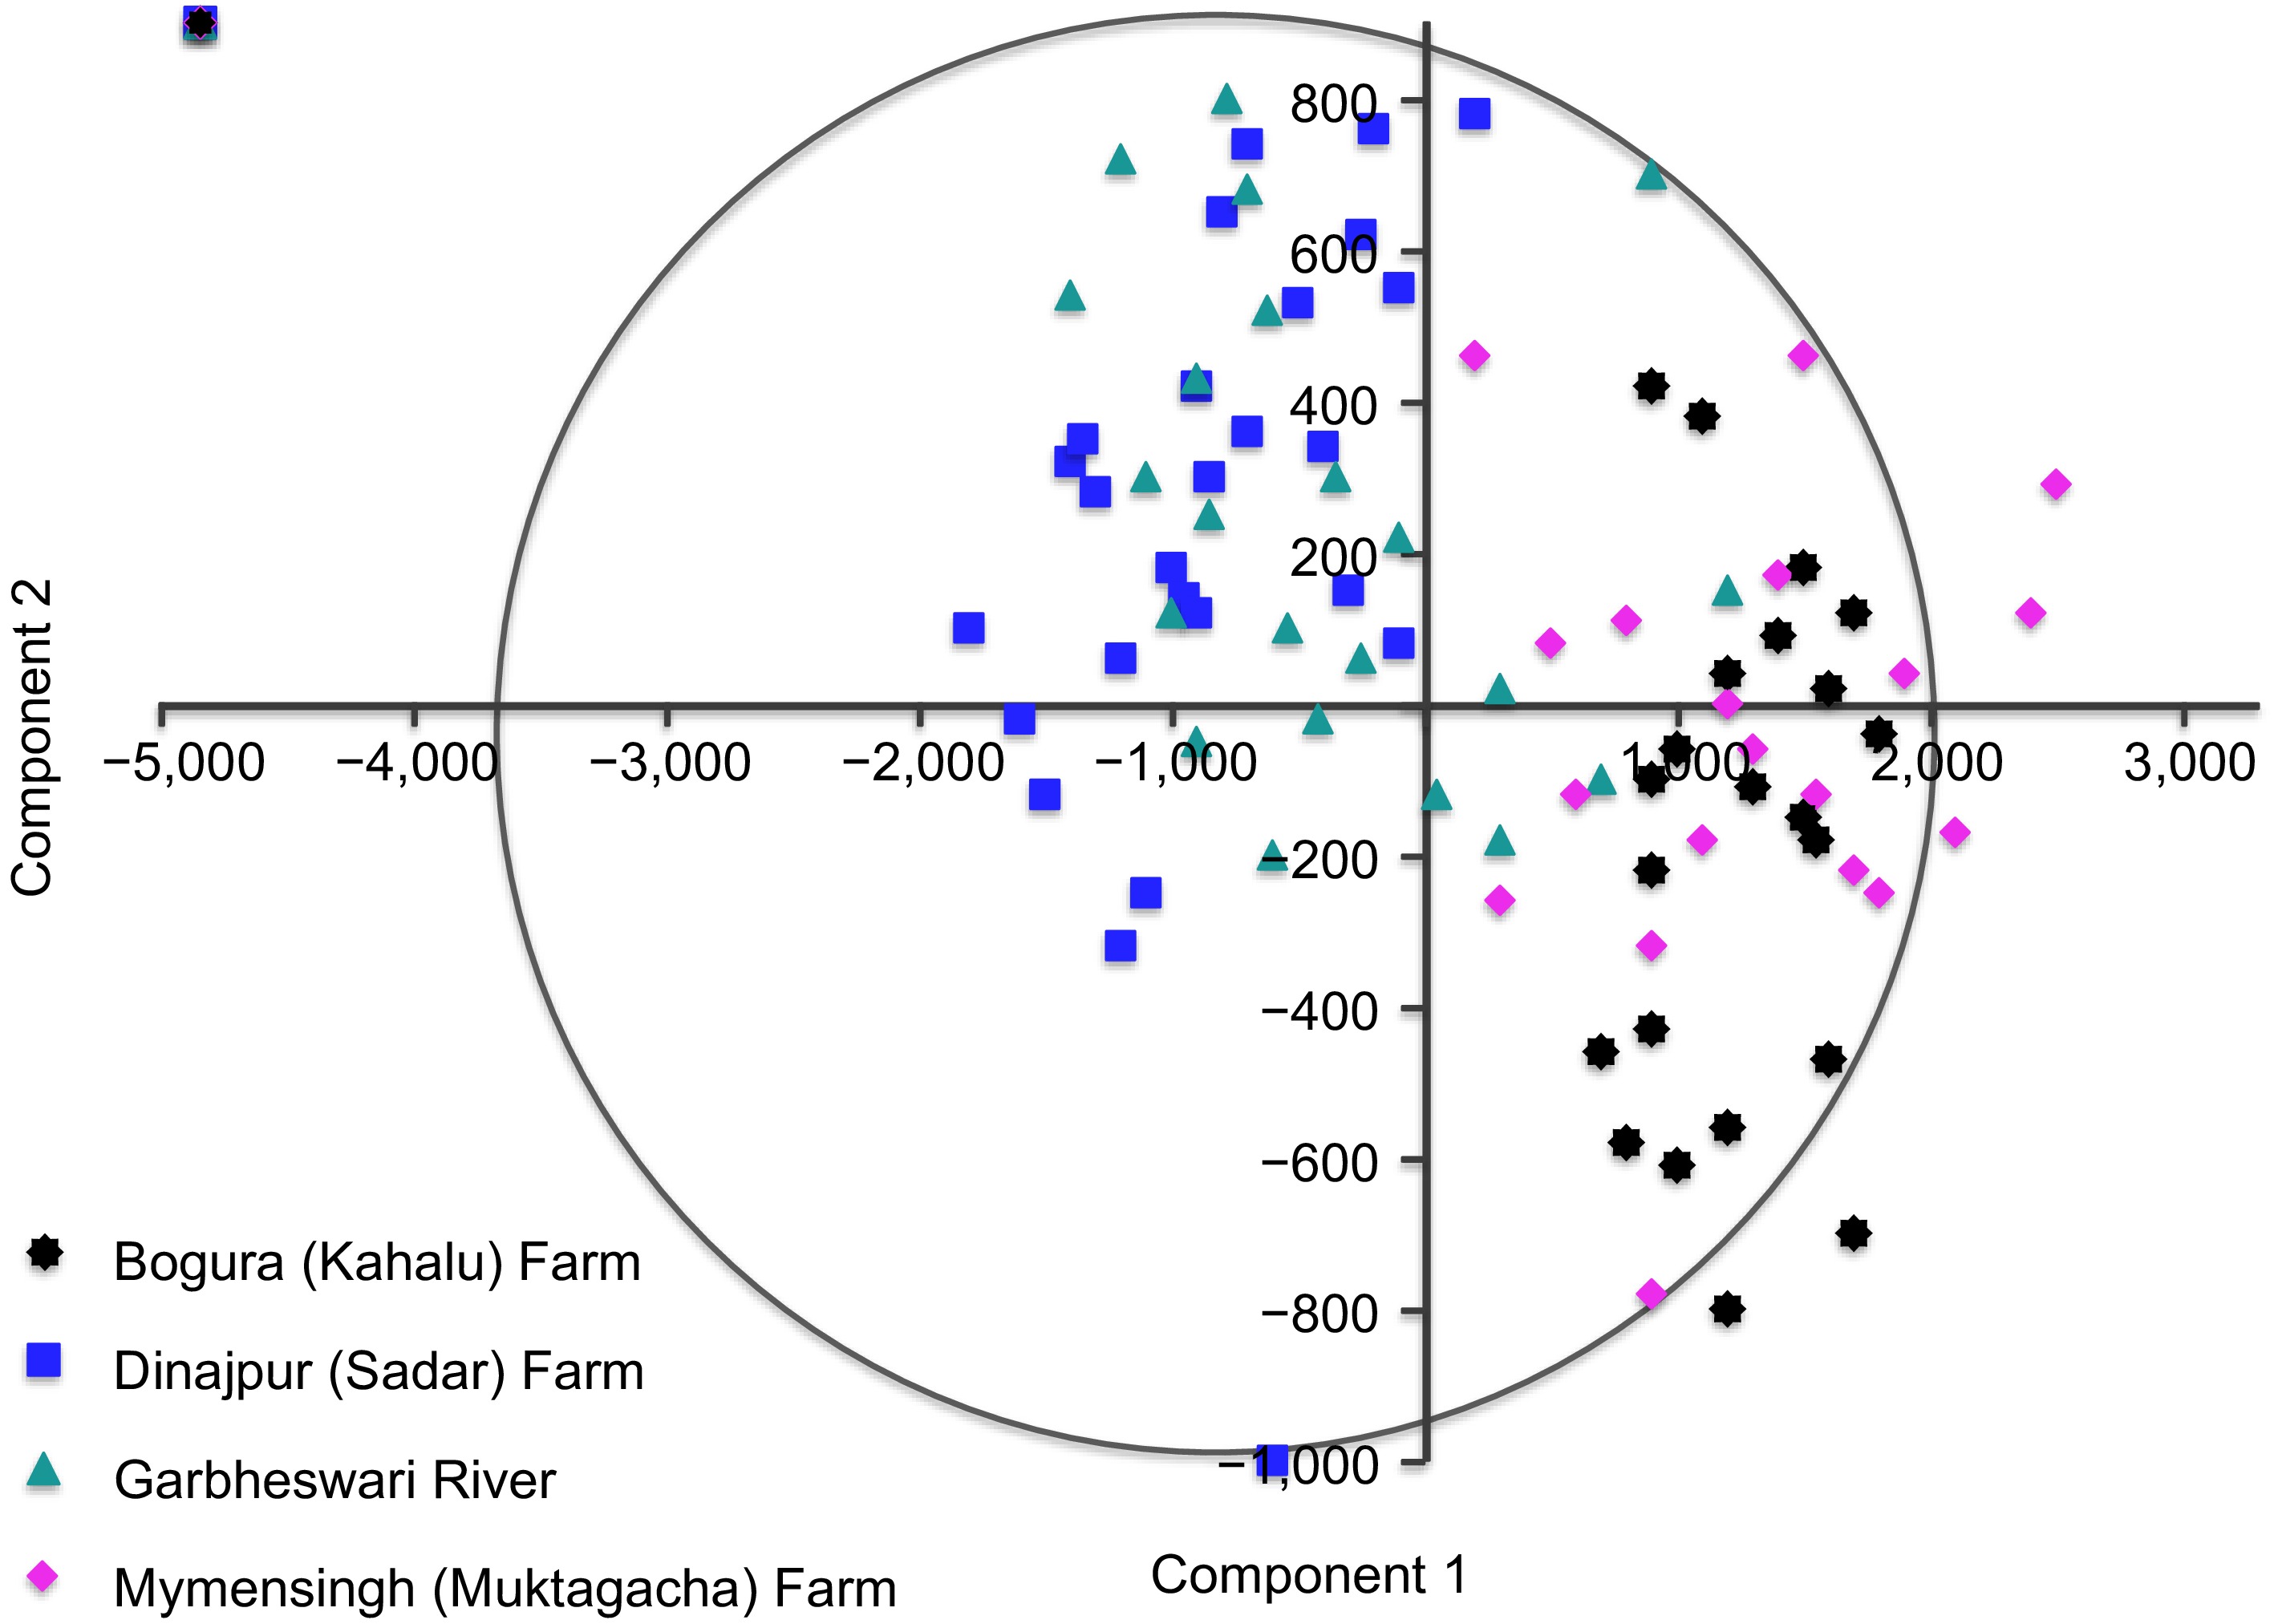
Figure 4.
Principal Component Analysis (PCA) scatter plot of relative warp scores showing morphological variation and differentiation among four Heteropneustes fossilis stocks in Bangladesh.
Table 2. The eigenvalue and percentage variation of four stocks of H. fossilis based on relative wrap analyses.
PC No. Eigenvalue % Variance PC No. Eigenvalue % Variance 1 2.07E+06 88.181 16 180.234 0.007673 2 144,057 6.1326 17 153.718 0.006544 3 79,461.1 3.3827 18 83.192 0.003542 4 34,966.6 1.4885 19 79.7855 0.003397 5 8,666.58 0.36894 20 61.684 0.002626 6 3,730.02 0.15879 21 55.4008 0.002358 7 1,516.44 0.064556 22 53.8798 0.002294 8 1,163.35 0.049525 23 39.1666 0.001667 9 946.928 0.040311 24 34.6372 0.001475 10 612.178 0.026061 25 25.2069 0.001073 11 469.194 0.019974 26 20.2494 0.000862 12 403.822 0.017191 27 18.6412 0.000794 13 300.099 0.012775 28 10.2491 0.000436 14 272.858 0.011616 29 5.17376 0.00022 15 250.168 0.01065 30 4.77664 0.000203 The PCA scatterplot showed distinct population clustering. Bogura (Kahalu) Farm specimens were widely distributed along positive PC1 values, indicating high within-population variation, whereas Dinajpur (Sadar) Farm individuals formed a compact cluster at negative PC1 values. The Garbheswari River population occupied an intermediate position along both axes, while Mymensingh (Muktagacha) farm specimens showed moderate dispersion across PC1 and PC2. Overlap between riverine and farmed populations was limited, indicating consistent shape divergence associated with population origin. Pairwise PCA comparisons showed comparable separation patterns, supporting the robustness of the overall ordination.
Mahalanobis distance analysis revealed clear shape-based divergence among all four H. fossilis populations (Table 3). The largest morphological distance was observed between Bogura (Kahalu) and Dinajpur (Sadar) farms (2.48), followed closely by Bogura (Kahalu) and the Garbheswari River population (2.44). The smallest distance occurred between Bogura (Kahalu) and Mymensingh (Muktagacha) farms (2.01), indicating relatively greater similarity between these two hatchery stocks. Distances among the remaining population pairs ranged from 2.33 to 2.35, reflecting moderate to high divergence. All pairwise distances exceeded 2.0, demonstrating that, despite some affinities among farmed populations, all populations are morphometrically well differentiated. These patterns suggest that both environmental conditions and potential genetic structuring contribute to the observed shape divergence.
Table 3. Pairwise mahalanobis distances between H. fossilis populations.
Population pair Pop1 Pop2 Mahalanobis 1 Farm Bogura (Kahalu) Farm Dinajpur 2.476834 2 Farm Bogura (Kahalu) River Garbheswari 2.442656 3 Farm Bogura (Kahalu) Farm Mymensingh 2.005870 4 Farm Dinajpur (Sadar) River Garbheswari 2.328262 5 Farm Dinajpur (Sadar) Farm Mymensingh 2.347969 6 River Garbheswari Farm Mymensingh 2.333033 The multidimensional scaling (MDS) plot based on Mahalanobis distances effectively visualized shape relationships among populations (Fig. 5). Bogura (Kahalu) farm occupied a distinct position in ordination space, confirming its pronounced morphological divergence. Dinajpur (Sadar), Mymensingh (Muktagacha), and Garbheswari River populations showed partial proximity but remained clearly separated, indicating moderate similarity coupled with consistent differentiation. This ordination pattern closely mirrored the results of DFA and PCA, reinforcing the robustness of population structuring and supporting the interpretation of morphometric divergence among hatchery and wild populations.
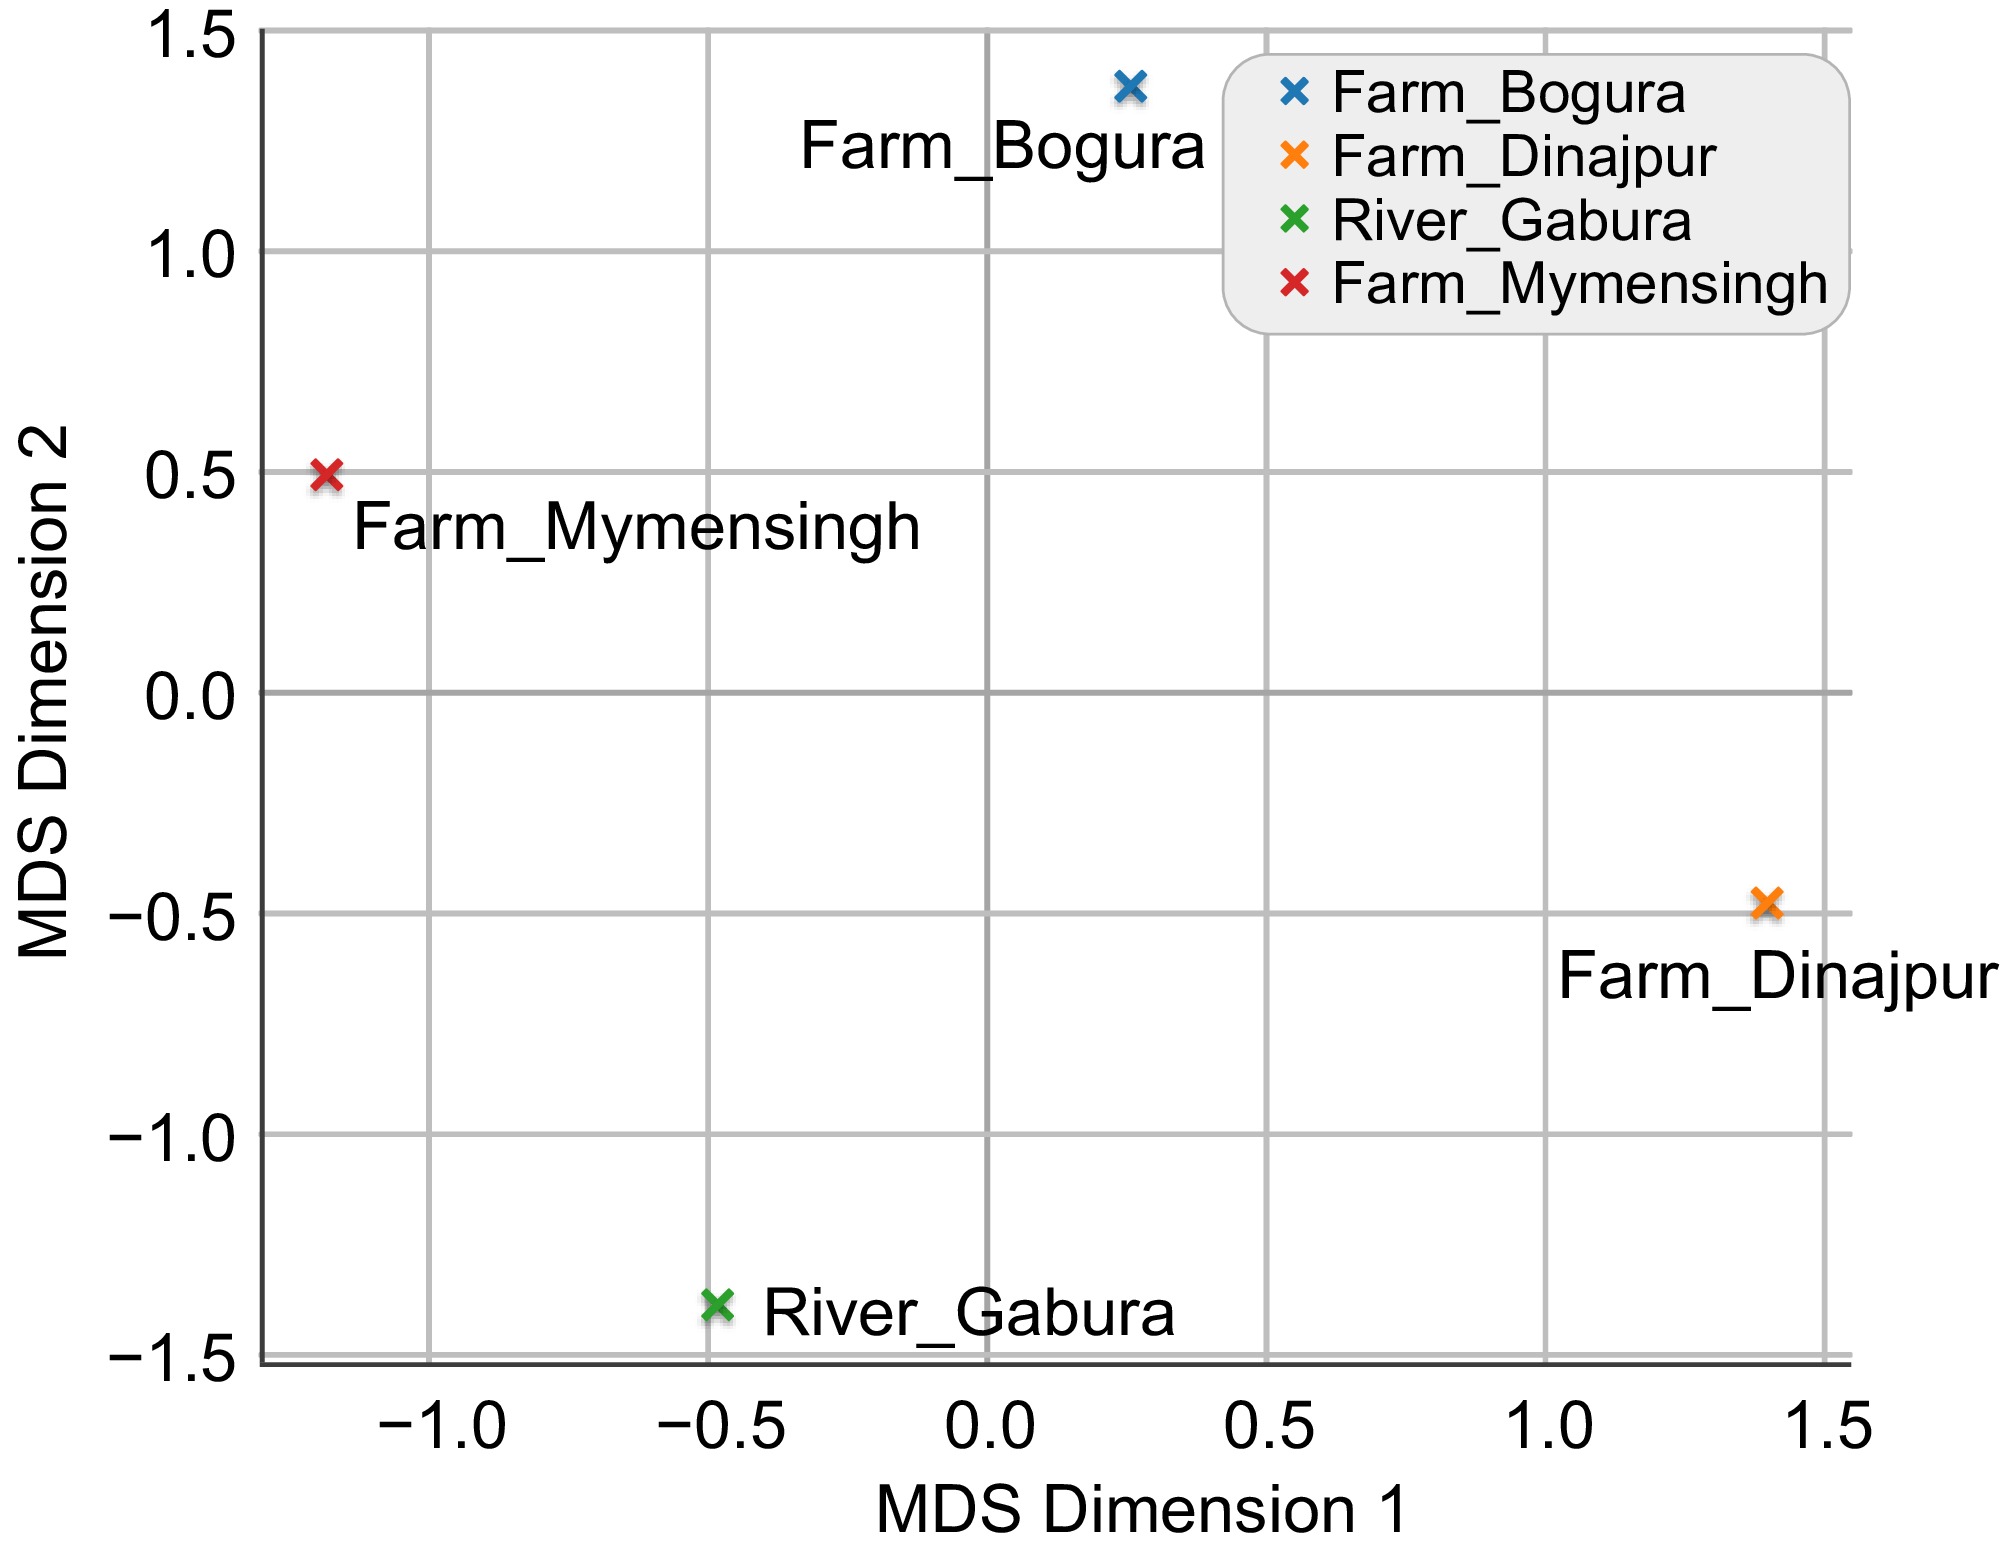
Figure 5.
Multidimensional scaling (MDS) plot of H. fossilis populations based on mahalanobis distances.
The UPGMA dendrogram based on Procrustes shape distances revealed clear hierarchical structuring among populations (Fig. 6). Two major clusters were identified. Cluster I comprised the Garbheswari River and Dinajpur (Sadar) Farm populations, with Dinajpur (Sadar) forming compact sub-clusters and river specimens forming a closely associated but distinct sub-lineage. Cluster II included Bogura (Kahalu) and Mymensingh (Muktagacha) farms, with Bogura (Kahalu) forming tight, well-defined subclusters and Mymensingh (Muktagacha) clustering adjacently while remaining clearly separate.
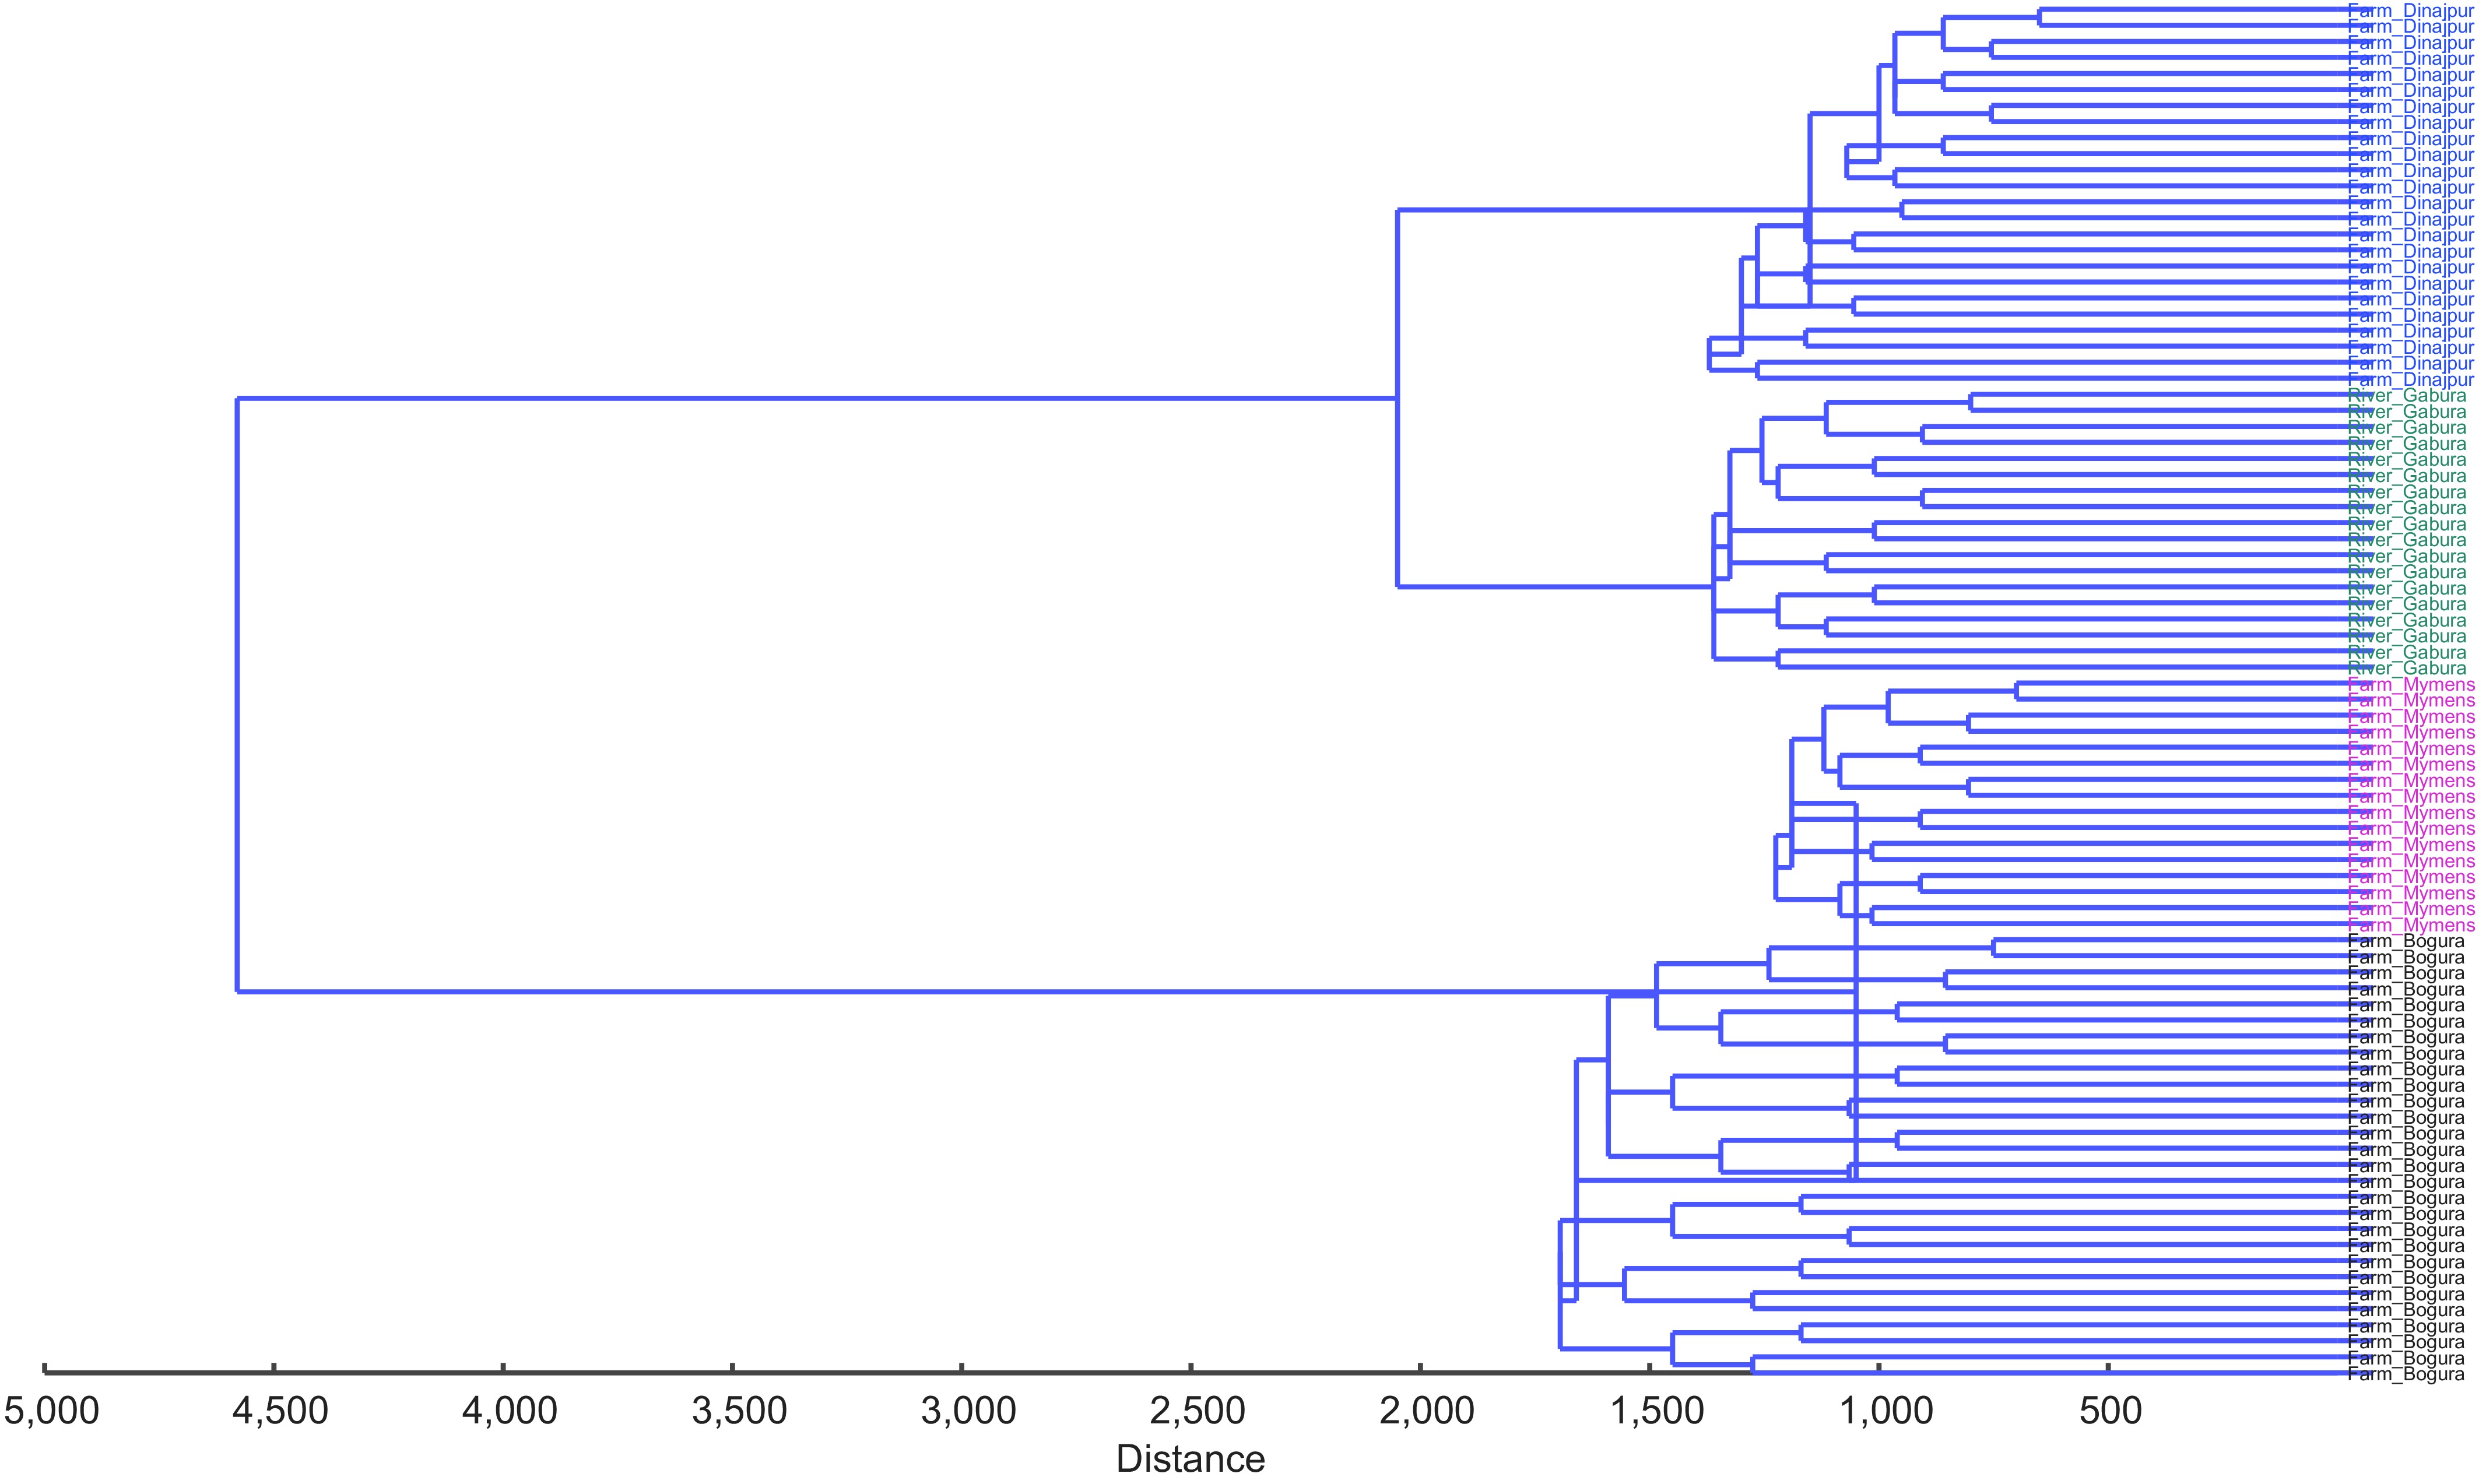
Figure 6.
The UPGMA dendogram clustering three H. fossilis populations collected from the Farm Bogura (Kahalu) (black) Farm Dinajpur (Sadar) (blue), Farm-Mymensingh (Muktagacha) (pink) and River (green).
The closest morphometric affinity was observed between Dinajpur (Sadar) farm and the Garbheswari River population, followed by moderate separation between Mymensingh (Muktagacha) and Bogura (Kahalu) farms. The greatest divergence occurred between the River–Dinajpur (Sadar) and Bogura (Kahalu)–Mymensingh (Muktagacha) clusters. Overall, Bogura (Kahalu) farm emerged as the most morphometrically distinct population, consistent with the results of PCA, CVA, and MDS analyses.
Discriminant Function Analysis (DFA) and Canonical Discriminant Analysis (CDA)
-
The DFA scatter plot revealed clear morphological separation among populations with minimal overlap (Fig. 7). Along the first canonical variate (CV1), Bogura (Kahalu) and Mymensingh (Muktagacha) farm populations clustered closely, indicating greater shape similarity, whereas Dinajpur (Sadar) farm occupied an intermediate position. The Garbheswari River population was distinctly separated, particularly along CV2, highlighting the presence of unique wild morphotypes. Canonical variate analysis revealed differentiation among the studied populations of H. fossilis (Fig. 7). Although the magnitude of deformation along the CV1 axis appears relatively small, canonical variate analysis detected statistically meaningful differences in body shape among populations when evaluated in a multivariate framework. The deformation pattern along CV1 represents a common direction of shape variation; however, the relative displacement of populations in canonical morphospace indicates measurable morphometric differentiation. The wild Garbheswari River population occupies a relatively distinct position compared with the cultured stocks. This pattern is consistent with the PCA and DFA results, which similarly revealed separation of the Garbheswari River population from the cultured stocks
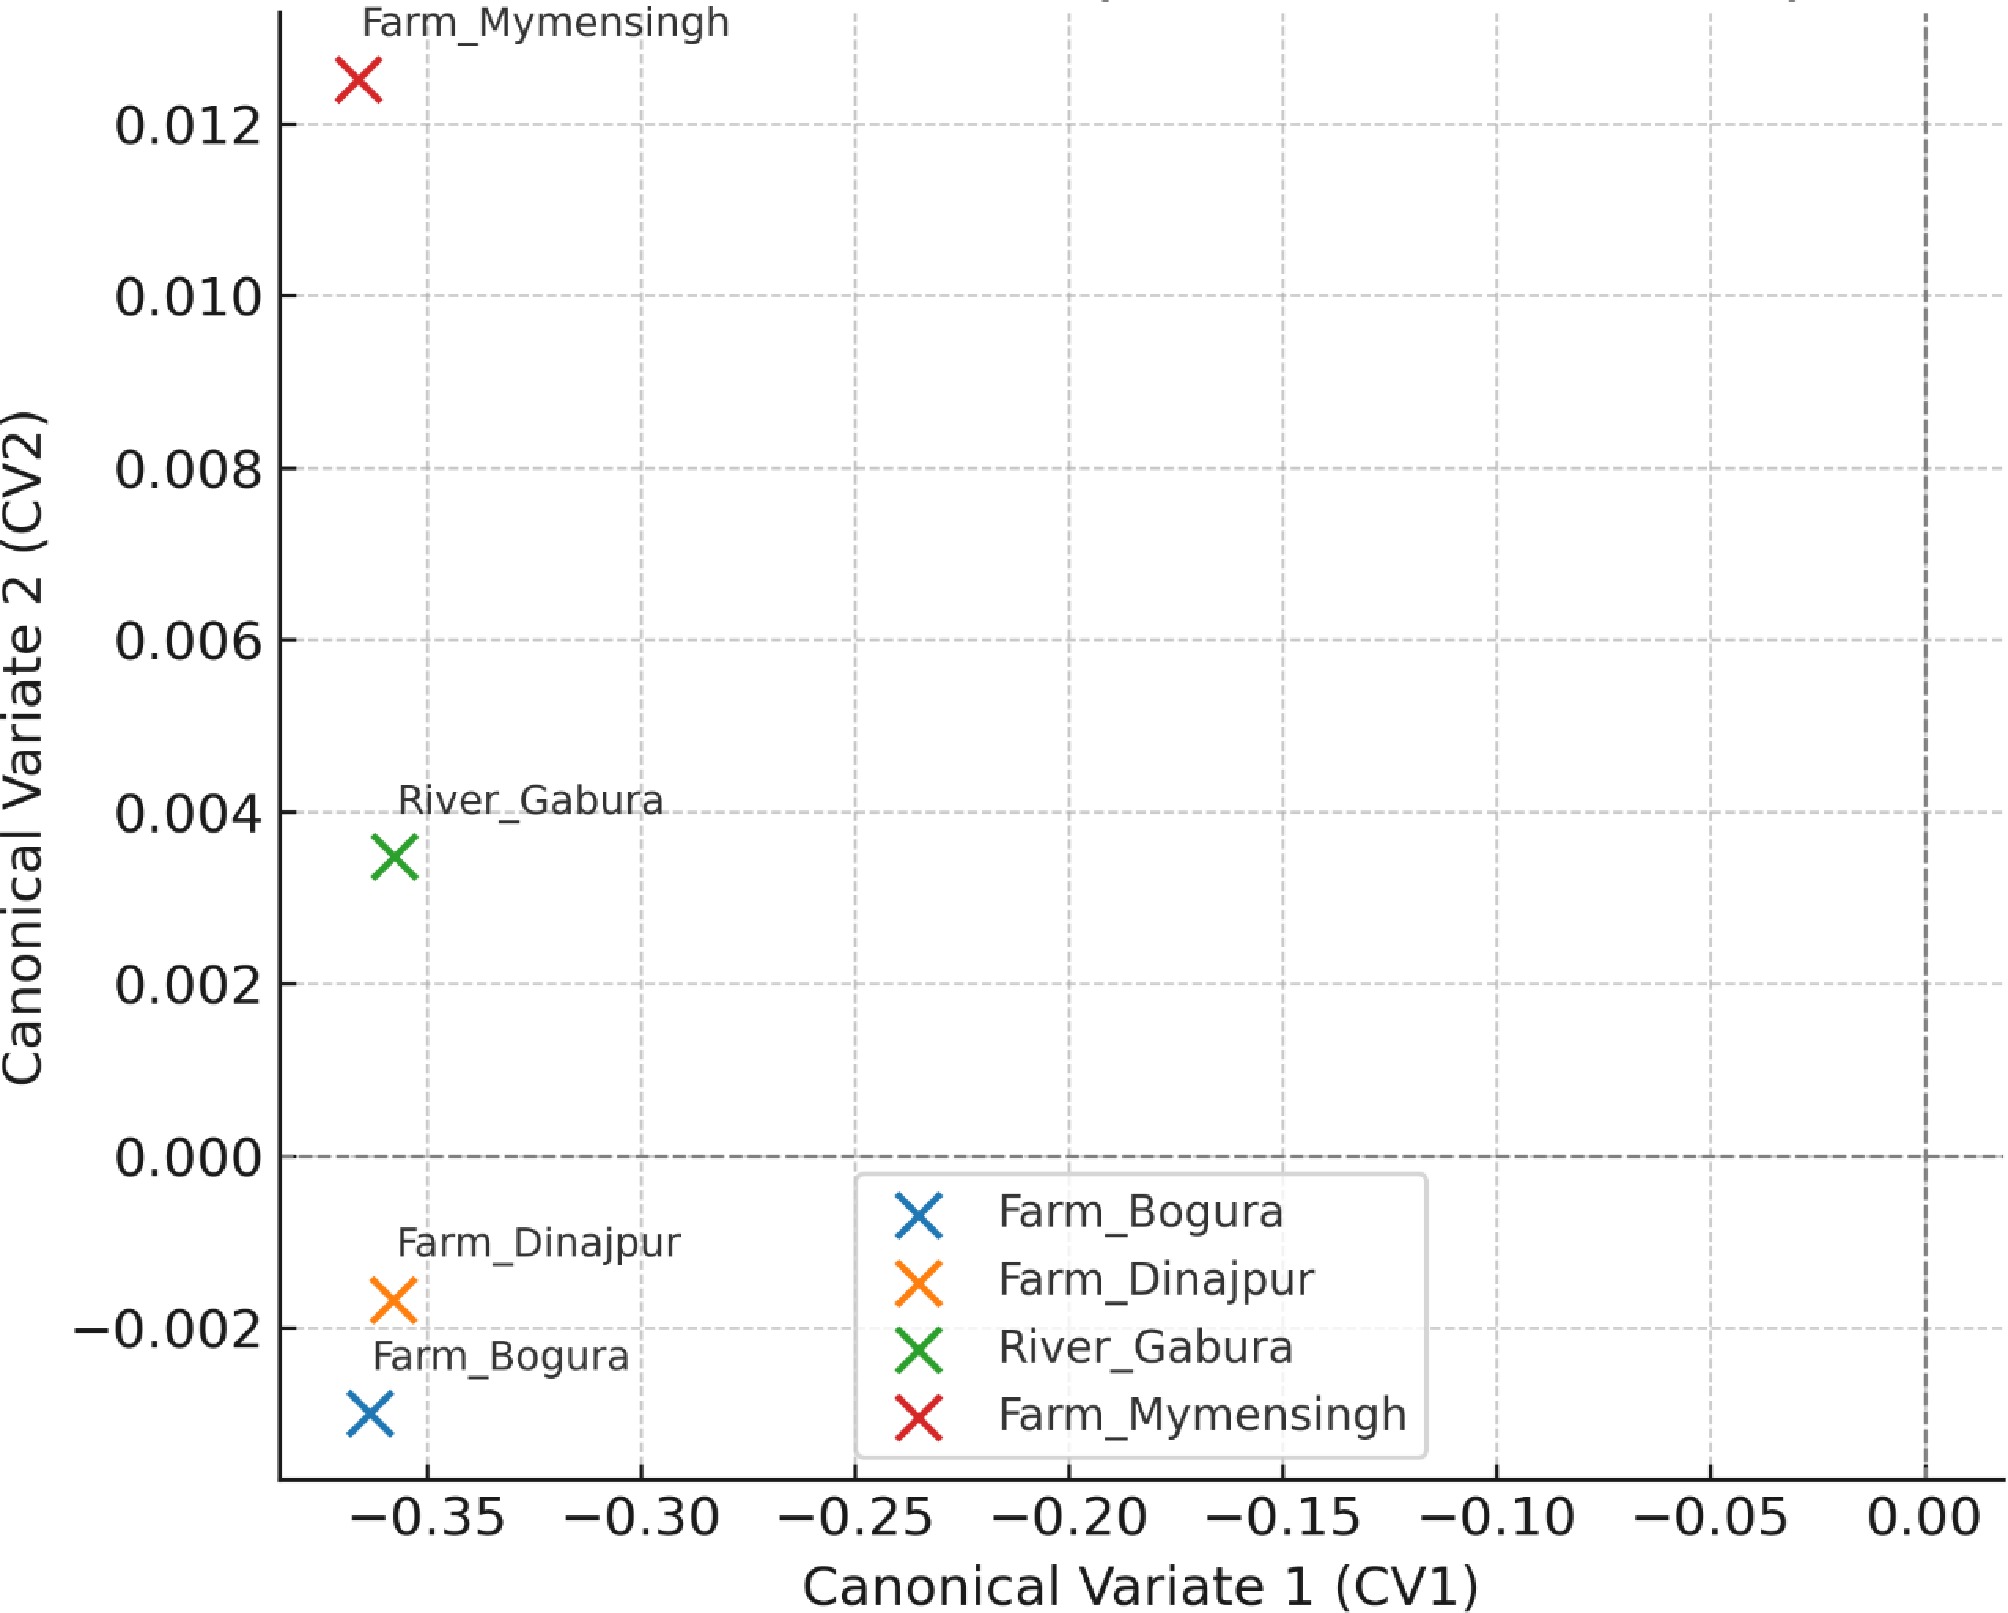
Figure 7.
Discriminant Function Analysis (DFA) scatter plot of H. fossilis populations based on shape variables.
The DFA classification matrix (Table 4) demonstrated high assignment accuracy across populations. The Garbheswari River population exhibited the highest correct classification rate (96.7%), followed by Dinajpur (Sadar) farm (86.7%) and Bogura (Kahalu) farm (80.0%). Mymensingh (Muktagacha) farm showed the lowest classification accuracy (70.8%), with most misclassifications occurring toward Bogura (Kahalu).
Table 4. Classification matrix from Discriminant Function Analysis (DFA) for H. fossilis populations.
Populations Farm Bogura Farm Dinajpur River Garbheswari Farm Mymensingh Farm Bogura (Kahalu) 24 0 0 6 Farm Dinajpur (Sadar) 0 26 3 1 Farm Mymensingh (Muktagacha) 6 0 1 17 River Garbheswari 0 0 29 1 Canonical discriminant analysis generated three canonical functions corresponding to the four H. fossilis populations (Table 5). The first canonical function (Can1) exhibited a high eigenvalue (2.455) and strong canonical correlation (r = 0.844), accounting for the majority of interpopulation discrimination. The second canonical function (Can2) showed moderate discriminatory power (eigenvalue = 0.261; r = 0.455), whereas the third canonical function (Can3) contributed weak additional separation (eigenvalue = 0.090; r = 0.287). These results indicate that population differentiation is largely driven by a single dominant canonical axis.
Table 5. Canonical functions derived from canonical discriminant analysis of four H. fossilis populations.
Canonical function Eigenvalue Canonical correlation (r) Interpretation Can1 2.455 0.844 Very strong group separation Can2 0.261 0.455 Moderate secondary separation Can3 0.090 0.287 Weak additional separation Discriminant function analysis indicated that most of the morphological differentiation among the populations was explained by the first canonical variate (CV1), which accounted for the largest proportion of between-group variance (Table 5). Although the deformation grids in Fig. 7 show relatively subtle shape changes along the CV1 axis, this axis represents the primary direction of population discrimination in the multivariate morphospace. The second canonical variate (CV2) contributes comparatively less to overall discrimination but captures additional minor variations in body shape among populations. Therefore, the observed differentiation of the Garbheswari River population from the cultured stocks reflects the combined effects of variation along both canonical axes rather than changes along CV2 alone.
Analysis of standardized canonical coefficient values (Table 6) revealed that Can1 was driven primarily by PC2 (0.74), PC4 (0.69), and PC6 (0.65), indicating that these principal components dominate the primary pattern of shape divergence among populations. Can2 was structured mainly by PC3 (0.62) and PC7 (0.57), whereas Can3 showed its strongest contributions from PC5 (0.58) and PC6 (0.51). The remaining principal components exhibited consistently low coefficients, suggesting minimal influence on population discrimination.
Table 6. Standardized canonical coefficients showing the contributions of principal component scores (PC1–PC10) to the three canonical discriminant functions (Can1–Can3) in the analysis of four H. fossilis populations.
Principal component Can1 Can2 Can3 PC1 0.21 0.08 0.05 PC2 0.74 0.11 0.09 PC3 0.18 0.62 0.14 PC4 0.69 0.16 0.12 PC5 0.12 0.19 0.58 PC6 0.65 0.21 0.51 PC7 0.14 0.57 0.17 PC8 0.09 0.13 0.11 PC9 0.07 0.09 0.08 PC10 0.05 0.06 0.04 Values represent standardized canonical coefficients; higher absolute values (bold) indicate stronger contributions of principal components to the respective canonical functions. The standardized canonical coefficients presented in Table 6 indicate the relative contribution of the principal component scores to the canonical discriminant functions. Although PC1 explained the largest proportion of total shape variance in the PCA (Table 2), it contributed only moderately to the discrimination among populations in the canonical analysis. Instead, PC2 and PC4 showed stronger loadings on the first canonical function (Can1), indicating that the morphological differences separating populations are primarily associated with shape components represented by these principal components. This result reflects the fact that PCA maximizes overall variance in the dataset, whereas canonical discriminant analysis identifies combinations of variables that maximize separation among predefined groups.
Summary of key patterns
-
Morphometric divergence in H. fossilis was low-dimensional but functionally structured. Riverine fish exhibited higher variability, whereas farmed stocks were more homogeneous. The Bogura (Kahalu) farm was the most morphometrically distinct population, while Dinajpur (Sadar) and Mymensingh (Muktagacha) farms showed closer affinity. Multivariate and discriminant analyses consistently confirmed robust separation between wild and hatchery-reared populations.
-
This study applied landmark-based geometric morphometrics to assess body shape variation among one wild (Garbheswari River) and three farmed (Bogura, Dinajpur, and Mymensingh) populations of H. fossilis in Bangladesh. The combination of univariate (CV analysis) and multivariate approaches (PCA, Mahalanobis distances, MDS, UPGMA clustering, DFA, and canonical discriminant analysis) consistently revealed clear population-level morphometric divergence driven by environmental heterogeneity, domestication, and potential genetic structuring.
Within-population variation was highest in the Garbheswari River stock, particularly at head and trunk landmarks linked to feeding, respiration, and locomotion[28,29]. Elevated CV values in riverine fish likely reflect phenotypic plasticity in response to variable hydrological conditions, diverse prey, and habitat complexity. In contrast, farmed stocks exhibited reduced variability, reflecting morphometric homogenization under controlled hatchery conditions, consistent with previous observations in freshwater fishes[30,31].
PCA captured major axes of shape variation, with PC1 reflecting body depth, head curvature, and fin-base placement, and PC2 describing caudal peduncle tapering and opercular width. Populations clustered distinctly along these axes, with limited overlap between wild and farmed fish, indicating strong influence of both rearing environment and geographic origin on body shape[32,33]. Pairwise analyses confirmed that Bogura (Kahalu) farm was the most divergent hatchery stock, suggesting local domestication effects, farm-specific broodstock histories, or selective pressures. River–farm contrasts consistently showed clear separation, highlighting divergence between natural and artificial environments.
Mahalanobis distances and MDS ordination quantitatively and visually supported these patterns. Distances exceeding 2.0 among all population pairs indicate robust multivariate separation, with Bogura (Kahalu) exhibiting the strongest divergence, and Dinajpur (Sadar) and Mymensingh (Muktagacha) showing closer affinity. UPGMA clustering further resolved two primary lineages: one containing Garbheswari River and Dinajpur (Sadar) stocks and another comprising Bogura (Kahalu) and Mymensingh (Muktagacha), suggesting shared ancestry or similar selective pressures among river-adjacent stocks, and a unique management history for Bogura (Kahalu) fish[34].
DFA demonstrated high classification accuracy, particularly for the riverine population (96.7%), confirming the distinctiveness of wild morphotypes. Misclassifications among some hatchery stocks, notably Mymensingh (Muktagacha), reflect partial convergence due to overlapping management practices. Canonical discriminant analysis indicated that most inter-population divergence is explained by a limited number of dominant shape axes, with Can1 driven by PC2, PC4, and PC6, consistent with modular evolution of functionally important body regions[35,36].
Overall, the concordance among CV, PCA, DFA, MDS, UPGMA, and canonical analyses demonstrates that H. fossilis shape variation reflects a combination of phenotypic plasticity, domestication, geographic separation, and potential genetic structuring. Wild populations maintain greater morphological variability, whereas farmed stocks show varying degrees of homogenization and divergence depending on local management. These results underscore the utility of geometric morphometrics for population discrimination and provide critical insights for broodstock management, conservation of wild morphotypes, and the sustainable development of H. fossilis aquaculture.
-
Landmark-based geometric morphometric analyses revealed clear and consistent body shape divergence between wild and farmed populations of H. fossilis in Bangladesh. Wild riverine fish exhibited higher within-population variability, reflecting greater phenotypic plasticity under natural environmental conditions, whereas farmed stocks showed varying degrees of morphometric homogenization influenced by local hatchery practices. Multivariate analyses (PCA, DFA, MDS, UPGMA, and canonical discriminant functions) consistently identified the Bogura (Kahalu) farmed population as the most distinct hatchery stock, while Dinajpur (Sadar) and Mymensingh (Muktagacha) populations were more similar. These results highlight the influence of habitat and rearing conditions on shape divergence and underscore the importance of incorporating wild morphotypes into broodstock management to maintain genetic and phenotypic diversity, thereby improving the long-term sustainability of aquaculture practices for this species. These results highlight the influence of habitat and rearing conditions on shape differentiation, and underscore the importance of incorporating wild morphotypes into broodstock management to maintain genetic and phenotypic diversity, thereby improving the long-term sustainability of aquaculture practices for this species.
The authors would like to express their sincere gratitude to the Department of Fisheries Biology and Genetics for providing laboratory and research facilities to conduct this study. The authors are also thankful to the fish farmers and local fishermen for their cooperation during sample collection from both farmed and wild populations of H. fossilis.
-
All applicable institutional and national guidelines for the care and use of animals were followed during the conduct of this study. Fish samples were collected with minimal stress and handling, and no endangered or protected species were harmed during the research. The study involved non-invasive morphometric analysis of collected specimens, and all procedures complied with ethical standards for fisheries and aquatic research. The study protocol was reviewed and approved by the Ethical Committee, Institute of Research and Training (IRT), Hajee Mohammad Danesh Science and Technology University (HSTU), Dinajpur-5200, Bangladesh. The project identification/approval number was HSTU/IRT/4361 (2), and the approval date was 30 November, 2023.
-
The authors confirm their contributions to the paper as follows: study conception and design: Parvez I, Roy P; data collection: Roy P, Noor-E-Chashmi Ara D, Preety AA, Rayhan AB, Roy K, Joty JJ, Zannat M; morphometric analysis and interpretation of results: Roy P, Preety AA, Parvez I, Noor-E-Chashmi Ara D; statistical analysis: Parvez I, Roy P; draft manuscript preparation: Roy P, Parvez I; critical revision and supervision: Noor-E-Chashmi Ara D, Parvez I. All authors reviewed the results and approved the final version of the manuscript.
-
The data supporting the findings of this study are available from the corresponding author upon reasonable request.
-
The authors declare that there are no conflicts of interest regarding the publication of this manuscript.
- Copyright © 2026 by the author(s). Journal of Applied Ichthyology published by Maximum Academic Press on behalf of John Wiley & Sons Ltd. This is an open access article under the terms of the Creative Commons Attribution License, which permits use, distribution and reproduction in any medium, provided the original work is properly cited.
-
About this article
Cite this article
Roy P, Preety AA, Rayhan AB, Roy K, Joty JJ, et al. 2026. Geometric morphometric assessment of shape divergence in farmed and wild populations of Heteropneustes fossilis. Journal of Applied Ichthyology 2026: e001 doi: 10.48130/jai-0026-0001 

Geometric morphometric assessment of shape divergence in farmed and wild populations of Heteropneustes fossilis
- Received: 06 January 2026
- Revised: 13 March 2026
- Accepted: 30 March 2026
- Published online: 12 June 2026
Abstract: Geometric morphometric analysis was applied to assess shape divergence and population structuring between farmed and wild populations of Heteropneustes fossilis in Bangladesh. A total of 114 specimens were sampled from three farmed populations (Bogura, Dinajpur, and Mymensingh) and one wild riverine population (Garbheswari River). Landmark-based geometric morphometrics were used to quantify shape variation, which was analysed using Coefficient of Variation (CV), Principal Component Analysis (PCA), Mahalanobis distances, Discriminant and Canonical Discriminant Analyses (DFA/CDA), Multidimensional Scaling (MDS) and UPGMA clustering. The wild river population exhibited higher within-population morphological variability, indicating greater phenotypic plasticity under natural environmental conditions compared with farmed stocks. PCA revealed a dominant axis of shape variation, with the first principal component explaining 88.18% of total variance and mainly associated with differences in body depth, head profile, and fin-base positioning. Multivariate analyses consistently demonstrated clear morphometric differentiation among populations, with the Bogura farmed stock showing the greatest divergence. DFA and CDA showed strong discriminatory power (canonical correlation r = 0.844), with population separation primarily driven by variation in the anterior body region, trunk depth, and caudal peduncle morphology. These findings demonstrate robust, low-dimensional shape divergence in H. fossilis, emphasizing the effects of habitat and hatchery practices, and highlighting the importance of conserving wild morphotypes for sustainable aquaculture and broodstock management.