












-
The condition factor (K) provides a quantitative measure of fish physiological condition and overall well-being, where individuals with greater weight at a given length are generally considered to be in better condition[1,2]. As an indirect but informative indicator, K reflects recent environmental and biological conditions and is closely linked to growth, reproduction, and survival, thereby offering insights into population status[3]. Although derived from length and weight, K is influenced by numerous environmental and biological factors, allowing comparisons of relative health among populations under different food availability, habitat quality, and climatic conditions[2]. Temporal and intraspecific variations in K may also occur due to differences in nutritional state and activity level, while interspecific differences often stem from variations in body shape[2,4]. Consequently, K acts as a useful proxy for evaluating how environmental and biological factors jointly shape the condition of fish populations and species.
The length–weight relationship (LWR) is of paramount importance for biomass modeling in aquatic ecosystems. In the context of fishery management and conservation, LWRs allow researchers to convert length measurements into biomass, define species-specific growth trajectories, and track how fish condition changes over space and time in response to environmental shifts[5,6]. By circumventing the cumbersome, time-consuming, and costly challenges associated with direct weight data collection, LWR provides an efficient solution for population assessment, offering critical insights into species-specific growth dynamics and ecological adaptability. FishBase has compiled relevant parameters for thousands of fish species[7]. Inland water bodies in Xinjiang, as important components of Central Asian aquatic ecosystems, support unique freshwater fish faunas, yet relevant biological data remain insufficient. Although LWRs have been reported for some fish species in lakes and reservoirs of Xinjiang and Central Asia (e.g., Bosten Lake), most studies have focused on limited species and regions[6,8,9].
The Upstream Reservoir, constructed in 1960 and located at the lower reaches of the Yarkand River (commonly known as the 'Yarkand Lake'), is one of the three major plain-type reservoirs in the Alaer Reclamation Area of the Tarim River Basin, Xinjiang. It is situated in the upper reaches of the Tarim River in Alaer City, Xinjiang Production and Construction Corps (80°36'–80°44' E, 40°32'–40°31' N), at an altitude of 1,033 m with a storage capacity of approximately 1.8 × 10⁹ m3[10,11]. The upper reservoir historically sustained abundant fishery resources with high fish diversity, serving as a primary production area for grass carp (Ctenopharyngodon idella). However, exacerbated ecological degradation has occurred in this aquatic ecosystem due to multiple anthropogenic stressors: (1) invasion of alien species; (2) intensive human activities; (3) overfishing; (4) rapid industrial and agricultural expansion; and (5) proliferation of aquaculture (e.g., river crab and carp cultivation). These cumulative pressures have resulted in depleted food resources, disruption of ecological equilibrium, and ultimately led to a sharp decline and near-depletion of fish stocks[12−15]. Cheng et al.[16] reported 17 fish species belonging to 4 orders and 7 families in the Upstream Reservoir from 2008–2010. For the Upstream Reservoir, only the LWR of Cyprinus carpio has been documented[10], and no systematic LWR data are available for other co-occurring fish species. Based on the latest sampling data from the Upstream Reservoir, this study first determined the LWRs for 13 fish species in this aquatic ecosystem. This study therefore aims to establish the LWRs and K values for 13 freshwater species inhabiting the Upstream Reservoir. Such baseline biological parameters are expected to support future stock assessments and conservation planning in this water body.
-
A total of 13 fish species samples were collected from eight sampling sites in the Upstream Reservoir, Xinjiang (Fig. 1). These sites were selected to cover the main habitat types in the Upstream Reservoir, including inflow and outflow regions, areas with different surrounding vegetation coverage, and locations with appropriate site conditions for cage deployment, while also representing shallow littoral zones, deep open-water areas, and diverse substrate types, ensuring that the sampling was representative of the entire reservoir ecosystem. All sampling procedures were performed during day shifts, with seasonal surveys conducted from March 2024 to May 2025. A combination of custom-made multi-mesh gillnets (60 m long, 2 m high, with 10 mesh sizes: 5, 10, 15, 25, 33, 48, 55, 70, 88, and 100 mm) and wire-mesh traps (15 m length, 2 mm × 5 mm mesh) was employed for fish collection, following the protocol described by Wang et al.[6]. All mesh sizes were measured as stretched mesh between opposite knots, following the standard protocol in fisheries sampling. Nets and traps were set for an exposure period of 12 h (from approximately 18:00 to 06:00) to maximize capture efficiency. No bait or attractant was used during fish sampling. All species were collected using consistent methods to minimize the influence of mesh selectivity on size distributions. Systematic sampling was conducted twice per quarter.
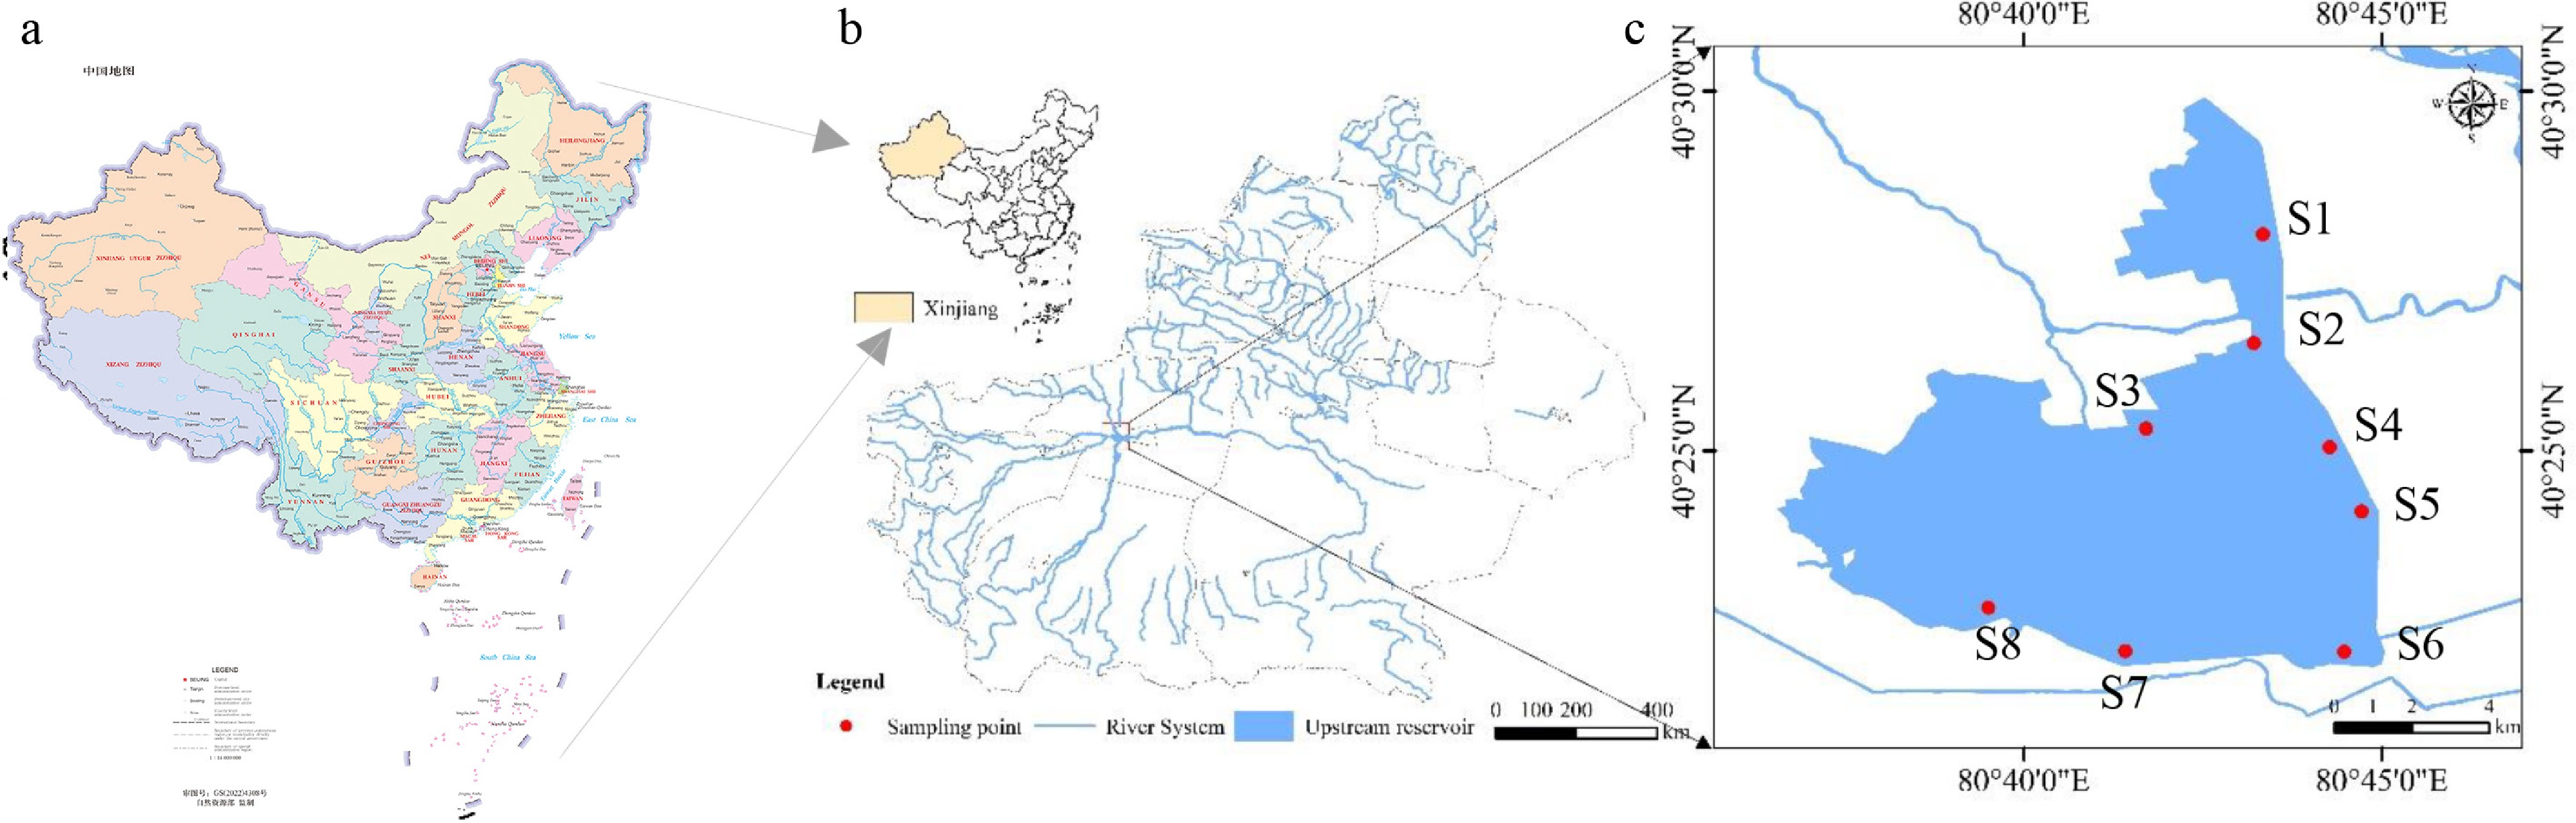
Figure 1.
Map of fish resource sampling sites. (a) Map of China. (b) Top left corner: outline map of China. Light yellow highlighting indicates the geographical location of the Xinjiang Uygur Autonomous Region within China. Bottom right corner: regional overview of the study area in Xinjiang, showing the river system and the location of the upstream reservoir (highlighted by a red box). (c) Detailed inset map of the upstream reservoir, with eight sampling points labeled S1–S8 (red dots). Blue shaded areas represent the upstream reservoir, and blue lines denote the connected river system. Scale bars are provided to indicate the spatial scale for both the regional overview (0–400 km) and the detailed inset map (0–4 km). Source of the map:
http://bzdt.ch.mnr.gov.cn .In the laboratory, fish specimens were identified to species using taxonomic keys and morphological descriptions from Guo et al.[17], Cheng et al.[16] and Yu et al.[10]. Total length (TL) was measured to the nearest 0.01 mm with a DL91200 vernier caliper (Deli Group Co., Ltd, China), and body weight (BW) to the nearest 0.01 g with a JE502 electronic balance (Shanghai Puchun Measuring Instrument Co., Ltd, China). The gender of the collected fish was not examined; hence, we utilized the pooled data for subsequent analysis regardless of gender. It should be noted that sexual dimorphism can affect LWR estimates. Fish handling and sampling were conducted in accordance with the guidelines of the Science and Technology Ethics Committee of Tarim University (permit number: PB20250627001). All scientific names, author names, and use of parentheses follow those in Fishbase[7]. Some species were much more abundant than others; thus, sample sizes varied accordingly (Table 1). Fulton's condition factor (K) (Eq. [1]) was introduced to reflect the fatness of fish bodies, and log-transformed equations (Eq. [2]) were used to determine the LWRs of 13 fish species.
Outlier detection and removal were conducted using studentized residuals in IBM SPSS Statistics 26. Studentized residuals represent the standardized residuals of the length–weight regression model, which adjust for the leverage of individual data points to reliably identify highly influential extreme values. Following common standards in fisheries regression analysis, data points with an absolute studentized residual value greater than 3 were identified as outliers and excluded prior to the final LWR parameter estimation. This procedure helps reduce bias caused by abnormal individual measurements and improves the robustness of regression results. Following Faruque & Das[18], a two-tailed t-test was performed to determine whether the regression slope b significantly deviated from the theoretical isometric value of 3, using the formula:
$ {t}_{s}=\frac{b-3}{{SE}_{b}} $ where, SEb is the standard error of the regression slope b. Growth type was classified as positive allometric (b > 3, p < 0.05), negative allometric (b < 3, p < 0.05), or isometric (no significant deviation from 3, p ≥ 0.05).
The K was calculated by the Fulton method, as presented in Eq. (1):
$ \mathrm{K}~(100\;\mathrm{g}/{\text{cm}}^{3})=100\times (\text{BW}/{\text{TL}}^{3}) $ (1) The relationship between body length and body weight was fitted using a logarithmic linear model, as shown in Eq. (2).
$ \ln (BW)=\ln a+b\ln (TL) $ (2) where, BW is the total body weight in g of each fish. TL is the total length in cm of each fish. a: the growth condition factor; b: the allometric growth factor.
-
The condition factor (K) of the studied species ranged from 0.263 to 2.664, with Rhinogobius giurinus having the highest value and Misgurnus anguillicaudatus the lowest (Table 2). Hemiculter leucisculus showed the highest coefficient of variation (CV) (CV = 45.7%), while Carassius auratus had the lowest variation (CV = 7.5%).
Table 1. The length–weight relationships of 13 freshwater fish species collected from the Upstream Reservoir in Xinjiang, China.
Order Family Species n TL (cm) BW (g) Regression parameters Min Max (Mean) * Min Max (Mean) * a 95% CL of a b 95% CL of b R2 (LWR) Cypriniformes Cyprinidae Erythroculter ilishaeformis 26 14.43 28.42 19.96 ± 3.29 20.10 242.00 67.90 ± 47.01 −5.953 −6.988~−4.918 3.357 3.010~3.704 0.946 Hemiculter leucisculus 35 9.06 16.95 11.83 ± 2.11 4.20 52.75 15.96 ± 11.59 −5.825 −7.586~−4.064 3.409 2.693~4.124 0.747 Carassius auratus 16 5.67 9.57 7.94 ± 1.02 2.14 10.50 6.83 ± 2.25 −4.575 −5.228~−3.922 3.113 2.797~3.429 0.972 Abbottina rivularis 91 6.87 10.74 8.80 ± 1.00 2.61 13.70 6.86 ± 2.61 −5.158 −5.750~−4.566 3.232 2.959~3.505 0.863 Rhodeus ocellatus 42 3.23 6.69 4.55 ± 0.75 0.30 3.40 1.26 ± 0.68 −4.529 −5.054~−4.003 3.074 2.726~3.422 0.891 Pseudorasbora parva 66 3.52 7.91 6.00 ± 0.90 0.30 4.50 2.07 ± 0.82 −4.432 −4.849~−4.015 2.846 2.612~3.079 0.905 Cyprinus carpio 11 20.12 33.25 27.79 ± 3.68 106.50 448.70 278.71 ± 97.27 −3.256 −5.384~−1.127 2.661 2.019~3.302 0.907 Cobitidae Misgurnus anguillicaudatus 34 7.36 12.79 9.27 ± 1.29 1.68 7.24 3.56 ± 1.51 −4.473 −5.816~−3.129 2.553 1.948~3.158 0.698 Perciformes Odontobutidae Odontobutis obscurus 24 9.65 19.43 14.16 ± 2.61 13.40 87.40 40.90 ± 19.80 −3.305 −3.730~−2.881 2.621 2.460~2.782 0.981 Channidae Channa argus 5 26.10 42.25 33.65 ± 6.94 135.70 461.60 306.66 ± 154.76 −3.843 −7.334~−0.353 2.700 1.704~3.696 0.961 Gobiidae Rhinogobius giurinus 77 2.86 7.83 5.37 ± 1.46 0.20 5.30 1.93 ± 1.38 −4.642 −4.972~−4.312 3.025 2.827~3.223 0.926 Siluriformes Bagridae Pelteobagrus fulvidraco 3 5.58 18.52 10.43 ± 7.05 2.20 83.50 29.79 ± 46.52 −4.677 −11.173~1.820 3.107 0.237~5.977 0.995 Siluridae Silurus meridionalis 9 20.29 42.56 32.40 ± 7.50 50.10 417.70 227.74 ± 126.27 −4.437 −7.035~−1.839 2.802 2.051~3.553 0.917 n, number of individuals. TL, total length. BW, body weight. Min and Max, minimum and maximum total lengths in cm or weights in g. (Mean) * reported as mean ± standard deviation (SD). a and b are the parameters of the length–weight relationship (LWR), a, intercept of LWR; b, slope of LWR. CL, fiducial interval. R2, coefficient of determination. The b values and weights of 13 freshwater fish species belonging to four orders and nine families in the Upstream Reservoir were estimated and analyzed (Table 2). Analysis of the LWR parameters revealed that the exponent b ranged from 2.553 to 3.409 across the 13 species. The lowest b value (2.553) was recorded for Misgurnus anguillicaudatus, whereas Hemiculter leucisculus showed the highest (3.409). With the exception of these extremes, the b estimates for most species fell within the commonly cited range of 2.5–3.5. All regressions were statistically significant (p < 0.05).
Table 2. The condition factor of species in the Upstream Reservoir in Xinjiang, China.
Species K (range) K (mean) * CV (%) 1 Erythroculter ilishaeformis 0.590–1.055 0.760 ± 0.114 15.0 2 Hemiculter leucisculus 0.499–2.264 0.861 ± 0.394 45.7 3 Carassius auratus 1.169–1.475 1.305 ± 0.098 7.5 4 Abbottina rivularis 0.470–1.670 0.962 ± 0.143 14.9 5 Rhodeus ocellatus 0.705–1.880 1.225 ± 0.215 17.6 6 Pseudorasbora parva 0.541–1.301 0.913 ± 0.131 14.3 7 Cyprinus carpio 0.979–1.556 1.26 ± 0.159 12.6 8 Misgurnus anguillicaudatus 0.263–0.645 0.434 ± 0.096 22.1 9 Odontobutis obscurus 1.146–1.614 1.358 ± 0.132 9.7 10 Channa argus 0.602–0.842 0.755 ± 0.091 12.1 11 Rhinogobius giurinus 0.567–2.664 1.038 ± 0.316 30.5 12 Pelteobagrus fulvidraco 0.983–1.315 1.188 ± 0.179 15.1 13 Silurus meridionalis 0.469–0.988 0.611 ± 0.152 24.9 K, the condition factor. (Mean) * Reported as mean ± standard deviation. CV (%) = Coefficient of variation = (Standard deviation/Mean) × 100%. In the regression analysis of LWRs, the coefficient of determination (R2) was used to measure the goodness of fit of the model. The results showed that R2 values ranged from 0.698 to 0.995. Pelteobagrus fulvidraco exhibited a relatively strong LWR fit, with an R2 of 0.995. Conversely, Misgurnus anguillicaudatus had a weaker LWR fit, with an R2 of 0.698.
-
The condition factor (K) of the studied species ranged from 0.263 to 2.664, with Rhinogobius giurinus having the highest value and Misgurnus anguillicaudatus the lowest, which reflected the interspecific differences in fish body fatness and habitat adaptability in the Upstream Reservoir. In the Upstream Reservoir, the K of different fish species exhibited varying degrees of stability, as indicated by their respective coefficients of variation (CV). Hemiculter leucisculus showed the highest variability (CV = 45.7%), indicating poor consistency in individual body condition, while Carassius auratus had the lowest variation (CV = 7.5%), reflecting a more consistent physiological status among individuals in its population. Notably, high variability in K values within some populations indicates differences in physiological status, which may be associated with age, sex, or reproductive stage[19]. Generally, the range of condition factors obtained in this study is consistent with those reported for other freshwater fish species in similar ecosystems, including Clarias gariepinus (0.54–1.94), Esox fimbrata (0.946), Ilisha africana (0.917), Scomber maderensis (0.947), Tilapia zillii (2.07), Ethmalosa senegalensis (0.941), Chrysichthys nigrodigitatus (0.59–0.72), Hemichromis vittatus (0.47–0.74), Lates niloticus (0.72–0.99), and Oreochromis niloticus (1.32–1.61)[19]. Population dynamics studies have shown that high K values indicate favorable environmental conditions (such as habitat and prey availability) and that low values indicate less than favorable environmental conditions[3]. Research by Kırankaya et al.[3] on five types of fish in the Hirfanli Reservoir, Turkey, indicates that the K ranged from 0.604 for Atherina boyeri to 1.721 for Aphanius danfordii, which is similar to the results of this study. It indicates that the habitats and availability of prey among the reservoirs may be basically the same.
While Cheng et al.[16] documented 17 species (belonging to four orders and seven families) in the Upstream Reservoir from 2008–2010, and Yu et al.[10] reported the LWR for Cyprinus carpio alone from 2015–2016, our study expands the LWR database by including 13 species (3 orders, 7 families). The 13 species collected in this study did not include Megalobrama amblycephala, Parabramis pekinensis, and Oryzias latipes reported in previous studies, which may be attributed to biodiversity changes caused by human disturbances or differences in fishing methods. Notably, this study provides the first report of LWRs for freshwater fish species other than Cyprinus carpio in this reservoir, as well as the presence of four species: Rhodeus ocellatus, Hypomesus olidus (Due to the low sampling n and the small variation in species size, the value of b is much lower than the most common range [2.5–3.5]. Therefore, the results for this fish species have been excluded from this study), Channa argus, and Pelteobagrus fulvidraco.
The LWR slope b is a key indicator of growth allometry. For the 13 species examined, b estimates spanned 2.553–3.409, with the majority falling inside the typical 2.5–3.5 interval, implying that their growth generally follows expected biological patterns[1,6]. Pelteobagrus fulvidraco exhibited a relatively high b (3.107) and the strongest LWR fit (R2 = 0.995), suggesting that its condition improves markedly with increasing length, a pattern possibly linked to its feeding habits and niche position within the reservoir[6]. Tiaoyi et al.[20] studied 155 samples of Pelteobagrus fulvidraco in Dongting Lake, with a b value of 2.4471, indicating negative allometric growth. The fish bodies were relatively slender, which was different from the results of this study. This suggests that for the same species, the b value varies significantly in different water bodies such as reservoirs and lakes, indicating that managers should consider the impact of water quality and farming methods on growth. In contrast, Misgurnus anguillicaudatus gave the lowest b (2.553) and weakest fit (R2 = 0.698). This may reflect its small body size, heightened susceptibility to environmental variability, or specialized resource use[6]. Similar findings have been reported for small-bodied marine fish[21], and it is known that body size correlates with growth stability because smaller individuals have limited energy reserves[22]. Additionally, niche-specific resource allocation strategies[23] could help explain the peculiar growth pattern of Misgurnus anguillicaudatus in this study and Rhodeus ocellatus in research by Wang et al.[6]. Interestingly, the omnivorous Hemiculter leucisculus had the highest b (3.409) among all species in our study, surpassing even the carnivorous species (Erythroculter ilishaeformis 3.357, Odontobutis obscurus 2.621, Channa argus 2.700, Silurus meridionalis 2.802, etc.). This contrasts with the observation from Bosten Lake, where the piscivorous Channa argus showed the highest b (3.665)[6]. Although carnivorous fish often benefit from high-quality prey, LWR parameters are known to be influenced by multiple interacting factors (e.g., stomach fullness, gonad condition, sampling season, habitat)[6,24,25], some of which were not controlled for here. Environmental consistency also matters: fish in stable habitats tend to show tighter length-weight correlations[6,26]. Moreover, anthropogenic pressures such as size-selective fishing may modify natural growth trajectories. The precise relationship between ecosystem characteristics and LWR parameters remains an open question[6]. The Upstream Reservoir, as a man-made plain reservoir with regulated water levels and mixed allochthonous inputs, may present a different selective landscape compared to natural lakes such as Bosten Lake. Generally, running waters favor rheophilic species (e.g., Acipenser sinensis) and hydrodynamic body forms[6,27,28], whereas lentic systems support benthic specialists like Carassius auratus[6,29]. Regarding ecological stress, eutrophication drives rapid growth in Hypophthalmichthys molitrix[30], high nutrient availability elevates b values in piscivores[6], and salinity stress in brackish waters forces osmoregulatory trade-offs in Liza haematocheila[6,31]. Given these complexities, an integrated framework combining niche theory and life-history analysis is required to disentangle the effects of multiple environmental drivers on fish growth dynamics.
All fish species exhibited statistically significant differences in LWRs (p < 0.05), with coefficients of determination (R2) ranging from 0.698 to 0.995. The LWR models developed in this study demonstrated high reliability and validity. During fishery resource monitoring, when direct weight data collection is challenging, the established length–weight relationship models (LWR models) can estimate fish weights using readily available length measurements, enabling assessment of quantitative dynamics in fish resources[6]. For example, Falsone et al.[32] developed LWR models for 52 fish, crustacean, and cephalopod species in the southern Sicilian continental shelf and upper slope, successfully enabling long-term monitoring and assessment of fishery resources in that region. Shuman et al.[33] constructed LWR models for European roach (Rutilus rutilus) and European perch (Perca fluviatilis) in the Ob River basin of western Siberia, validating the accuracy and practicality of these models for resource estimation through integration with on-site monitoring data. Wang et al.[6] employed a similar approach to develop LWR models for freshwater fish in Bosten Lake, Xinjiang, further illustrating the feasibility and universality of the methodology used in this study. The K of fish demonstrates that seasonal variations in food abundance significantly influence fish condition and LWR parameters[6]. Studies have shown that reproductive energy expenditure and environmental temperature changes can induce fluctuations in K and affect associated LWR parameters. For example, the K and LWR of Nile tilapia (Oreochromis niloticus) change before and after the spawning period[34]. Cultured European sea bass (Dicentrarchus labrax) exposed to elevated temperatures exhibited significantly higher final body weight, weight gain, and specific growth rates, likely due to temperature-mediated effects on metabolism that alter nutrient absorption and utilization efficiency, ultimately reflected in K and LWR[35]. In this study, the high R2 value of 0.995 for Pelteobagrus fulvidraco indicates a highly stable and linear correlation between body length and weight. However, due to the small sample size of captured individuals, further validation is warranted. Nihal et al.[36] reported that for fish samples from fisheries such as deep-sea shrimp trawling, b-value estimates can be highly unreliable at extremely small sample sizes (e.g., Dactyloptena orientalis, n = 2), while valid and statistically significant LWRs can be achieved with larger samples (n = 512). Gurkan et al.[37] documented extreme sample size variation (e.g., Symphodus cinereus, n = 4; Atherina boyeri, n = 1,558) and demonstrated that reliable LWR models can be obtained at p < 0.05, despite wider confidence intervals for small samples. Yeşilçiçek[38] noted that larger sample sizes generally yield higher R2 values, while reliable b estimates can still be obtained for rare species (e.g., Parablennius gattorugine, n = 11) using methods such as Bootstrap. Some species were much more abundant than others; thus, sample sizes varied accordingly. As noted by Faruque & Das[18], sample size can potentially affect the estimation of the b value in length–weight relationships. In this study, the interspecific differences in b values mainly reflect species-specific biological traits, growth patterns, and morphological characteristics, whereas the unbalanced sample sizes are considered a secondary factor and a methodological limitation of the present field survey. Although sample size variation may introduce minor uncertainty to parameter estimation, the b values of most species fall within the reasonable biological range, supporting the reliability of the main results. The growth of Pelteobagrus fulvidraco was relatively less influenced by environmental factors, with stable growth characteristics and resource utilization patterns. Conversely, Misgurnus anguillicaudatus had the weakest LWR fit (R2 = 0.698), indicating that the length–weight relationship was poorly explained by the model with considerable residual variation, which may be driven by its low food resource competitiveness and reproduction strategies sensitive to environmental disturbances, leading to greater uncertainty in its growth trajectory[6]. In the study conducted by Ya et al.[39] on the length–weight relationship of six fish species in the Sepang Besar River Estuary, Malaysia, it was found that when n was 278, the R2 value for Toxotes jaculatrix was 0.86, which was less than 0.9. This might be due to the presence of significantly different growth patterns among the individuals in the sample, or due to measurement errors during the process.
It should be noted that seasonal variations, such as changes in water temperature and food availability, may affect the physiological status and growth patterns of fish, thereby influencing the LWR parameters[40,41]. Although our sampling covered the main seasonal cycles from March 2024 to May 2025, the relatively long sampling interval might have missed short-term fluctuations in LWRs. Future studies could adopt a higher sampling periodicity (e.g., monthly surveys) to refine the understanding of seasonal effects on fish growth in this reservoir. It is important to note that the LWR parameters can vary depending on the season, habitat, and geographical location. Therefore, the b value and LWR equation obtained in this study are only applicable to the current environmental conditions and sampling conditions in this reservoir. When these results are applied to other populations or periods, caution should be exercised.
-
In summary, we provide the first LWR estimates for 13 freshwater fish species from the Upstream Reservoir, with Rhodeus ocellatus and Pelteobagrus fulvidraco being new additions to the LWR records for this water body. These data help fill a knowledge gap regarding local fish populations and can serve as a practical tool for future stock assessments, particularly for species under exploitation or those included in restoration programs.
We sincerely thank Chairman Zhaohua Huang of Alar Changxin Fisheries Co., Ltd., and all members of the Schizothoracidae Research Group at Tarim University for their great support and assistance during field sampling and experiments.
-
The animal study was reviewed and approved by the Science and Technology Ethics Committee of Tarim University (Approval number: PB20250627001).
-
The authors confirm contributions to the paper as follows: study conception and design: Wei J, Nie Z; data collection: Yang J, Hamid SM, Tan Y, Zuo S; analysis and interpretation of results: Wang J, Xiao Q; draft manuscript preparation: Yang J; review and editing of the manuscript: Wei J, Nie Z, Xu Y. All authors reviewed the results and approved the final version of the manuscript.
-
The raw data generated and analysed during this study are available from the corresponding author upon reasonable request.
-
The authors declare that they have no conflict of interest.
- Copyright © 2026 by the author(s). Journal of Applied Ichthyology published by Maximum Academic Press on behalf of John Wiley & Sons Ltd. This is an open access article under the terms of the Creative Commons Attribution License, which permits use, distribution and reproduction in any medium, provided the original work is properly cited.
-
About this article
Cite this article
Yang J, Hamid SM, Tan Y, Zuo S, Wang J, et al. 2026. Length-weight relationships and condition factors of 13 freshwater fish species in the Upstream Reservoir, Xinjiang, China. Journal of Applied Ichthyology 2026: e004 doi: 10.48130/jai-0026-0002 

Length-weight relationships and condition factors of 13 freshwater fish species in the Upstream Reservoir, Xinjiang, China
- Received: 06 May 2026
- Revised: 06 May 2026
- Accepted: 08 June 2026
- Published online: 28 August 2026
Abstract: Located in Xinjiang, the Upstream Reservoir is a representative plain-type water body that once supported rich fishery resources but has recently experienced a notable decline. To support local fishery management, we investigated the length–weight relationships (LWRs) and Fulton's condition factor (K) for 13 freshwater fish species collected from eight sites between March 2024 and May 2025. Across the 13 species, K values ranged from 0.263 to 2.664, and the LWR slope b varied between 2.553 and 3.409, with six species showing b < 3 and seven showing b > 3. All LWR regressions were statistically significant (p < 0.05), and coefficients of determination (R2) spanned 0.698–0.995. The best LWR fit was observed for Pelteobagrus fulvidraco and the poorest for Misgurnus anguillicaudatus. Notably, Hemiculter leucisculus exhibited the highest b value, suggesting potential influences from local environmental and biological factors. These findings provide essential baseline data for fish ecology and conservation in the Upstream Reservoir.
-
Key words:
- Condition factor /
- Environmental factors /
- Fish ecology /
- Fishery resource management /
- Growth pattern