













-
Climate change and increased human activity are altering global ecosystem boundaries, with shifts in pest habitats causing severe impacts on local ecosystems, biodiversity, and agriculture[1,2]. Although national-level resources are actively deployed to mitigate this damage, the inherent characteristics of pests render prevention of their spread extremely difficult[3,4]. Therefore, proactive efforts are being made to assess the potential areas of occurrence in advance, thus allowing for strategic and efficient allocation of limited resources.
Ricania speculum (Walker, 1851) (Homoptera: Ricaniidae), commonly known as the black planthopper, is an agricultural pest primarily found in East Asia, including China, Japan, the Philippines, and Malaysia[5,6]. This species is polyphagous and feeds on > 60 species of woody plants belonging to 33 families, with the primary hosts including citrus, cotton (Gossypium hirsutum), coffee (Caffea spp.), palm oil (Elaeis guineensis), and tea (Camellia sinensis)[7]. The pest causes damage mainly through direct feeding on young branches, which leads to weakened growth, leaf chlorosis, and branch dieback in severe cases[8]. Recent changes in climate and biosecurity issues in international trade have expanded the habitat range of this pest[9,10], consequently leading to its occurrence in northern Italy[6]. Moreover, ongoing reports on climate change and increased trade activities driven by societal development suggest a high likelihood of this pest invading regions where it currently does not occur[11]. Consequently, proactive monitoring and surveillance of this pest are urgently needed.
Species distribution modeling (SDM) spatially predicts the potential distribution of pests on the basis of climatic and environmental factors. Among various SDMs, machine learning-based (or correlative) models predict the probability of occurrence by learning the environmental characteristics of known presence locations[12−14]. Unlike mechanistic models that determine suitable habitats according to the physiological responses of a species to specific climatic conditions, SDMs requires only simple input data. This includes data such as occurrence coordinates or presence records, thereby rendering SDM a popular choice for predicting the potential distribution of pests under climate change scenarios[15]. However, uncertainty is inevitable in model-based predictions. Accordingly, methodological advancements, such as improving data quality and variable reconstruction, and incorporating complex variables, are actively pursued to minimize this uncertainty[16−18]. Ensemble modeling integrates two or more distinct models to reduce the uncertainty associated with individual predictions. This offers a robust and conservative estimate of the potential distribution of a species based on model consensus[19,20].
In this study, we aimed to evaluate the current and future global invasion risk of R. speculum using multiple machine learning-based species distribution models under climate change scenarios. Specifically, the objectives of this study were to (1) compare the predictive performance and spatial projections of three SDM algorithms (MaxEnt, Random Forest [RF], and XGBoost), among which XGBoost remains underutilized in SDM applications; (2) assess changes in the potential distribution of R. speculum under multiple climate change scenarios; and (3) reduce predictive uncertainty by integrating algorithmic and climatic variability through an ensemble modeling framework. By combining advanced machine learning algorithms, ensemble approaches, and multimodel climate scenarios, this study provides a more robust assessment of invasion risk and offers a scientific basis for proactive monitoring and biosecurity planning under climate change.
-
The global occurrence coordinates of R. speculum collected up to June 2025 were obtained from the Global Biodiversity Information Facility and cross-checked with the European and Mediterranean Plant Protection Organization[21,22]. To reduce potential sampling bias in occurrence records generally caused by duplicated points and uneven sampling density resulting from human observation, this study applied spatial filtering with a 10-km radius buffer by using the spatial rarefying function in the SDM Toolbox implemented in AcrGIS Pro (version 3.6.0, ESRI, Redlands, CA, USA)[23]. Consequently, 437 geo-referenced locations were selected and used in all subsequent analyses.
Environmental variables for the occurrence of Ricania speculum
-
The monthly average climate data from 1990 to 2024 were obtained from WorldClim (www.worldclim.org) and converted into 19 bioclimatic variables (Bio1–19) at a resolution of 10 arc-minutes (18.5 km) to facilitate the prediction of the current potential distribution of R. speculum[24,25]. For future predictions, bioclimatic variables were obtained from the same source at the same resolution, covering three future periods (2041–2060, 2061–2080, and 2081–2100) under two shared socioeconomic pathways (SSP2-4.5 and SSP5-8.5). Climate projections were derived from the following three global climate models (GCM) within the CMIP6 framework: The MIROC6, IPSL-CM6A-LR, and MPI-ESM1-2-HR models. These models were selected to reflect a broad range of climate sensitivities and regional climate dynamics. The combination of multiple GCMs and emission scenarios allows for a comprehensive and conservative assessment of future pest distributions under climate change.
Model variable selection
-
Selecting variables that are not strongly correlated with one another is essential to minimize spatial autocorrelation[18]. In this study, the model variables were screened on the basis of their correlations and contributions to the full-variable MaxEnt model, which included the 19 bioclimatic variables. Specifically, in the full-variable model, variables with high contributions were selected as key variables, and those showing strong Pearson correlations (|r| > 0.75) with key variables were excluded. For example, Bio1, the second-highest contributing variable in the full-variable MaxEnt model, was retained because of its low correlation with Bio2. In contrast, Bio3, -4, -6, -7, -10, and -11 were excluded because of their high correlations with Bio1. Using this approach, nine final bioclimatic variables were selected (Table 1).
Table 1. Selected bioclimatic variables and their contributions for R. speculum.
Variables Description Percent contribution (%) MaxEnt (%)* Random Forest** XGBoost*** Bio1 Annual mean temperature 19.1 35.4 0.032 0.18 Bio2 Mean diurnal range 26.2 28.4 0.018 0.174 Bio5 Max temperature of warmest month 0.4 4.9 0.021 0.058 Bio8 Mean temperature of wettest quarter 2.1 2.4 0.02 0.041 Bio12 Annual precipitation 23.9 23.8 0.025 0.315 Bio14 Precipitation of driest month 0.5 1.2 0.016 0.054 Bio15 Precipitation seasonality 0.5 2.2 0.012 0.058 Bio18 Precipitation of warmest quarter 1.2 1.4 0.023 0.068 Bio19 Precipitation of coldest quarter 0.1 0.3 0.012 0.052 * In MaxEnt, variable contribution represents the accumulated increase in regularized gain attributable to each variable across all iterations of the algorithm.
** In RF, it is measured by permutation importance, which represents the decrease in predictive accuracy on out-of-bag samples when the values of a variable are randomly permuted.
*** In XGBoost, it is quantified by average gain, which measures the mean reduction in the objective function loss contributed by each variable when used as a splitting node across all trees.Model development and operation
-
Using the selected variables, three algorithms (MaxEnt, RF, and XGBoost), were used to model the potential global occurrence probability of R. speculum. MaxEnt is a correlative SDM based on maximum entropy. MaxEnt was optimized for determining the feature class (FC) and regularization multiplier (RM) using the ENMeval package[26,27]. The best model used linear, quadratic, hinge, product, and threshold FC and RM values of 1.5 at a corrected Akaike information criterion of 0[17,28]. Background or pseudo-absence points were selected according to the requirements of each algorithm to characterize the available environmental space and reduce potential sampling bias. For MaxEnt, 10,000 randomly sampled background points were incorporated within a presence–background framework to represent the available environment across the global terrestrial domain. For RF and XGBoost, the same set of points was treated as pseudo-absence data and incorporated using inverse probability weighting, such that the cumulative weight of the background class equaled that of the presence class. This approach reduces bias arising from class imbalance, prevents the algorithms from being dominated by the more numerous background observations, and enables tree-based classifiers to approximate a presence–background framework without treating pseudo-absence points as true absences[29,30]. Potential nonequilibrium between invasive populations and the environment was mitigated by the predominance of occurrence records from the native range in East and Southeast Asia (~75.5%), where the species has a long-established distribution.
A grid search of 64 parameter combinations was used to test the number of trees (300, 500, 700, 1,000), the number of variables sampled at each split (mtry = 2–5), and the minimum node size (1, 3, 5, 7). This identified the optimal structure of 1,000 trees, mtry = 3, and a minimum node size of 1, based on the lowest out-of-bag error. XGBoost is a gradient boosting algorithm that sequentially builds weak decision trees to improve predictions; however, its use in SDM is less common than the use of MaxEnt or RF[31,32]. The key XGBoost hyperparameters include the number of trees (n estimators), maximum depth (max_depth), learning rate (eta, η), data and feature subsampling (subsample, colsample_by tree), and regularization parameters (gamma, γ, minimum_child_weight). A full-grid search of 486 combinations identified the optimal model as η = 0.05, max_depth = 7, γ = 0.25, colsample_bytree = 1, min_child_weight = 3, and subsample = 0.6, with the best number of iterations = 332. All parameters and their optimal values are listed in Table 2.
Table 2. Hyperparameter settings and optimal values for RF and XGBoost.
Model Hyperparameter Description Grid search ranges Selected values Random Forest Number of trees Number of trees in the forest 300, 500, 700, 1,000 1,000 Mtry Number of variables sampled at each split 2, 3, 4, 5 3 Node size Minimum node size 1, 3, 5, 7 1 XGBoost Eta (η) Learning rate 0.05, 0.1 0.05 Max depth Maximum depth 3, 5, 7 7 Gamma (γ) Minimum loss reduction 0, 0.25, 0.5 0.25 Colsample by tree Feature subsampling 0.6, 0.8, 1.0 1 Min child weight Minimum sum of instance weight 1, 3, 5 3 Subsample Data subsampling 0.6, 0.8, 1.0 0.6 n estimators Number of trees 1~2,000 332* * The optimal number of trees was determined as 332 using early stopping (tolerance = 50). Ensemble modeling
-
Ensemble modeling, which integrates two or more individual models, enables a conservative and robust evaluation of species occurrence by compensating for the uncertainties inherent in a single SDM algorithm[33,34]. In this study, ensembles of model algorithms, multiple GCMs, and spatiotemporal approaches were used to identify high-risk areas in which R. speculum is likely to persist by using multiple model outputs under the current climate and time-specific climate change scenarios based on multiple GCMs (three models × four time periods × three GCMs = a total of 36 model outputs). In this study, a performance-weighted ensemble framework based on the true skill statistic (TSS) was used to integrate the outputs of the three SDM algorithms (MaxEnt, RF, and XGBoost) across current and future climate conditions. To ensure comparability among algorithms with different optimal classification thresholds, the continuous suitability outputs of each model were first rescaled around their model-specific binary threshold such that the threshold value corresponded to 0.5 on a common 0–1 suitability scale. This harmonization procedure enabled ecologically equivalent suitability regions to be compared among algorithms despite differences in probability calibration and threshold sensitivity. Following rescaling, each suitability raster was weighted according to the model's performance by multiplying the continuous suitability output by the corresponding TSS value and dividing by the sum of TSS values across all algorithms. The weighted ensemble suitability was calculated by Equation 1.
$ Ensemble\;S uitability=\dfrac{\sum\nolimits_{i=1}^{3}TS{S}_{i}\times {S}_{i}}{\sum\nolimits_{i=1}^{3}TS{S}_{i}} $ (1) where, ES is the ensemble suitability, Sᵢ represents the rescaled suitability output of the ith algorithm, and TSSᵢ denotes the predictive performance of the corresponding model.
The resulting continuous ensemble map was subsequently classified into four suitability categories using equal intervals of 0.25: Unsuitable (0–0.25), marginally suitable (0.25–0.50), moderately suitable (0.50–0.75), and highly suitable (0.75–1.00). This procedure was first applied to the current climate projection and subsequently extended to future projections under multiple climate change scenarios and GCMs to construct ensemble maps that reflect both temporal and climatic variability.
Model performance evaluation
-
Predictive performance was assessed using multiple metrics of sensitivity, specificity, accuracy, and TSS. However, the area under the receiver operating characteristic curve (AUC) was not used because it has been criticized for overestimation[35]. Sensitivity measures the proportion of correctly predicted presence, whereas specificity measures the proportion of correctly identified absence. The accuracy reflects the overall proportion of correct predictions. TSS was a main performance metric in this study owing to its practical accuracy in SDM. TSS combines sensitivity and specificity to provide a balanced assessment of a model's performance, with values ranging from −1 to 1, where 1 indicates perfect agreement[36]. To evaluate the predictive performance on the basis of the specified metrics, this study utilized an internal 10-fold cross-validation for MaxEnt, whereas a 10-fold block cross-validation approach was implemented for both RF and XGBoost.
-
The evaluated models demonstrated consistently high performance across all metrics, thus indicating their robust reliability in predicting the pest's occurrence (Table 3).
Table 3. Performance metrics of the three SDM algorithms for R. speculum under current climate conditions.
Sensitivity Specificity Accuracy AUC TSS MaxEnt 0.967 0.886 0.886 0.951 0.853 Random Forest 0.972 0.898 0.901 0.978 0.87 XGBoost 0.968 0.905 0.908 0.979 0.874 Among the algorithms, XGBoost emerged as the best performer and slightly outperformed RF, even though the performance was not significantly different across the algorithms. MaxEnt exhibited the lowest performance, whereas its sensitivity was comparable with that of the other models. However, it suffered from low specificity.
Although minor variations existed among the three models, their projections were broadly consistent and aligned with the known occurrence records (Fig. 1).
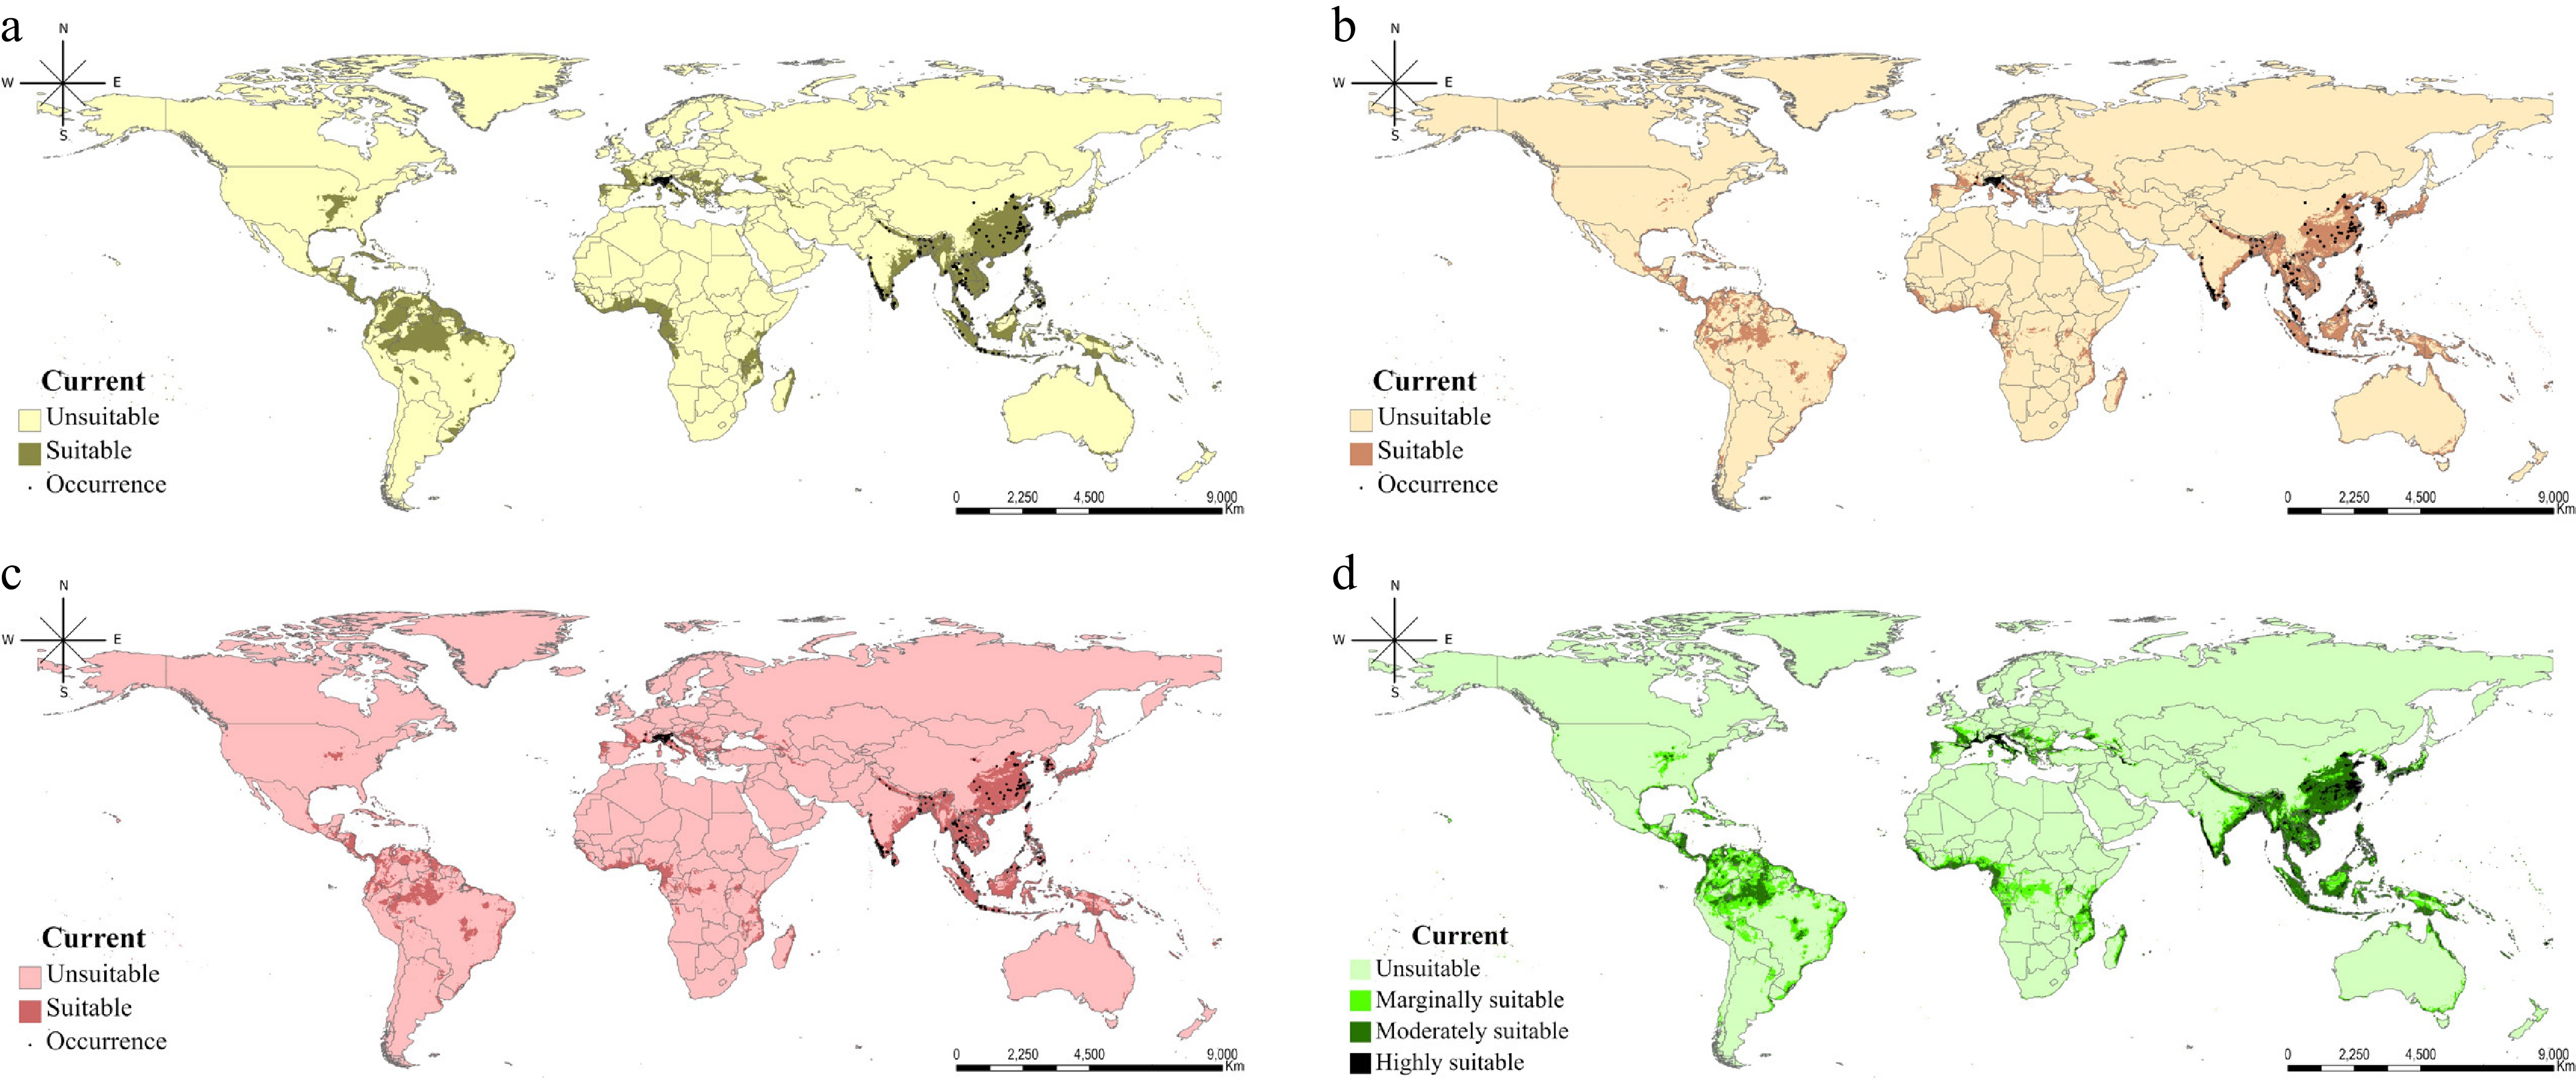
Figure 1.
Current distribution of R. speculum as predicted by three machine learning algorithms and their TSS-weighted ensemble: (a) MaxEnt, (b) Random Forest, (c) XGBoost, and (d) the TSS-weighted ensemble suitability map integrating the three algorithms. The source of the map layout was obtained from ArcGIS Pro 3.6.0 software (
www.arcgis.com/home/index.html ).The primary regions with high suitability were concentrated in East and Southeast Asia, including India. Beyond these core areas, the models identified crucial potential distributions in northern South America, the Mediterranean coast of Europe, and coastal Central Africa, including Madagascar. The models exhibited varying degrees of spatial sensitivity. MaxEnt predicted the most expansive distribution, covering 11.1% of the global land area (excluding Antarctica), whereas XGBoost offered the most conservative projections at 8.9% (Table 4). RF yielded intermediate results with an estimated distribution of 9.3%. Notably, the area projected by the ensemble model, which represents the regions showing moderate suitability, encompassed 7.6% of the total world area.
Table 4. Temporal projections of suitable habitat extent for R. speculum, represented by pixel counts across multiple models and climate trajectories.
Current (%) 2050 2070 2090 Sustained area** SSP245 SSP585 SSP245 SSP585 SSP245 SSP585 MaxEnt 64,180 (11.09) 68,427 (11.82) 74,709 (12.91) 76,139 (13.15) 92,468 (15.97) 81,070 (14) 114,497 (19.78) 47,467 (8.2) Random Forest 53,603 (9.26) 72,182 (12.47) 84,955 (14.68) 84,761 (14.64) 112,042 (19.35) 93,418 (16.14) 151,000 (26.08) 38,771 (6.7) XGBoost 51,242 (8.85) 66,116 (11.42) 74,708 (12.91) 74,521 (12.87) 93,302 (16.12) 80,215 (13.86) 111,875 (19.33) 36,269 (6.27) Ensemble** 43,921 (7.59) 56,532 (9.77) 64,839 (11.2) 64,959 (11.22) 83,680 (14.46) 71,084 (12.28) 104,000 (17.97) 31,831 (5.5) * Sustained area is defined as areas where the potential for occurrence persists under climate change, calculated on the basis of the total number of pixels = 578,888. ** Regions with moderate suitability. Climate change is projected to drive a consistent northward expansion of R. speculum across all modeling scenarios, thereby resulting in a pronounced increase in the total suitable habitat. By 2090, these habitats are expected to expand substantially, with the most pronounced gains occurring in South America and Europe (Fig. 2).
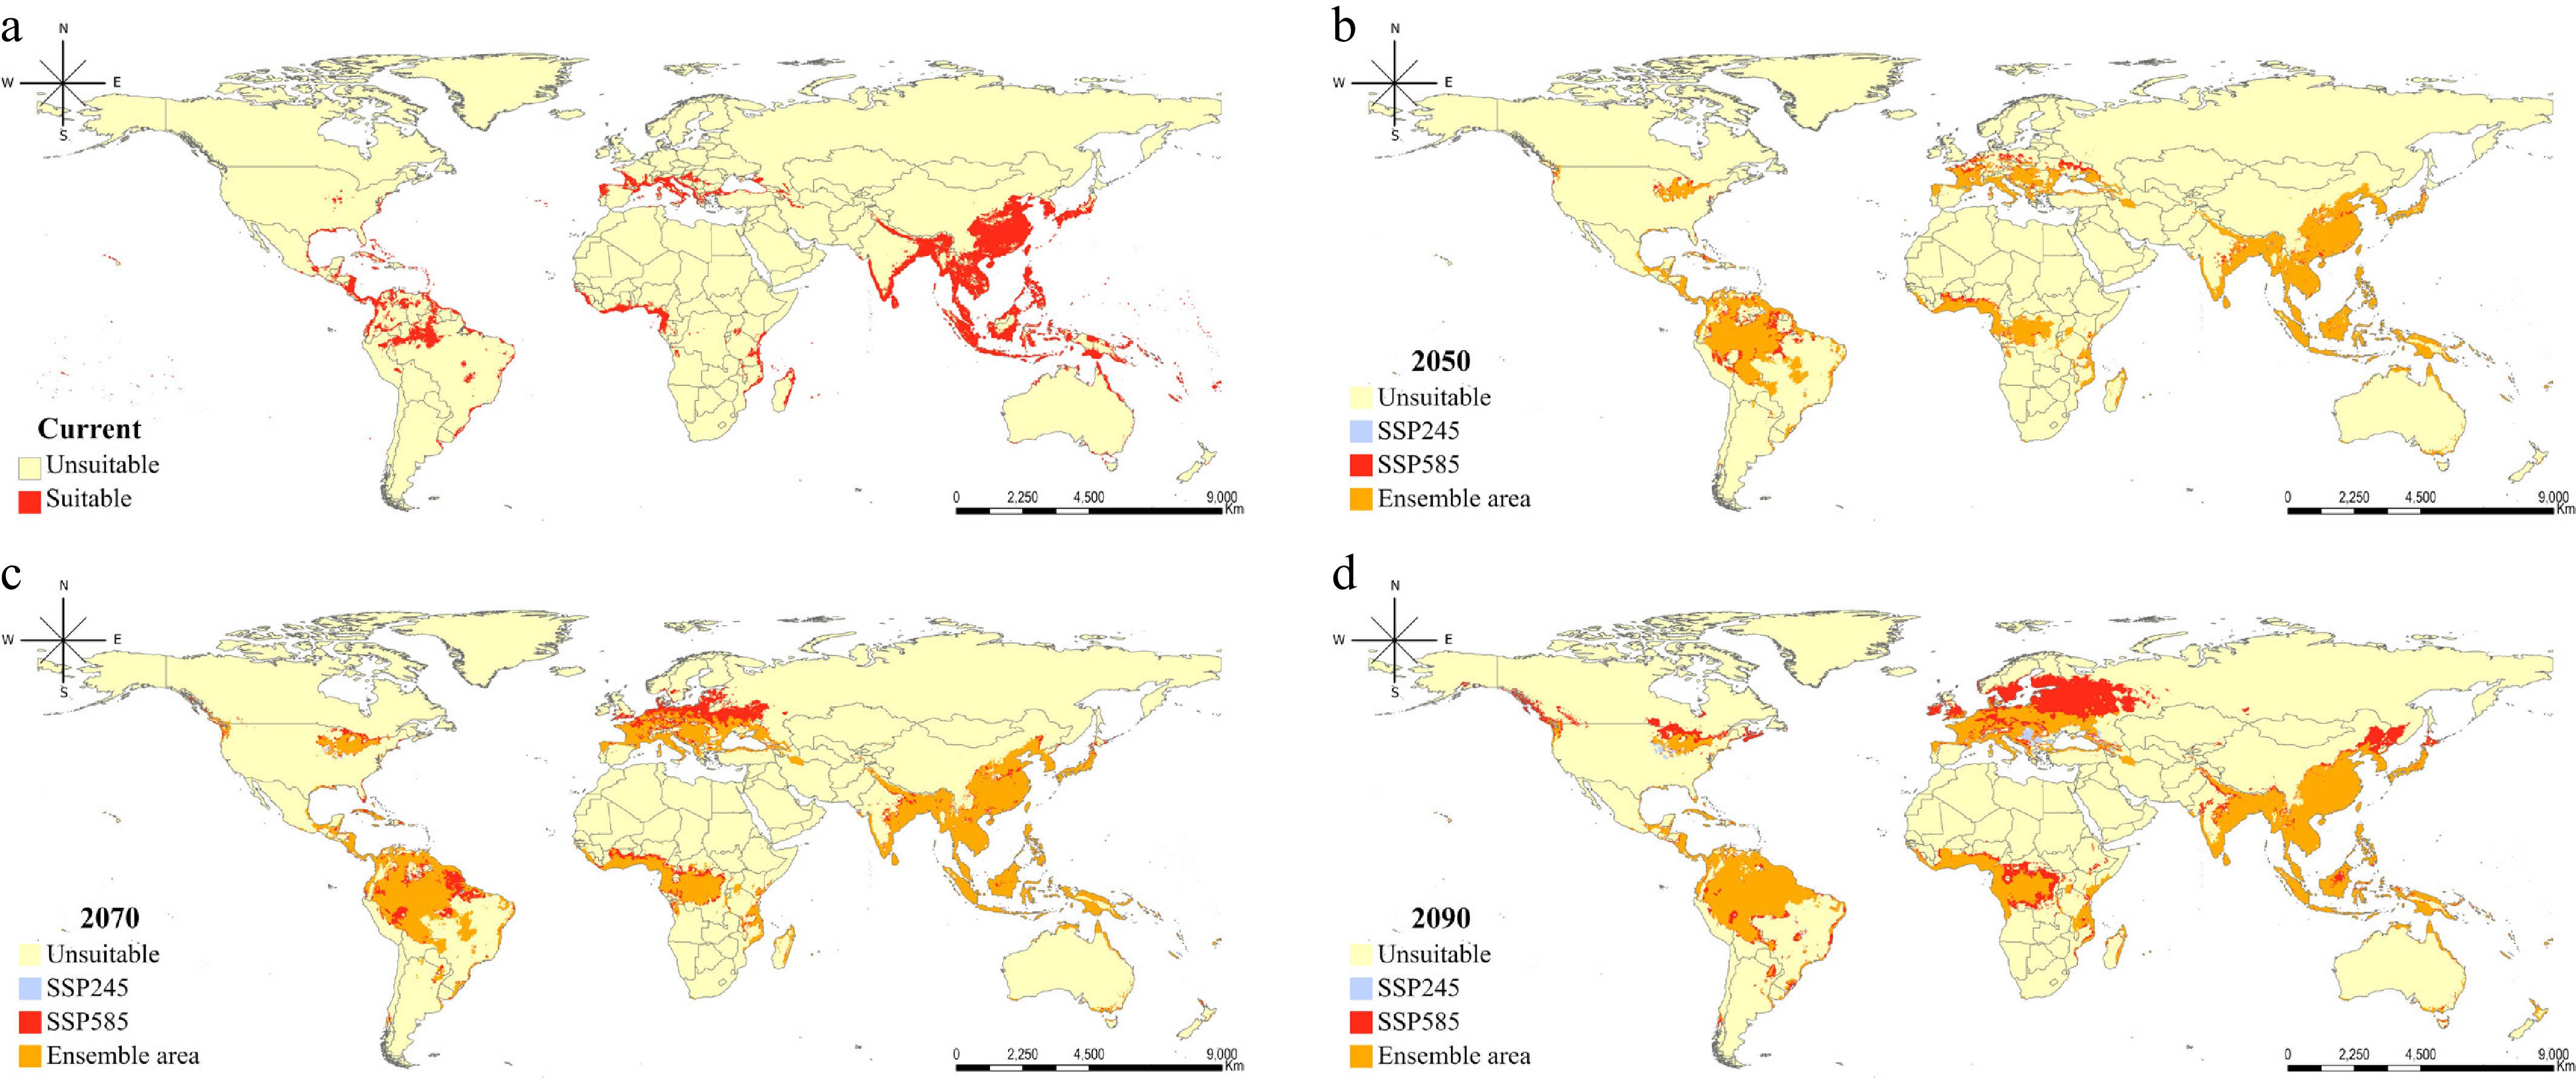
Figure 2.
Ensemble projection of three different machine learning algorithms for the potential distribution of R. speculum according to climate change scenarios: (a) Current, (b) 2041–2060, (c) 2061–2080, and (d) 2081–2100. Ensemble areas are those projected to have moderate suitability by the ensemble methods. The source of the map layout was obtained from ArcGIS Pro 3.6.0 software (
www.arcgis.com/home/index.html ).This geographic shift is most aggressive under the high-emission scenario (SSP585), thus facilitating rapid northward encroachment into previously unsuitable European territories. In this scenario, the RF model predicted that the species would cover 26.1% of the global land area. Furthermore, South America is projected to experience a gradual increase in ensemble-predicted suitability from 2050 onward. The persistence of these favorable conditions through to 2090 suggests that this region faces a disproportionately high risk of long-term establishment and subsequent economic damage. According to the ensemble approach, the potential occurrence area projected to have moderate suitability covered 18% of the world, which was a 2.4-fold increase over the current potential distribution.
Although differences in the magnitude and spatial extent of projected suitable areas were observed among the three algorithms (Supplementary Figs. S1, S2, and S3), RF exhibited relatively greater variation in projected range under the given climate change scenarios than MaxEnt and XGBoost. The overall geographic patterns were broadly consistent across the algorithms, particularly in East and Southeast Asia. Some variability in projected expansion was observed in Europe and northern South America under future climate scenarios, reflecting differences in model-specific suitability responses. By integrating algorithmic performance and climatic variability using the TSS-weighted ensemble framework, regions including East and Southeast Asia, India, northern South America, the Mediterranean coast, and coastal Central Africa consistently exhibited relatively high ensemble suitability under both current and future climate conditions (Fig. 3). These regions therefore represent areas where climatic conditions may remain favorable for the persistence or potential establishment of R. speculum across multiple scenarios.
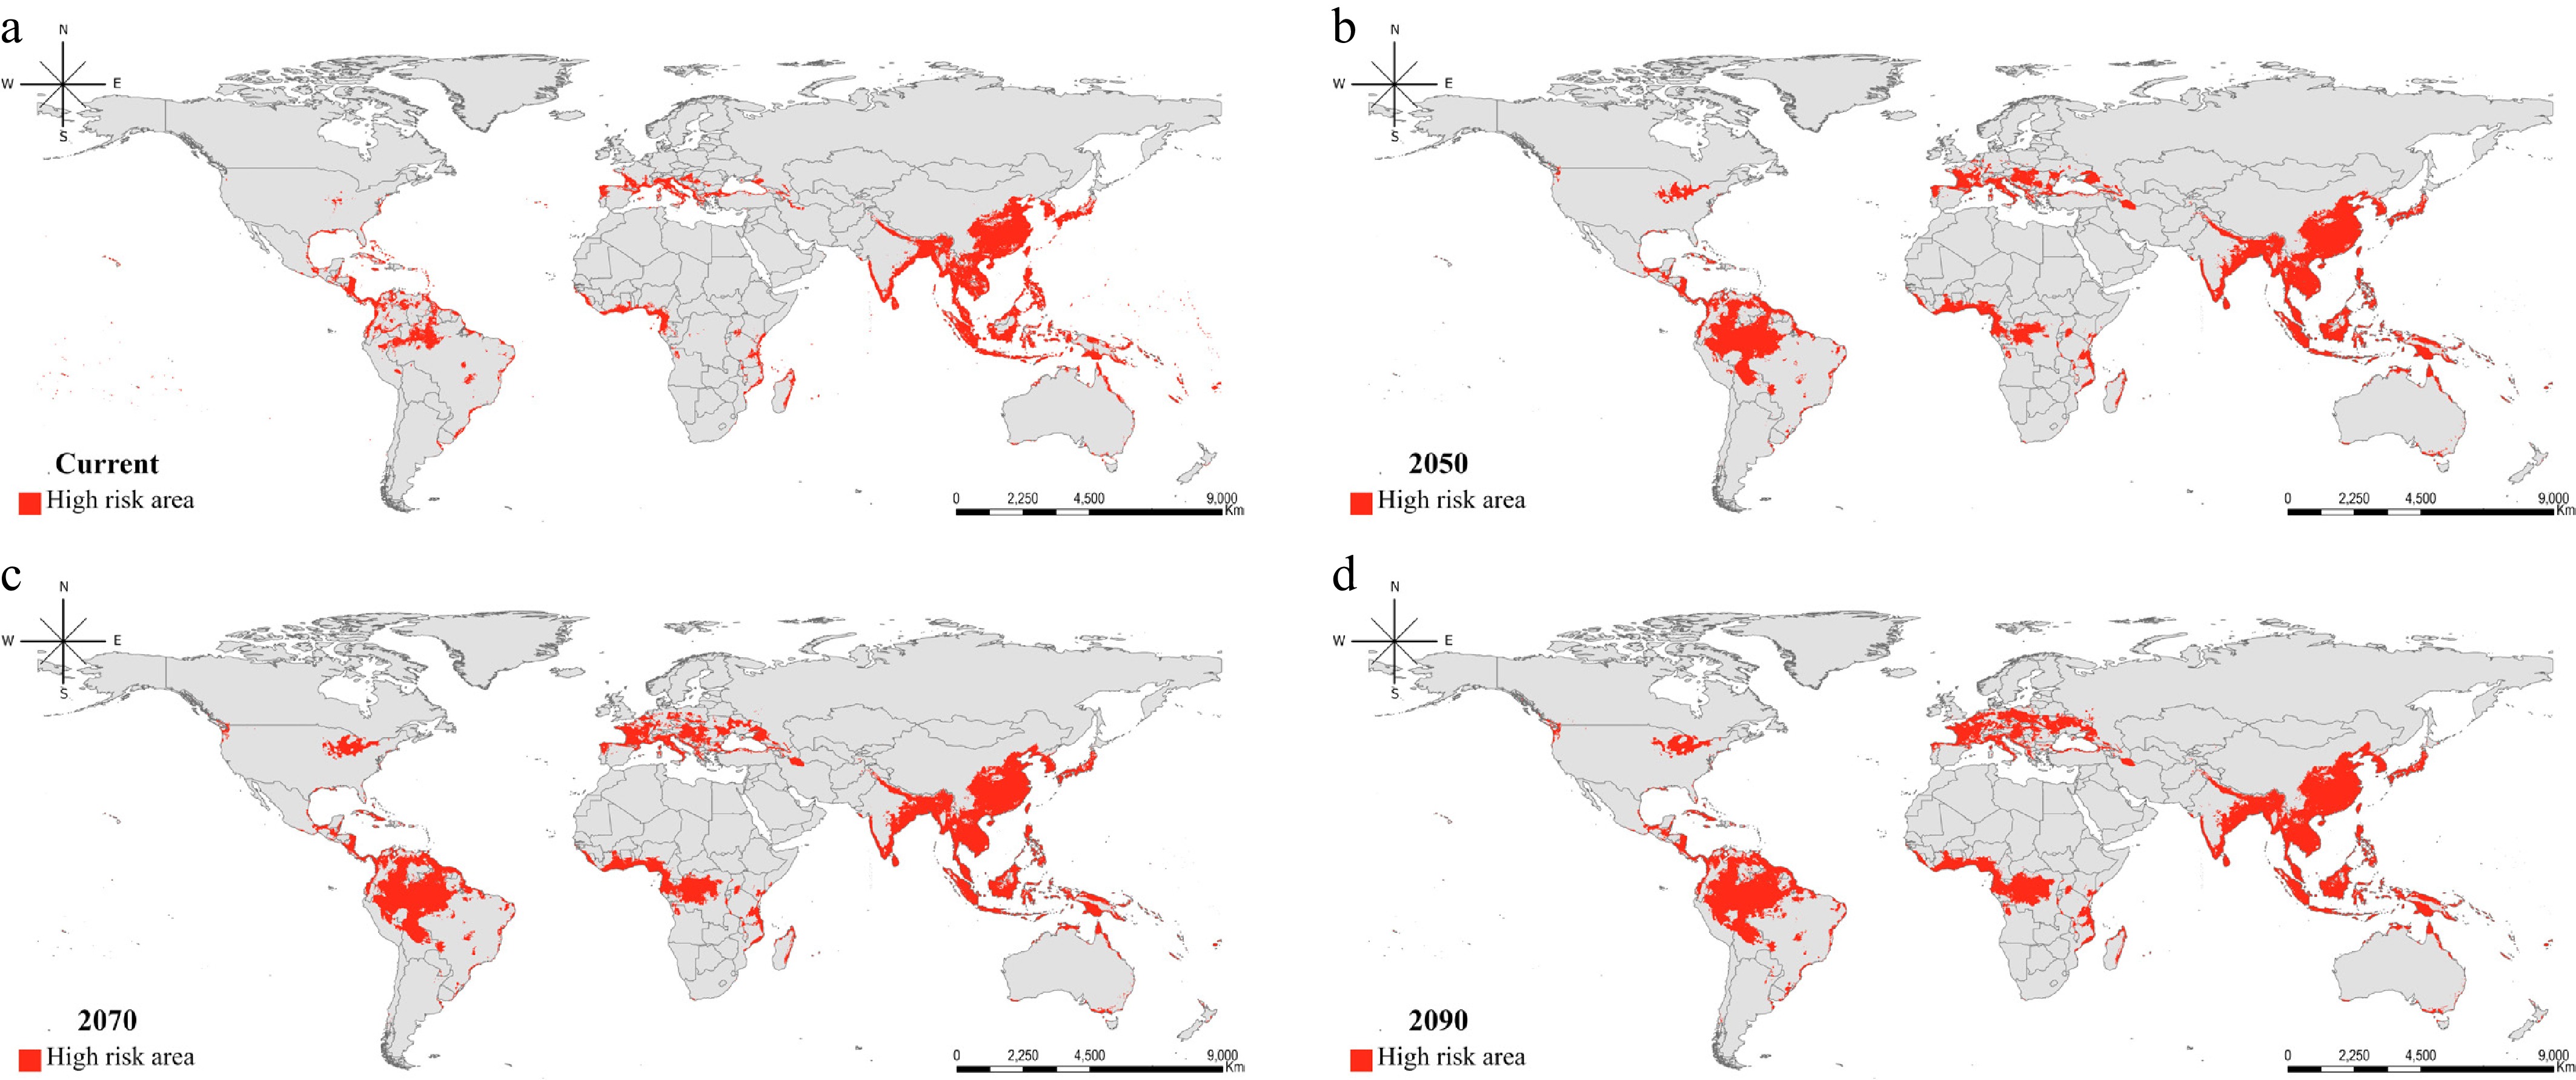
Figure 3.
Projected sustainable risk regions identified to have moderate suitability by the ensemble approach across climate change scenarios and different modeling algorithms: (a) Current, (b) 2041–2060, (c) 2061–2080, and (d) 2081–2100. The source of the map layout was obtained from ArcGIS Pro 3.6.0 software (
www.arcgis.com/home/index.html ).These high-persistence zones are projected to encompass 5.5% of the total global land area. This suggests that these areas are likely to remain high-risk zones where pest-related damage may persist through to the end of the century.
-
This study used three machine learning algorithms including XGBoost, a model underutilized in SDM, to project the potential expansion of R. speculum. Under the current climate conditions, all algorithms demonstrated consistently high predictive performance, with TSS values exceeding 0.85 and only minor differences in sensitivity, specificity, and accuracy. These results indicate that all three algorithms were capable of reliably capturing the contemporary climatic niche of the species. In particularly, XGBoost provided the most precise alignment with the observed occurrence records, thereby outperforming both MaxEnt and RF in terms of local fit. This superior fit is likely attributable to the architectural approach of XGBoost. Unlike the maximum entropy theory of MaxEnt or the parallel ensemble voting of RF, XGBoost utilizes gradient boosting to iteratively update weights on the basis of feedback, thereby minimizing fitting discrepancies[32,37]. However, the differences became more apparent when the projections were extended to future climate scenarios. Although the overall geographic patterns of projected suitability were broadly comparable, the magnitude of change in projected range varied among algorithms. RF exhibited relatively larger variation in projected suitable area across climate change scenarios, suggesting greater responsiveness to shifts in future climatic conditions. In contrast, XGBoost showed comparatively smaller variation through time, similar to MaxEnt's projections. Such differences likely reflect variation in how the algorithms characterize nonlinear relationships and extrapolate suitability under novel climatic conditions. Although XGBoost is a robust tool for conservative site-specific predictions under the current conditions, it should be carefully used for projecting dynamic habitat shifts driven by climate change[38]. Ultimately, in ecological modeling, where datasets are often characterized by spatial autocorrelation and inherent uncertainties, algorithms based on probabilistic distributions or bagging-based voting systems may offer enhanced stability and generalizability. In contrast, feedback-driven models, such as XGBoost, may prioritize fitting contemporary data at the expense of capturing long-term climatic sensitivity[38]. Finally, because no independent future occurrence data are available to directly evaluate predictive transferability, these differences should be interpreted cautiously.
Ricania speculum is predominantly distributed across East and Southeast Asia, and shows a distinct tendency to inhabit coastal regions. Variable importance analyses consistently identified temperature- and precipitation-related variables as influential predictors across algorithms, suggesting that climatic moisture and thermal conditions may be associated with the modeled suitability of R. speculum[39]. Specifically, analysis of the MaxEnt response curves and the partial dependence plots for both RF and XGBoost revealed a consistent peak in the probability of species occurrence within an annual mean temperature (Bio1) of 10–15 °C and an annual precipitation (Bio12) range of 3,000–4,000 mm. As R. speculum is a highly polyphagous pest, these environmental thresholds align with the highly suitable habitats identified in the humid subtropical and tropical regions of South America, Africa, and Southeast Asia, where major economic host plants, such as coffee, cacao (Theobroma cacao), and tea, are prevalent[7,40]. Moreover, these findings suggest an ecological overlap between the climatic requirements of R. speculum and the native vegetation of East Asia. This vegetation includes Cercidiphyllum japonicum Siebold & Zucc. and Albizia julibrissin Durazz., which thrive in conditions exceeding an annual mean temperature of 8–12°C and 1,500 mm of annual rainfall[41,42]. However, these patterns should not be interpreted as definitive physiological thresholds or direct ecological constraints, as they reflect statistical associations inferred from the model outputs rather than experimentally validated species responses. Nevertheless, regions characterized by comparable climatic conditions, including parts of South America, Africa, and Southeast Asia, may warrant attention as areas of potentially suitable habitat under current and future climates.
Notably, the expansion of R. speculum into northern South America and the Congolese basin by 2081–2100, particularly under the SSP 585 scenario, suggests high adaptability to warming trends. Furthermore, the projected shift of suitable habitats toward eastern China and the northern Korean Peninsula indicates a substantial northward expansion of the risk zone. This trend is particularly concerning because the cultivation areas for major economic crops, such as coffee, cacao, and tea, are also expected to migrate northward or toward higher latitudes in response to climate change[43]. The concurrent northward expansion of R. speculum implies that these vital agricultural sectors will face sustained infestation pressures, even in newly established cultivation zones. Consequently, temperate fruit orchards and forest plantations in these regions are increasingly exposed to this invasive planthopper. The distinct divergence between SSP 245 and SSP 585 in later periods emphasizes that the extent of future agricultural and ecological vulnerability will be fundamentally shaped by the trajectory of global greenhouse gas emissions.
Climate change may alter the geographic distribution of both climatically suitable regions for R. speculum and areas that are favorable for economically important crops. Considering that this invasive planthopper is likely to colonize new cultivation areas as soon as they become climatically viable, early warning systems based on real-time bioclimatic monitoring must be prioritized[44]. Because some projected suitabile regions overlap with areas where crops such as coffee, cacao, and tea are currently cultivated or may become climatically suitable in the future, these regions could experience increased exposure to pest-related risks. For example, in regions such as the northern Korean Peninsula and Eastern China, where new suitable habitats are emerging, biosecurity protocols may be required for pioneer populations that often precede large-scale infestations[45]. However, such overlap should not be interpreted as evidence of synchronized migration or direct ecological coupling between pest populations and agricultural systems, as the present study did not explicitly model crop distributions, host availability, dispersal processes, or biotic interactions. Instead, these findings should be viewed as preliminary indications of regions where future monitoring and risk assessment may be warranted.
-
This study evaluated the potential habitats of R. speculum by applying XGBoost, an algorithm rarely used in SDM, along with MaxEnt and RF. By comparing the results of these algorithms, species occurrence areas were robustly identified according to different climate change scenarios, and the preferred climatic conditions closely overlapped with major economic crops and trees. Despite these insights, this study had some limitations that should be addressed in future research. Although the models show high predictive consistency for South America and Africa, the divergence and conservative estimates in Europe suggest that nonclimatic factors, such as land use changes, host plants' availability, and biological interactions, play a key role. Therefore, integrating these variables into subsequent models is essential for enhancing predictive accuracy. Despite the inherent uncertainties of long-term climate scenarios, these results provide a critical framework for the development of cross-border monitoring systems and adaptive management strategies. Collectively, by identifying high-risk zones, this study serves as a foundational tool for mitigating the global spread of this invasive pest and protecting both natural ecosystems and agricultural productivity.
Not applicable.
-
None to declare.
-
The authors confirm contribution to their paper as follows: study conception and design: Kim DH, Lee WH; data collection, draft manuscript preparation: Kim DH; analysis and interpretation of results: Kim DH, Kim GY, Jung S; software development, visualization: Kim DH, Kim GY; critical revision and editing, supervision: Lee WH; funding acquisition and resources: Jung S, Lee WH. All authors reviewed the results and approved the final version of the manuscript.
-
The datasets generated during and/or analyzed during the current study are available from the corresponding author on reasonable request.
-
The authors declare no conflicts of interest.
-
accompanies this paper online at https://doi.org/10.48130/jzser-0026-0003.
- Supplementary Fig. S1 Future potential distribution of R. Speculum predicted by MaxEnt with SSP245 and 585 climate change scenarios: (a) 2014-2060, (b) 2061-2080, and (c) 2081-2100.
- Supplementary Fig. S2 Future potential distribution of R. Speculum predicted by Random Forest with SSP245 and 585 climate change scenarios: (a) 2014-2060, (b) 2061-2080, and (c) 2081-2100.
- Supplementary Fig. S3 Future potential distribution of R. Speculum predicted by XGBoost with SSP245 and 585 climate change scenarios: (a) 2014-2060, (b) 2061-2080, and (c) 2081-2100.
- Copyright © 2026 by the author(s). Journal of Zoological Systematics and Evolutionary Research published by Maximum Academic Press on behalf of John Wiley & Sons Ltd. This is an open access article under the terms of the Creative Commons Attribution License, which permits use, distribution and reproduction in any medium, provided the original work is properly cited.
-
About this article
Cite this article
Kim DH, Kim GY, Jung S, Lee WH. 2026. Comparative species distribution modeling of Ricania speculum: Predicting global invasion risks and bioclimatic vulnerability. Journal of Zoological Systematics and Evolutionary Research 2026: e002 doi: 10.48130/jzser-0026-0003 

Comparative species distribution modeling of Ricania speculum: Predicting global invasion risks and bioclimatic vulnerability
- Received: 07 April 2026
- Revised: 28 May 2026
- Accepted: 15 June 2026
- Published online: 22 July 2026
Journal of Zoological Systematics and Evolutionary Research
2026,
Article number: e002 (2026)
|
Cite this article
Abstract: This study evaluated the potential global distribution of the invasive planthopper Ricania speculum under current and future climate change scenarios. To ensure robust predictions, a multialgorithmic approach was taken, integrating XGBoost, which is an advanced machine learning technique rarely used in species distribution modeling (SDM), with MaxEnt and Random Forest. The performance evaluation revealed that all models exhibited high predictive accuracy that exceeded 0.85 true skill statistics for all three algorithms. Under current climate conditions, the three algorithms predicted high habitat suitability across 8.9%–11.1% of the global terrestrial area (excluding Antarctica), with 7.6% of the total world area identified as suitable by a weighted ensemble approach. The key areas of suitability were concentrated in Eastern and Southern Asia, northern South America, the Mediterranean coast, and coastal regions of Central Africa. Under the SSP585 climate change scenario, a consistent northward shift and range expansion was projected, with the ensemble suitable area increasing to 18% of the total world area by 2090. This represents a 2.4-fold increase relative to the current conditions. These findings emphasize the growing invasion risk posed by R. speculum under accelerating climate change. Moreover, these results provide a valuable scientific basis for the development of proactive pest management and biosecurity strategies. Furthermore, this study highlights the applicability of XGBoost, an algorithm with previously limited application in SDM, as a viable methodological option, thereby suggesting its potential for extensive adoption in future studies.