













-
Accessory chromosomes (ACs), also known as dispensable or supernumerary chromosomes, typically exhibit lineage-specific distribution and serve as a critical reservoir for genome plasticity and adaptive evolution[1]. They have been identified in over 25 fungal species, most of which are plant pathogenic ascomycetes, including Magnaporthe oryzae, Fusarium oxysporum, Alternaria alternata, and Zymoseptoria tritici[2]. In these well-studied systems, ACs are typically repeat-rich, structurally unstable, and frequently associated with virulence, host specificity, secondary metabolism, or non-Mendelian inheritance[1,3]. Representative examples include SIX effectors in F. oxysporum[4], host-specific toxin loci in A. alternata[5], and genes involved in detoxification of plant defense compounds in Nectria haematococca[6]. By contrast, much less is known about ACs in non-pathogenic fungi, particularly among basidiomycetes.
Recent work in Tremella fuciformis showed that basidiomycete ACs also share key features with their ascomycete counterparts, including small size, transposon-rich, gene-poor, and structural dynamism[7]. However, their biological roles remain largely unknown. Aneuploidy is increasingly recognized as a key driver of fungal adaptation, contributing to antifungal resistance, stress tolerance, and rapid phenotypic diversification under selection[8]. In several fungi, this numerical instability is genome-wide, with ACs coexisting with aneuploidy in core chromosomes (CCs). In Z. tritici, both compartments undergo pervasive copy-number variation (CNV) during meiosis, more frequently in ACs[9], while ACs also remain highly unstable during vegetative growth alongside structural and numerical variation in CCs[10]. Similar coexistence has been observed in basidiomycetes T. fuciformis[11] and Wolfiporia hoelen[12]. However, whether ACs merely co-occur with CC aneuploidy or actively contribute to its generation remains unresolved.
A further layer of complexity arises in multinucleate fungi, where chromosome compositions may differ among coexisting nuclei. Recent evidence from two multinucleate ascomycetes, Sclerotinia sclerotiorum and Botrytis cinerea, has shown that irregular chromosome partitioning can generate haploid nuclei with distinct chromosomal compositions within a single coenocytic mycelium[13]. In these cases, chromosomal heterogeneity arises from differences among individual haploid nuclei, representing a dramatic form of chromosomal variation and highlighting one extreme of chromosomal heterogeneity in multinucleate fungi. However, whether a similar phenomenon of distinct chromosomal compositions occurs in basidiomycetes has yet to be elucidated, and its potential origin and functional impact remain unclear.
W. hoelen provides a tractable system for addressing these questions. This medicinal basidiomycete features a bipolar mating system, a heterothallic life cycle, and multinucleate mycelia in both homokaryotic and heterokaryotic states[14]. Our previous genomic analyses identified a candidate AC based on sequence characteristics[15], and subsequent work reported the presence of aneuploidy across different strains[12]. However, the dispensability of this AC, its interplay with chromosomal variation, and the phenotypic consequences remain unresolved. Such unresolved questions present a unique opportunity to understand the role and impact of ACs in basidiomycetes.
Here, we generated three telomere-to-telomere (T2T) genome assemblies of W. hoelen. Comparative synteny analysis and population resequencing identified a dispensable AC with a non-canonical genomic profile. Single nucleotide polymorphism (SNP) analysis, long terminal repeat (LTR) insertion dating, and comparative genomics further revealed that it originated recently from endogenous CC fragments and then underwent transposable element-associated expansion and structural remodeling. Benomyl-based chromosome loss, phenotypic assays, and transcriptomic analyses revealed that, while the AC imposed a dosage-dependent cost during vegetative growth, it was associated with chromosome transmission instability in sexual progeny, promoting CC aneuploidy and increased heterozygosity, which conferred heterozygote advantage and enhanced growth. Analyses of heterozygous progeny integrating T2T genome assemblies, SNP allele-frequency profiling, Hi-C interaction mapping, and laboratory evolution experiments revealed distinct chromosomal compositions across nuclei, which may facilitate phenotypic flexibility and environmental adaptation. Together, these findings reveal that an AC in a non-pathogenic basidiomycete mediates a phase-specific trade-off between vegetative fitness and adaptive genomic diversification.
-
The heterokaryotic strain W. hoelen 776 (CGMCC 5.545), a commercial cultivar from China and the parental strain of the homokaryotic strain SS20 whose genome has been previously published[15], was cultured to induce fruiting bodies (Supplementary Fig. S1). No evidence of non-fungal horizontal gene transfer (HGT) was detected using the method described in the Supplementary File 1. Monosporic and protoplast-regenerated strains were isolated following our previously described method[14]. Homokaryotic strains were identified by SNP analysis of the rpb2 gene[14].
Library construction and sequencing
-
All sequencing datasets used in this study were summarized in Supplementary Table S1. Genomic DNA for sequencing was extracted using the CTAB method[16]. Short-read NGS libraries with an average insert size of 350 bp were prepared following MGISEQ standard protocols and sequenced on the DNBSEQ-T7 platform.
For Hi-C sequencing, mycelia were freshly collected, and genomic DNA was fixed in vivo by crosslinking with 2% formaldehyde. The crosslinked material was then ground in liquid nitrogen and resuspended in extraction buffer to release nuclei. Hi-C library construction followed a published DpnII-based protocol[17]. The final Hi-C libraries were quantified and sequenced together with the NGS libraries on the DNBSEQ-T7 platform.
For HiFi sequencing, high-quality genomic DNA was extracted using the QIAGEN® Genomic Kit (Qiagen) according to the manufacturer's instructions. A ~20 kb SMRTbell library was constructed following PacBio's standard protocol, evaluated on the Agilent 2100 Bioanalyzer, and sequenced on the PacBio Sequel II system.
For ONT ultra-long sequencing, high-molecular-weight DNA was extracted using the BAC-long DNA Kit (Promega Wizard). A total of 8–10 µg of genomic DNA was size-selected using the SageHLS HMW system to enrich fragments > 50 kb, followed by library preparation using the Ligation Sequencing 1D Kit (SQK-LSK109, Oxford Nanopore Technologies). Approximately 400 ng of DNA was used for final library construction, which was sequenced on the PromethION platform at the Genome Center of Grandomics (Wuhan, China).
For transcriptome sequencing, strains were cultured on PDA for 5 d before RNA extraction. Total RNA was extracted using TRIzol reagent. Poly(A) RNA was enriched using the Dynabeads mRNA Purification Kit and used to construct cDNA libraries with the MGIEasy RNA Library Prep Kit v3.1. Library quality was assessed using an Agilent 2100 Bioanalyzer. The final single-stranded circular DNA libraries were sequenced on the DNBSEQ-T7RS platform by Nextomics Biosciences Co., Ltd (Wuhan, China).
Genome assembly, gap filling, and error correction
-
Genome assembly and polishing were performed following the combined strategy previously described[18]. Initially, Hi-C reads were filtered using fastp v0.20.0[19] with default parameters. PacBio raw reads were filtered using CCS software (
https://github.com/PacificBiosciences/ccs , accessed on 20 November 2022) and were then used to generate HiFi draft assemblies by hifiasm v0.13 with Hi-C data[20], Falcon v1.8.1[21], and Canu v2.2[22]. ONT ultra-long draft assembly was generated using NextDenovo v2.52[23].Gaps in the final assemblies were manually inspected and closed based on whole-genome alignment results, and the corrected regions were further validated using sequencing coverage depth and Hi-C contact data. Hi-C interaction heatmaps were generated using HiC-Pro v2.8.1[24], and potential 40-kb centromeric regions on each chromosome were identified based on the Hi-C interaction patterns. Genomic synteny between assemblies was assessed by pairwise alignment using GenomeSyn[25].
rDNA assembly and genome polishing
-
The copy number of rDNA was estimated using a BLAST-based method[26] with PacBio data. The rDNA assembly was generated using Canu, followed by manual connections based on variations in the intergenic spacer region. Regions with anomalous local coverage, indicative of potential assembly errors, were identified by mapping PacBio reads to the SS20 assembly using Blasr[27] and manually corrected until the genome coverage was normalized.
Genome quality assessment
-
The completeness of the genome assembly was assessed with BUSCO v4.0.3[28] using the basidiomycota_odb10 lineage data. The quality of the genome assembly was further evaluated with the LTR Assembly Index (LAI), which quantified the completeness of LTR retrotransposons within the genome using LTR_retriever[29]. Base accuracy of the assembly was verified using Merqury v1.3[30] through the k-mer method.
Intact LTR identification and insert time estimation
-
Intact LTR retrotransposons were identified using LTR_finder[31] and LTR_harvest[32], then filtered and integrated by LTR_retriever[29] with default parameters. The insertion time of all intact LTR retrotransposons was estimated by LTR_retriever, utilizing the formula (T = d/2r), where d represents the sequence divergence between the paired 5′ and 3′ LTRs of each intact LTR retrotransposon, and r represents the nucleotide substitution rate. The mutation rate (2.0 × 10⁻⁸ per nucleotide per generation) used here for insert time estimation was derived from the resequencing analysis of parental and offspring of Schizophyllum commune[33]. To estimate the timing of telomere acquisition and sequence homogenization on the AC, we extracted the 5' terminal 10-kb region of Chr15, removing the first 300 bp to minimize variation in telomere repeat copy number. The corresponding 3' terminal regions of Chr05 and Chr15 were then selected for pairwise comparison. After excluding insertion fragments, sequence identity was calculated and used to infer the timing of these events.
Repeat annotation, gene prediction, and annotation
-
Repetitive elements were annotated using a custom repeat library combining LTR retrotransposons identified by LTR_retriever with consensus repeats predicted by RepeatModeler[34]. Unknown repetitive sequences in these predictions were further classified using DeepTE[35], and the curated library was then used as input to RepeatMasker[36] for genome-wide repeat masking. Gene prediction and annotation were performed using the Funannotate pipeline (
https://funannotate.readthedocs.io , accessed on 10 April 2022). Secondary metabolite gene clusters were identified using fungal antiSMASH v7.0[37]. KEGG and GO enrichment analyses were performed using TBtools[38]. KEGG pathway and GO term annotations were assigned based on the Kyoto Encyclopedia of Genes and Genomes database[39] and the Gene Ontology database[40], respectively. Putative non-fungal horizontal gene transfer candidates were identified using a refined BLAST-based strategy[41], as described in the Supplementary information (Supplementary Fig. S2).Detection of chromosomal aneuploidy
-
NGS reads were filtered by fastp v0.20.0[19] with default parameters and mapped to the reference genome using Bowtie v2.3.2[42]. Duplicated read pairs caused by PCR were removed by Picard v2.1 (
https://broadinstitute.github.io/picard , accessed on 13 June 2024). Genome coverage in 10 kb bins was calculated using Sambamba v1.0.1[43] and normalized using a Python script. The median of the normalized coverage for each chromosome was used to determine its ploidy status, following the criteria outlined by Fouché et al.[9]. Normalized coverage ≤ 0.3 indicated absence and ≥ 1.3 aneuploidy.SNP calling
-
Variant calling across all samples was executed using GATK v4.5.0.0[44]. SNP filtration was conducted by applying the following hard-filtering parameters: 'QD < 2.0 || MQ < 40.0 || FS > 60.0 || SOR > 3.0 || MQRankSum < −12.5 || ReadPosRankSum < −8.0', as recommended by the official guidelines. The final set of refined SNPs was extracted using bcftools v1.8[45], and allele frequencies were calculated using a Python script.
Origin of chromosomal aneuploidy
-
The origin of aneuploidy was inferred from SNP heterozygosity profiles. Overall chromosomal heterozygosity was first used to distinguish meiotic from mitotic aneuploidy, with homozygous chromosomes classified as mitotic and heterozygous chromosomes as meiotic. For events inferred to arise during meiosis, centromeric heterozygosity was then examined to discriminate errors in meiosis I vs meiosis II.
Multiplex PCR
-
The unique single-copy genes on each chromosome were identified through all-by-all alignments. One unique single-copy gene was randomly selected from each chromosome as a candidate. Primers targeting these candidate genes were designed using Primer3[46], and the specificity of each primer set for its respective chromosome was confirmed by individual PCR reactions. Fifteen primer pairs (Supplementary Table S2) were combined into a single PCR reaction, each targeting a single-copy gene on different chromosomes and amplifying fragments of varying sizes ranging from 139 to 1,359 bp, thereby generating a ladder of products.
Multiplex PCR was carried out using the Qiagen Multiplex PCR Kit (Cat. No.206143, Qiagen, Hilden, Germany). Each 25 µL reaction mixture consisted of 12.5 µL of PCR Master Mix, 1 μM of an equimolar primer mixture, and 100 ng of gDNA. The thermal cycling protocol began with an initial activation at 95 °C for 15 min, followed by 25 cycles of 30 s at 94 °C for denaturation, 90 s at 62 °C for annealing, and 90 s at 72 °C for extension, with a final extension at 72 °C for 10 min. For the analysis of the multiplex PCR products, gel electrophoresis was performed on 1.8% agarose gels in 1 × TAE buffer, loading 3 µL per well. The gels were run at 100 V for 4 h. Band intensities were visualized using a UV Transilluminator (UV-15, Labgic, Beijing, China) and quantified as an indicator of the chromosome copy number.
Phylogenetic analysis
-
Single-copy orthologous genes of W. hoelen and six related Polyporales species (Supplementary Table S3) were identified using OrthoFinder v2.5.4[47]. To construct the phylogenetic tree, amino acid sequences of these genes were aligned with MUSCLE v3.8.31[48]. The alignments were then refined by screening for conserved sequences using Gblocks v0.91b[49] and combined into supergenes with SeqKit v2.2.0[50]. The optimal model was identified using ProtTest v3.4.2[51]. Finally, maximum-likelihood phylogenetic trees were constructed using RAxML-NG v0.9.0[52] and visualized via FigTree v1.4.4 (
https://github.com/rambaut/figtree , accessed on 20 May 2023).Similarity and collinearity of telomeres
-
To investigate recombination among chromosome ends, we extracted the terminal 10 kb from both the 5′ and 3′ ends of each chromosome and performed pairwise BLASTN searches. Only hits with an E-value of 0 were retained. For each pair of terminal segments, we quantified telomeric similarity using a coverage-normalized, length-weighted percent identity:
$ Similarity=\dfrac{\sum\nolimits_{i}({L}_{i}\times {PID}_{i})}{{L}_{total}} $ where
$ {L}_{i} $ $ i $ $ {\text{PID}}_{i} $ $ {L}_{\text{total}} $ Generation and confirmation of AC-loss mutants and matched heterokaryotic pairs
-
We induced AC loss using a benzimidazole fungicide as described previously[53]. Progeny strains were subjected to benomyl stress (50 µg/mL) followed by successive subculturing. At each passage, actively growing mycelium from the colony margin was transferred to fresh medium containing benomyl. Candidate AC-loss derivatives were screened by diagnostic PCR using four primer pairs targeting AC-specific fragments (Supplementary Table S4), and AC loss was further confirmed by whole-genome resequencing. Using this approach, two AC-loss progeny strains were obtained, designated 7S32L and 7S45L.
To directly evaluate the functional impact of AC loss in heterokaryotic backgrounds, we generated four pairs of matched heterokaryotic strains that differed only in AC retention. For each pair, a wild-type monosporic isolate lacking the AC (1695SS11 and 1675SS09) was crossed with either an AC-retaining sibling (7S32 and 7S45) or the corresponding AC-loss derivative (7S32L and 7S45L), respectively, thereby producing AC-containing and AC-lost heterokaryotic strains with a shared genetic background. AC status of the resulting heterokaryotic strains was determined using the same AC-specific PCR assays. These matched pairs were used for growth assays on pine sawdust and PDA and for stress assays.
RNA-seq data analysis
-
To investigate the functional consequences of AC loss, fungal mycelia of strains 1695SS11 × 7S45, 1695SS11 × 7S45L, 1695SS11 × 7S32, and 1695SS11 × 7S32L were collected from PDA cultures after 4 d of incubation at 28 °C. Fresh mycelia were immediately frozen in liquid nitrogen and homogenized for total RNA extraction. Three independent biological replicates were prepared for each isolate.
RNA-seq reads were quality filtered using fastp and aligned to the T2T-SS20 reference genome using HISAT2 v2.2.1[54]. Gene-level read counts were quantified with featureCounts v2.0.6[55]. Principal component analysis was performed on normalized gene expression data to assess overall transcriptional variation and sample clustering. Differential gene expression analysis was subsequently conducted using DESeq2. For highly similar AC genes, transcript abundance was quantified and adjusted using Salmon[56] to account for ambiguous read mapping among homologous sequences.
Statistical analysis
-
Prior to statistical analyses, all phenotypic and physiological datasets were tested for normality using the Shapiro–Wilk test and for homogeneity of variance using Levene's test. For normally distributed data with equal variances, differences between two groups were evaluated using independent-samples t-tests. If the assumption of equal variances was violated, Welch's t-test was performed. For data that did not meet the assumption of normality, the Mann–Whitney U test was applied. All statistical analyses were performed in SPSS Statistics v20. For linear mixed-effects models (LMMs), p values were obtained from Wald tests and were adjusted for multiple testing using false discovery rate (FDR) correction.
-
Our previous assembly of the homokaryotic strain SS20 remained fragmented, with 14 chromosomes containing seven gaps and incomplete rDNA sequences[15]. In this study, we reassembled SS20 and generated a gap-free assembly using hifiasm (see Supplementary information for details). The resulting T2T assembly (T2T_SS20) comprises 15 chromosomes totaling 59.61 Mb, with an N50 of 4.11 Mb. We successfully reconstructed 29 complete rDNA units spanning 0.67 Mb (Supplementary Fig. S3a). Through manual correction, local coverage irregularities and seven gaps in the previous draft were resolved (Supplementary Fig. S4).
Annotation identified 13,789 protein-coding genes and 25.57 Mb of repeats (44.37% of the genome), unevenly distributed across chromosomes (Fig. 1a; Supplementary Table S5). Compared with the 10 currently available W. hoelen assemblies, T2T_SS20 exhibited superior assembly quality (Supplementary Table S6), with a higher contig N50, a complete set of 15 chromosomes with 30 telomeres, and high BUSCO completeness (98.2%, Supplementary Table S7). In addition, the assembly showed exceptional accuracy and continuity, with a Merqury QV of 55.04 and an LAI score of 34.76. Remapping of NGS and PacBio reads showed uniform coverage, with mapping rates of 99.8% for PacBio and 97.8% for NGS (Supplementary Fig. S3b–S3d).
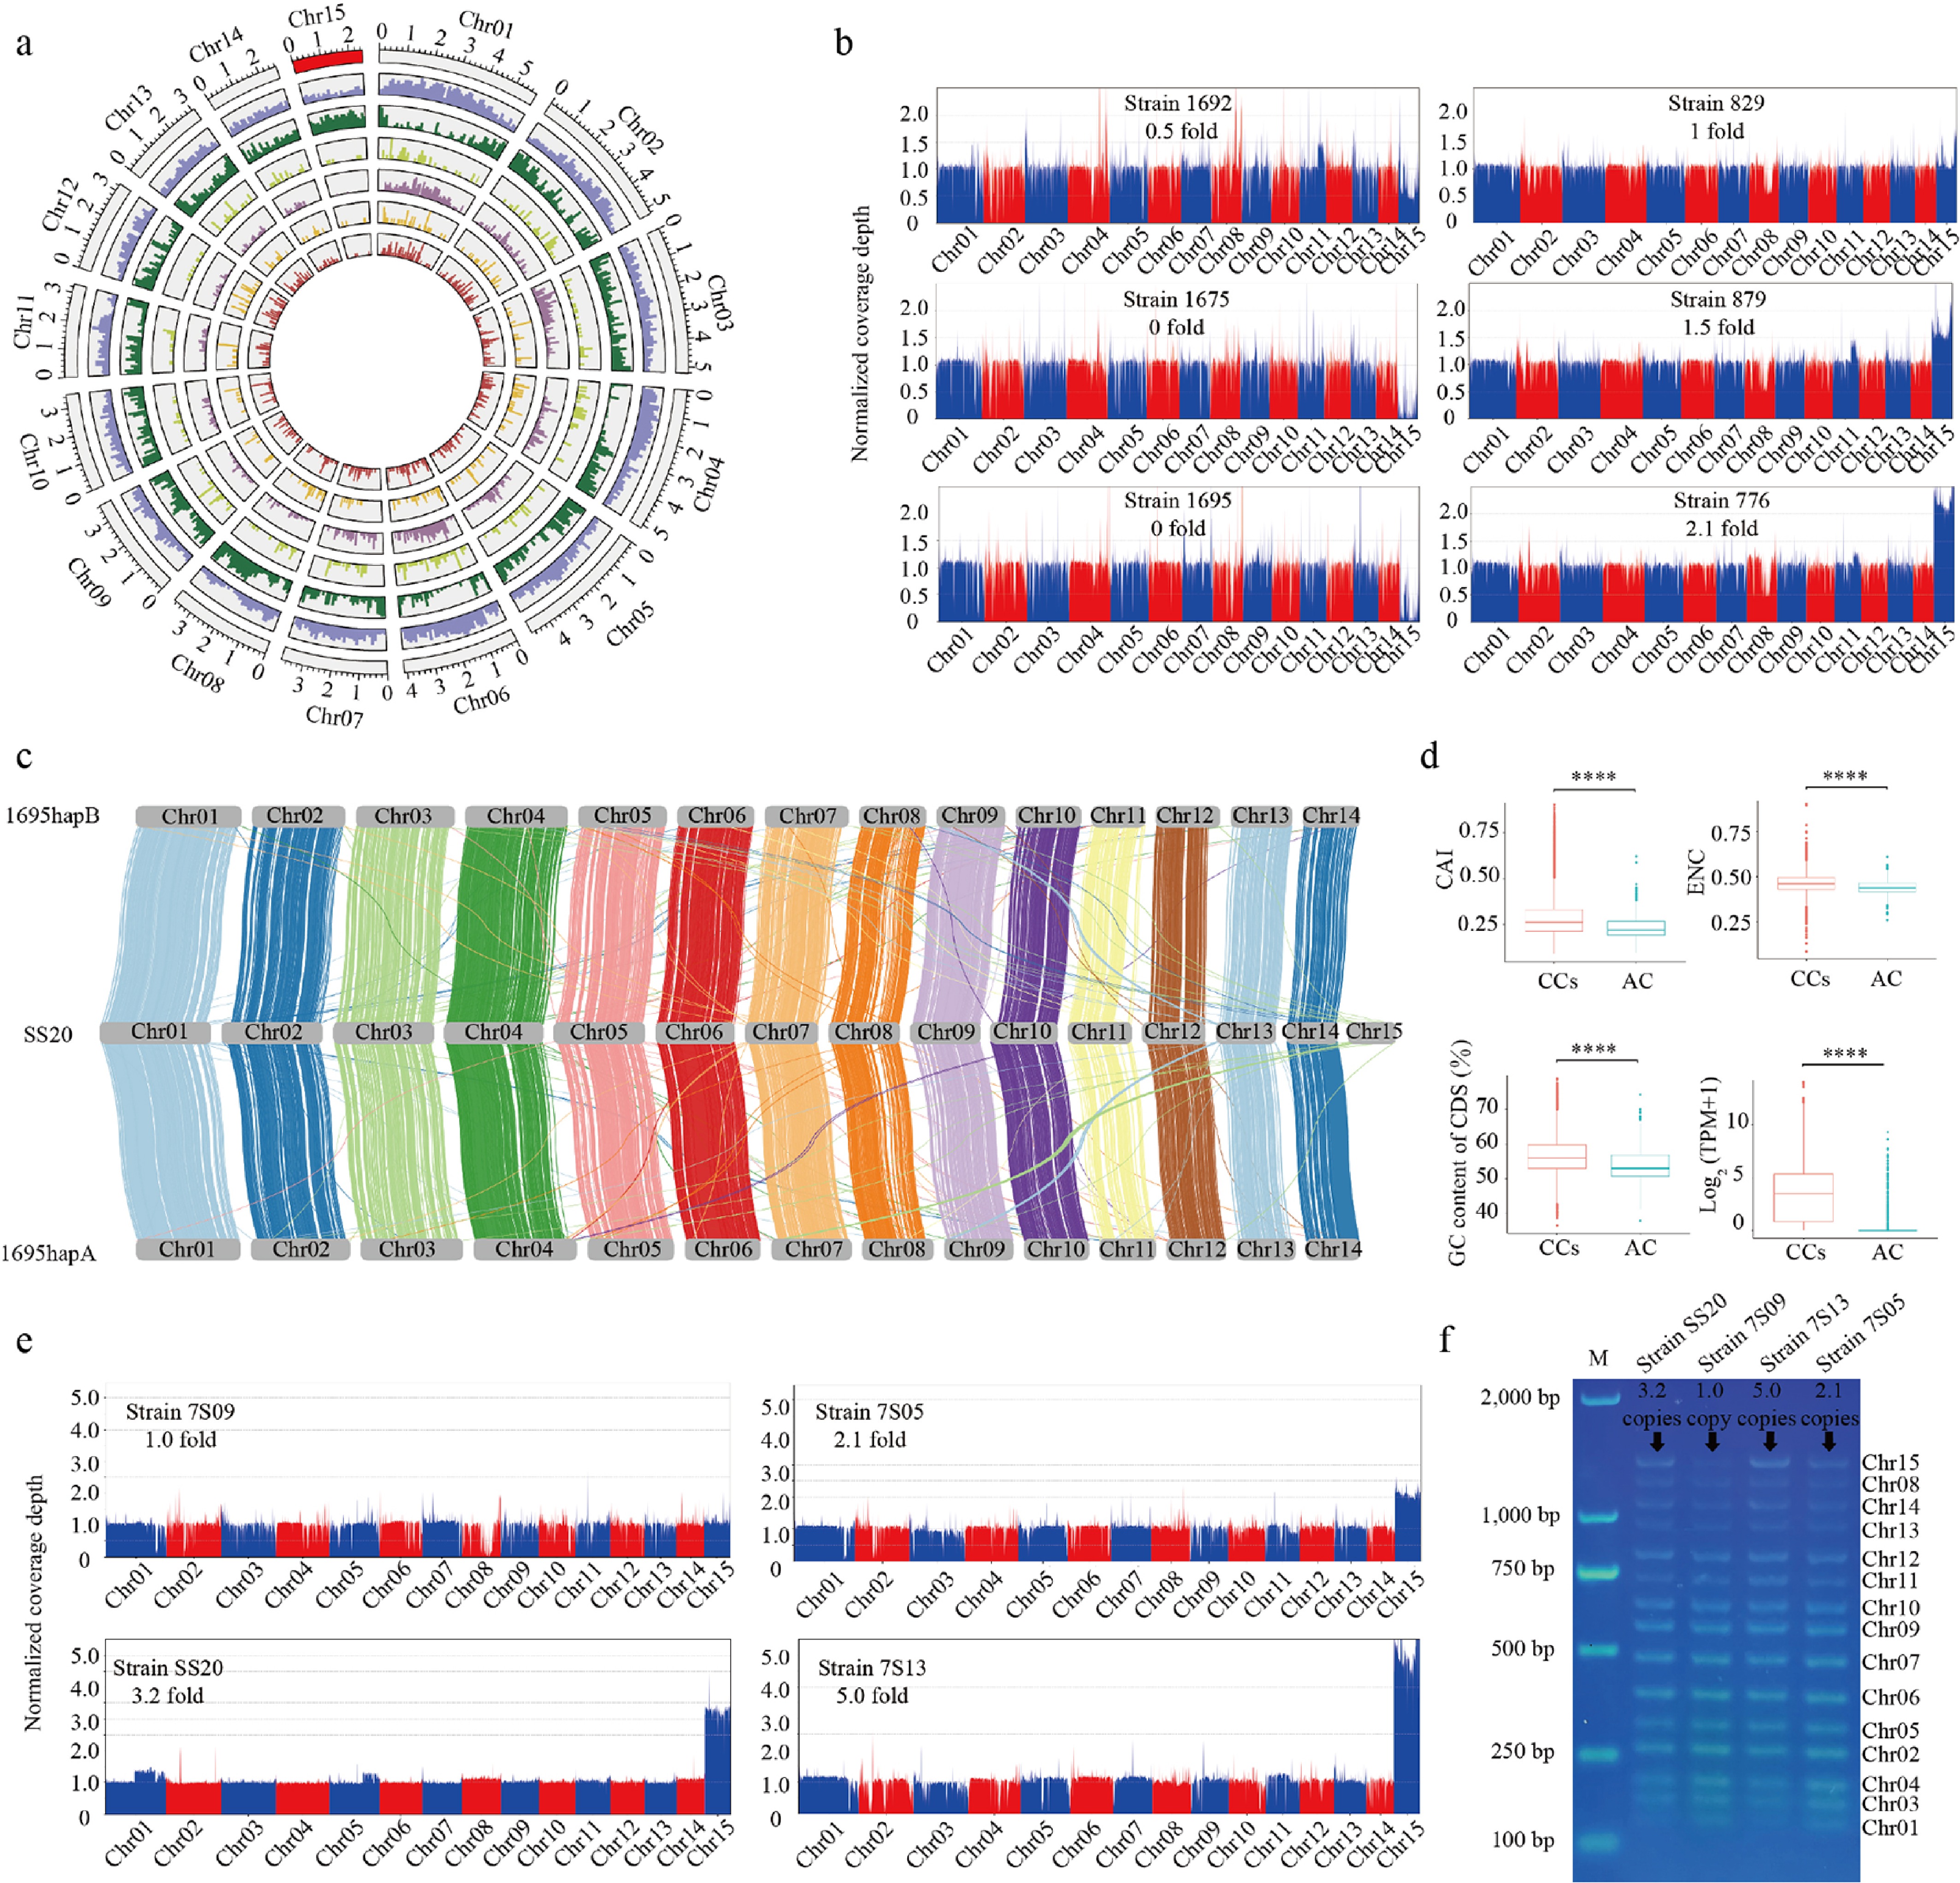
Figure 1.
Confirmation of Chr15 as an accessory chromosome (AC). (a) Circos plot of the T2T_SS20 genome. The AC is highlighted in red. Moving inward from the periphery, the tracks show chromosome length, gene density, repetitive sequences, proteases, BUSCO genes, CAZymes, and secretory proteins. (b) Detection of variable ploidy of AC in heterokaryotic strains using resequencing data. Six representative strains are shown here; the remaining 28 strains are presented in Supplementary Fig. S5. (c) Genome-wide synteny analysis comparing the two haplotypes of strain 1695 with the T2T_SS20 genome. (d) Codon usage bias of AC genes assessed using the Mann–Whitney U test. A total of 13,405 genes from CCs and 374 genes from the AC are analyzed (**** p < 0.0001). (e) Detection of variable ploidy of Chr15 in sexual progeny derived from strain 776 using resequencing data. Four representative strains are shown here; the remaining 23 strains are presented in Supplementary Fig. S6. (f) Different ploidy levels of AC detected by multiplex PCR. The inferred copy number of the AC based on resequencing coverage is indicated. Primer sets used are detailed in Supplementary Table S2. Increased band intensity corresponds to additional copies (indicated by arrowheads). M: marker; SS20, 7S09, 7S13, and 7S05 are the analyzed strains.
Chr15 is confirmed as an AC based on its genomic features, presence/absence polymorphism, and dosage plasticity
-
Chr15 exhibited typical AC features, including the lowest gene density (150/Mb) and highest repeat content (73.34%) among all chromosomes (Supplementary Table S5). Only three BUSCO genes were identified on Chr15, all being redundant copies of CC orthologs. CNV analysis of 34 heterokaryotic strains revealed both presence/absence polymorphism and dosage plasticity for Chr15, which was absent in strains 1675 and 1695 (Fig. 1b; Supplementary Fig. S5 and Supplementary Table S8) and ranged from 0.5 to 2.3 copies in the remaining strains.
To verify the absence of Chr15, we performed de novo assembly for the Chr15-lacking strain 1695 using HiFi data. Haplotype phasing, informed by a protoplast-derived monokaryon (Supplementary Table S9), generated two haplotype-resolved assemblies, hapA (56.18 Mb) and hapB (56.73 Mb), both comprising 14 T2T chromosomes (see Supplementary Information for details). Synteny analysis demonstrated high collinearity with CC01–CC14 of the T2T_SS20 reference, yet no intact Chr15 was detected in either haplotype, with only small, fragmented syntenic segments observed (Fig.1c). These results provide robust evidence supporting Chr15 as an AC.
Beyond these defining features, AC genes exhibited a distinct codon usage bias. Specifically, the effective number of codons (ENC), codon adaptation index (CAI), and GC content were significantly lower in AC genes than in CC genes, suggesting reduced translational adaptation. Consistent with this, transcriptome analysis showed that AC genes were expressed at significantly lower levels than CC genes (Fig. 1d).
Pronounced CNVs of the AC in sexual progeny
-
Having established Chr15 as a dispensable AC, we next investigated its transmission stability during sexual reproduction. Resequencing of 27 single-mating-type sexual progeny derived from strain 776 revealed substantial AC variations, ranging from 0.9 to 5.0 copies (mean 1.97 ± 0.85, coefficient of variation (CV) = 43.0%; Fig. 1e; Supplementary Fig. S6 and Supplementary Table S10). By contrast, CCs remained stable (mean 1.03 ± 0.04, CV = 3.4%). Variance comparison confirmed that AC copy number was significantly more variable than that of the CCs (F[26,26] = 586.0, p = 5.2 × 10⁻³⁰).
These results were independently validated by multiplex PCR, using primers listed in Supplementary Table S2, with band intensities scaling with inferred copy numbers (Fig. 1f). Although Mendelian segregation was not formally tested, as copy number was inferred from normalized read depth rather than allele counts, the observed AC CNVs were interpreted as evidence of irregular transmission, consistent with the non-Mendelian behavior commonly associated with ACs.
Expansion of chromosome segregation and recombination genes on AC suggests a role in chromosome transmission dynamics
-
Unlike ACs in pathogenic fungi, the W. hoelen AC encoded fewer secreted proteins, proteases, and CAZymes per megabase than any CC (Fig.1a), and lacked secondary-metabolite clusters or transcription factors (Supplementary Fig. S3a), indicating a functional trajectory distinct from pathogenicity-related ACs. Of the 374 predicted proteins, 212 clustered into 58 homologous groups (sequence identity > 0.6), indicating extensive gene duplication. Much of this duplication was associated with a ~0.77-Mb tandem array consisting of 11 repeat units, each harboring a conserved set of seven genes (Fig. 2a). We further identified a ~42.6-kb inverted repeat with 99.9% sequence identity (Fig. 2b), which also contributed to the gene duplication.
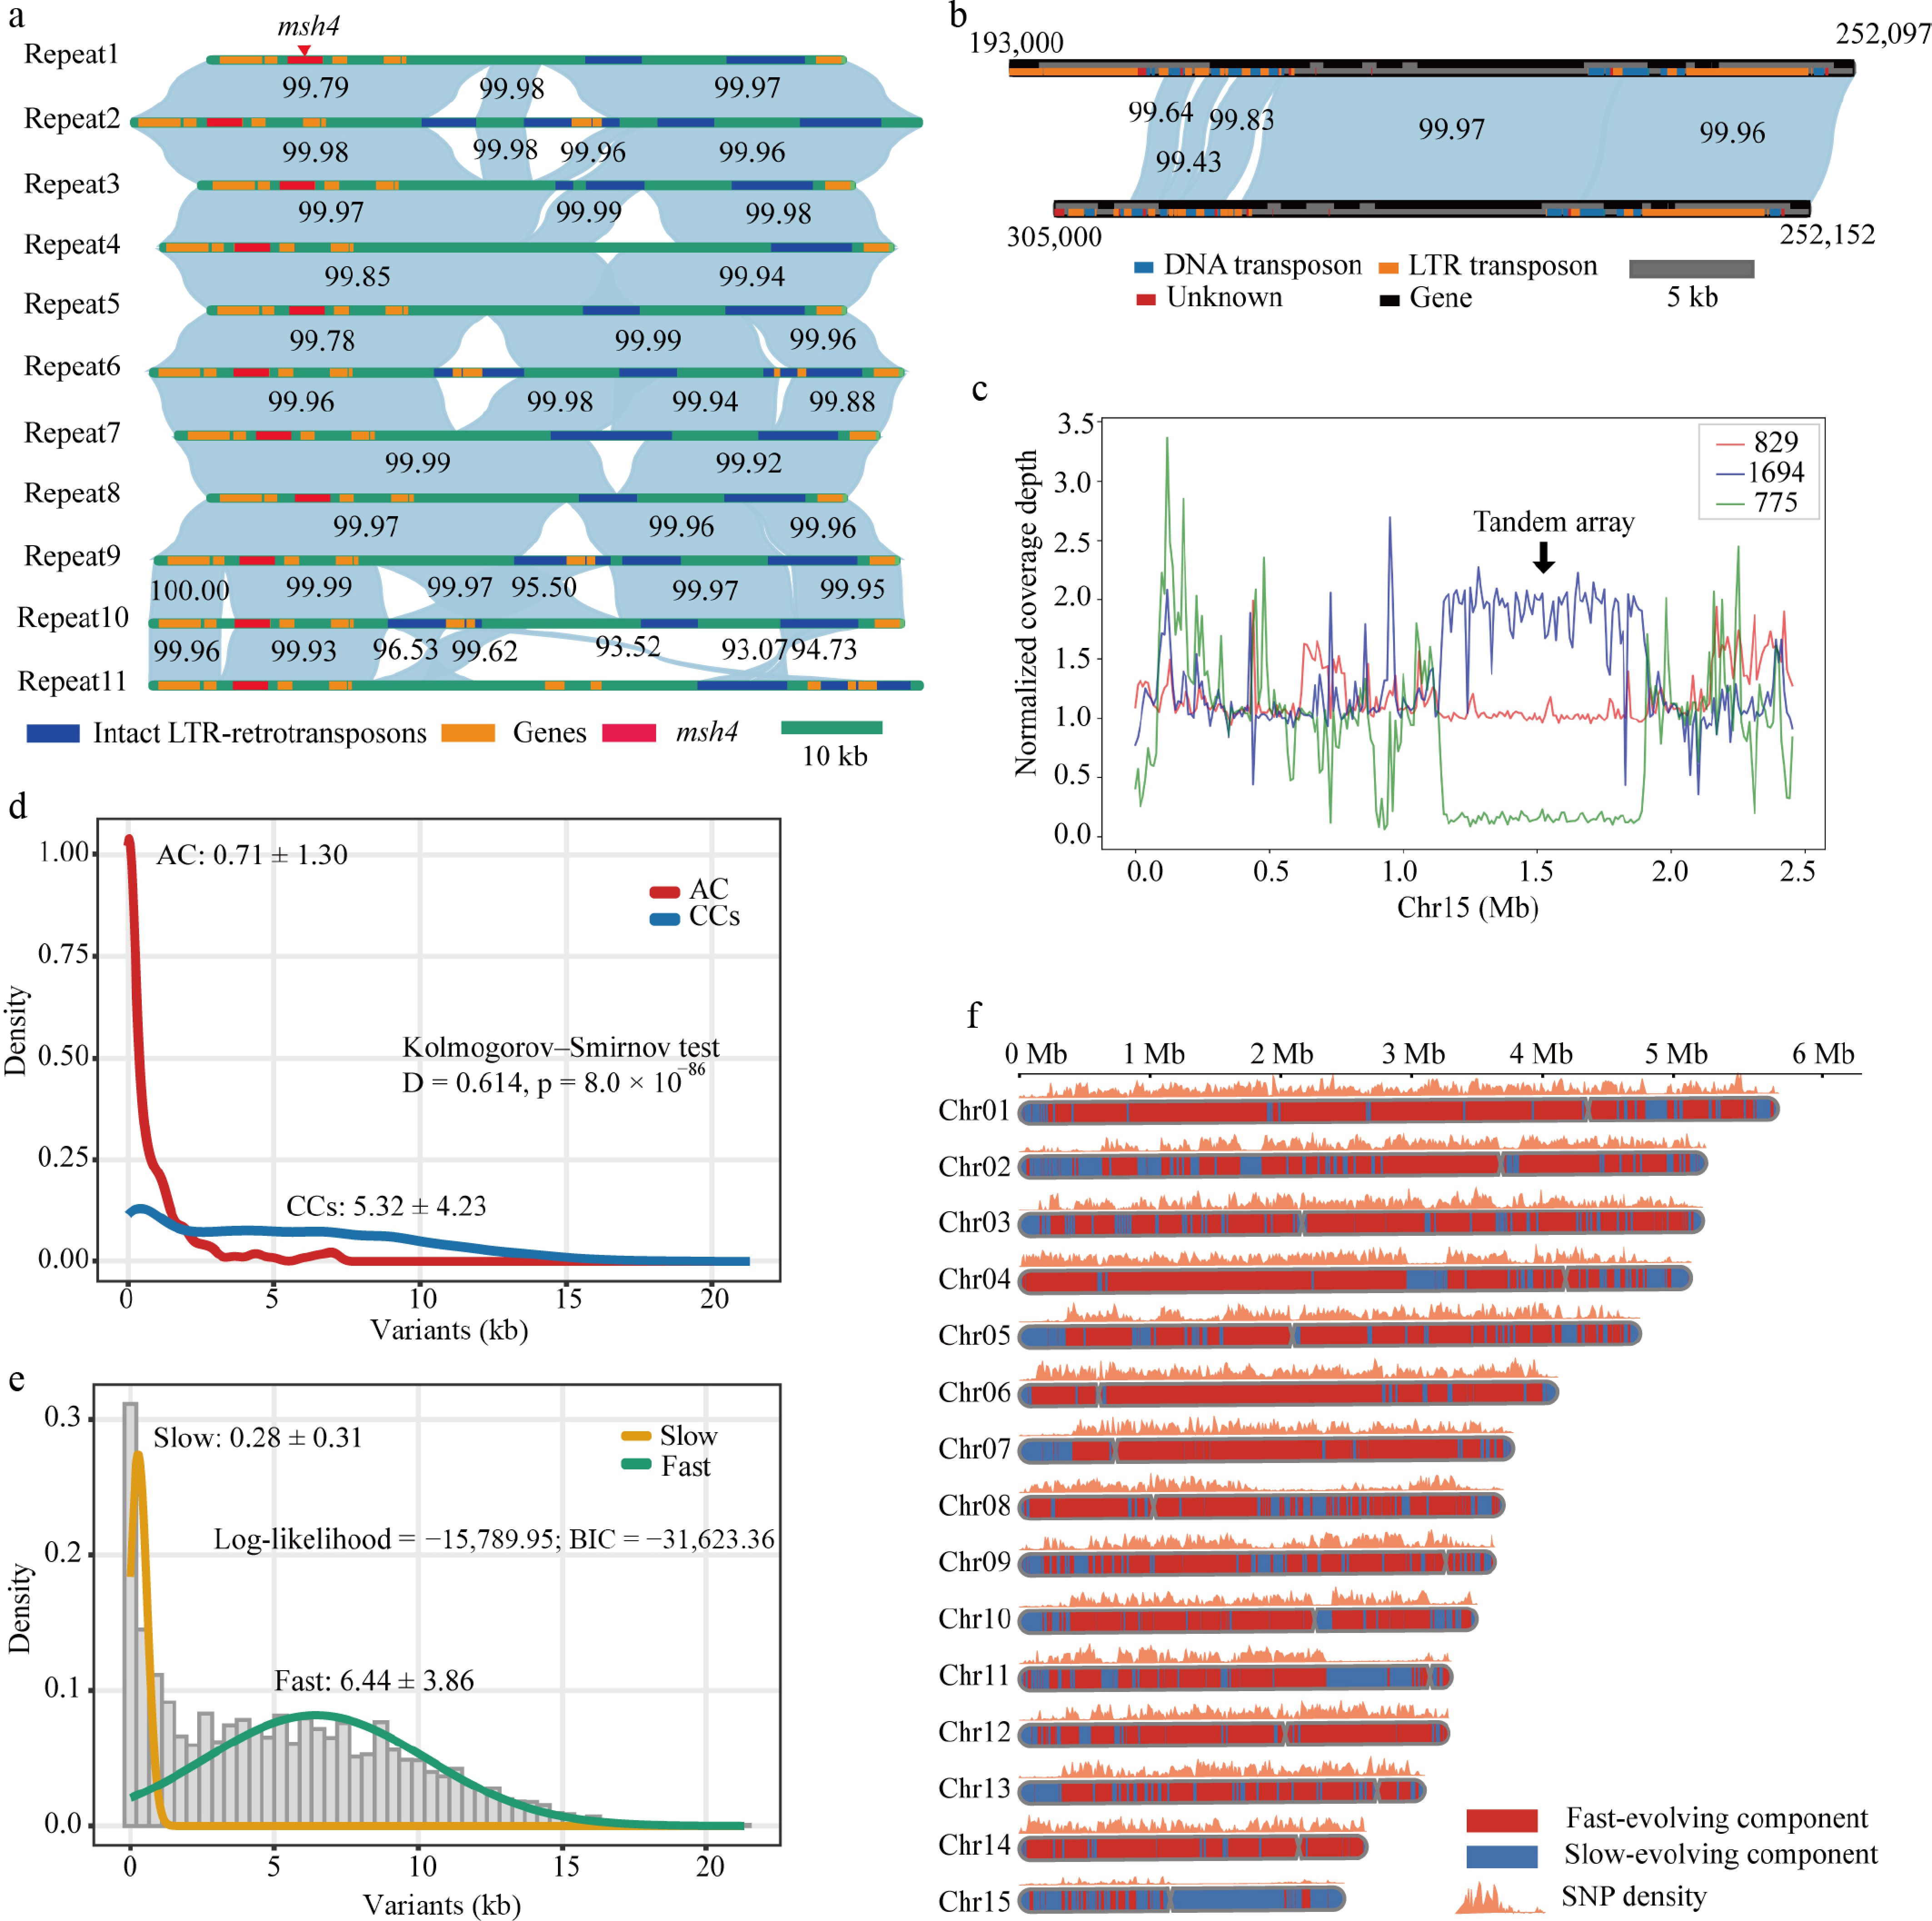
Figure 2.
Genomic features and evolution of the accessory chromosome (AC). (a) Tandem array structure on the AC. Pairwise alignments among the 11 tandem repeat units (Repeat1–Repeat11) on the AC reveal a high degree of collinearity and sequence identity. Shaded ribbons connect homologous regions between repeat units, with percentage sequence identity indicated. Gene models, including protein-coding genes, the msh4 locus, and intact LTR retrotransposons, are shown along each repeat unit. (b) Large inverted repeat structure on the AC. Sequence identity between the two inverted repeat arms is represented by the shaded ribbon. Colored tracks indicate annotated genomic features, including protein-coding genes and repeat elements. The numerical labels indicate the positions of structures on the AC. (c) Dosage plasticity of the tandem array across heterokaryotic strains. Strains 775, 829, and 1694 are heterokaryotic strains exhibiting different copy numbers of the tandem array. (d) Distribution of SNP density in AC and CCs. Distributions of SNP density (variants per kb) show that the AC exhibits a significantly lower SNP density than the CCs. (e) Histogram of SNP density in 10-kb windows, with two Gaussian components estimated using the Expectation–Maximization algorithm. (f) Distribution of fast- and slow-evolving regions across chromosomes.
KEGG analysis revealed that AC genes were significantly enriched in the pathway of chromosome and associated proteins (Supplementary Table S11). Consistently, genes involved in meiotic recombination and chromosome segregation were expanded, including eleven copies of msh4, a key facilitator of meiotic recombination[57], and two copies of nuf2, a critical chromosome-segregation factor[58]. In other systems, altered expression of these genes is linked to chromosome-segregation defects and aneuploidy[59,60]. All AC-encoded msh4 and nuf2 copies lacked intra-copy SNPs and retained intact functional domains, suggesting a recent expansion (Supplementary Fig. S7). The msh4 copies within the tandem array showed remarkable dosage plasticity across natural populations, ranging from ~1 copy in strain 775 to ~22 copies in strain 1694 (Fig. 2c). Transcriptomic data showed that AC-encoded nuf2 was expressed at a higher level than its CC orthologue (Supplementary Fig. S8), and that AC msh4 copies were also transcriptionally active, supporting a possible role for the AC in chromosome transmission dynamics.
The repeat-rich AC exhibits an atypically slow-evolving regime
-
Beyond this unusual functional specialization, we investigated whether the AC displays a distinct genome-wide evolutionary trajectory. Using a new assembly of strain SS20 as a reference, 305,782 high-quality SNPs were identified by SNP calling and filtering across 34 W. hoelen strains. Despite its high repeat density, the AC harbored only 1,780 SNPs, yielding a significantly lower SNP density than CCs (0.71 ± 1.30 vs 5.32 ± 4.23 variants/kb; p = 8.0 × 10−86; Fig. 2d). This observation contradicted the expectation from the classical two-speed genome model, where repeat-rich regions typically serve as fast-evolving compartments[61]. To categorize the evolutionary regimes, we applied a Gaussian Mixture Model (GMM) to SNP densities, resolving two discrete components corresponding to slow-evolving (0.28 ± 0.31 variants/kb) and fast-evolving (6.44 ± 3.86 variants/kb; Fig. 2e) regions. Most AC windows (74.9%, 185/247) were classified as slow-evolving, a proportion significantly higher than that in CCs (21.1%, 1,203/5,711; Pearson's chi-square test; p = 3.5 × 10−69; Fig. 2f). Together, these results indicate that the AC follows an atypically slow-evolving trajectory, deviating from the classical two-speed genome model. This pattern likely reflects a relatively recent origin, where insufficient time has elapsed for the accumulation of sequence divergence despite extensive repeat content.
Comparative genomics supports an endogenous origin and recent emergence of the W. hoelen AC
-
In strain SS20, 78.80% of the AC sequence matched the CCs, with 86.6% of the aligned blocks exceeding 1 kb (Fig. 3a) and a ~70 kb region exhibiting strong synteny with Chr02 (Fig. 3b). In the AC-absent strain 1695, two large CC regions (290 and 55 kb) exhibited high synteny and over 99% nucleotide identity with the SS20 AC (Fig. 3b), indicating substantial contributions of endogenous CC sequences to AC formation.
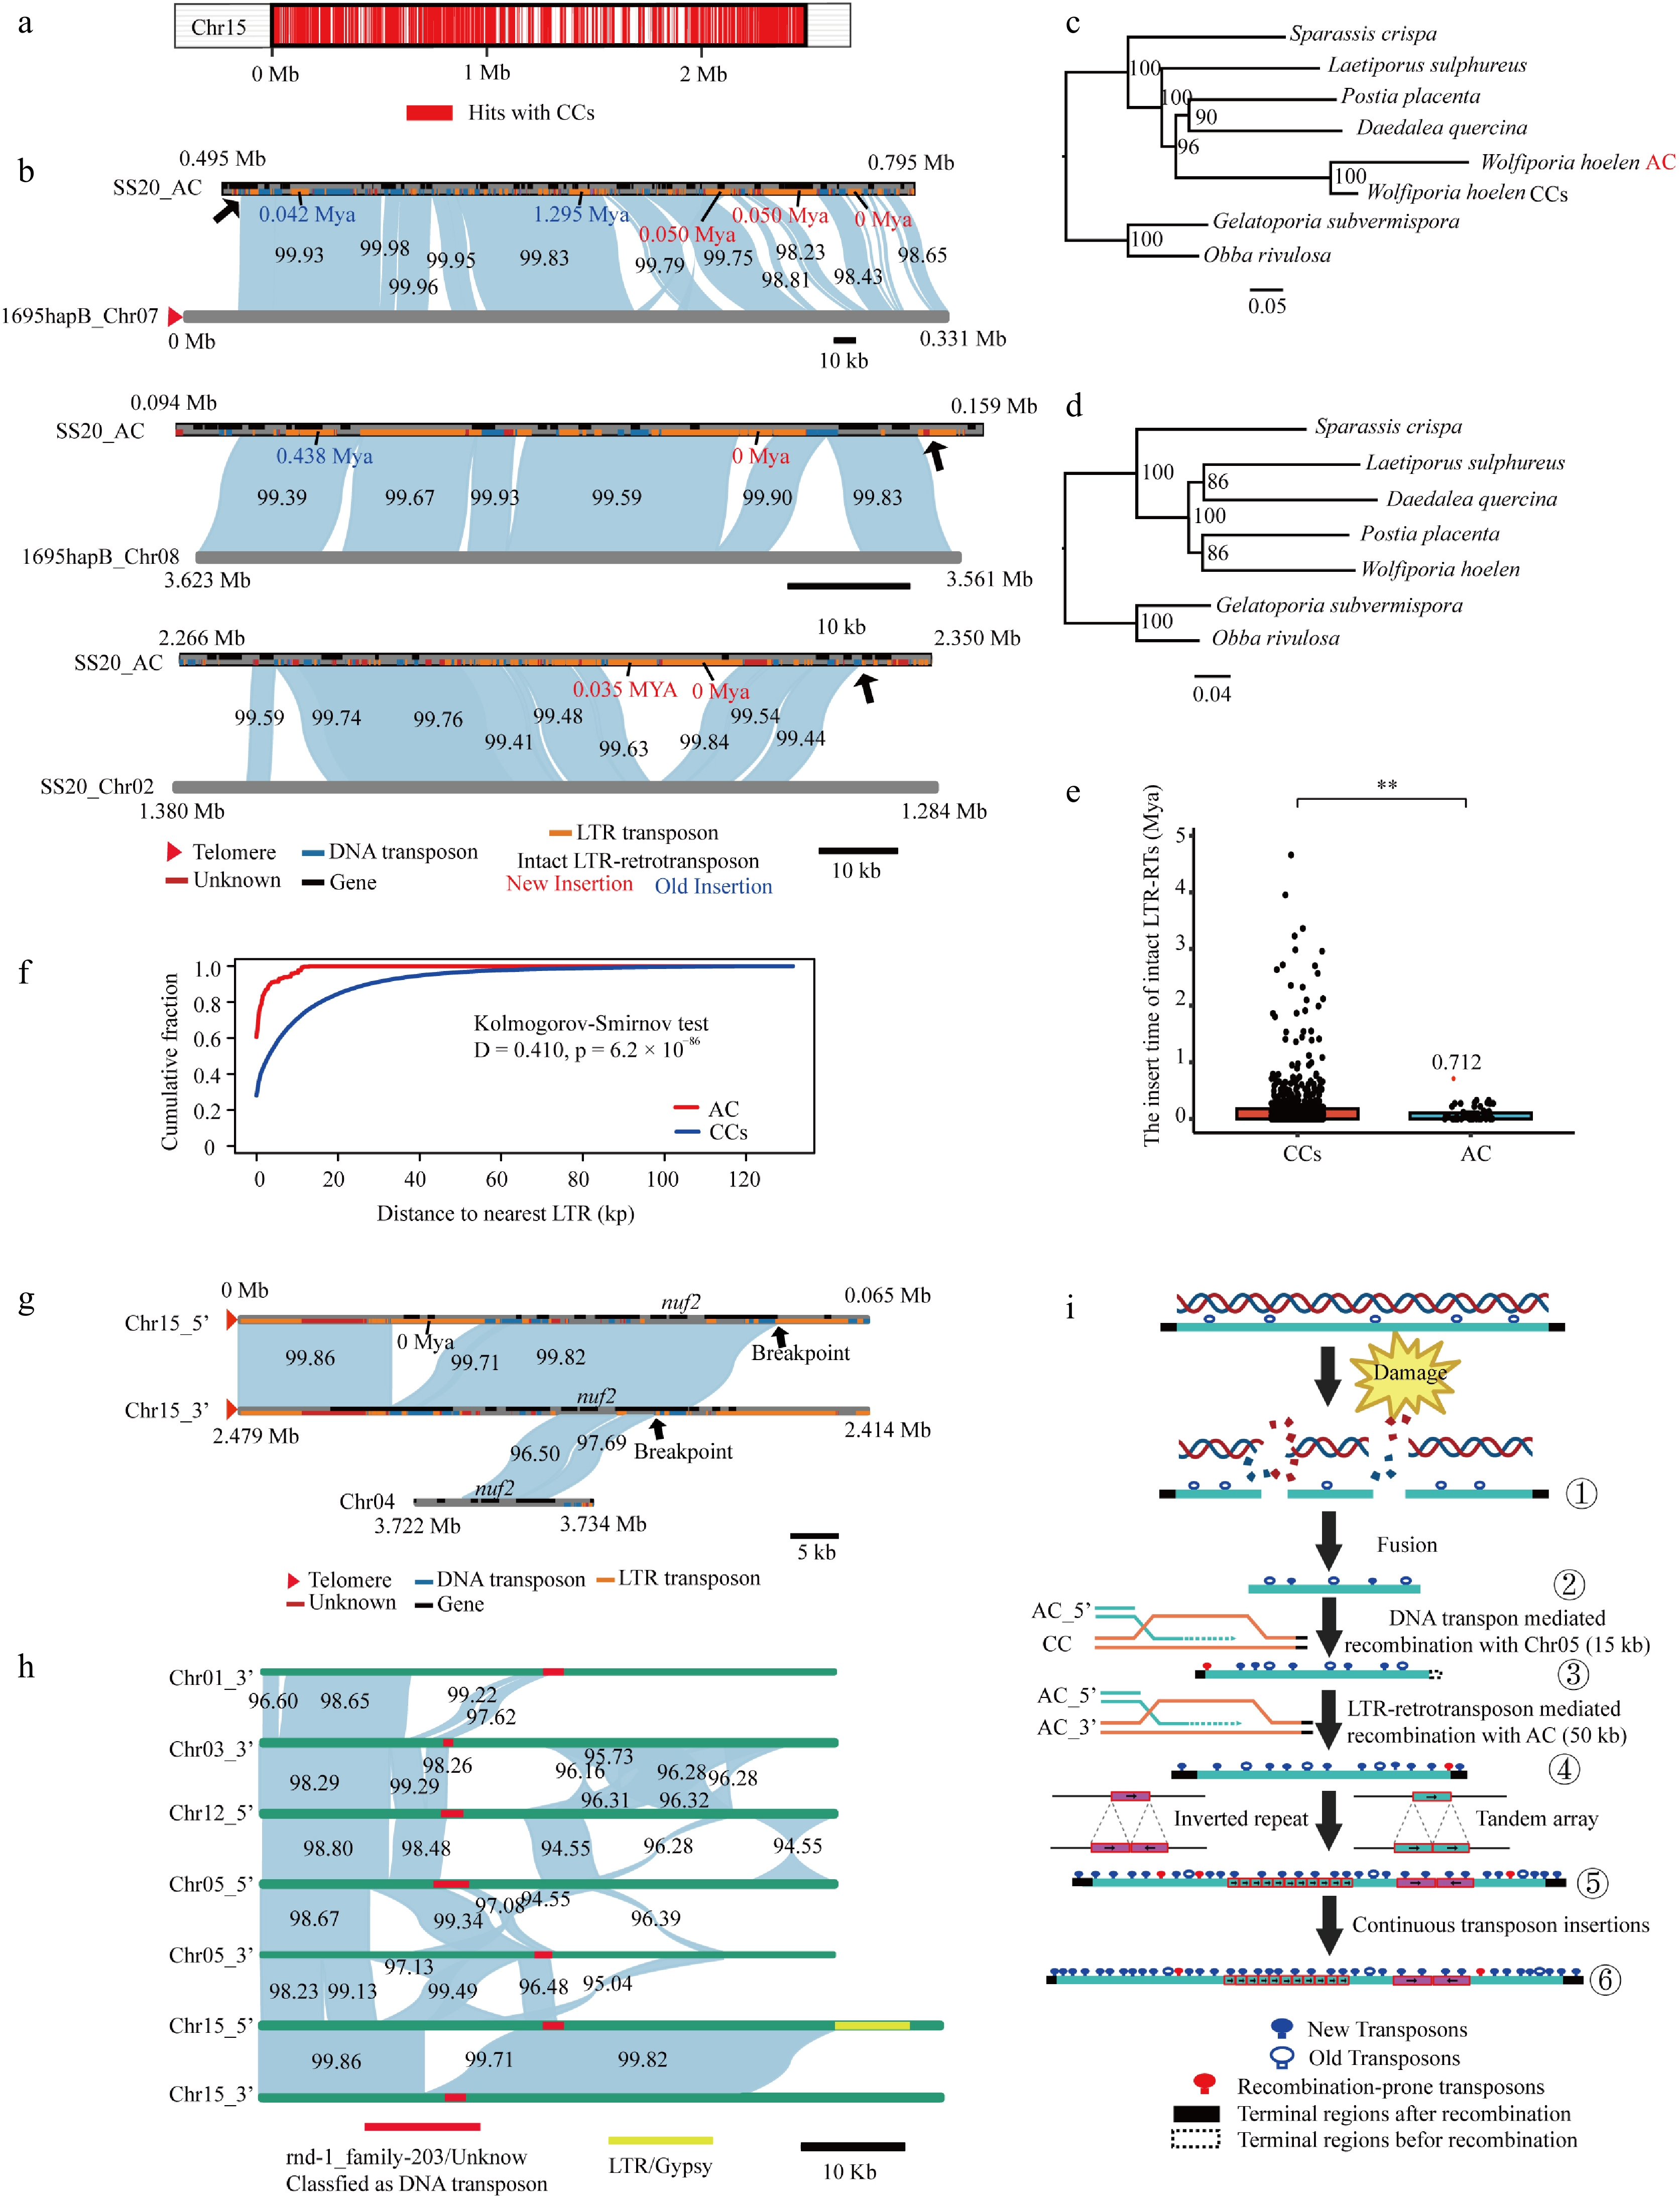
Figure 3.
Evidence supporting an endogenous origin and TE-associated structural evolution of the accessory chromosome (AC). (a) Genome-wide distribution of homologous regions between AC and CCs. (b) Three large syntenic regions between CCs and AC. The first two regions correspond to 1695 hapB, and the third corresponds to T2T_SS20 Chr04. Shaded ribbons connect syntenic regions, with sequence identity indicated. Insertion times of intact LTR retrotransposon (LTR-RT) on the AC are marked. Black arrows indicate TE-enriched breakpoint regions. (c) Phylogenetic tree based on 50 shared single-copy orthologous proteins from the CCs, AC, and six related Polyporales species. (d) Phylogenetic tree based on 3,344 shared single-copy orthologous proteins of W. hoelen and six related Polyporales species. (e) Comparison of LTR insertion times between AC and CCs using the Mann–Whitney U test (CCs: 787 insertions; AC: 46 insertions; ** p < 0.01). The red outlier represents a putative ancestral insertion that was undetected in the CCs of SS20 and 1695 genomes, as it deviates from the remaining data points. Mya, million years ago. (f) Cumulative distribution of absolute distances between genes and LTR-RT elements on the AC and CCs. (g) Collinearity of genomic regions harboring CC and AC nuf2. TE-enriched breakpoint regions are marked by black arrows. Straight line denotes the LTR insertion time. (h) Collinearity between AC termini and potential CC source regions. (i) Proposed model for the origin and evolution of the AC. Damage and breakage of an ancestral chromosome generated a fragmented intermediate, which subsequently fused and acquired telomeric ends through sequential transposon-mediated recombination events. The 5' end formed by DNA transposon-mediated recombination with Chr05 across a 15 kb homologous region, whereas the opposite end was stabilized by LTR retrotransposon-mediated recombination with the AC itself across a 50 kb homologous region, leading to telomere homogenization. Subsequent structural rearrangements, including inverted repeats and tandem arrays, together with continuous transposon insertions, drove further remodeling and expansion of the chromosome. Blue filled symbols indicate new transposons, blue open symbols indicate old transposons, and red symbols indicate recombination-prone transposons. Black and dashed boxes mark terminal regions after and before recombination, respectively. Step 1, chromosome breakage. Step 2, chromosome fusion. Step 3, telomere acquisition. Step 4, telomere homogenization. Step 5, structural evolution. Step 6, chromosome expansion.
Supporting this endogenous origin, BLASTP searches identified only 18 AC unique proteins (4.8%), while 87.4% of AC proteins have closest homologs within Polyporales when blast against the NCBI nr database. No evidence of non-fungal horizontal gene transfer (HGT) was detected using the method described in the Supplementary Materials and Methods. Phylogenetic analysis based on 50 shared single-copy orthologs from the CCs, AC, and six related Polyporales species placed the AC within the W. hoelen CC clade (Fig. 3c), congruent with the species topology inferred from 3,344 shared single-copy orthologs (Fig. 3d). Although the longer AC branch in the protein-based phylogeny suggests greater sequence divergence between AC-encoded genes and their current CC homologs (Fig. 3c), regional SNP-density analysis showed that lower SNP density in exonic regions than in intronic and non-genic regions of the AC. Specifically, SNP density was 479.6 SNPs/Mb in exonic regions, 701.8 SNPs/Mb in intronic regions, and 777.6 SNPs/Mb in non-genic regions. Thus, the longer AC branch is more likely to reflect historical divergence of AC-encoded homologs from their extant CC homologs, rather than accelerated recent SNP accumulation in AC coding regions.
The recent emergence of the AC was further supported by LTR retrotransposon (LTR-RT) insertion dating. Intact LTR-RTs on the AC exhibit insertion ages up to 1.295 million years ago (Mya), whereas CC insertions reach 4.662 Mya. To minimize bias from ancestral insertions inherited from CC-derived segments, intact LTR-RTs in fully collinear segments were excluded (Fig. 3a). After this correction, Intact LTR-RT insertions on the AC remained significantly younger than those on CCs (Fig. 3e), supporting a relatively short evolutionary history of the AC.
TEs drive the expansion and evolution of the AC
-
The AC was characterized by an exceptionally high repeat content (73.35%), with TEs accounting for 61.59% (Supplementary Fig. S9). Although 78.80% of the AC sequence aligned to the CCs, these matches were predominantly short and fragmented, suggesting a discontinuous mosaic of CC-derived segments rather than simple chromosome-scale fusion. Additionally, TEs were enriched at rearrangement junctions across the AC (Fig. 3b), and AC genes were positioned significantly closer to LTR-RT insertions than CC genes (Fig. 3f), suggesting the potential role of TEs in gene expansion of the AC. For instance, the AC-encoded nuf2 was located immediately adjacent to a TE-rich region (Fig. 3g). Collinearity analysis of the two AC-localized nuf2 copies revealed a 50-kb collinear tract encompassing terminal sequences with 99.86% identity, aside from a ~0 Mya Gypsy LTR-RT insertion (Fig. 3g). Moreover, the AC termini exhibited recurrent collinearity with multiple CC termini (Chr01, Chr03, Chr05, and Chr12, Fig. 3h and Supplementary Fig. S10a), sharing conserved rearrangement breakpoints that co-localized with a specific DNA transposon, rnd-1_family-203. An LTR-RT was also detected at the Chr15 3' breakpoint corresponding to the AC terminal region (Fig. 3h). These results indicate that the AC termini have undergone recent recombination and sequence homogenization, with TEs contributing to the expansion and evolution of the AC.
The AC imposes a dosage-dependent cost under both non-stress and stress conditions
-
Although AC complete loss was not observed in sequenced progeny, successive subculturing under benomyl stress induced AC loss in strains 7S32 and 7S45, which was confirmed by PCR assays (Fig. 4a ; Supplementary Table S4) and whole-genome resequencing (Fig. 4b). Both AC-lost derivatives exhibited significantly higher growth rates on PDA than their corresponding AC-containing strains (Fig. 4c), indicating a substantial maintenance cost.
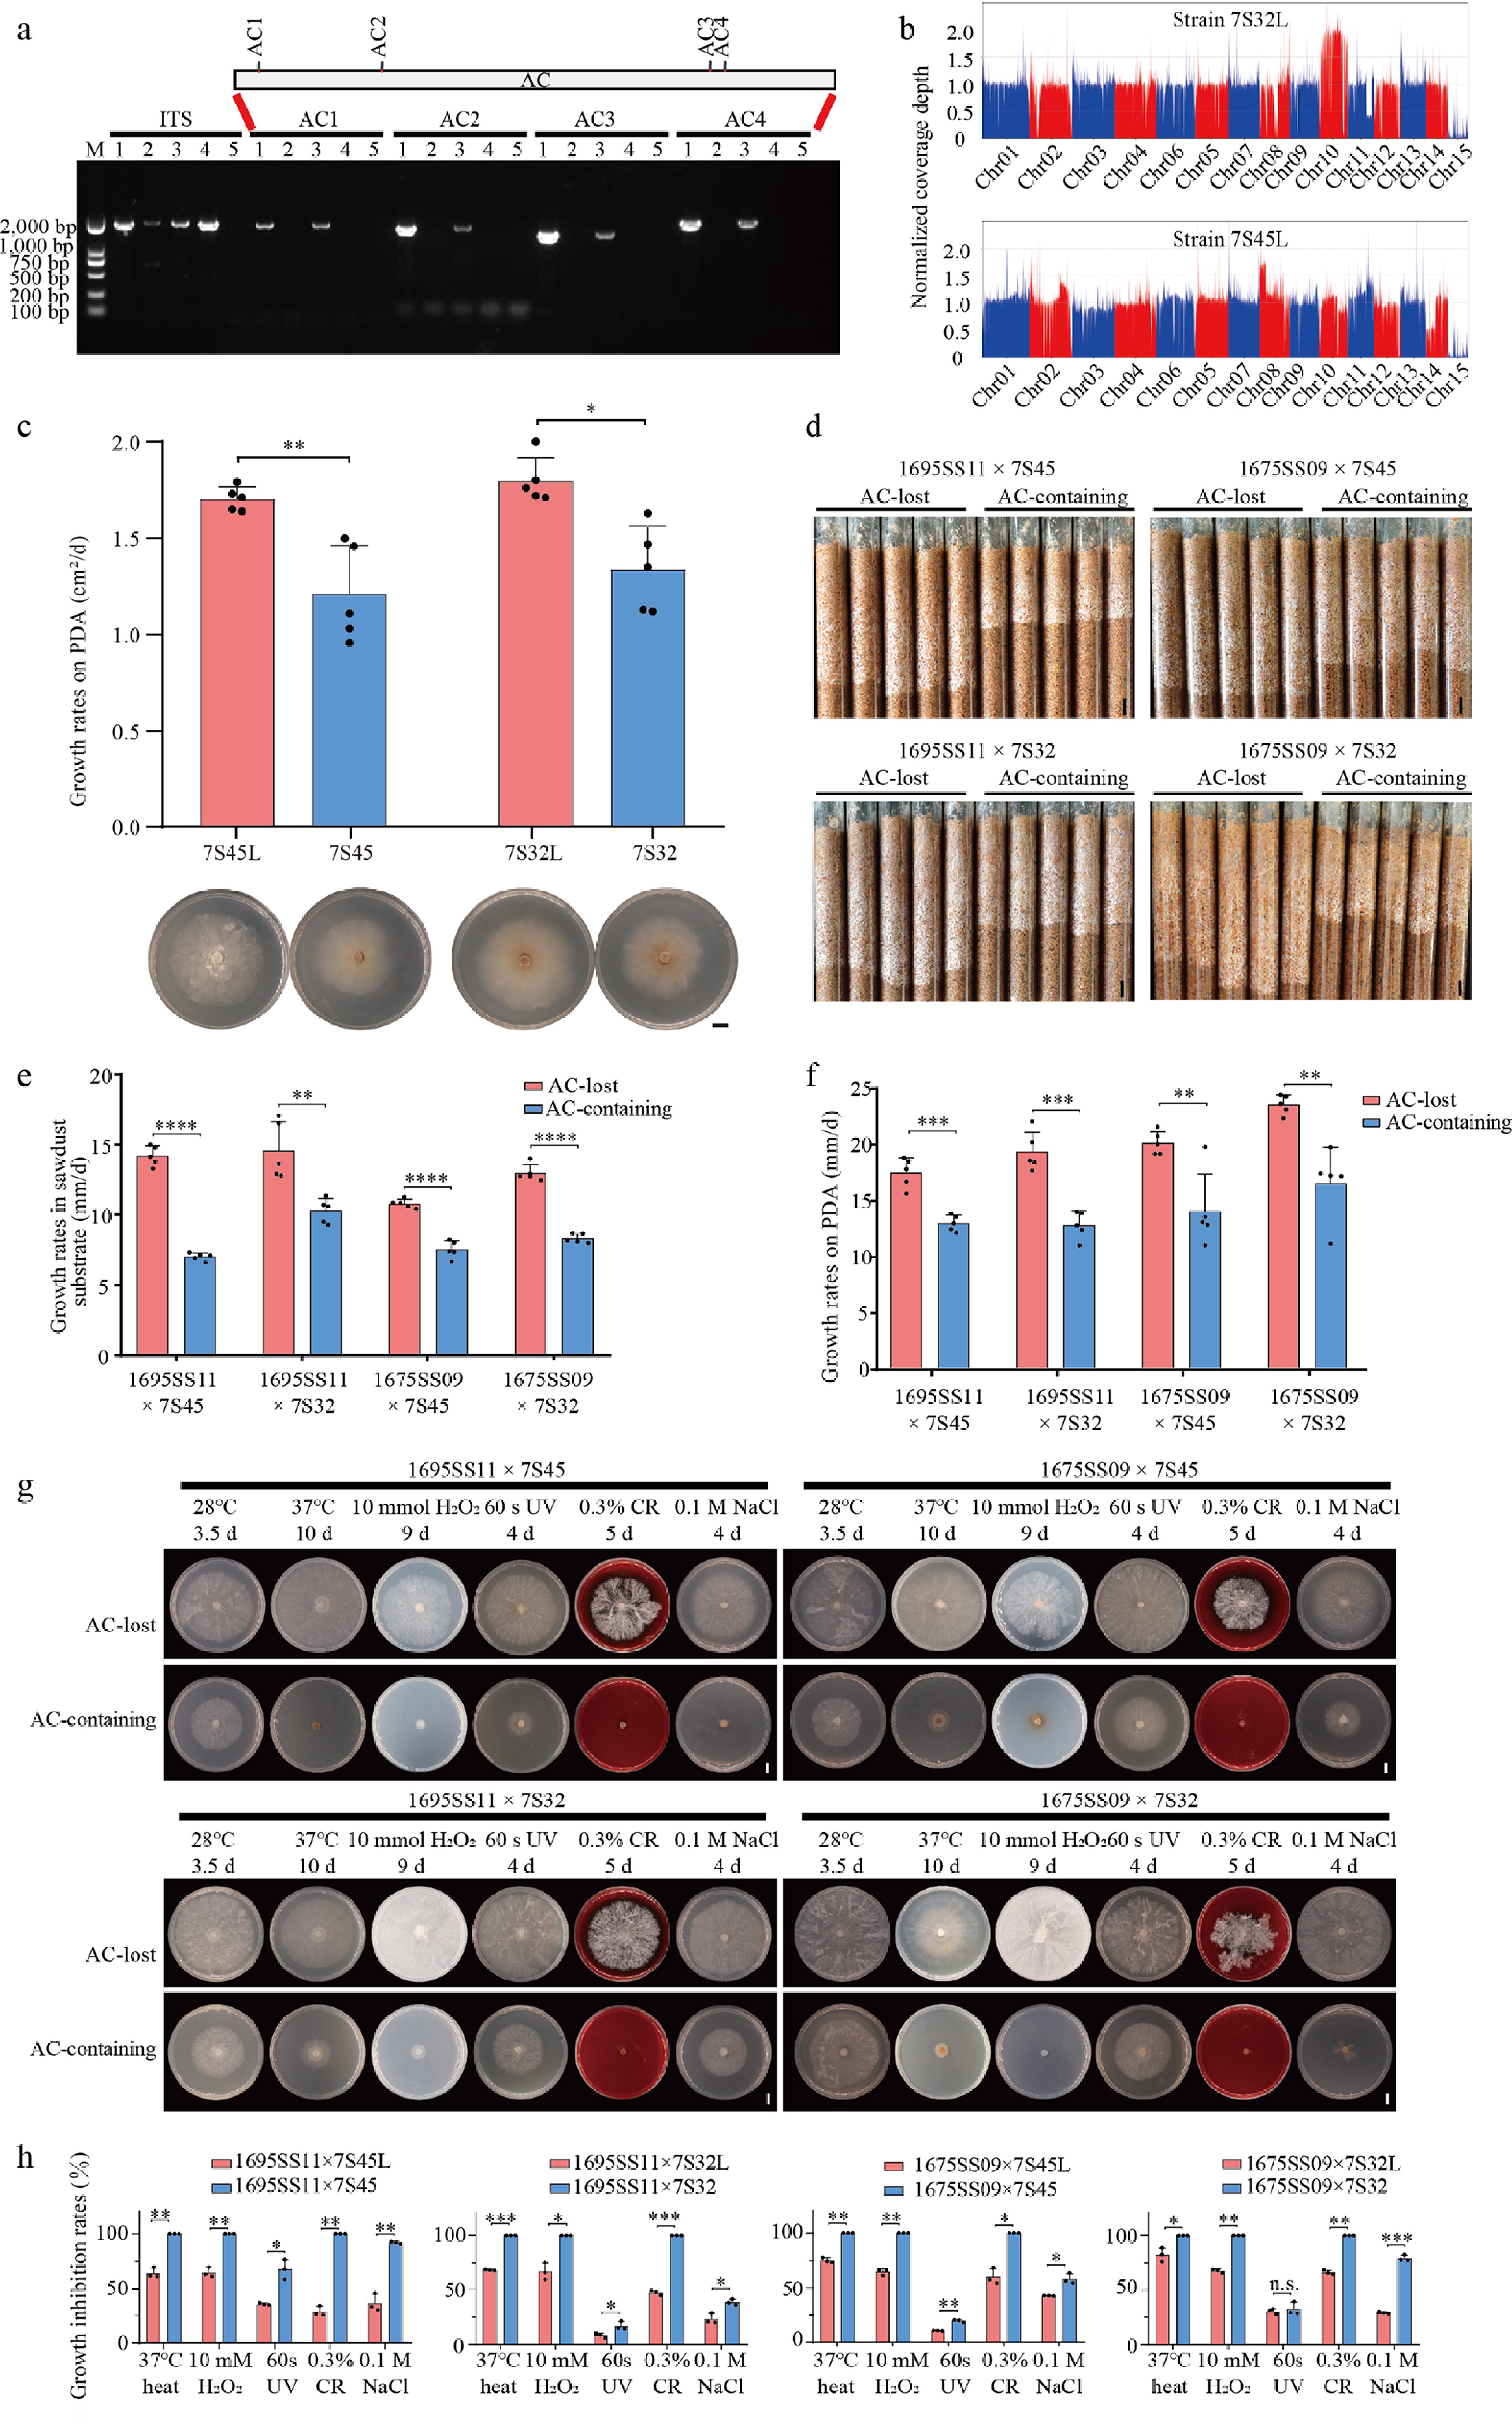
Figure 4.
Phenotypic consequences of the accessory chromosome (AC) loss. (a) PCR confirmation of AC loss during culturing on PDA supplemented with 50 μg/mL benomyl. AC1–AC4 denote four distinct segments of the AC, with their positions schematically shown above the gel image. Primer sequences are provided in Supplementary Table S4. ITS, internal transcribed spacer; M, DNA marker; lane 1, strain 7S32; lane 2, strain 7S32L; lane 3, strain 7S45; lane 4, strain 7S45L; lane 5, H2O (negative control). 7S32L and 7S45L are AC-loss derivatives of 7S32 and 7S45, respectively. (b) Normalized whole-genome resequencing coverage profiles confirming loss of the AC. (c) Comparison of growth rates on PDA before and after AC loss in two sexual progeny (independent-samples t-test, n = 5; * p < 0.05; ** p < 0.01). Bar = 1 cm. (d), (e) Phenotypic comparison and growth rates of AC-containing and AC-lost strains in pine sawdust across four matched pairs of heterokaryotic strains (independent-samples t-test, n = 5; ** p < 0.01; **** p < 0.0001). Bar = 1 cm. (f) Growth rates of AC-containing and AC-lost strains on PDA across four matched pairs of heterokaryotic strains (independent-samples t-test, n = 5; ** p < 0.01; *** p < 0.001). (g) Representative colony of AC-lost and AC-containing heterokaryotic strains under multiple stress conditions. Strain combinations and incubation days are shown above each panel. Bar = 1 cm. (h) Growth inhibition of AC-containing and AC-lost heterokaryotic strains under multiple stress conditions. Growth inhibition rates of four matched pairs of heterokaryotic strains with (blue) or without (red) the AC under various stress treatments, relative to control conditions (28 °C) (CR, congo red; independent-samples t-test; n.s., not significant; * p < 0.05; ** p < 0.01; *** p < 0.001).
This growth advantage was consistently recapitulated across genetic backgrounds. We generated four matched pairs of heterokaryons by crossing two AC-containing strains (7S32 and 7S45) and their AC-loss derivatives (7S32L and 7S45L) with progeny from AC-absent wild strains (1695SS11 and 1675SS09), each pair comprising one AC-containing and one AC-lost strain. AC presence/absence was confirmed by PCR assays (Supplementary Fig. S11a). Across all matched pairs, AC loss resulted in significantly accelerated growth in pine sawdust (Fig. 4d, e) and on PDA (Fig. 4f). Beyond accelerated growth, AC loss increased resilience to multiple abiotic stressors, including oxidative stress (H2O2), cell wall interference (Congo red), UV irradiation, and heat stress (Fig. 4g, h). This advantage was most pronounced under extreme heat (37 °C), 10 mM H2O2, or 0.3% Congo red, where AC-containing strains were severely inhibited, while AC-lost strains flourished.
To validate these findings in natural populations, we examined the relationship between AC copy number and growth rates across heterokaryotic isolates using a Linear mixed-effects model (LMM). Corroborating our experimental results, AC dosage was significantly negatively correlated with growth rates in pine sawdust (q = 0.048; Supplementary Fig. S12) and on PDA (q = 0.025; Supplementary Fig. S13). These results demonstrate that the AC exerts a consistent, dosage-dependent negative effect across diverse genetic backgrounds and stress conditions.
AC loss triggers transcriptional upregulation of primary metabolism and antioxidant genes within the CC
-
To elucidate the fitness cost of AC maintenance, we performed comparative transcriptomic profiling using PDA-grown mycelia from two pairs of AC-containing and AC-lost heterokaryotic strains (1695SS11 × 7S45 and 1695SS11 × 7S32, Supplementary Fig. S11b; Supplementary Table S12). Principal component analysis confirmed distinct grouping and high reproducibility (Supplementary Fig. S11c).
In AC-containing strains, over 50% of AC genes were transcriptionally quiescent, with only a small fraction (5.07% and 6.67%) exhibiting high expression levels (Fig. 5a). GO enrichment of expressed AC genes revealed a specialized focus on DNA/chromosome dynamics and cell-cycle regulation, including DNA replication, meiotic chromosome segregation and ATP-dependent activities acting on DNA (Supplementary Table S13; Supplementary Fig. S11d). Among 27 highly expressed AC genes shared between strains, most were involved in chromosome segregation (e.g., nuf2), chromatin remodeling (rsc7), and TOR-mediated growth signal (Supplementary Table S14). Thus, the AC acts as a transcriptionally specialized unit for genome maintenance and regulatory signaling, rather than primary metabolism.
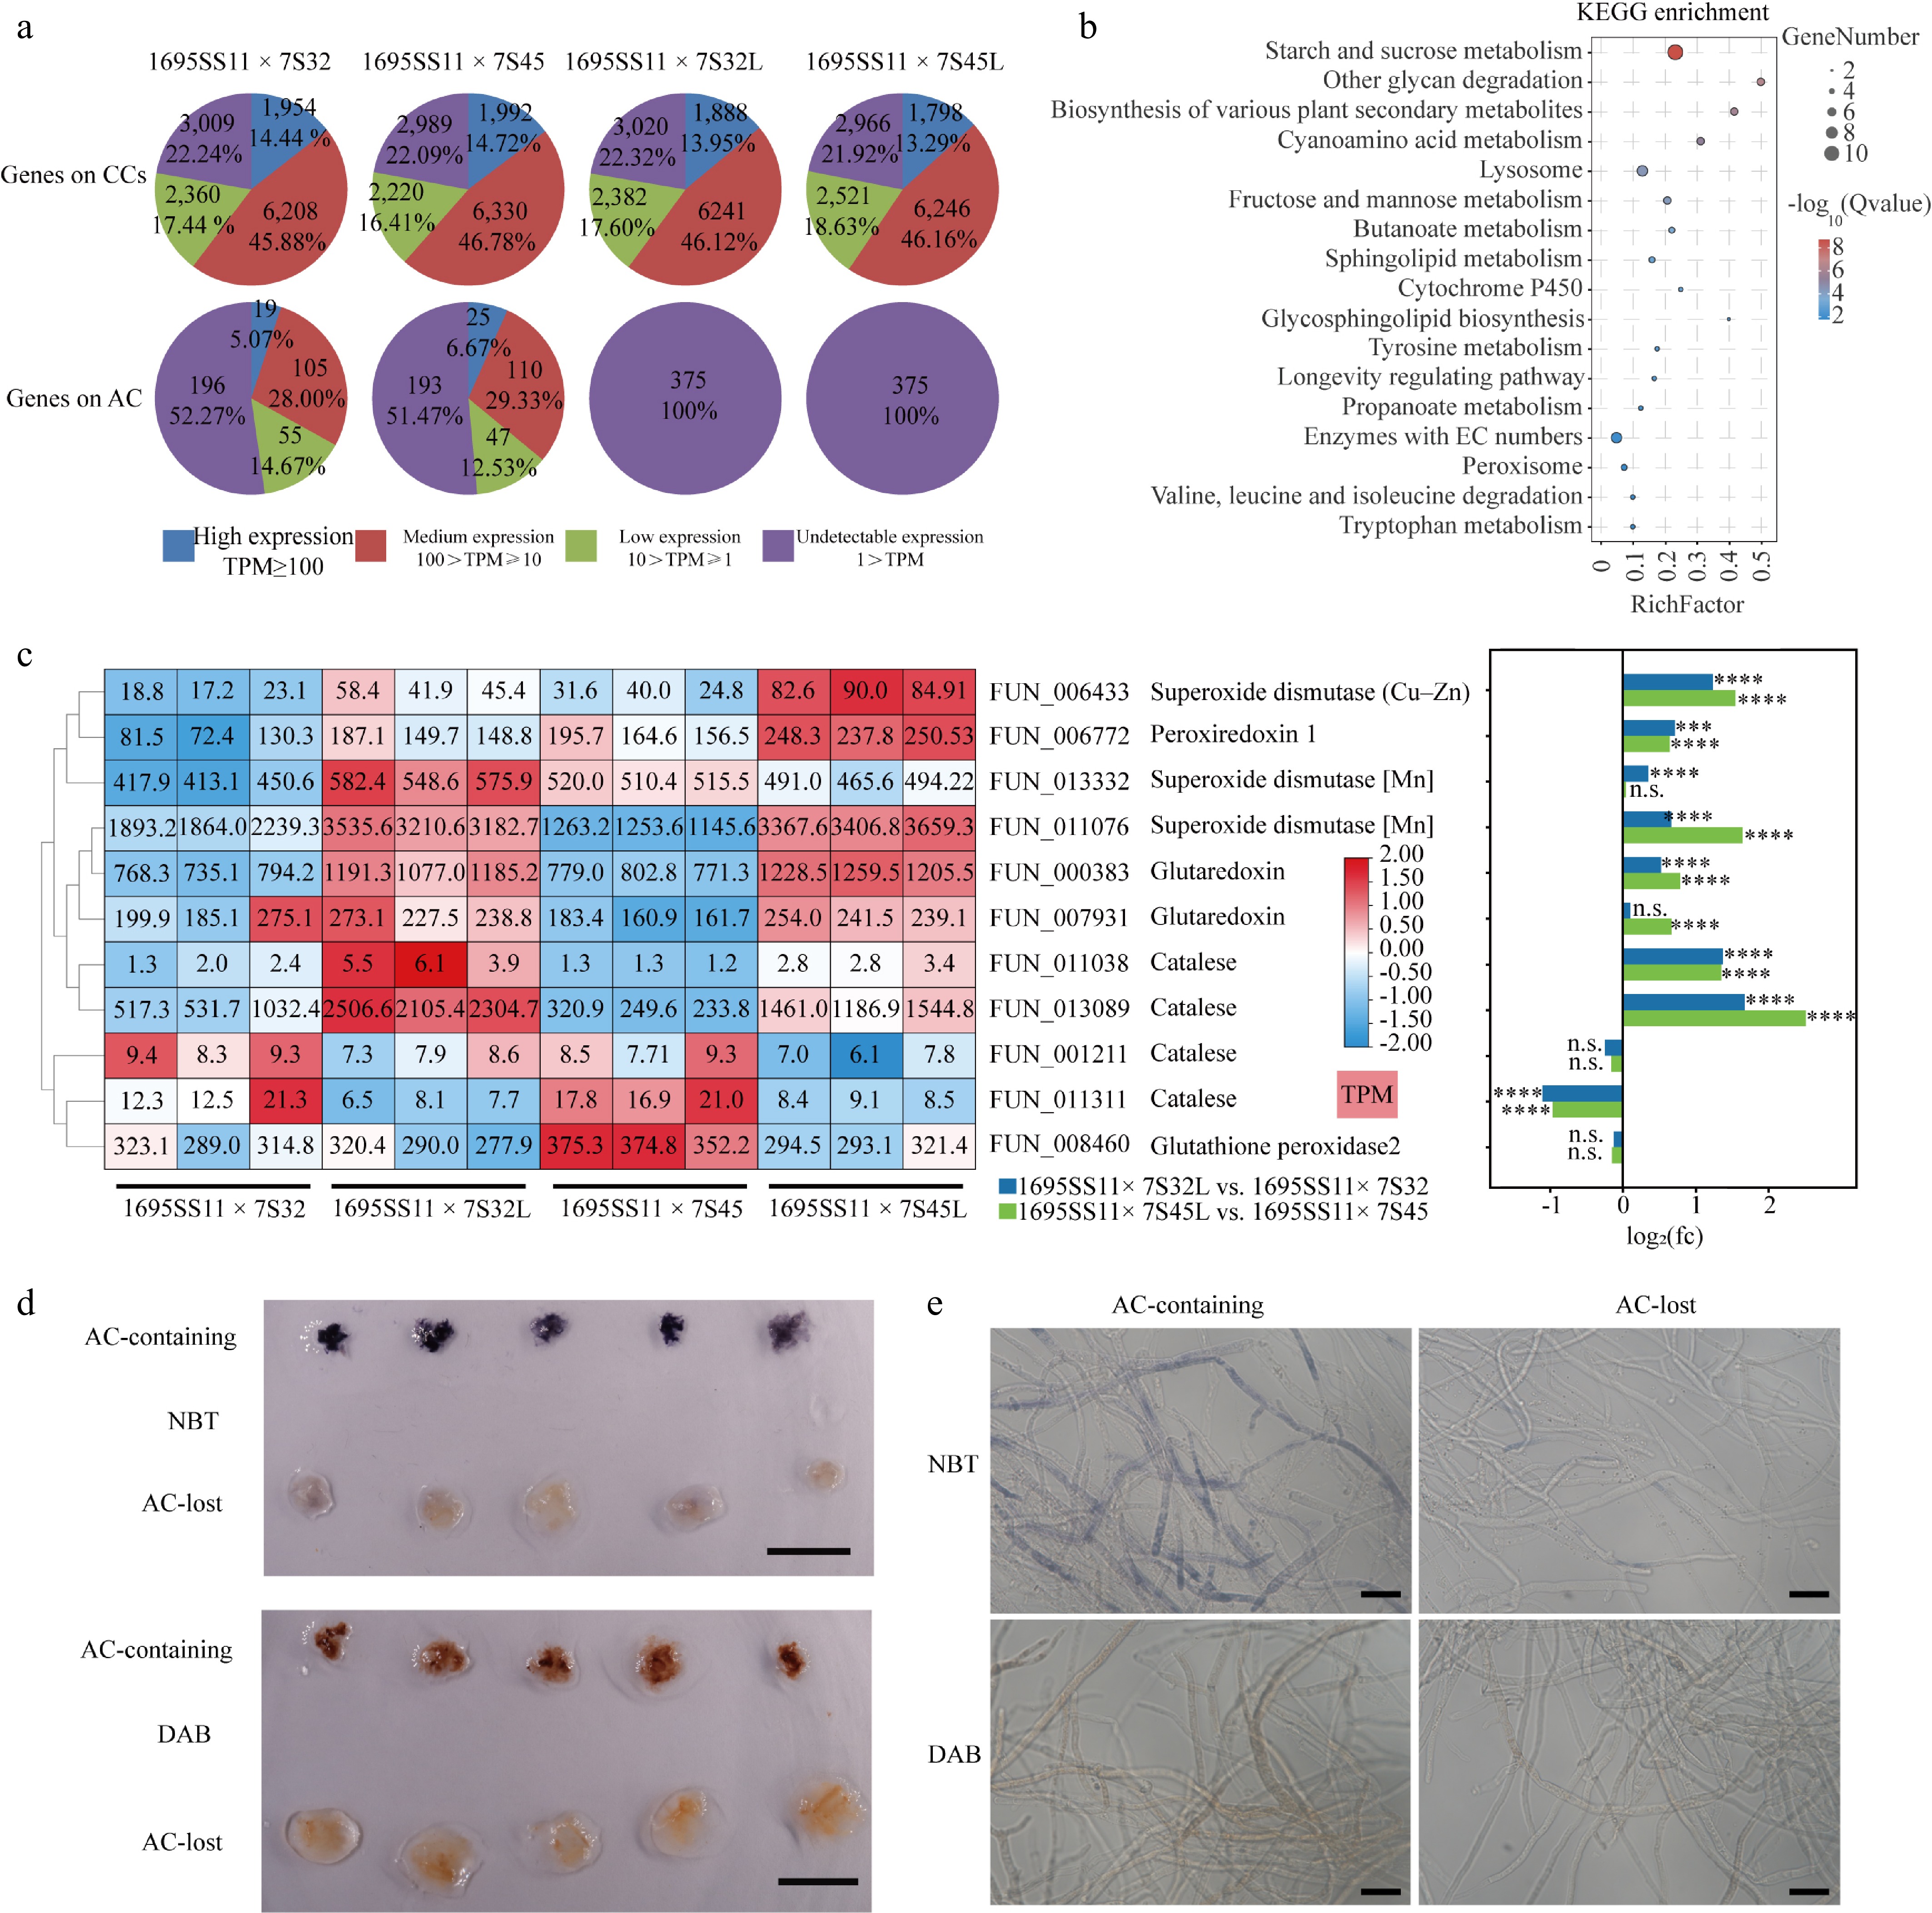
Figure 5.
Transcriptional consequences of the accessory chromosome (AC) loss. (a) Distribution of gene expression levels of CCs and AC in AC-containing and AC-lost strains on PDA. Pie charts show the proportions of genes grouped by expression level on CCs and the AC, based on TPM values from RNA-seq data. Numbers within each sector indicate gene counts and their corresponding percentages. (b) KEGG enrichment of upregulated genes following AC loss. (c) Expression changes in genes involved in antioxidant defense and ROS detoxification (DESeq2; n.s., not significant; *** q < 0.001; **** q < 0.0001). (d), (e) NBT and DAB staining of the AC-containing strain (1675SS09 × 7S32) and the AC-lost strain (1675SS09 × 7S32L). Bar = 1 cm. (f), (g) Microscopic observation of NBT and DAB staining in the AC-containing strain (1675SS09 × 7S32) and the AC-lost strain (1675SS09 × 7S32L). Bar = 20 μm. DAB, diaminobenzidine; NBT, nitro blue tetrazolium chloride.
By contrast, AC loss induced a coordinated transcriptional shift in the CC, with 275 upregulated and 255 downregulated CC genes shared (Supplementary Fig. S11e). Enrichment analysis revealed that AC loss significantly upregulated primary metabolism, including carbohydrate, organic acid, and lipid metabolism (Fig. 5b). The most strongly induced genes (log2FC > 3) encoded biomass-degrading enzymes (e.g., endo-β-1,4-glucanase and multiple glycoside hydrolases) and nutrient transporters (Supplementary Table S15), alongside elevated transcripts for glycolysis and tricarboxylic acid cycle enzymes (Supplementary Fig. S14). This metabolic activation was accompanied by reinforced cellular defense, evidenced by the broad upregulation of antioxidant systems, including catalases, superoxide dismutase, and peroxiredoxins (Fig. 5c). Consistent with this, reduced diaminobenzidine (DAB) and nitro blue tetrazolium chloride (NBT) staining supported enhanced antioxidant capacity in AC-lost strains (Fig. 5d, e). In contrast, downregulated genes showed no significant GO enrichment except for salt transmembrane transport (Supplementary Table S16). These results indicate that the fitness gains associated with AC loss are accompanied by transcriptional reallocation toward central metabolism and improved redox homeostasis.
AC promotes CC mis-segregation and aneuploidy during sexual reproduction
-
Given the deleterious effects of the AC during vegetative growth, together with its expanded genes related to meiotic recombination and chromosome segregation, we next investigated the effects of the AC during sexual reproduction. Among 27 sexual progeny derived from strain 776, we identified 12 CC aneuploidy events in 9 strains (33%), involving Chr01, Chr02, Chr08, and Chr11 (Supplementary Fig. S6). SNP analysis revealed that those aneuploidy events arose through diverse mechanisms. Six were homozygous, indicating mitotic mis-segregation, whereas the remaining six were heterozygous. Centromeric heterozygosity analysis revealed that the heterozygous aneuploidies originated from meiosis I errors (homozygous centromeres) or meiosis II errors (heterozygous centromeres, Supplementary Fig. S15).
We then examined whether these abnormalities were linked to the presence of AC. In the sexual progeny of strain 776, AC copy number was significantly positively correlated with increased CC copy number (Fig. 6a). Further, we sequenced 15 sexual progeny from two AC-absent heterokaryotic strains, and none exhibited complete CC aneuploidy (Supplementary Fig. S16). Fisher's exact test confirmed a significant association between AC presence and CC aneuploidy among sexual progeny (9/27 in AC-containing vs 0/15 in AC-lost strains, p = 0.016). Consistent with these observations, CC aneuploidy was further confirmed in the sexual progenies of three additional AC-containing strains (Supplementary Fig. S17). These results suggest that the AC significantly increases the risk of chromosome mis-segregation during sexual reproduction.
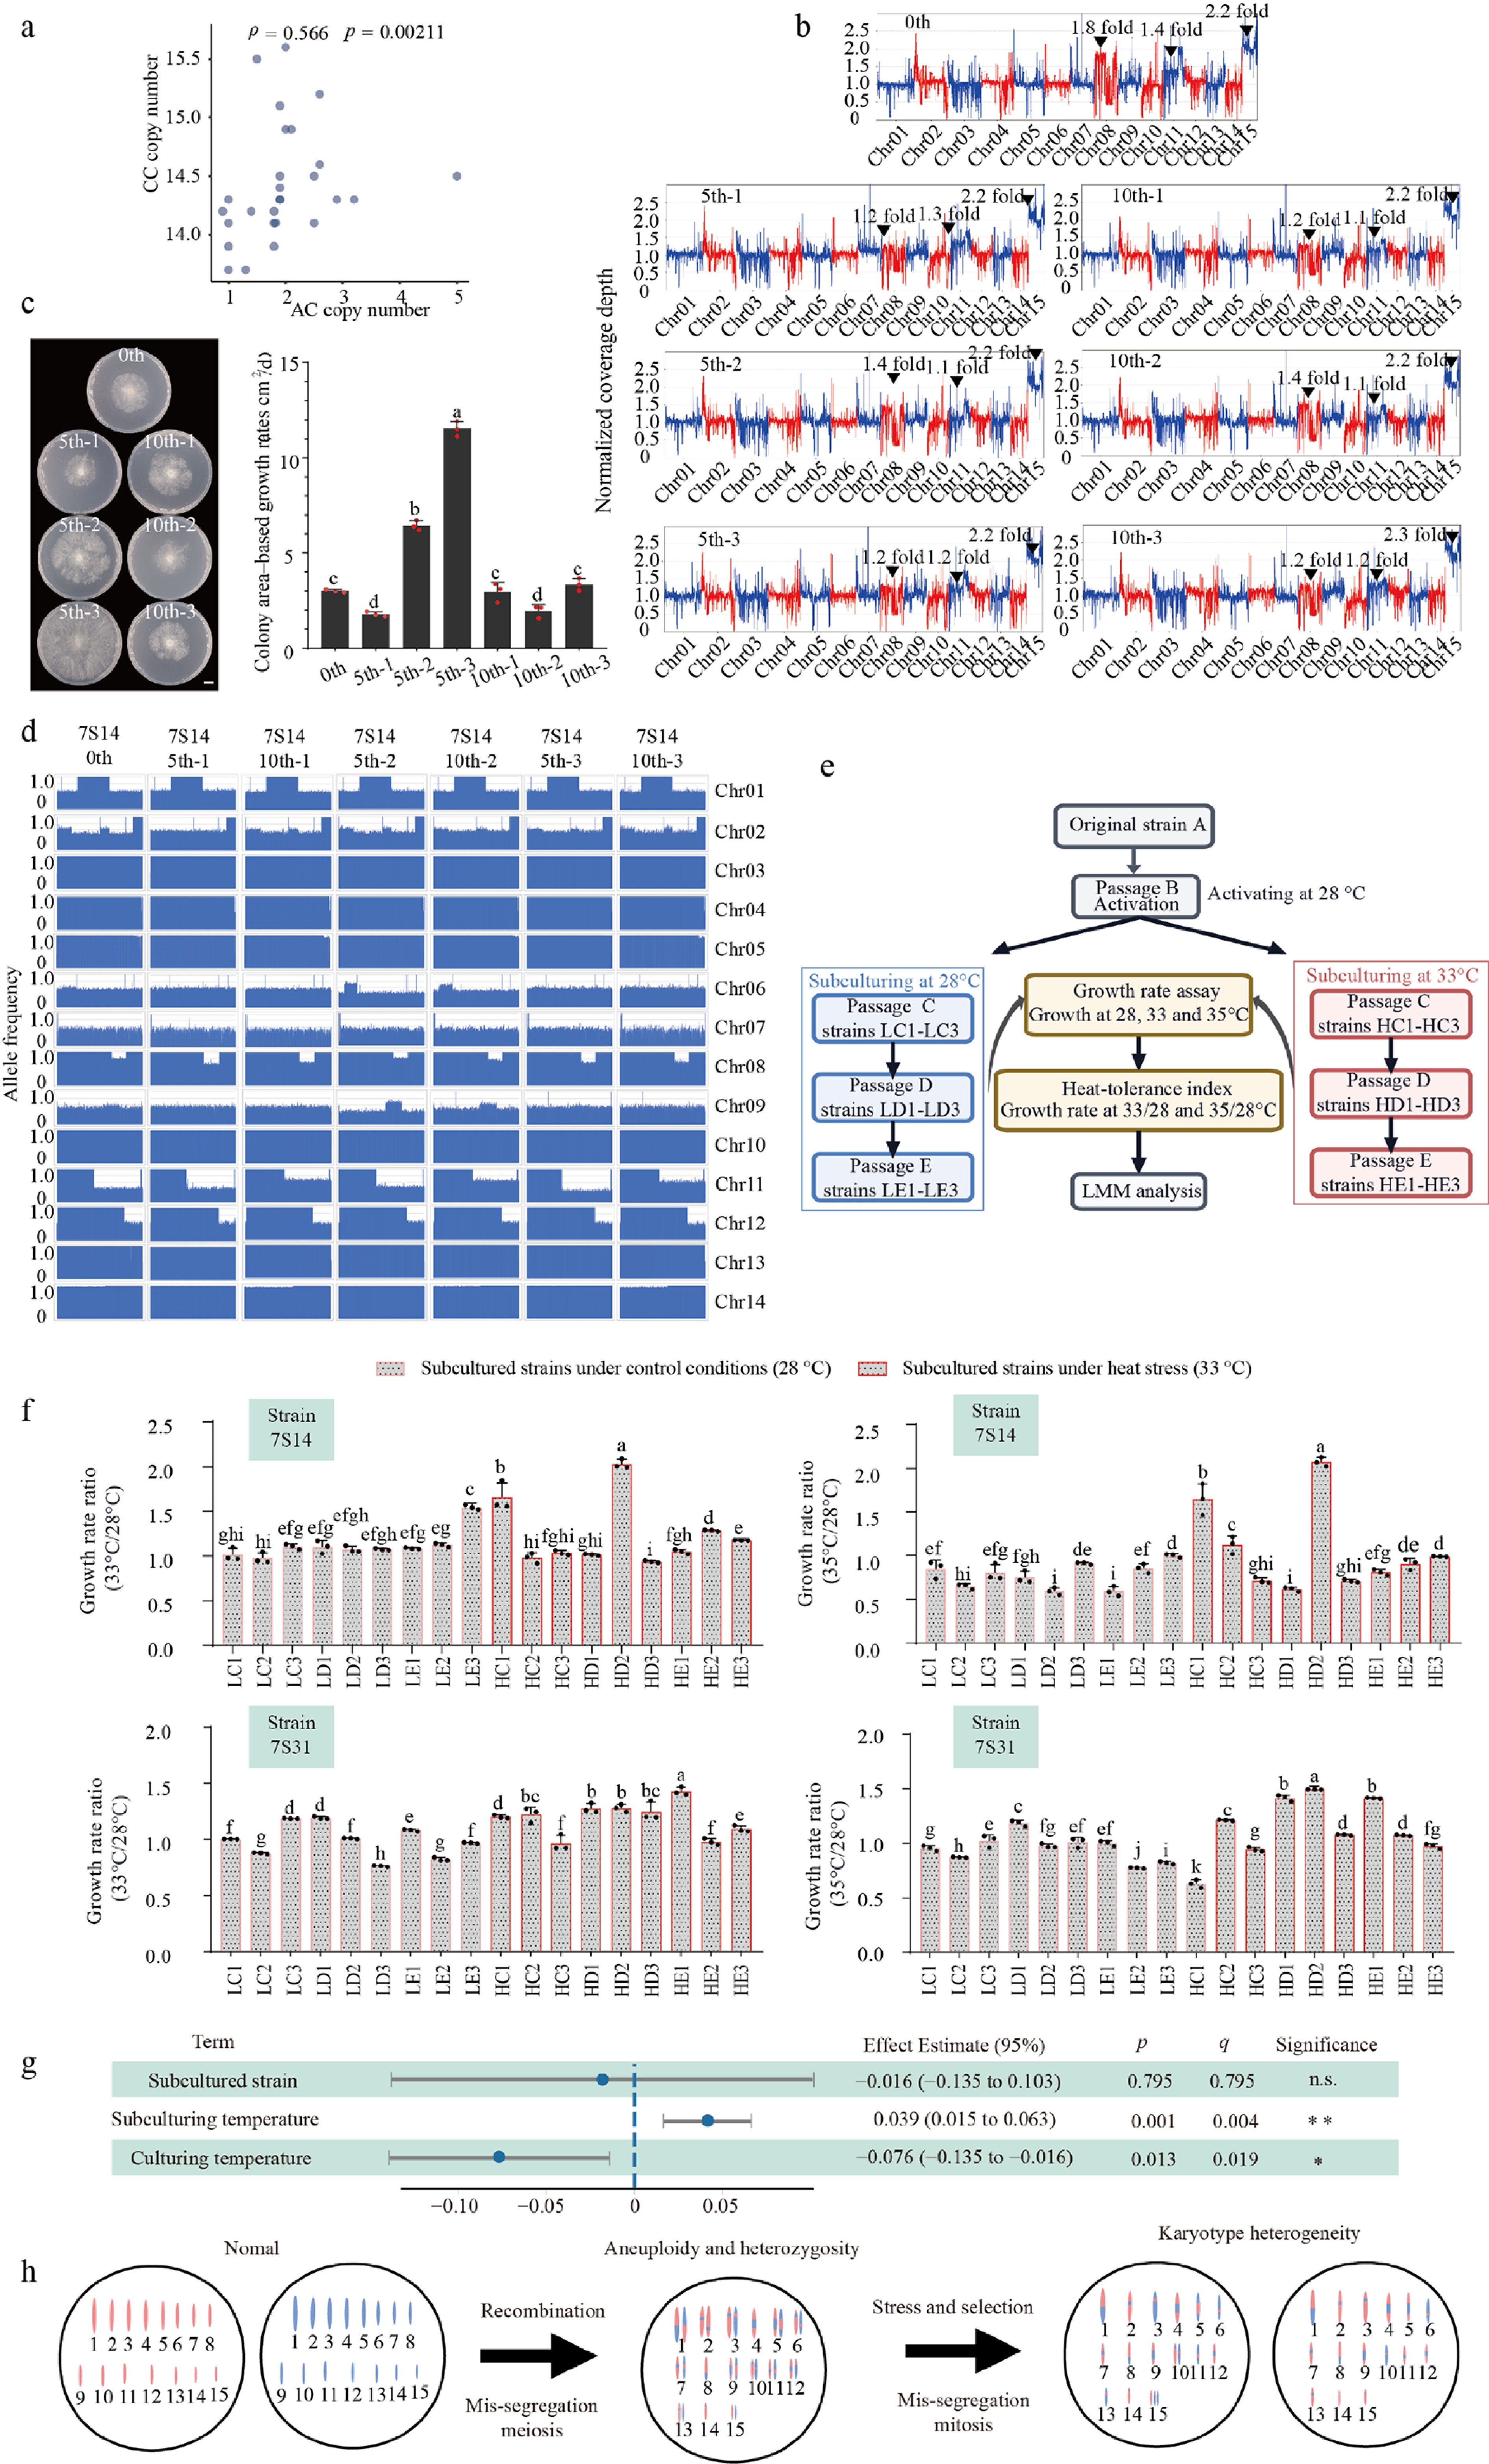
Figure 6.
Impact of accessory chromosome (AC) during the sexual phase. (a) Correlation between AC dosage and CC copy number in sexual progeny derived from strain 776 (Spearman's rank correlation test). (b) Genome coverage of strain 7S14 during serial subculturing (starting strain 0, 5th and 10th generations). Numbers indicate chromosome dosage inferred from normalized coverage. (c) Growth rates of sequenced subcultured derivatives on PDA. Groups labeled with different letters differ significantly according to the LSD post-hoc test (p < 0.05, n = 3). Bar = 1 cm. (d) SNP allele-frequency profiles of subcultured derivatives. (e) Experimental workflow for serial subculture and heat-tolerance assessment. Three biological replicates were included for each generation during serial subculture. LC–LE denote the 3rd to 5th generations serially subcultured at 28 °C, while HC–HE represent the 3rd to 5th generations serially subcultured at 33 °C. (f) Heat tolerance of subcultured strains 7S14 and 7S31 under control and heat stress conditions. LSD post-hoc test, different letters indicate significant differences (p < 0.05, n = 3). (g) Linear mixed model analysis of the effects of subcultured strain (7S14 and 7S31), subculturing temperature (28 and 33 °C) and culturing temperature (33 and 35 °C) on heat tolerance, defined as the ratio of growth rate under heat stress to growth rate under control conditions (BH-adjusted q values; n.s., not significant; * q < 0.05; ** q < 0.01). (h) Model for the origin of karyotype heterogeneity. Meiotic mis-segregation initially generates spores carrying both aneuploidy and heterozygosity. During subsequent vegetative propagation, unstable aneuploid chromosomes are progressively lost during stress and recovery, but different nuclei may retain different parental homologs. This produces coexisting nuclei with distinct chromosome complements, resulting in karyotype heterogeneity. Different nuclear karyotypes may confer distinct stress preferences, thereby enabling rapid phenotypic adaptation.
AC-associated heterozygosity correlates with a fitness advantage in progeny
-
Among the 27 single basidiospore-derived progeny of strain 776, several individuals exhibited chromosomal heterozygosity (Supplementary Fig. S15). LMM analysis showed that growth rate on PDA was significantly positively associated with heterozygosity (log2(heterozygous SNP count + 1), q = 0.04; Supplementary Fig. S18), whereas neither AC nor CC copy numbers showed significant effects. A similar pattern was observed under naturalistic conditions. In pine sawdust, growth rate was also significantly associated with heterozygosity (q = 0.0004; Supplementary Fig. S19), whereas AC or CC copy number again showed no significant association. Interestingly, all heterozygous progeny successfully colonized pine sawdust, whereas 40.9% of homozygous strains (nine individuals) failed to grow. These results suggest that CC heterozygosity is associated with improved progeny growth, with stronger effect observed on pine sawdust.
Genomic evidence for distinct chromosomal compositions in AC-containing strains
-
Given the positive association between CC heterozygosity and growth in sexual progeny, we next focused on isolates 7S14 and 7S31, which exhibited the highest heterozygosity among the sexual progeny, as estimated by GenomeScope (0.248% and 0.457%, respectively; Supplementary Fig. S20). Isolate 7S14 showed a mosaic chromosomal configuration, with 10 heterozygous and four homozygous CCs (Supplementary Fig. S21a), whereas 7S31 was heterozygous across all CCs (Supplementary Fig. S22). SNP allele-frequency distributions on these heterozygous chromosomes deviated from the expected 0.5 ratio (0.22‒0.83 in strain 7S14; 0.35‒0.65 in 7S31), inconsistent with a uniform heterozygous state. Since aneuploidy was limited to only two chromosomes in both strains, these deviations could not be explained by CNVs alone. Instead, these findings suggest a non-canonical heterozygous state, in which individual nuclei within the coenocytic mycelium possess distinct chromosomal compositions.
We then performed de novo assembly of strain 7S14 using ultra-long ONT, PacBio HiFi, and Hi-C data (see Supplementary information for details). Hifiasm produced two phased assembly outputs, each comprising 15 chromosomes (set1: 59.23 Mb; set2: 57.25 Mb). The summed SNP allele frequencies for homologous chromosome pairs were close to 1 (Supplementary Fig. S21b, c), confirming these skewed heterozygous signals were biological rather than assembly errors or structural variation. Moreover, Hi-C interaction patterns did not support partitioning the chromosomes into two independent haplotypes (Supplementary Fig. S21d). Instead, extensive interchromosomal interactions were detected across chromosomes (Supplementary Fig. S23), supporting a model of irregular chromosome partitioning among nuclei rather than two fixed haploid chromosome sets.
Further evidence was provided by resequencing of asexual progeny. Despite no detectable CC aneuploidy in parental strain 776, 60% of protoplast-derived asexual progeny exhibited CC aneuploidy (Chr08 and Chr11; Supplementary Fig. S24), indicating that the non-canonical heterozygous state was already present in the AC-containing parental strain. These findings reveal a unique form of nuclear variation, where individual nuclei within the coenocytic mycelium carry distinct chromosomal compositions, a pattern we term karyotype heterogeneity.
The observed karyotype heterogeneity provides the genomic flexibility for phenotypic plasticity and rapid adaptation
-
Meiotic non-disjunction typically triggers concurrent heterozygosity and aneuploidy. However, in strain 7S14, 10 chromosomes exhibited heterozygosity (Supplementary Fig. S21a) while aneuploidy was restricted to Chr08 and Chr11 (Supplementary Fig. S6), suggesting that CC aneuploidy is unstable during vegetative propagation. Serial subculturing further supported this. After five transfers on PDA, Chr08 and Chr11 duplication levels in strain 7S14 decreased to 1.1–1.4-fold, while the AC remained stable at 2.2-fold (Fig. 6b). Similar AC stability was observed in heterokaryotic strain 776 (Supplementary Fig. S25). These results reveal a divergence in ploidy dynamics, where CC aneuploidy undergoes purifying selection toward baseline copy number, whereas the AC exhibits higher tolerance.
Despite this stabilization of chromosomal ploidy after the fifth transfer, strain 7S14 showed significant growth variation during subculturing (CV = 74.8%, Fig. 6c), indicating drivers beyond chromosomal ploidy. Specific heterozygous chromosomes exhibited independent fluctuations in SNP allele-frequency (Fig. 6d) and k-mer-based heterozygosity (CV = 15.0%; Supplementary Fig. S26), consistent with persistent karyotype heterogeneity. These results support that, despite stable whole-genome coverage, ongoing fluctuations in nuclear-level (karyotype heterogeneity) serve as the potential driver of phenotypic plasticity in W. hoelen.
To quantify the adaptive potential conferred by karyotype heterogeneity, we subcultured strains 7S14 and 7S31 under heat stress (33 °C) and control conditions (28 °C) (Fig. 6e). Following three passages, we assessed the heat tolerance of all derived strains at 33 °C and under a more stringent condition (35 °C; Fig. 6f). LMM analysis revealed that higher temperatures predictably suppressed growth (q = 0.019), and the prior subculturing temperature had a significant positive effect on thermal fitness (q = 0.004; Fig. 6g). These results indicate that thermal adaptation arises rapidly during vegetative phase, supporting a model where a dynamic karyotype provides the genomic flexibility required for rapid adaptive radiation under environmental challenges (Fig. 6h).
-
ACs play important roles in pathogenic ascomycetes, yet their origins and functional consequences in non-pathogenic fungi remain poorly understood, particularly in basidiomycetes. Here, we characterize a non-canonical AC in W. hoelen with a recent endogenous origin, extensive repeat-mediated remodeling, and stage-dependent effects. Unlike ACs in fungal pathogens, this chromosome lacked canonical pathogenicity-associated features, including reduced secreted proteins and absence of transcription factors and secondary metabolite biosynthetic gene clusters, but was enriched in duplicated genes involved in meiotic recombination and chromosome segregation. Functionally, the AC imposed a dosage-dependent cost during vegetative growth, yet promoted chromosome mis-segregation, leading to increased heterozygosity, persistent karyotype heterogeneity, and enhanced adaptive potential in sexual progeny. These findings suggest that the W. hoelen AC mediates a phase-specific trade-off between vegetative fitness and progeny advantage, revealing an alternative evolutionary trajectory in which ACs facilitate phenotypic plasticity and adaptation in non-pathogenic basidiomycetes.
TEs act as potent engines of genomic diversification, catalyzing structural rearrangements and functional shifts[62]. In fungal pathogens, such elements often drive rapid evolution by creating highly plastic genomic compartments[63,64]. W. hoelen has undergone massive genome expansion, with a repeat content (44.37%), far exceeding that of six phylogenetically related species (5.12% to 21.79%; Supplementary Table S17). Only limited telomere-associated rearrangements were detected in Laetiporus sulphureus (Supplementary Fig. S10b), suggesting that TE bursts may play a pivotal role during the speciation of W. hoelen and provide the necessary genomic substrate for AC emergence. The AC's high repeat content, fragmented yet high-identity synteny with CCs, TE enrichments at breakpoints, and extensive gene duplications collectively indicate assembly from endogenous CC fragments during a recent TE-rich phase of genome restructuring (Fig. 3i). A similar LTR-retrotransposon-associated process has recently been described in the plant-pathogenic Ascomycota Diplocarpon coronariae[65], whereas ACs in T. fuciformis may originate from HGT rather than recent CC-derived assembly[7], indicating multiple evolutionary routes for ACs in basidiomycete. Furthermore, dosage plasticity of the tandem array across strains may contribute to AC evolution, consistent with findings in F. oxysporum, where segmental duplications shaped accessory-region evolution[66].
The low SNP density does not simply reflect a reduced intrinsic evolutionary rate. Under the conventional two-speed genome framework, repeat-rich or accessory-like compartments are typically more plastic and evolutionarily labile[67], making the low SNP density of the W. hoelen AC particularly unexpected. Most slow-evolving regions on CCs were concentrated at terminal regions (Fig. 2f), consistent with widespread telomere-associated recombination at CC termini (Supplementary Fig. S10a). This pattern likely reflects recent recombination-mediated expansion and sequence homogenization. Our LTR insertion analysis supported this model. After filtering ancestral remnants, all intact LTR-RTs on the AC inserted between 0 and 0.328 Mya, except for an outlier at 0.712 Mya, which likely represents a putative ancestral element (Fig. 3e). These data indicate the AC likely emerged around 0.328 Mya. A region retaining collinearity with CC regions in both 1695 and SS20 (91.58%–95.33% identity; Supplementary Fig. S27) may reflect ancestral chromosome breakage or a homologous chromosomal region in other strains, whereas additional ancestral fragments may have been eroded by TE-mediated disruption. Based on terminal sequence identity, we infer that the AC initially acquired a 5' telomere from Chr05 approximately 0.303 Mya (98.79% identity), possibly following DNA breaks induced by DNA transposons. Both telomeric ends of the AC subsequently underwent homogenization around 0.020 Mya (99.92% identity), likely triggered by recombination following LTR-retrotransposon-mediated DNA damage (Fig. 3i), highlighting a dynamic interplay of recombination, TE activity, and sequence homogenization in AC evolution. This low SNP density was likely associated with the recent emergence of the AC, which left limited time for detectable polymorphisms to accumulate among the sampled strains.
In several plant and animal B chromosomes, large rDNA clusters have been implicated in nondisjunction, possibly because repetitive arrays remain topologically entangled and segregate late, increasing the likelihood of chromosome mis-segregation[53,68]. Although the W. hoelen AC lacks rDNA arrays, it carried a large tandem array accounting for nearly one third of the chromosome, which may create a similar structural context favoring irregular segregation. Another contributing factor was the amplification of meiosis- and chromosome-segregation genes on the AC, including msh4 (11 copies) and nuf2 (2 copies), almost exclusively single-copy in publicly available fungal genomes. Functionally, MSH4 mediates meiosis crossover formation[69], and NUF2 is critical for kinetochore–microtubule attachment[70]. Transcriptomic profiling confirmed active expression of AC-encoded msh4 and nuf2, with AC-encoded nuf2 expressed markedly higher than the CC-encoded copy (Supplementary Fig. S8). The repeat-rich architecture, coupled with dosage alteration of core segregation machinery, may provide a composite mechanism potentially biasing AC transmission and elevating genome-wide instability. In this model, the giant tandem array may physically impede timely chromosome separation, representing a non-exclusive structural mechanism that complements nuf2-mediated perturbation of kinetochore–microtubule attachment. In particular, because nuf2 overexpression can induce aneuploidy by perturbing spindle attachments[60], high expression of AC-encoded nuf2 provided a plausible molecular basis for CC aneuploidy and the observed positive association between AC dosage and CC copy number in W. hoelen (Fig. 6a). Moreover, AC copy number remained stable during subculturing, even in lineages with elevated AC dosage (Fig.6b; Supplementary Fig. S25), suggesting the existence of an additional, as yet unidentified mechanism that preferentially safeguards AC maintenance.
Through chromosome- and centromere-level heterozygosity analyses, we confirmed that CC aneuploidy in W. hoelen arose during both meiosis and mitosis, consistent with the roles of msh4 and nuf2 in chromosome segregation. However, CC aneuploidy was unstable during serial passaging (Fig. 6b), trending toward euploidy over time. As heterozygous chromosomes generated during meiosis are differentially retained or lost during mitotic propagation, divergent chromosomal compositions are maintained in individual nuclei, resulting in pronounced karyotype heterogeneity (Fig. 6h). Frequent CNV and rapid structural variation have also been observed for both AC and CCs in the dimorphic basidiomycete T. fuciformis[7], suggesting that such chromosome dynamism may be more widespread in Basidiomycete rather than an isolated phenomenon unique to W. hoelen.
Recent work in two pathogenic ascomycetes demonstrated that chromosome compositions can differ among coexisting nuclei in multinucleate fungi[13]. We identified a non-canonical heterozygous state in the sexual progeny of the basidiomycete W. hoelen. T2T genome assembly, SNP allele-frequency, and Hi-C interactions revealed distinct chromosomal compositions across nuclei, uncovering nuclear-level karyotype heterogeneity. This architecture may explain fluctuating SNP allele-frequency, persistent phenotypic variation, and rapid thermal adaptation. Consistently, chromosome-wide coverage profiles were highly uneven at the earliest stage but became smoother and more stable after serial passaging (Supplementary Fig. S28), suggesting progressive recovery through mitotic sorting and selection.
Our work provides insight into why the AC is maintained despite its clear cost during asexual growth. AC dosage was negatively associated with vegetative growth, and AC loss reproducibly accelerated growth. This fitness penalty appears linked to metabolic and redox imbalances, as AC loss was accompanied by activation of central metabolism, antioxidant pathways, and weaker DAB/NBT staining. However, this vegetative burden may be offset during sexual reproduction. AC may indirectly enhance the production of higher-performing progeny by promoting meiotic chromosome mis-segregation, heterozygosity, and nuclear-level variation, thereby introducing persistent karyotype heterogeneity into the coenocytic mycelium (Fig. 6h). Such nuclear diversity likely provides the genomic flexibility that facilitates adaptation to environmental fluctuations, such as heat stress. In sexual progeny, fitness correlated more strongly with heterozygosity than with AC copy number alone. Given that increased AC dosage imposes a fitness cost, this suggests that the AC primarily serves as a facilitator for downstream genetic variation, which provides an overriding adaptive benefit.
Some limitations remain in the current analysis. First, CNV was inferred from bulk sequencing depth and thus reflects population means rather than direct single-nucleus karyotypes. Second, although the benomyl-based loss strategy introduced CC perturbations (Fig. 4b), repeated convergence of phenotypes across independently derived backgrounds indicated that the observed effects primarily reflect AC absence rather than random chromosome changes. Third, while AC-expanded genes such as msh4 and nuf2 are implicated in chromosome transmission instability, direct functional tests are still lacking. Future single-nucleus genomics, single-nucleus transcriptomics, and targeted deletion of AC-expanded genes will be essential to clarify how this chromosome is maintained and whether it functions as a dynamic accessory element or a transient platform for rapid lineage-specific innovation. Resolving this question may also inform germplasm optimization and strain improvement in this economically important medicinal fungus.
-
We uncovered a recently emerged endogenous AC in W. hoelen, which followed a non-canonical evolutionary trajectory. Originating from CC fragments and subsequently reshaped by repeat-driven expansion and structural remodeling, this AC formed a highly repetitive, slow-evolving genomic compartment enriched in meiosis- and chromosome-segregation genes. While it imposes a dosage-dependent cost on vegetative growth and abiotic stress tolerance, it promotes chromosome transmission instability, CC aneuploidy, and elevated heterozygosity in sexual progeny. The resulting karyotype heterogeneity provides a genomic substrate for phenotypic plasticity and rapid adaptation. These findings reveal an evolutionary trade-off in which the AC constrains vegetative performance while increasing genomic variation in the progeny, highlighting a previously underappreciated mode of AC evolution and expanding our understanding of fungal genome adaptability beyond pathogenic contexts.
-
Not applicable.
-
The authors confirm their contribution to the paper as follows: study conception and design: Wang M, Dong CH; data collection: Wang M, Wang Q, Dong CH; analysis and interpretation of results: Wang M, Dong CH; draft manuscript preparation: Wang M, Dong CH, Wang Z, Xu JP. All authors reviewed the results and approved the final version of the manuscript.
-
The data that support the findings of this study are available in the NCBI repository. These data were derived from the following resources available in the public domain: BioProject accession number PRJNA1230766.
-
The authors declare that they have no conflict of interest.
-
accompanies this paper online at: https://doi.org/10.48130/mycosphere-0026-0018.
- Supplementary Table S1 Genome sequencing datasets used in this study.
- Supplementary Table S2 Fifteen primer pairs and expected product lengths for multiplex PCR designed based on single-copy genes to assess chromosome ploidy.
- Supplementary File 1
- Supplementary Table S3 Genome information of representative Polyporales species used for phylogenetic analysis.
- Supplementary Table S4 Primer sets used for PCR-based detection of AC presence.
- Supplementary Table S5 Global statistics for the new SS20 assembly.
- Supplementary Table S6 Comparison of genome features between SS20 and previously published strains.
- Supplementary Table S7 Genome quality assessment using BUSCO.
- Supplementary Table S8 Information on 34 heterokaryotic strains and their chromosomal ploidy.
- Supplementary Table S9 SNP counts of protoplast-regenerated strain of strain 1695 used for haplotype phasing.
- Supplementary Table S10 Chromosomal ploidy statistics of sexual progeny derived from strain 776.
- Supplementary Table S11 KEGG enrichment analysis of genes located on the AC.
- Supplementary Table S12 Summary of RNA-seq alignment statistics for AC-containing and AC-lost strains, with reads mapped to the SS20_T2T reference genome.
- Supplementary Table S13 GO enrichment analysis of expressed AC genes.
- Supplementary Table S14 Expression levels and functional annotations of 27 AC genes with TPM ≥ 100.
- Supplementary Table S15 Highly upregulated genes (log2FC > 3) shared between both comparisons (1695SS11 × 7S32L vs. 1695SS11× 7S32; 1695SS11 × 7S45 L vs. 1695SS11 × 7S45).
- Supplementary Table S16 GO enrichment analysis of downregulated CC genes.
- Supplementary Table S17 Repeat content of six related species.
- Supplementary Fig. S1 Fruiting body, basidiospores, protoplasts of strain 776 and mating-type identification of progeny derived from Wolfiporia hoelen strains.
- Supplementary Fig. S2 Workflow for screening candidate non-fungal horizontally transferred genes.
- Supplementary Fig. S3 Overview of the SS20 genome.
- Supplementary Fig. S4 Correction of the SS20 genome assembly.
- Supplementary Fig. S5 Normalized read depth of the remaining 28 heterokaryotic strains.
- Supplementary Fig. S6 Normalized read depth of the remaining 23 sexual progeny derived from strain 776.
- Supplementary Fig. S7 Domain architecture and structural conservation of MSH4 and NUF2.
- Supplementary Fig. S8 Allele expression analysis of msh4 and nuf2.
- Supplementary Fig. S9 Repeat composition across chromosomes of the SS20 genome.
- Supplementary Fig. S10 Pairwise similarity among 10-kb terminal regions of chromosomes.
- Supplementary Fig. S11 RNA-seq analysis of two independent AC-containing and AC-lost strain pairs.
- Supplementary Fig. S12 Growth performance of heterokaryotic strains in pine sawdust substrate.
- Supplementary Fig. S13 Growth performance of heterokaryotic strains on PDA.
- Supplementary Fig. S14 Transcriptional changes of key enzymes involved in glycolysis and the tricarboxylic acid (TCA) cycle.
- Supplementary Fig. S15 SNP allele frequencies of 12 CC aneuploidy events in sexual progeny derived from strain 776.
- Supplementary Fig. S16 Fruiting bodies, basidiospores, and resequencing analysis of wild AC-absent strains 1675 and 1695.
- Supplementary Fig. S17 CC aneuploidy events in three AC-containing parental strains (754, 755, and 765) and their sexual progeny.
- Supplementary Fig. S18 Growth performance of sexual progeny derived from strain 776 on PDA substrate.
- Supplementary Fig. S19 Growth performance of sexual progeny derived from strain 776 in pine sawdust substrate.
- Supplementary Fig. S20 GenomeScope analysis of strains 7S14 (a) and 7S31 (b).
- Supplementary Fig. S21 Genomic evidence for karyotype heterogeneity.
- Supplementary Fig. S22 SNP allele-frequency analysis in progeny 7S31.
- Supplementary Fig. S23 Hi-C interaction partitioning of the 10 heterozygous chromosomes in the 7S14 genome.
- Supplementary Fig. S24 CC aneuploidy events in ten protoplast-regenerated strains derived from strain 776.
- Supplementary Fig. S25 Genome coverage of strain 776 during subculturing.
- Supplementary Fig. S26 GenomeScope analysis of subcultured derivatives of strain 7S14.
- Supplementary Fig. S27 Collinearity of a putative ancestral chromosome breakage-derived segment in the AC with the Chr01 in SS20_T2T, 1695_hapA and 1695_hapB.
- Supplementary Fig. S28 Chromosome-wide coverage of 7S14 strains from different generations, mapped to the 7S14_set1 genome.
- Supplementary File 1 Supplementary materials to this study.
- Copyright: © 2026 by the author(s). Published by Maximum Academic Press, Fayetteville, GA. This article is an open access article distributed under Creative Commons Attribution License (CC BY 4.0), visit https://creativecommons.org/licenses/by/4.0/.
-
About this article
Cite this article
Wang M, Wang Q, Xu JP, Wang Z, Dong CH. 2026. Endogenous accessory chromosome mediates evolutionary trade-off between vegetative fitness and progeny advantage in a non-pathogenic basidiomycete. Mycosphere 17: e018 doi: 10.48130/mycosphere-0026-0018 

Endogenous accessory chromosome mediates evolutionary trade-off between vegetative fitness and progeny advantage in a non-pathogenic basidiomycete
- Received: 13 April 2026
- Revised: 25 June 2026
- Accepted: 03 August 2026
- Published online: 29 September 2026
Abstract: Accessory chromosomes contribute to genome plasticity in fungi, yet their roles in non-pathogenic basidiomycetes remain poorly understood. Here, we identified an accessory chromosome in Wolfiporia hoelen characterized by extensive repeats, large tandem arrays, and enrichment of meiosis- and chromosome-segregation genes. Its unusually low population-level single nucleotide polymorphism density and young long terminal repeat retrotransposon insertions supported a recent emergence. Comparative genomics support a recent endogenous origin from core chromosome fragments, followed by transposable element-mediated expansion and structural remodeling. Across the population, accessory chromosome dosage is negatively associated with vegetative growth, and strains that lost the chromosome grow faster and show greater tolerance to abiotic stresses, indicating a dosage-dependent cost during the vegetative stage. Transcriptomic analyses further reveal that this vegetative cost is associated with perturbations in primary metabolism and redox homeostasis. Simultaneously, the accessory chromosome promotes both mitotic and meiotic chromosome mis-segregation, increased core chromosome aneuploidy, and generates distinctive heterozygosity patterns in sexual progeny, conferring heterozygote advantage, particularly on complex substrates. Frequent mis-segregation also produces distinct chromosomal compositions across nuclei, providing a basis for phenotypic plasticity and rapid adaptation. Together, these results show that a recently emerged endogenous accessory chromosome mediates a phase-specific trade-off between vegetative fitness and progeny adaptation, broadening current understanding of accessory chromosome evolution and fungal plasticity beyond pathogenic contexts.