


-
Soil contamination with trace elements (TEs) is a global environmental issue affecting food production, food quality, and human health[1−3]. Technological development has resulted in soil contamination with emerging/novel TEs, such as Li, Ga, and In, which have been relatively poorly studied as environmental contaminants[4]. Many novel TE contaminants may present a risk to agriculture and human health through plant uptake and translocation, ingestion of soil sorbed to plant material, and contamination of drinking/irrigation water into which these elements have leached. Quantification of the fluxes of TE in the soil–plant system is a critical component of risk assessment and environmental protection[5].
Much research has sought to quantify TE mobility in various soil–plant systems, and to understand the effect of physicochemical and biological parameters. In most soils, plant uptake is some function of the distribution coefficient, KD (the sorbed/soluble concentration coefficient)[6]. The soluble fraction also has the potential to leach into receiving waters[7]. Bioaccumulation coefficients (BAC), the soil/plant concentration quotient, ultimately determine the risk of TEs entering plant material and the animal food chain. Soil pH, organic matter, iron, aluminium and manganese oxides, and redox potential affect the mobility of trace elements in the soil–plant system[8,9]. Therefore, the mobility of TEs varies between soil types[10] and plant species[11−13]. Modelling TE fluxes using these parameters requires exhaustive measurements[14]. Key measurements vary between elements[15], at which point it is often easier to measure soil and plant concentrations directly.
The disadvantage of using BAC from the literature is that they vary over many orders of magnitude in different systems, over different soil types, climatic conditions, and plant species. Bioaccumulation coefficients for Cu varied from 0.004 to 22 in various plant species, and Cd 0.03–14.98, Cr 0.11–109.44, Ni 0.03–58.95, and Pb 0.02–29.69 in the review by Khan et al.[16]. With so many plant species, environmental systems, and TEs, it is infeasible to use reported BAC to accurately describe a new system.
Most research assessing plant uptake of TEs focuses on soil properties, but there is increasing evidence that chemical properties of the TE itself are of critical importance in both plant uptake and in downward mobility. Tyler[17] reported that plant uptake in the roots was negatively correlated with ionic potential (charge/ionic radii) (IP) in beech trees in southern Sweden, and similarly the ionic potential was negatively correlated with the uptake of various elements in forest species in the Willamette Valley, USA[18].
The IP is not the only measure capable of describing this chemical behaviour. Hydrated radius is a measure of the size of the atom plus surrounding water molecules, with ions which have stronger electrostatic attractions pulling in water molecules more tightly and thus having smaller hydrated radii[19]. We hypothesize that ions with larger hydrated radii will be less strongly sorbed to soil and taken up by plants at higher concentrations. The bond distances between ions and oxygen in the hydrated radii (Me–O) are also hypothesized to be positively correlated to plant uptake, as ions with larger hydrated radii have longer Me–O. Lower ionic strength increases bioaccumulation in three ways—less sorption to soil, increased transport into the root xylem, and increased transport up the xylem into above-ground biomass[20,21].
Studies of the effects of TE chemical properties on plant uptake are limited. Thus far, there have only been a couple of studies on the effect of IP on BAC, and no studies on the effects of HR and Me–O on the BAC of any plant species. The aim of this study was to test if the IP, HR, and Me–O of TE cations are significantly related to BAC, to help us better understand and predict the mobility of TEs in the soil–plant system, both contaminants and essential micronutrients, while reducing the amount of invasive and time-consuming measurements. We determined if IP, HR, and Me–O significantly affect BAC by measuring BAC of TEs in a ryegrass pot trial, in various pasture species across New Zealand, and in oil palm in Indonesia. This study included a range of locations, TEs, and plant species to determine if the relationships between IP, HR, and Me–O, and BAC are robust across a range of environments.
-
A Fluvial Recent Soil[22] from Christchurch (−43.5229981 S, 172.5873929 E) (Table 1) was collected, dried at 105 °C, and sieved to 2 mm.
Table 1. Properties of the Christchurch Fluvial Recent Soil used for the PRPO
Soil property type Soil property value pHab 5.3 Olsen P (mg L−1)a 27 CEC (cmol[+] kg−1)a 13 Base saturation (%)a 61 Total C (%)a 1.9 Texture Loamy sand Sand (%)d 80.4 Silt (%)d 16.2 Clay (%)d 3.1 a Analysis from Hill Labs; b Determined by H2O, 1:2 v/v soil:water; c Sum of extractable cations and extractable acidity; d Particle size distribution measured in a Saturn DigiSizer II 5205 v1.03, soil textures classified by the texture diagram in McLaren & Cameron[23]. Approximately 250 g of soil was placed into pots (100 mm × 70 mm × 50 mm), watered and left to equilibrate for 7 weeks in a greenhouse at the University of Canterbury, in Christchurch, New Zealand, then sown with 50 seeds of perennial ryegrass variety Nui on 9th October 2019. Pots were watered daily to field capacity with overhead sprinklers; the perennial ryegrass germinated within 1 week, and the pots were harvested on 17 December 2019 and 13 January 2020.
New Zealand pasture sampling (NZPA)
-
Soil and pasture samples were collected from 39 sites around New Zealand in 2009–2010 as per Reiser et al.[24]. Locations are in Supplementary Fig. S1 and Supplementary Table S1. Soil orders included Brown, Gley, Recent, and Semiarid[22].
Indonesia oil palm sampling (IOP)
-
Soil samples were collected from four sites in Sumatra, Indonesia, each with a history of oil palm production[25,26]. Sites included two abandoned plantations with remaining trees, one active smallholder plantation, and one ex-plantation where most trees were removed. All sites were on Acrisol soils (roughly equivalent to Oxidic and Ultic Soils under the New Zealand Soil Classification). Abandoned sites had no management or fertiliser for at least 3 years. The active site had recent fertiliser and pesticide use. The ex-plantation site was transitioning to other land uses with no recent amendments. Seventeen soil and pasture samples were used in analysis.
After removing surface litter, soil samples were taken to a depth of 15 cm using a spade. Samples were at least 20 m apart and between oil palm rows. The number of samples per site reflected the area: 25 from each large site, 10 from the smallholder site. Plant leaf material was collected from Elaeis guineensis (oil palm) trees, washed and dried at 60 °C prior to transport back to New Zealand.
Analyses of plants and soils
-
All soil samples were dried at 105 °C until a constant weight was obtained, ground using a mortar and pestle, and sieved to < 2 mm. Plant samples were dried at 60 °C until a constant weight was reached.
For the PRPO and IOP datasets, plant and pseudo-total soil TE concentrations were determined by weighing out 0.2 g of the dried sample and digesting with nitric acid using an Ultrawave Single Reaction Chamber Microwave Digestion Unit following EPA Method 3051A. For NZPA, plant samples were milled with a Cyclotech type 1093 cyclone grinder, digested in 5 mL HNO3, diluted, and filtered with 7 µm pore size filter paper. Soil samples were digested in 5 mL aqua regia.
Solutions were analysed with inductively coupled plasma mass spectrometry (ICP-MS), ICP optical emission spectrometry (ICP-OES), or microwave plasma atomic emission spectrometry (MP-AES), depending on the element. Quality control included blanks and standard reference materials[27,28] with each analytical batch, with a mean recovery of 111% (68%–164%).
Calculations and statistical analysis
-
Bioaccumulation coefficients were calculated using Eq. (1), where Cp is the TE concentration in above-ground plant biomass (mg kg−1 DW), and Ctot is the pseudo-total soil concentration (mg kg−1 DW).
$ \mathit{BAC}\mathrm{\ =\ }\mathit{C}_{\mathrm{p}}\mathrm{/}\mathit{C}_{\mathrm{tot}} $ (1) Ionic potentials were calculated using Eq. (2), where z is the charge of the cation and r is the ionic radius (Å).
$ \mathit{IP}\mathrm{\ =\ }\mathit{z}\mathrm{/}\mathit{r} $ (2) The Me–O distances for hydrated ions used in data analysis are from Persson[29], de Almeida et al.[30], and Rudolph & Irmer[31], using the Me–O distances for the most common aqueous species found in soil[32−34]. Ionic potentials are from Shannon[35] for high-spin ions[36−39], and where available, hydrated radii are from Volkov et al.[40], Hanafi[41], and Tansel[42].
All statistical analysis was completed in Excel. Geometric means and standard errors were calculated for the New Zealand pasture and Indonesian oil palm sampling. Locations where some measurements were below detection limit were excluded from the datasets to allow accurate comparison between elements. Trendlines were fitted for all datasets, with the trendline of best fit chosen. Linear regression analysis was completed on all the datasets to determine whether the relationships were statistically significant.
-
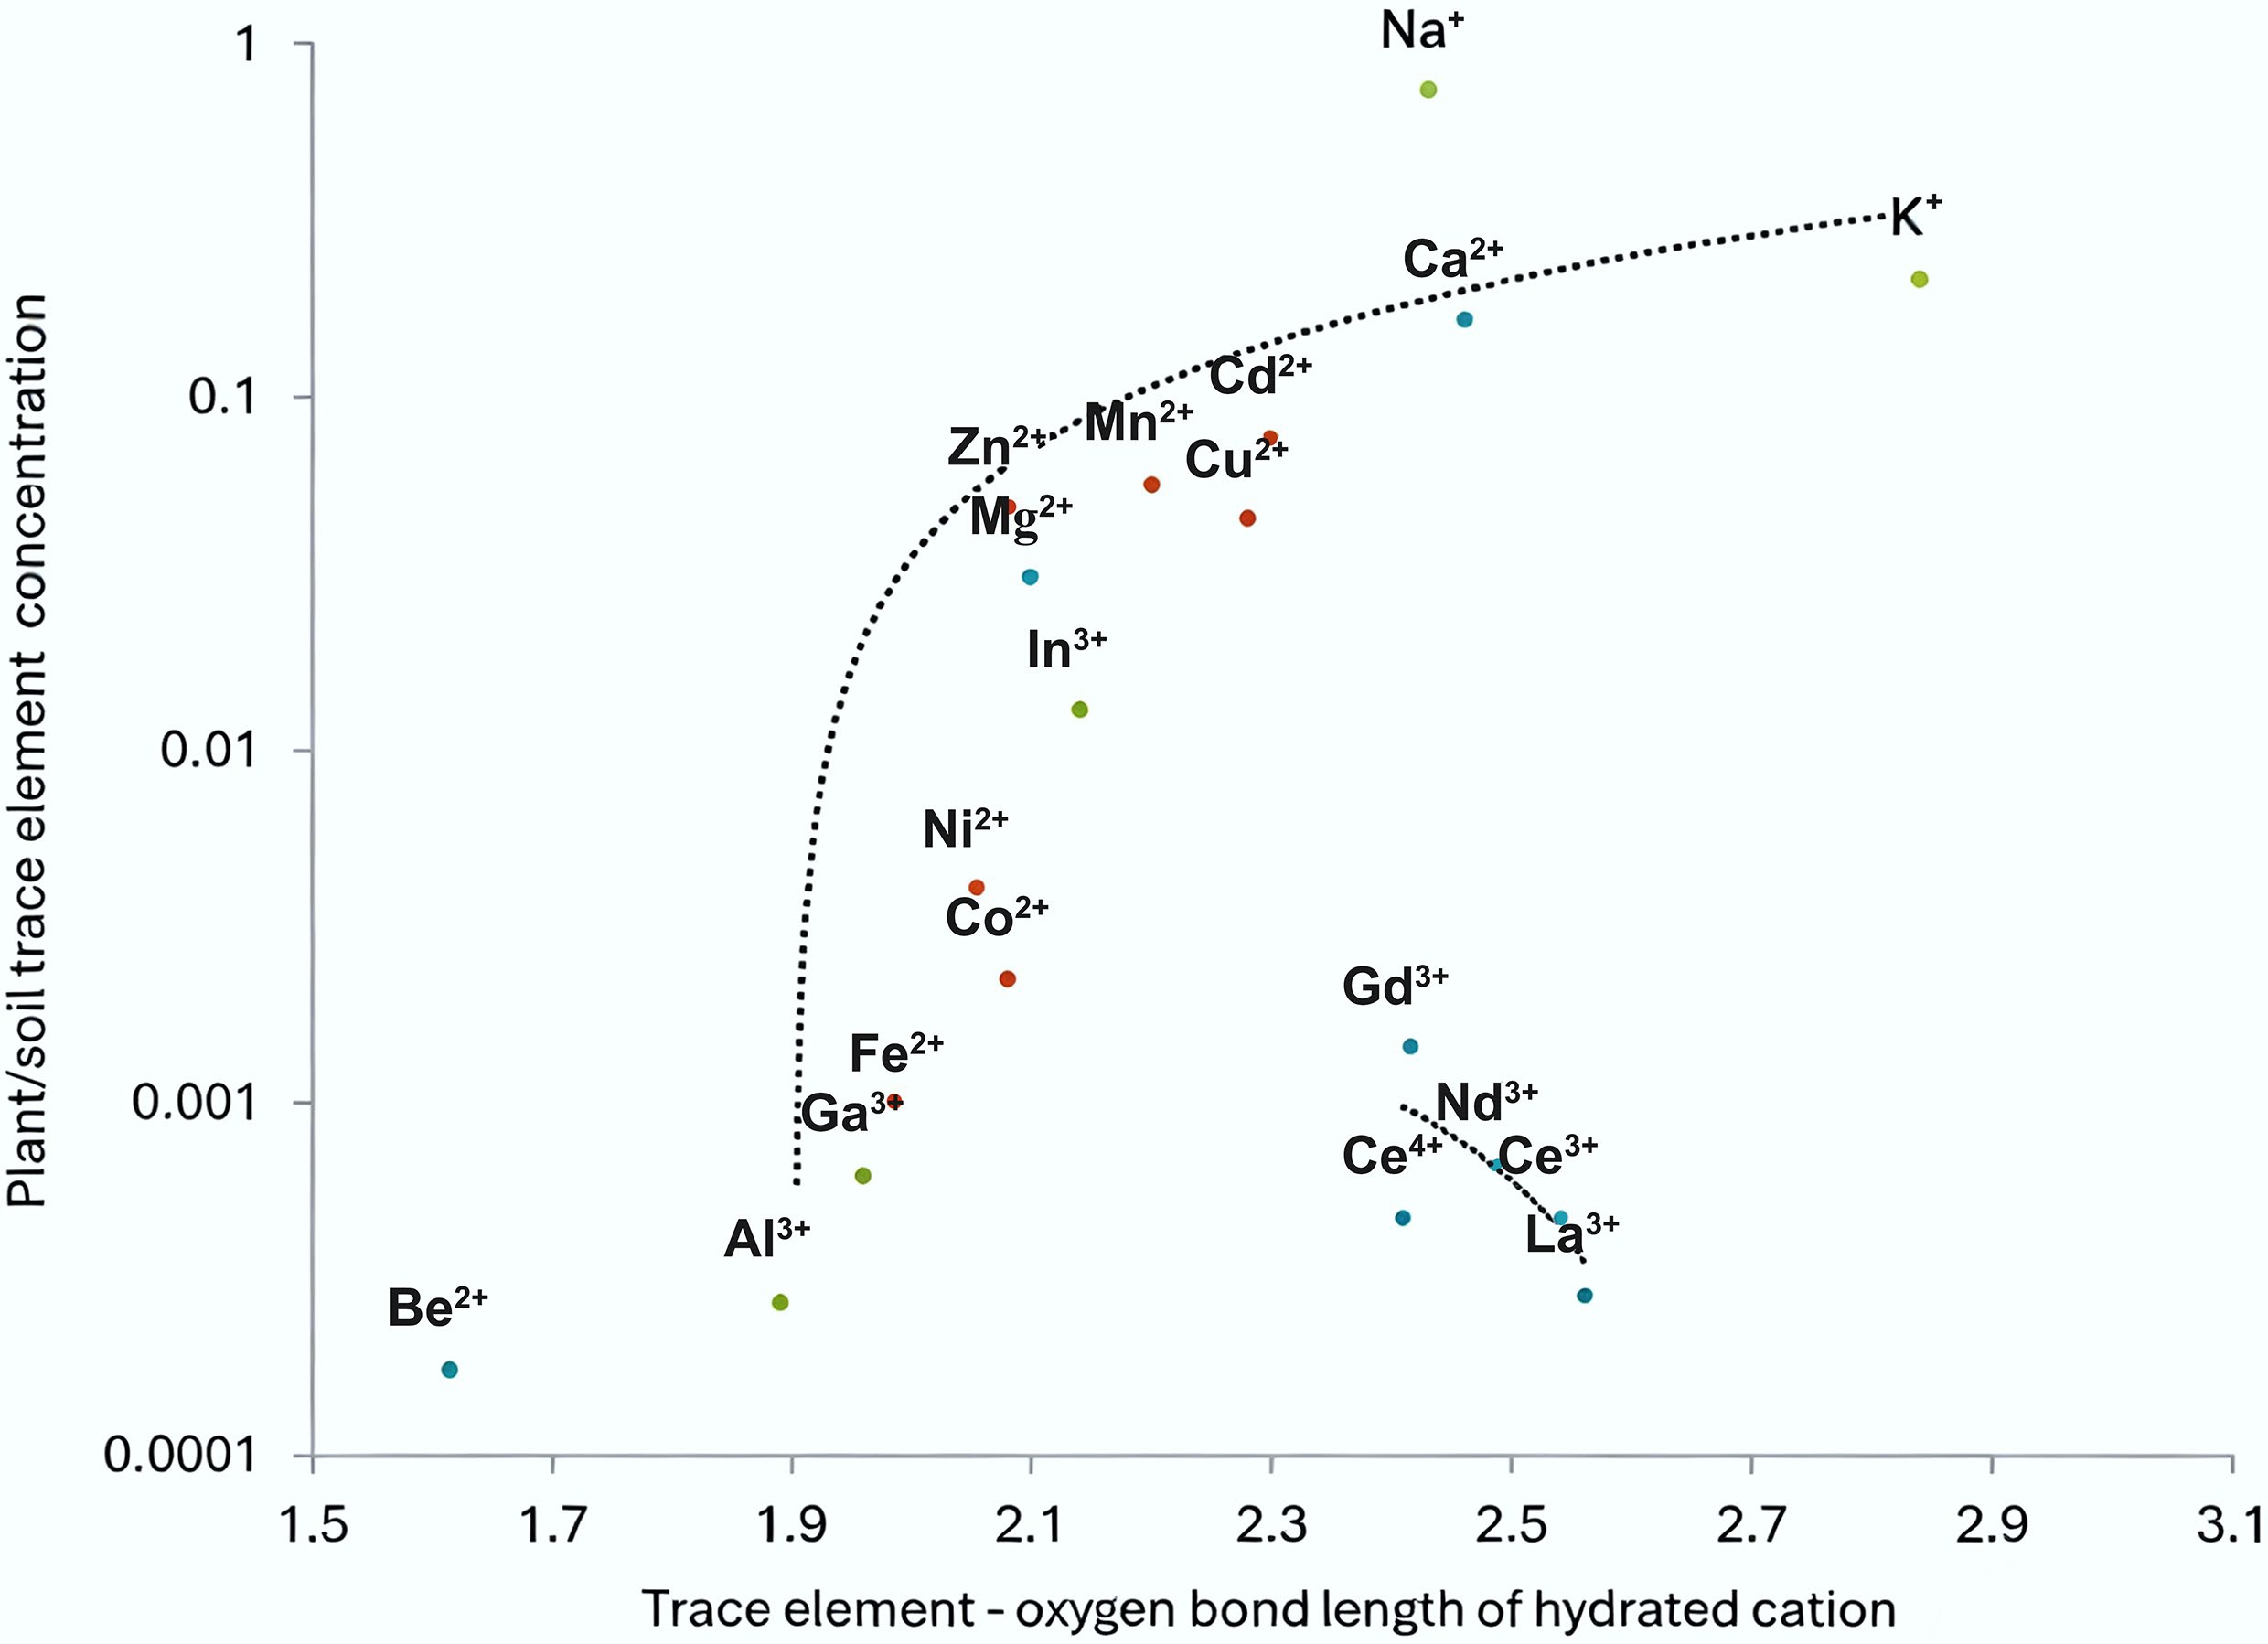
In all three datasets, Me–O were positively correlated with BAC, and HR and IPs were negatively correlated with BAC (Fig. 1). Lanthanides were the exception to these three trends, with the BACs of the lanthanide elements (La, Ce, Nd, and Gd) decreasing as Me–O of the lanthanides increased in the PRPO dataset. Despite much larger Me–O bond lengths, the BACs of the lanthanides were similar to those of Al, Fe, and Ga, which had proportionally small Me–O and BACs. Therefore, the lanthanides were excluded from the regression analysis in the PRPO and IOP datasets to improve the significance of the correlations and to improve the fit of the trendlines. All the correlations were significant with associated high R2 values (Table 2) except for the correlation between the IP and BAC in the IOP dataset (Table 3). The correlation between Me–O and BAC in the PRPO dataset was not significant until the lanthanides were removed, as shown in Table 3, when the p value from regression decreased from 0.167 with the lanthanides in the dataset to 0.040 without the lanthanides in the dataset, which was below the threshold of significance. The R2 values of the trendlines ranged from 0.2859 to 0.8411 (Table 2), and trendline shapes varied between linear, logarithmic, exponential, and power. Tables 2 and 3 include the R2 and p values from the datasets without lanthanides, and with lanthanides, if applicable, with the numbers shaded grey. Data could not be found for the HR of Ce3+, Ce4+, Cr3+, Ga3+, Gd3+, In3+, La3+, Mn2+, Nd3+, and Sr2+.
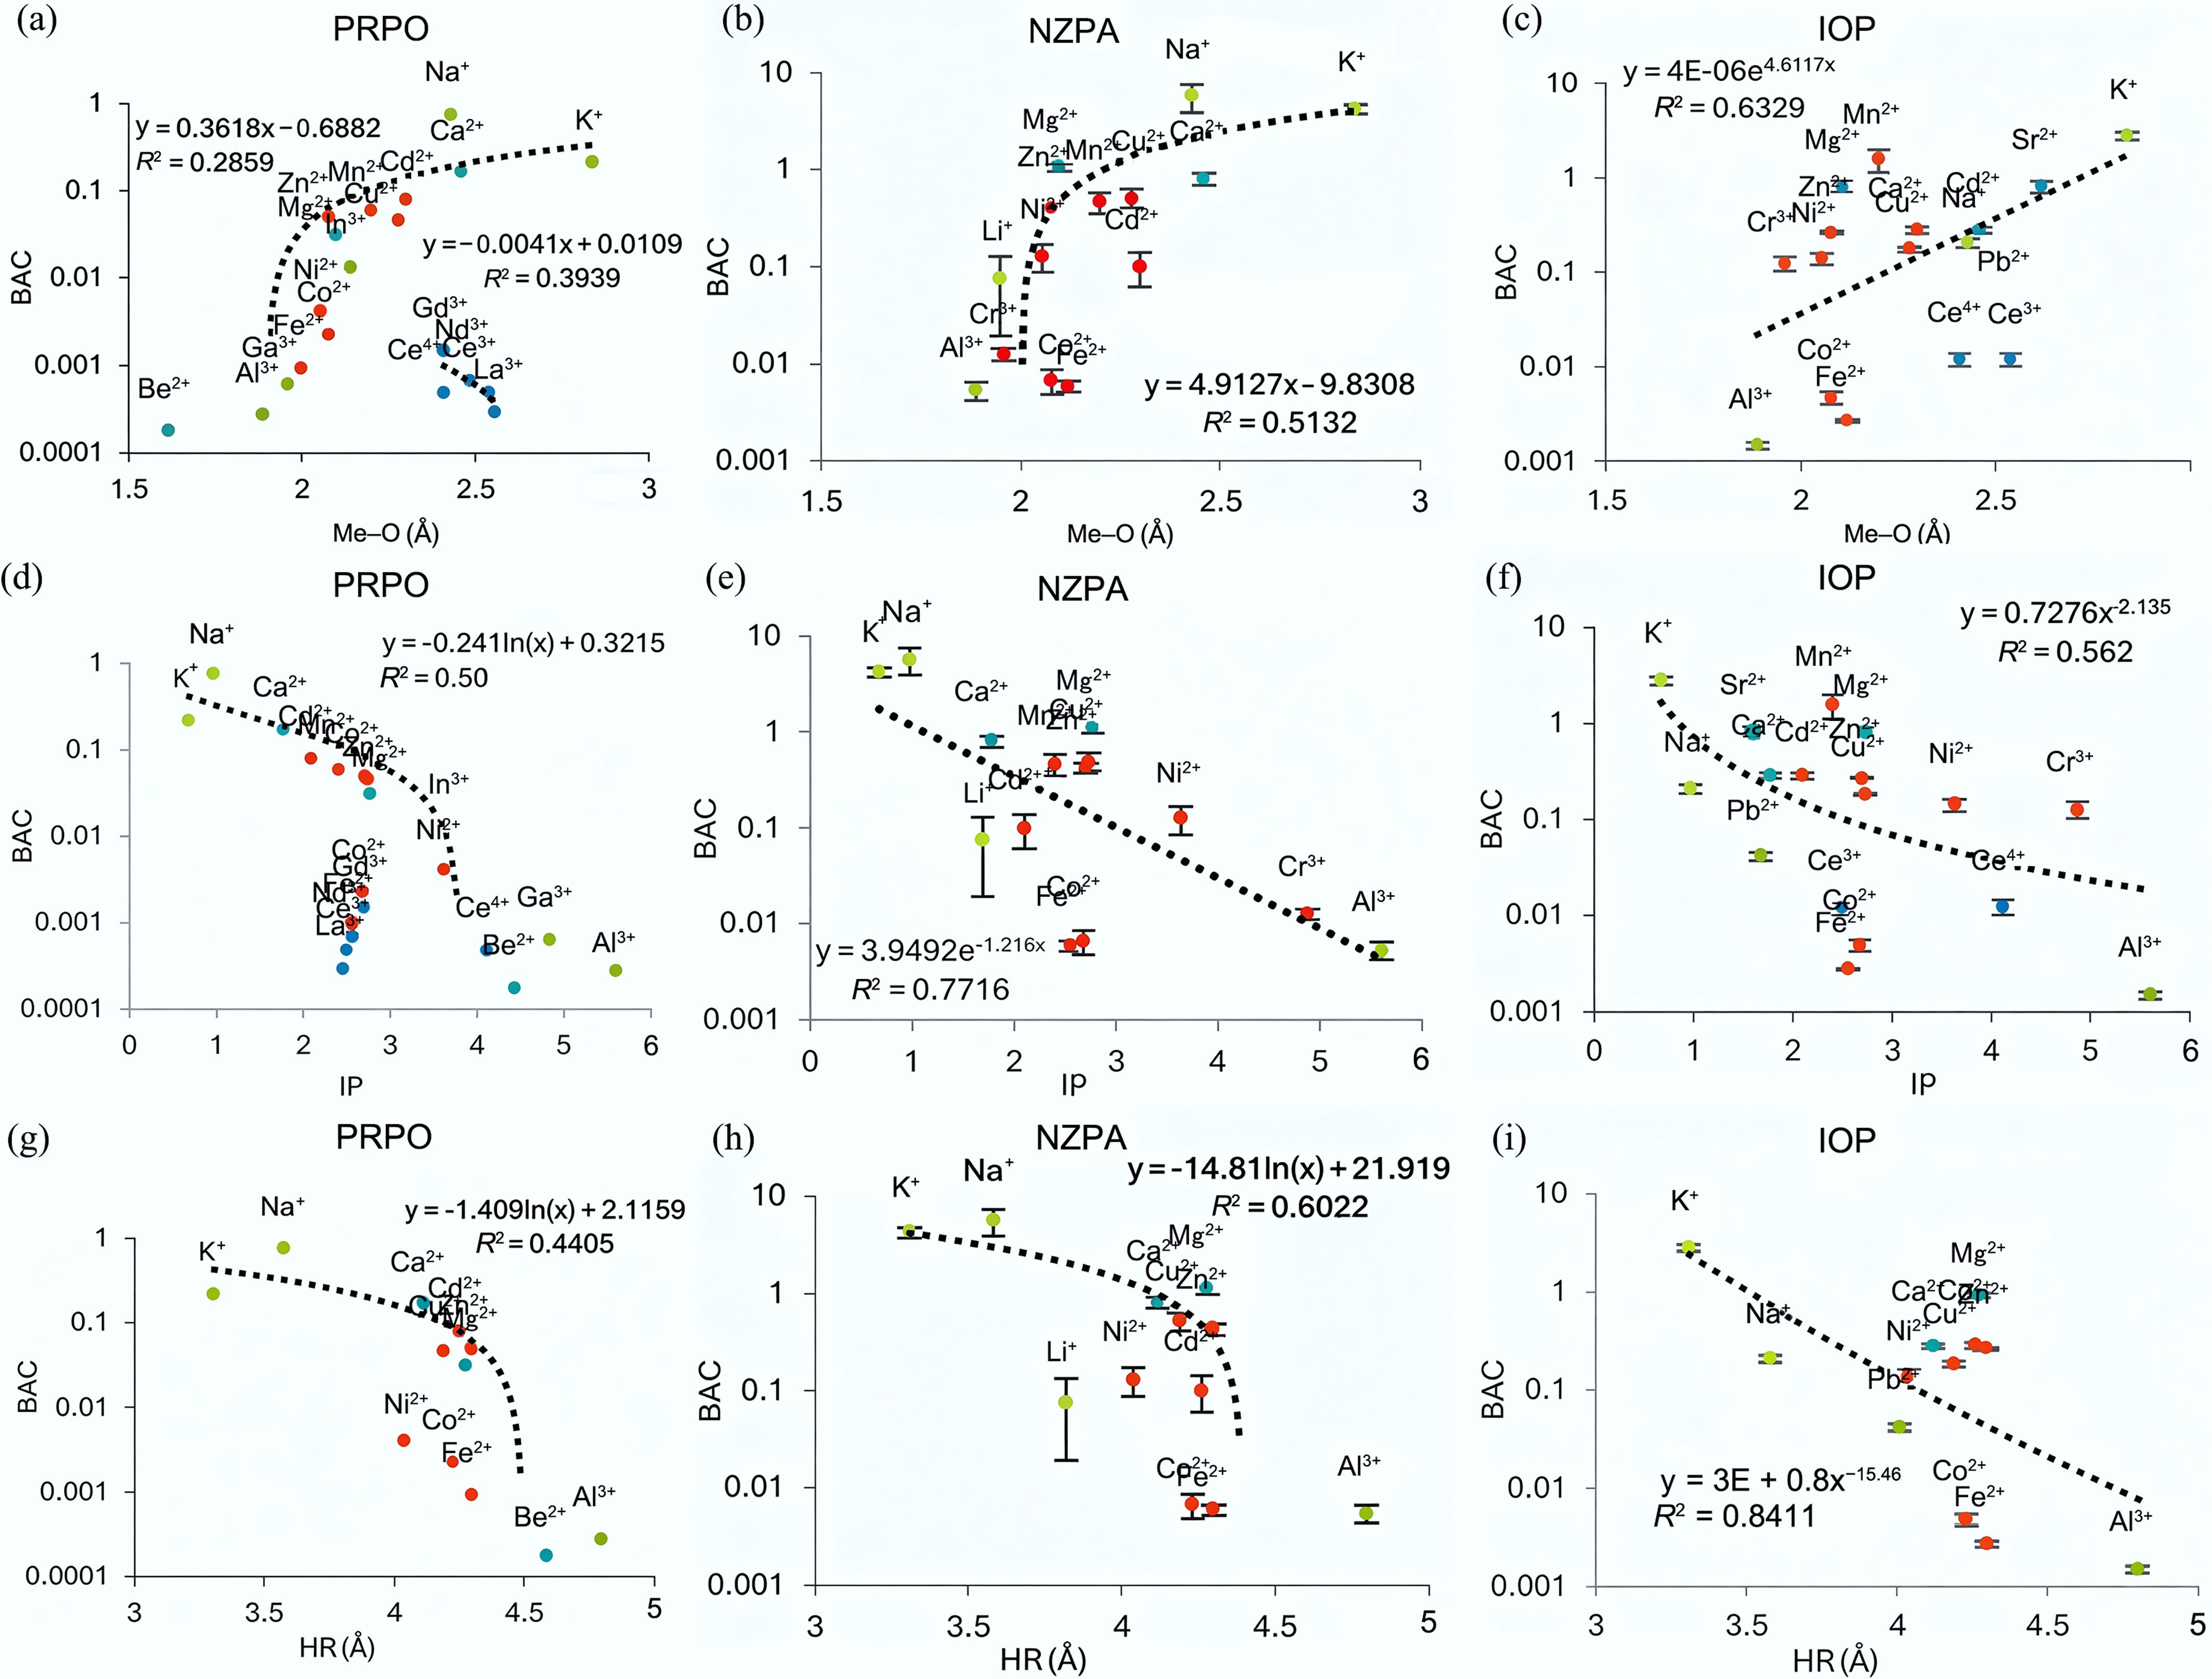
Figure 1.
(a), (d), (g) Effect of Me–O, IP, and HR on the BAC of various elements in a perennial ryegrass pot trial (PRPO). (b), (e), (h) New Zealand pasture (NZPA); and (c), (f), (i) Indonesian oil palm (IOP). Trendlines (except for the small trendline in the first figure) do not include lanthanide elements (La, Ce, Nd, and Gd). Error bars show standard error. The trendlines for graphs (a) and (b) are linear; (d), (g), and (h) are logarithmic; (c) and (e) are exponential; and (f) and (i) are power.
Table 2. R2 values for the trendlines in Fig. 1. between Me–O, IP, and HR, and BAC for the PRPO, NZPA, and IOP datasets
Dataset Measure Me–O IP HR PRPO 0.2859 0.501 0.4405 0.1035 0.3193 NZPA 0.5132 0.7716 0.6022 IOP 0.6329 0.562 0.8411 0.5036 0.581 Bold numbers are the R2 values before lanthanides were removed from the dataset. Table 3. p values for linear regression analysis between Me–O, IP, and HR, and BAC for the PRPO, NZPA, and IOP datasets
Dataset Measure Me–O IP HR PRPO 0.040* 0.016* 0.019* 0.167 0.009** NZPA 0.004** 0.021* 0.004** IOP 0.023* 0.086 0.019* 0.050* 0.057 Bold numbers are the R2 values before lanthanides were removed from the dataset. Stars denote significance; * is significant, ** is very significant, and *** is highly significant. Trendline curves vary, and are specified in Fig. 1.
While the correlation between Me–O and BAC fit our hypothesis, the correlation between HR and BAC was unexpected based on our understanding. This could be due to inconsistencies within data measurement; there are papers compiling Me–O and ionic radii for a wide range of elements, including all the elements measured in this study[29,35]. HR values could not be found for Ce3+, Ce4+, Cr3+, Ga3+, Gd3+, In3+, La3+, Mn2+, Nd3+, and Sr2+, and the collected values were spread across three different papers. The lack of data available means that HR has less practical use than Me–O and IP, particularly for measuring the mobility of emerging contaminants such as Ga, In, Nd, and Gd.
Comparison of results with other studies
-
Our findings that IP is negatively correlated with BAC are consistent with previous work involving Beech trees in southern Sweden[17] and in various species from a forest in Oregon, USA[18]. Our findings extend those of Tyler[17] who measured the roots only, neglecting above-ground biomass; translocation of TEs from root to shoot also varies with ion charge, e.g., trivalent cations binding to oxygen in root cell walls[43].
It is difficult to accurately compare BACs from different locations and plant species because BAC data varies widely with climate, initial soil TE concentration, TE additions, plant species, and soil properties. Therefore, for this paper only, Tyler[17] and Higley[18] were suitable for comparison as they measured BAC against chemical properties for a wide range of elements in identical conditions. Partitioning of TEs between the solid phase and the soil solution, a prerequisite for plant uptake, varies by many orders of magnitude per element[10]. From then onwards, migration of TEs into above-ground biomass varies with plant physiological mechanisms, both genetic and as affected by the growing conditions. The concentration ratios for leafy crops in Sheppard et al.[44] were similar to our data; they also measured particularly low BAC for REEs. Barley stem had a low Cd BAC but comparable BAC for the other elements in a different study[45]. Blueberry leaves had similar concentration ratios, with the exception of Na, which was much lower[46].
Effect of lanthanides on the observed trends
-
Lanthanides were outliers from the observed trends because they had a larger Me–O bond distance and smaller IP than other similarly charged ions, which had similarly low plant uptake. The reason for the Me–O anomaly is that the lanthanides have much larger atom sizes than the other TEs measured. Aluminium and Ga were in the dataset and also form trivalent cations like the lanthanides, and trivalent cations are often restricted by plant uptake due to their charge and low bioavailability[43], hence the similarly low BACs. However, the lanthanides have much larger atomic masses, twice the size of Ga and five times the size of Al, so even though the oxygen atom (δ−) is similarly attracted to Al, Ga, and the lanthanides, the O atom cannot get as close to the lanthanide atom due to the several extra electron shells in the way. This causes the Me–O bond length to be larger. Within the same valency for the mono- and divalent cations, there is less difference in atomic mass except for Pb, which is larger than the lanthanides, but it is only one element and was only measured in one dataset (IOP), so its deviation from the trendline is less evident. The lanthanide elements have a smaller IP than Ga and Al due to their much larger size, which explains why they are an anomaly in Fig. 1d.
The other two publications did not report lanthanides as significant outliers, but the same trend was there too, just less evident. In Tyler[17] and Higley[18], BAC decreased with increasing IP, and the lanthanides were below the trendlines in both publications, though not far enough to be considered outliers. In Tyler[17] it could be because most of the other elements below the trendline were not measured in this study (Ag, Eu, Hg, Li, Bi, Th, and Hf). Therefore, it is suggested that larger ions such as lanthanides should be omitted from this analysis in the future, or more large ions should be included to test if it increases the fit of the model as per Tyler[17] and Higley[18].
Another anomaly is that among the four lanthanides tested, the effect of Me–O and IP on BAC is opposite to that of the other elements. In Fig. 1a, BAC decreased with increasing Me–O for La, Ce, Nd, and Gd, and in Fig. 1d, BAC increased with increasing IP. Along the lanthanide group, the Me–O bond distance decreases and the ionic potential increases due to higher numbers of protons and the poor shielding power of the additional electrons in the 4f shell, causing the lanthanide contraction effect. Thus far, this trend does not appear to have been replicated in similar studies, but similar studies are few, so more work is required. In Tyler[17] the IP and BAC of the lanthanides were so similar that they were plotted together as one point on the graph. In Higley[18], the BAC of La in above-ground biomass was the highest of the lanthanides tested, but among the other lanthanides analysed (Ce, samarium, europium, ytterbium, and lutetium) there was no clear relationship between IP and BAC. In Sheppard et al.[45] the BAC of Ce in barley and wheat stem was much higher than that of 12 other lanthanides analysed, but there was no clear relationship between size and BAC among the other 12 lanthanides. As per a recent review on trace elements in the soil system[47], there is no consensus on whether light or heavy lanthanides are preferentially transported to plant leaves, which is where the BACs were calculated from in this study.
Benefits of using Me–O and IP to estimate BAC
-
The correlation between Me–O and BAC can have significant implications for the measurement and management of plants. The uptake of other TEs can be calculated from a few previous measurements, which is useful when the soil and/or plant material cannot be measured anymore, e.g., when it is old or decomposed, or when elements are unable to be measured due to analytical reasons including the absence of expensive calibration standards, unsuitable internal standards, or interferences where two elements have the same mass: charge ratio, and therefore overlap. Elements in the datasets analysed included macronutrients, micronutrients, common environmental contaminants, and emerging contaminants[5], showing that this correlation is not affected by whether the elements are essential. This is useful to know as pathways are developed by plants to preferentially take up essential elements, but are not developed to take up non-essential elements.
Another difficulty in modelling is that solid-solution partitioning of TEs in soil, a prerequisite of bioavailability, varies by many orders of magnitude[10] and requires measurement of total and extractable element concentrations, which is destructive and resource intensive. This Me–O to BAC correlation provides a method to bypass KD when measuring plant uptake.
The data presented in this paper shows the replicability of the Me–O and BAC relationship in different plant species. Oil palm is from the plant family Arecaceae, consisting of palms present in tropical and subtropical regions[48], whilst perennial ryegrass is a widely used species from the Poaceae (grass) plant family, yet the BAC of both plant species increased with increasing Me–O.
Inclusion of the Me–O and BAC relationship in models could reduce the number of measurements required, thus increasing their feasibility, particularly for empirical models[49]. Use of this relationship could reduce the necessity for measurements of KD, root surface area, water fluxes, soil pH, and cation exchange capacity[16,49,50] in models. This correlation could also act as another parameter to improve the accuracy of existing mechanistic models, of which accuracy is often limited by the time and resources required to get further measurements. Thus far, we do not know the specifics of how the Me–O and BAC correlation will be used in modelling, but the clear evidence in this paper shows the potential and warrants further investigation into the limitations between soils, plant types, and elements.
-
The correlation between Me–O and BAC has potential to be used in future modelling measuring the mobility of TEs in the soil–plant system, reducing the number of destructive and expensive measurements such as KD, and extrapolating existing data to other elements.
For all the non-lanthanide elements measured, there was a significant positive correlation between the Me–O distance of hydrated cations and the uptake and translocation of elements, particularly transition metals, post-transition metals, alkaline earth metals, and alkali metals. In contrast, lanthanide BAC were negatively correlated with Me–O. Ionic potentials of cations were also related to BAC, but the correlation was not significant in one of the datasets used, and the use of HR to predict plant TE uptake is limited due to the lack of currently available HR data.
Future work should verify the robustness of this correlation across more plant species and landscapes, find which other elements this correlation extends to, and test if this relationship is applicable for lanthanides and other heavier elements.
The lead author gratefully acknowledges the receipt of a University of Canterbury Doctoral Scholarship. We would like to thank René Reiser for the use of the data from his soil and pasture samples.
-
It accompanies this paper at: https://doi.org/10.48130/newcontam-0026-0014.
-
Not applicable.
-
The authors confirm their contributions to the paper as follows: Hayley Jensen: conceptualization, sample and data collection, data analysis, writing and editing; Niklas Lehto: reviewing and supervision; Peter Almond: reviewing and supervision; Hadee Thompson Morrison: sample and data collection, reviewing; Sally Gaw: reviewing and supervision; Brett Robinson: conceptualization, reviewing and supervision. All authors reviewed the results and approved the final version of the manuscript.
-
The datasets generated during and/or analysed during the current study are available from the corresponding author upon reasonable request.
-
This work was carried out through funding from a University of Canterbury Doctoral Scholarship.
-
The authors declare that they have no known competing financial interests or personal relationships that could have appeared to influence the work reported in this paper.
-
Full list of author information is available at the end of the article.
- The supplementary files can be downloaded from here.
- Copyright: © 2026 by the author(s). Published by Maximum Academic Press, Fayetteville, GA. This article is an open access article distributed under Creative Commons Attribution License (CC BY 4.0), visit https://creativecommons.org/licenses/by/4.0/.
-
About this article
Cite this article
Jensen H, Lehto N, Almond P, Thompson-Morrison H, Gaw S, et al. 2026. Simple metrics for complex systems: the Me–O distance in hydrated cations is a potential new metric for predicting element uptake by plants. New Contaminants 2: e017 doi: 10.48130/newcontam-0026-0014 

Simple metrics for complex systems: the Me–O distance in hydrated cations is a potential new metric for predicting element uptake by plants
- Received: 09 February 2026
- Revised: 13 April 2026
- Accepted: 23 April 2026
- Published online: 17 May 2026
Abstract: Trace element contamination of soils endangers food production, food quality, and human health. Upon entry into soil, trace elements have the potential to be taken up by plants and translocated to edible plant organs and subsequently enter the food chain. Risk assessments for trace element contamination in soil require an assessment of trace element mobility in the soil–plant system. Experiments to determine trace element fluxes are expensive and time consuming. We aimed to test whether chemical properties, in particular ionic potential, the metal–oxygen bond length of hydrated cations (Me–O), and hydrated radii could be used to estimate the uptake and translocation of trace elements in a perennial ryegrass pot trial, pasture species across New Zealand, and oil palm. Me–O bond length was significantly correlated with the bioaccumulation coefficients (plant/soil concentrations) in all three datasets, except for lanthanide elements. Ionic potential was inversely correlated with bioaccumulation coefficients but was significant in only two of the datasets, and data for hydrated radii were lacking for several of the elements, limiting its capacity as a measure. Me–O bond length is a potential new metric for estimating trace element-uptake risk, circumventing the need for lengthy experiments in a range of substrates. Future work should validate whole-system models, parameterised with Me–O bond lengths, that calculate trace element fluxes in the soil–plant system.
-
Key words:
- Trace elements /
- Sorption /
- Contamination /
- Soil /
- Plants /
- Food chain