












-
Plastic mulch was widely used in agriculture to improve crop yield and provide remarkable agronomic benefits by retaining soil moisture, inhibiting weed growth, and regulating soil temperature[1,2]. Global consumption was projected to grow steadily, exceeding 4 million tonnes annually[3]. However, the dominant position of non-degradable polymers, especially polyethylene (PE), led to the accumulation of plastic in the soil, which damaged the soil structure, the transportation of water, and ultimately damaged crop productivity[4]. Research showed that plastic residue in farmland had reached 83.6 kg/ha[5], showing a significant accumulation trend during long-term use. In addition, residual agricultural plastics accelerated the mineralization of soil organic carbon (SOC) and inhibited the stability of organic matter in soil aggregates (such as crop residues), thus reducing the carbon retention capacity of the soil[6]. The recycling and disposal of plastic mulch residues have also added to the economic burden and environmental costs[7].
Biodegradable mulch films (BDMs) were a promising substitute, mainly composed of poly(butylene adipate-co-terephthalate) (PBAT) and polylactic acid (PLA)[8]. Theoretically, BDM was expected to be easily degraded into carbon dioxide and water in the soil, thus reducing residual pollution and subsequent treatment costs[9−12]. However, it turned out that their degradation process in the natural environment was more complicated. BDM was affected by climate change, soil characteristics, and agricultural practices, which made them prone to the formation of incompletely mineralized plastic fragments, thus changing the soil microbial community and nutrient cycle[13−15]. Previous studies have shown that the mineralization rate of PBAT was only 0.9%–16% after 120 d of incubation in alluvial soil, loess, black, and red soil[16]. Moreover, during degradation, BDM releases a greater variety and higher concentration of additives (such as the endocrine disruptor bisphenol A), with leaching levels 2.5 to 15.9 times those of PE mulch films, posing potential risks of soil chemical contamination[17]. These films do not disappear entirely but instead undergo progressive structural and functional degradation, ultimately fragmenting into microplastics (MPs)[18,19]. Due to their small size and surface chemical changes, these microplastics might pose environmental risks comparable to or even more serious than traditional plastic covering films[20]. For these reasons, it was imperative to study the degradation process of BDM.
Among various degradation pathways, photodegradation induced by UV radiation was widely considered to be a key initial step in polymer degradation, usually before microbial-mediated decomposition[21,22]. Ultraviolet rays could be absorbed by carbonyl groups, ester bonds, and other conjugated functional groups in polymers, activating molecular electron transitions to form free radicals or other active species[23,24]. These reactive intermediates induced the division of the main chain and introduced oxygen-containing functional groups (such as carbonyl groups, carboxyl groups, and peroxide groups), thus changing the molecular weight, crystallization, and surface polarity of the polymer to promote subsequent microbial attacks[25−28]. Previous studies have shown that the environmental fate and transformation of plastics were strongly affected by the interaction of light and environmental media[29]. As the main reservoir of mulch residues, soil played a dual role: soil particles could attenuate ultraviolet rays, and soil components such as soil organic matter (SOM) and minerals participated in or catalyzed degradation reactions[30]. Soil minerals (quartz, sodium feldspar, hematite, etc.) increased the degradation rate of polystyrene by about 30% under ultraviolet irradiation, and the particles shrank from 1.5 to 0.5 mm[31]. Clay minerals were the main inorganic components of soil and surface water. The surface was rich in active hydroxyl groups and Lewis acid sites, so that they could mediate the transformation and degradation of organic pollutants[32,33]. It was worth noting that natural clays such as kaolin (KL) and montmorillonite (MMT) had a high specific surface area and abundant active sites, which could produce •OH and O2•− free radicals under light irradiation[34]. As we all know, these ROS would significantly accelerate the photodegradation of traditional plastics[32]. Previous studies have shown that the depth of soil burial significantly affects the degradation of the polymer due to different ultraviolet irradiation, moisture, and microbial activity, but its interaction with clay minerals has not yet been explored. Wang et al.[35] developed a KL-based solar photocatalytic system, which achieved 100% degradation of butyl xanthate in 10 min. However, there were still few studies focusing on the role of these ubiquitous soil minerals in the photodegradation of biodegradable polymers, especially in complex soil substrates and different burial depths. Therefore, the significance of this study was to systematically clarify the coupling effects of mineral-mediated photoreaction and soil depth-dependent environment on BDM degradation behavior. This enables a more mechanistic understanding of how natural soil components regulate polymer transformation processes. Based on this, we assumed that: (1) the photocatalytic activity of clay minerals in accelerating BDM degradation depended on the minerals, which were more efficient than montmorillonite due to the structure and electrochemical properties of kaolin; (2) the depth of burial in agricultural soil regulated the degradation microenvironment, thus affecting the overall BDM degradation behavior.
To test these hypotheses, this study aimed to: (1) reveal the synergistic effect of mineralogy and burial depth on the degradation behavior of PBAT and PLA, to improve the understanding of the mechanism of BDM transformation in the soil environment; (2) establish a comprehensive aging index (CAI) and quantitatively evaluate degradation according to a variety of physicochemical parameters; and (3) provide a scientific basis for assessing the environmental risks associated with the release of degradation products and additives, to support the sustainable application and management of BDM.
-
Two types of BDMs, PBAT and PLA, were obtained from Zhejiang Jiale Mei Horticultural Technology Co., Ltd (Zhejiang, China). The chemical structures of PBAT and PLA are presented in Supplementary Fig. S1. Kaolinite (KL) and montmorillonite (MMT) clay minerals were purchased from Tianjin Kemiou Chemical Reagent Co., Ltd (Tianjin, China). Surface soil (0–20 cm) was collected from the air-dried field in Laiyuan County, Baoding City, Hebei Province. The soil was air-dried, cleaned, ground, and screened (20 mesh).
In this study, the original PBAT and the original PLA were used as reference samples for non-aging. Mineral-related samples were represented by PBAT-KL, PBAT-MMT, PLA-KL, and PLA-MMT, where KL and MMT represented kaolin and montmorillonite, respectively. The suffix 'UV' meant UVA irradiation treatment, while 'Dark' meant incubation without light irradiation. The water treatment sample was expressed as 'W' and was used as a mineral-free control.
Photodegradation of BDM
-
BDMs were irradiated using a 100 W UVA lamp with a central wavelength of 365 nm at a fixed distance of 10 cm. The selected wavelength was within the UVA region and was applied to establish a controlled accelerated photodegradation condition for investigating the aging behavior of mulch films[36]. The irradiation system was used to evaluate UVA-induced degradation processes under laboratory conditions rather than to reproduce the full spectrum and variability of natural solar radiation. The lamp was placed 10 cm above the sample, and the sample was placed on the constant water bath vibrator to ensure uniform irradiation. According to the mixing ratio of the previous study[37], mineral suspensions were prepared by dispersing KL or MMT (5 g/L) in 20 mL of ultrapure water. Then, a 1 cm × 1 cm covering film specimen (0.1 g) was added to the suspension. The control group included a mineral-free ultrapure water film and a dark contrast (wrapped in aluminum foil) suitable for all conditions. Samples were collected on days 0, 15, 30, 45, and 60, and three dark control groups were established. After irradiation, the BDM was carefully separated from the suspension, rinsed with ultrapure water to remove the adhered mineral particles, dried at 40 °C for 48 h, and then further characterized. The detailed separation procedure is described in Supplementary Text S1.
Soil degradation of BDM
-
Soil degradation experiments were performed by placing 5 cm × 5 cm films of PBAT and PLA either on the soil surface or at a burial depth of 10 cm (Supplementary Fig. S1). The experiment was conducted in a controlled climate chamber at 25 ± 1 °C and 60% relative humidity, with soil moisture maintained at 60% of field capacity through periodic weighing and replenishment with sterile water. To specifically investigate the contributions of abiotic and mineral-driven degradation, the soil was sterilized via autoclaving at 121 °C for 30 min on 3 consecutive days before the experiment. Samples were collected in triplicate after 30 and 60 d. The degraded soil surrounding the films was collected and sieved (100 mesh) for subsequent analysis. The experimental treatment groups and their corresponding abbreviations are summarized in Supplementary Table S1.
Characterization of BDM
-
Surface morphology, hydrophilicity, and crystallinity were characterized using scanning electron microscopy (SEM) (Phenom ProX, Netherlands), contact angle measurements (OCA15EC, Germany), and XRD (D8 ADVANCE, Germany), respectively. Functional group evolution was analyzed by Raman spectroscopy (LabRAM HR Evolution, France) and Fourier-transform infrared spectroscopy (FTIR) (Nicolet iS10, USA), in combination with two-dimensional correlation spectroscopy (2D-COS). Thermal stability and elemental composition were determined using thermogravimetric analysis (TGA) (NETZSCH STA, Germany) and X-ray photoelectron spectroscopy (XPS) (ESCALAB 250Xi, UK), respectively. Organic carbon content was quantified by total organic carbon (TOC) analysis (Vario TOC, Elementar, Shimadzu, Japan), and photodegradation intermediates were identified using LC-MS (AB Sciex Triple TOF 5500, USA). The measurement methods and operating conditions are detailed in Supplementary Texts S2–S4.
Analysis of clay and soil properties
-
The light absorption characteristics of clay minerals were determined using a UV-visible spectrophotometer (UV-3600, Shimadzu, Japan). Electrochemical properties were assessed with a standard three-electrode system on an electrochemical workstation (CHI-760e, China). At the same time, soil pH, conductivity (EC), and SOM content were measured according to the standard agricultural procedure (Supplementary Text S5).
Data analysis
-
After the degradation experiment, the collected plastic covering film was cleaned and dried, and the weight loss (WL, %) and photodegradation rate (R) were evaluated. Detailed procedures and calculation formulas were provided in Supplementary Texts S1 and S6. Statistical analysis was carried out using one-way analysis of variance (ANOVA), and then Tukey's honest significant difference (HSD) test was used for multiple comparisons. Differences among groups were considered statistically significant when p < 0.05. Pearson correlation analysis was carried out to evaluate the relationship between degradation indicators and soil physicochemical parameters. The correlation coefficients (r), corresponding p-values, and 95% confidence intervals were calculated to evaluate the statistical significance and reliability of the correlation. In order to achieve a comprehensive multi-parameter evaluation of BDM degradation, the comprehensive aging index (CAI) was calculated using the entropy weighting method (EWM), which is an objective index weighting technology based on information entropy. Following the approach of Guo et al.[38], the entropy values of each indicator were used to derive their respective weights and to construct the CAI. The complete calculation formula and method details are provided in Supplementary Text S6. The acute toxicity of BDM degradation intermediates was evaluated using the Toxicity Estimation Software Tool (T.E.S.T.) developed by the United States Environmental Protection Agency (EPA).
-
The morphological features of PBAT and PLA were monitored by SEM (Fig. 1). The pristine mulch film surfaces appeared uniformly smooth, with occasional fine granular features (possibly attributable to additives). With the progress of degradation, the increase in surface roughness and particle size became obvious, accompanied by the gradual formation of microcracks and pores (Fig. 1). Under the combined action of photo-oxidation and clay minerals, the BDM structure underwent progressive degradation (Fig. 1b, c, h, i). KL induced markedly more pronounced morphological changes than MMT. BDMs in soil environments exhibited greater surface disruption than those under aqueous photodegradation conditions (Fig. 1e, k), and the effect was stronger at a burial depth of 10 cm (Fig. 1f, l), where internal structures became visible.
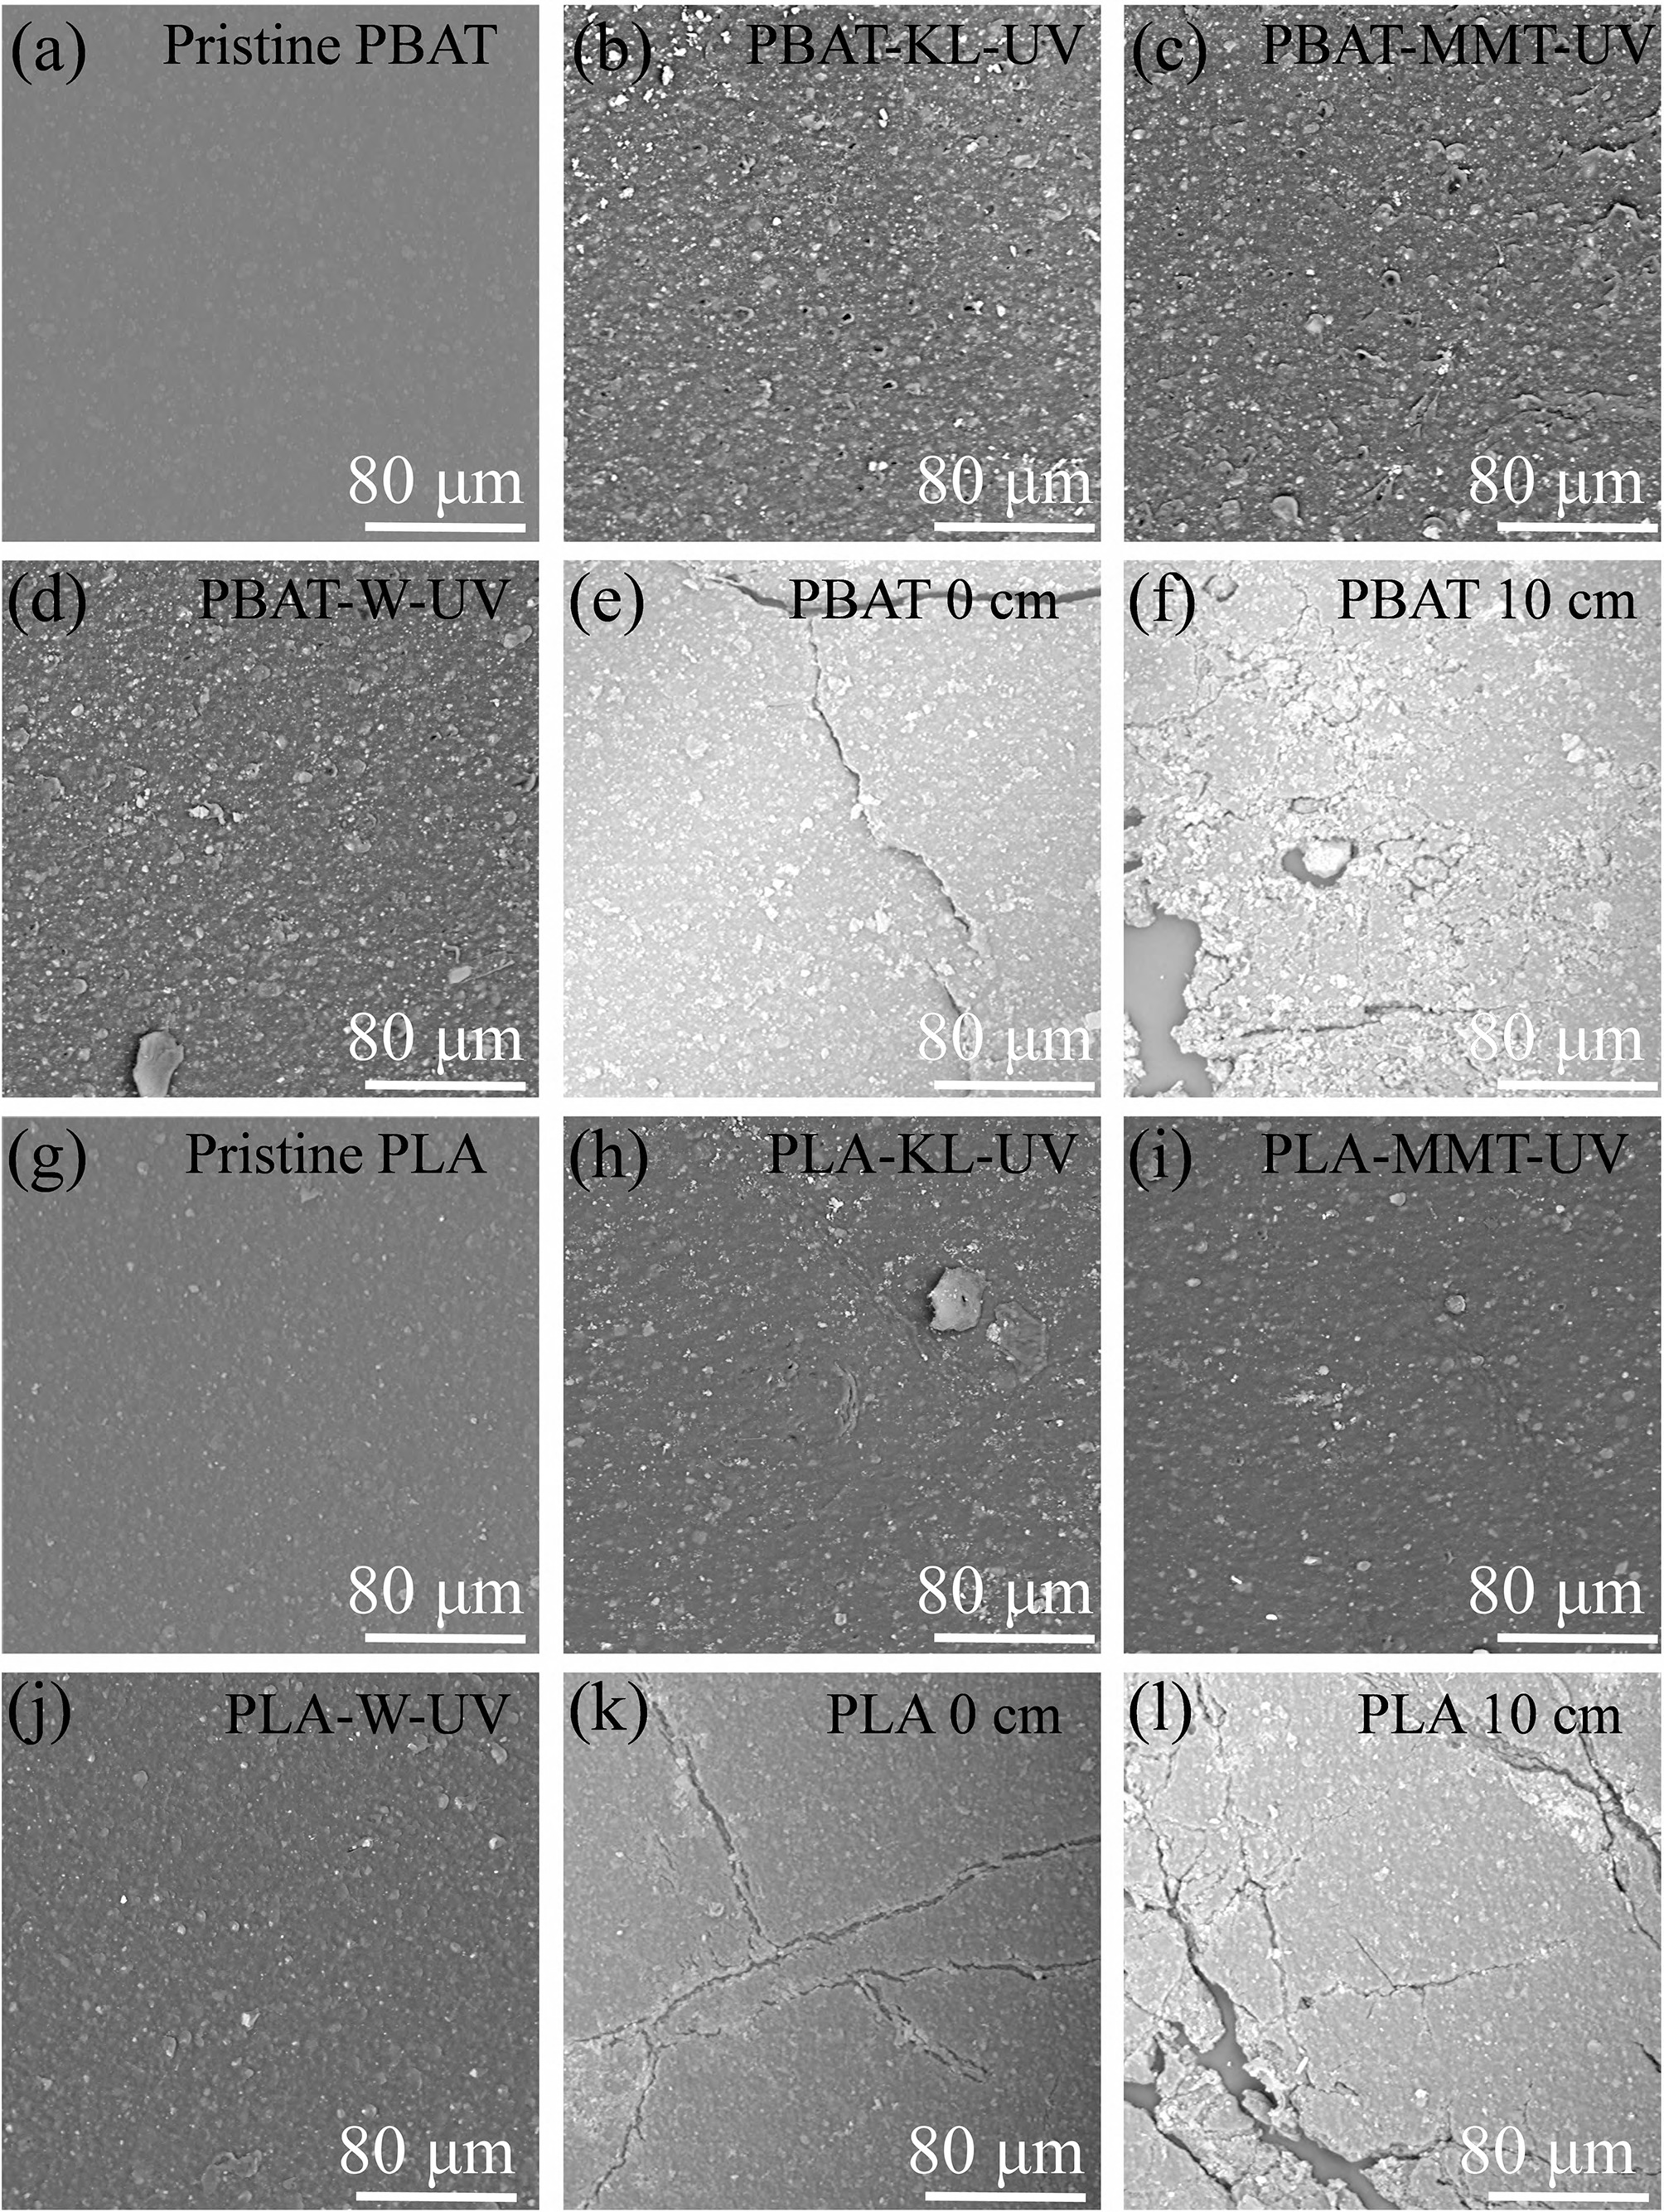
Figure 1.
SEM image of BDM degradation: (a)–(f) PBAT; (g)–(l) PLA.
Weight loss and hydrophilicity assessment
-
Weight loss (WL) and water contact angle (CA) were measured to assess the extent of degradation and changes in surface wettability (Fig. 2). Under dark conditions, degradation was minimal, and the WL of all BDM processing groups was kept below 2%. In contrast, UV irradiation alone significantly increased WL in PBAT (4.84% ± 0.055%) and PLA (4.28% ± 0.064%) (Fig. 2a, b). The presence of clay minerals markedly enhanced this effect. The weight loss induced by KL (PBAT: 10.69% ± 0.02%; PLA: 8.26% ± 0.051%) was significantly greater than that induced by MMT (p < 0.05) (Supplementary Table S3). This trend was consistent with increased photodegradation rates (R values) and higher total organic carbon (TOC) levels in leachates (Supplementary Table S4). In soil burial experiments, samples buried at 10 cm showed greater weight loss (PBAT: 3.78%; PLA: 0.41%) than those on the soil surface.
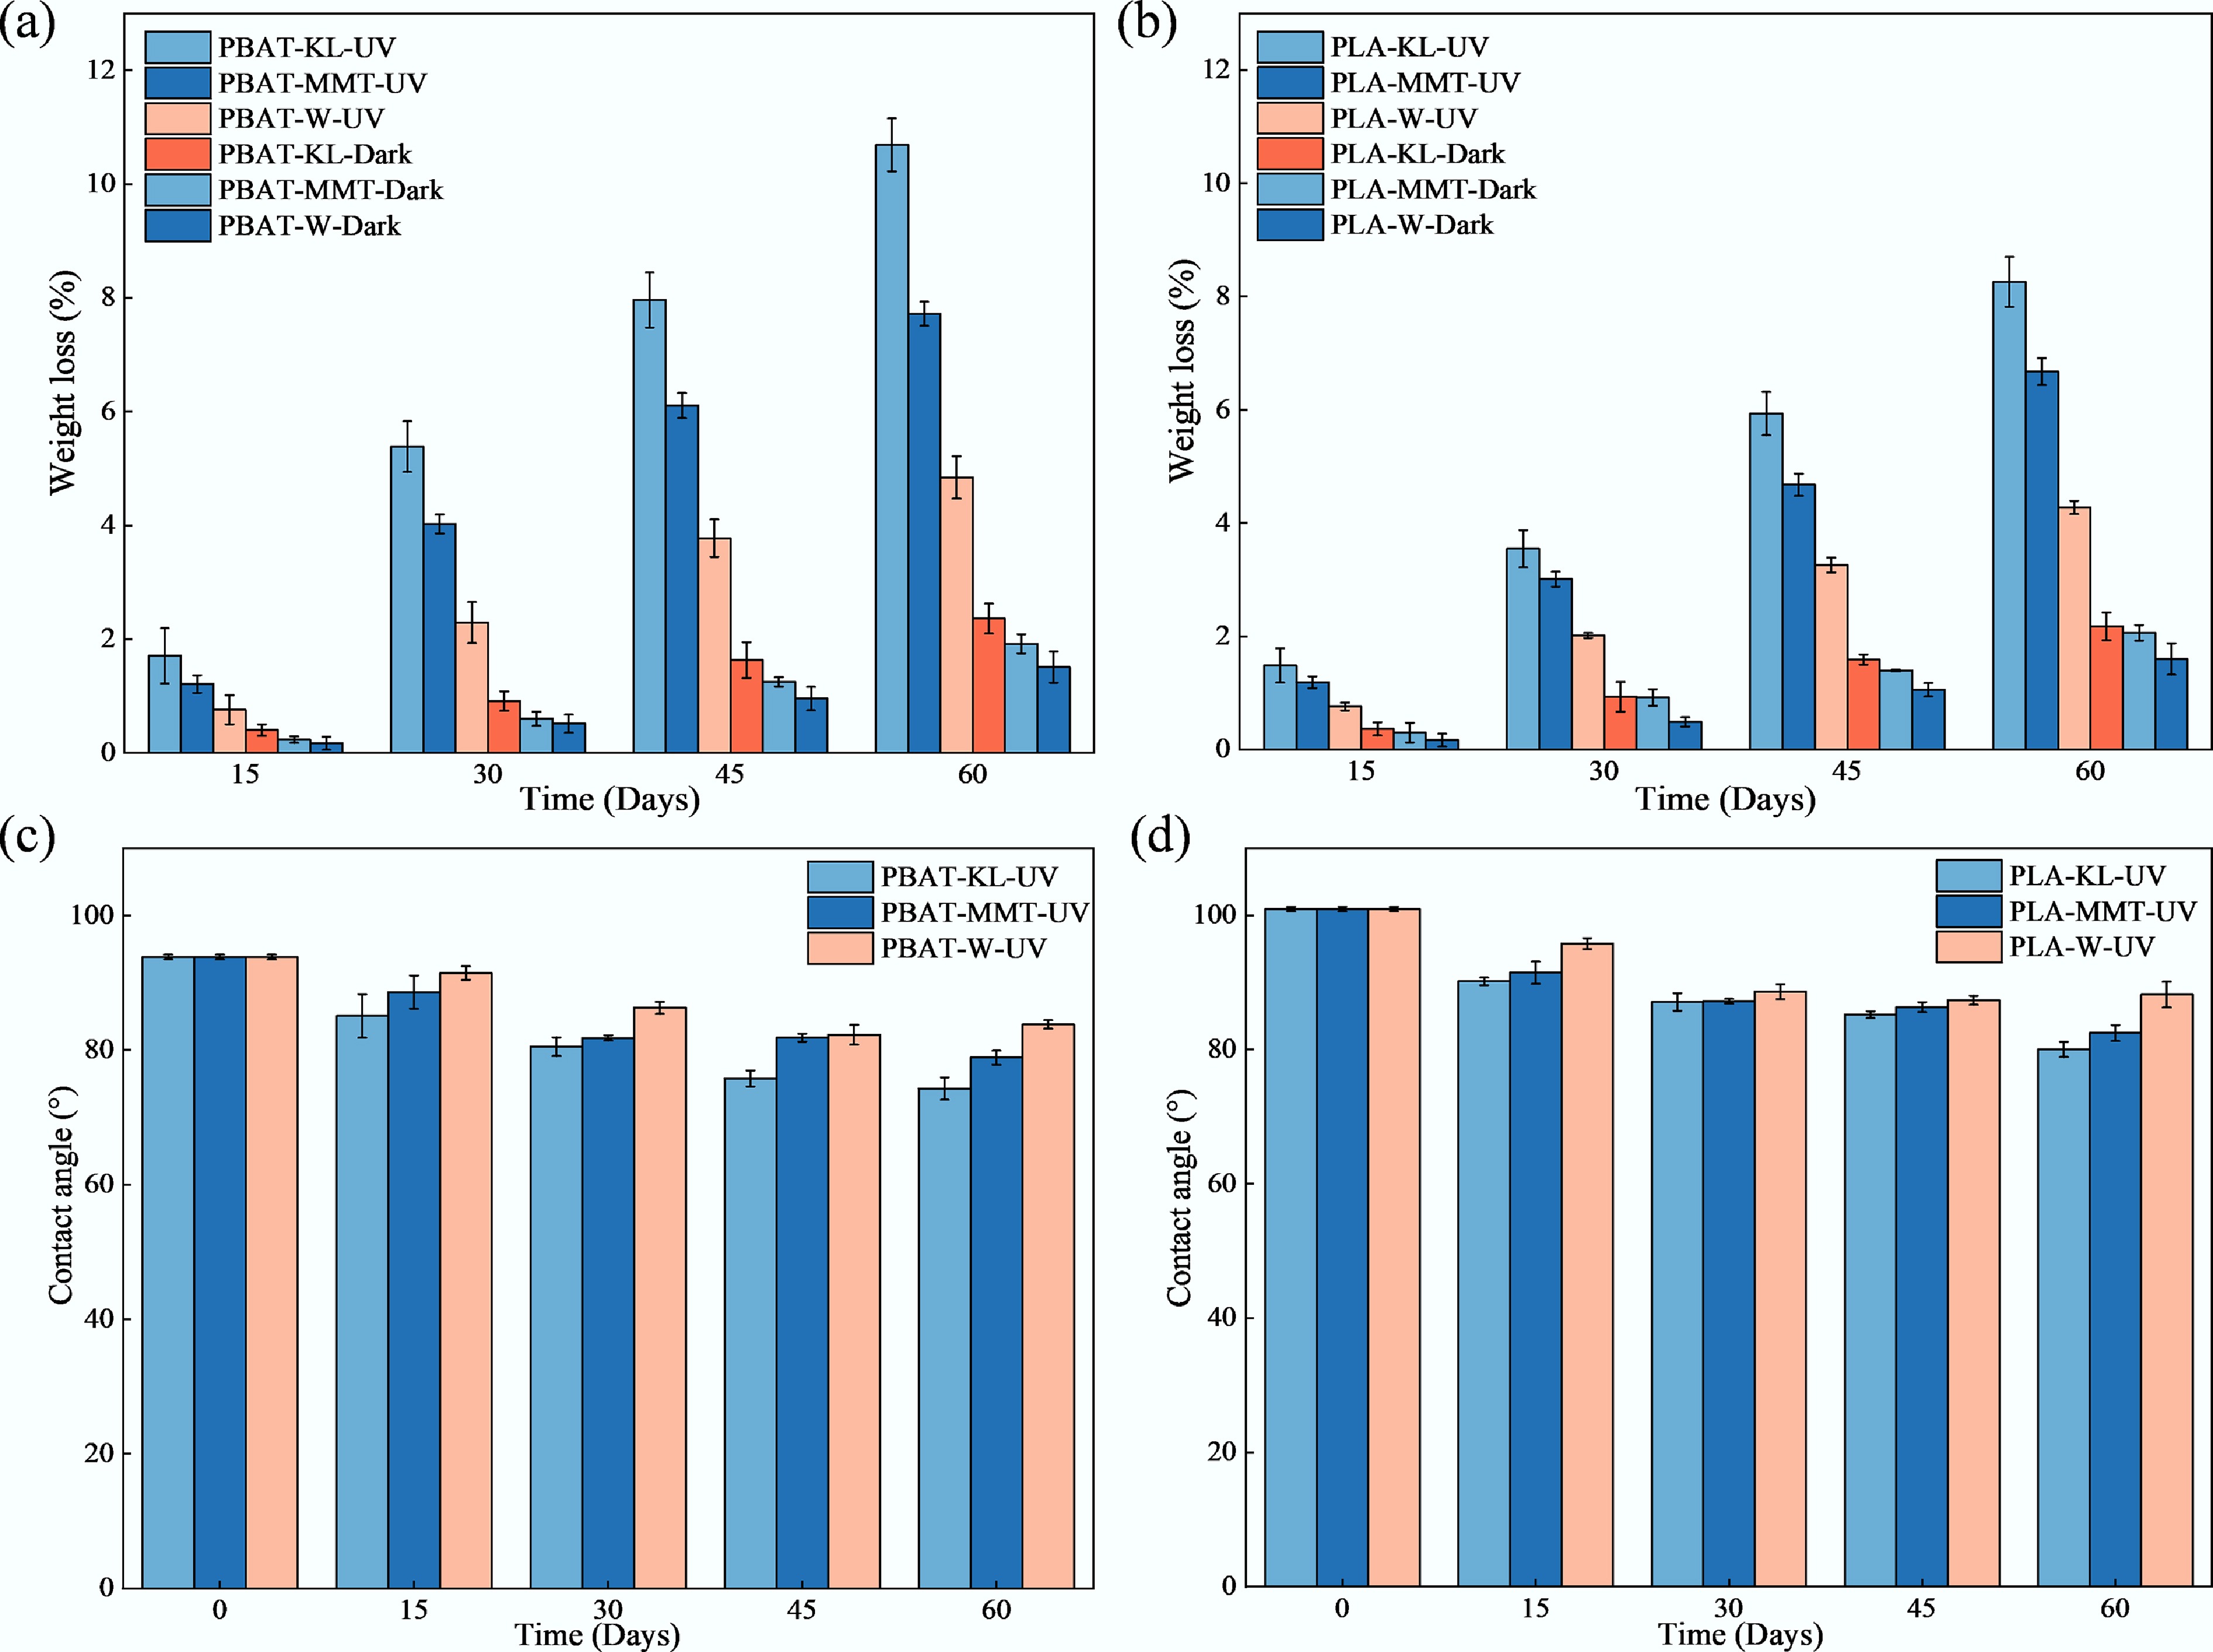
Figure 2.
Weight loss of (a) PBAT and (b) PLA. Water contact angle of (c) PBAT and (d) PLA.
The pristine BDMs had high water contact angles (PBAT: 93.82°; PLA: 100.90°), indicating their initial hydrophobicity (Fig. 2c, d). After 60 d of photodegradation, only the UV-treated groups exhibited reductions in surface contact angles, with PBAT and PLA decreasing by 10.68% and 12.87%, respectively. Clay minerals further reduced the contact angles. Specifically, the PBAT-KL and PLA-KL groups showed decreases of 22.97% and 20.68%, respectively, while the PBAT-MMT and PLA-MMT groups exhibited reductions of 15.93% and 18.27%. The hydrophobicity of BDMs decreased under soil conditions. PBAT and PLA films exposed on the soil surface showed reductions of 51.61% and 50.25%, respectively, whereas samples buried at a depth of 10 cm exhibited decreases of 47.61% and 41.08% (Supplementary Table S5).
Structural and chemical evolution
Thermal stability and functional group analysis
-
The thermal stability of PBAT and PLA after 60 d of photodegradation was assessed using thermogravimetric (TG) and derivative thermogravimetric (DTG) analyses (Fig. 3a–d). The TG/DTG curves and calculated thermal parameters for PBAT (Supplementary Table S6) revealed a four-stage degradation process[39,40]. Within the range of 230–300 °C (Tmax1 = 290.5 °C), approximately 17% of the initial mass was lost. A major mass loss of 53% occurred around 400 °C (Tmax2), primarily due to scission of the aliphatic segments in PBAT, with the sharp DTG peak indicating rapid decomposition of polyester chain-cleavage products[41]. A secondary degradation peak between 600 and 700 °C reflected further breakdown of aromatic units[42]. At 800 °C, the residual mass of PBAT was 13%–15.8%, whereas that of PLA was 7.6%–9.7%.
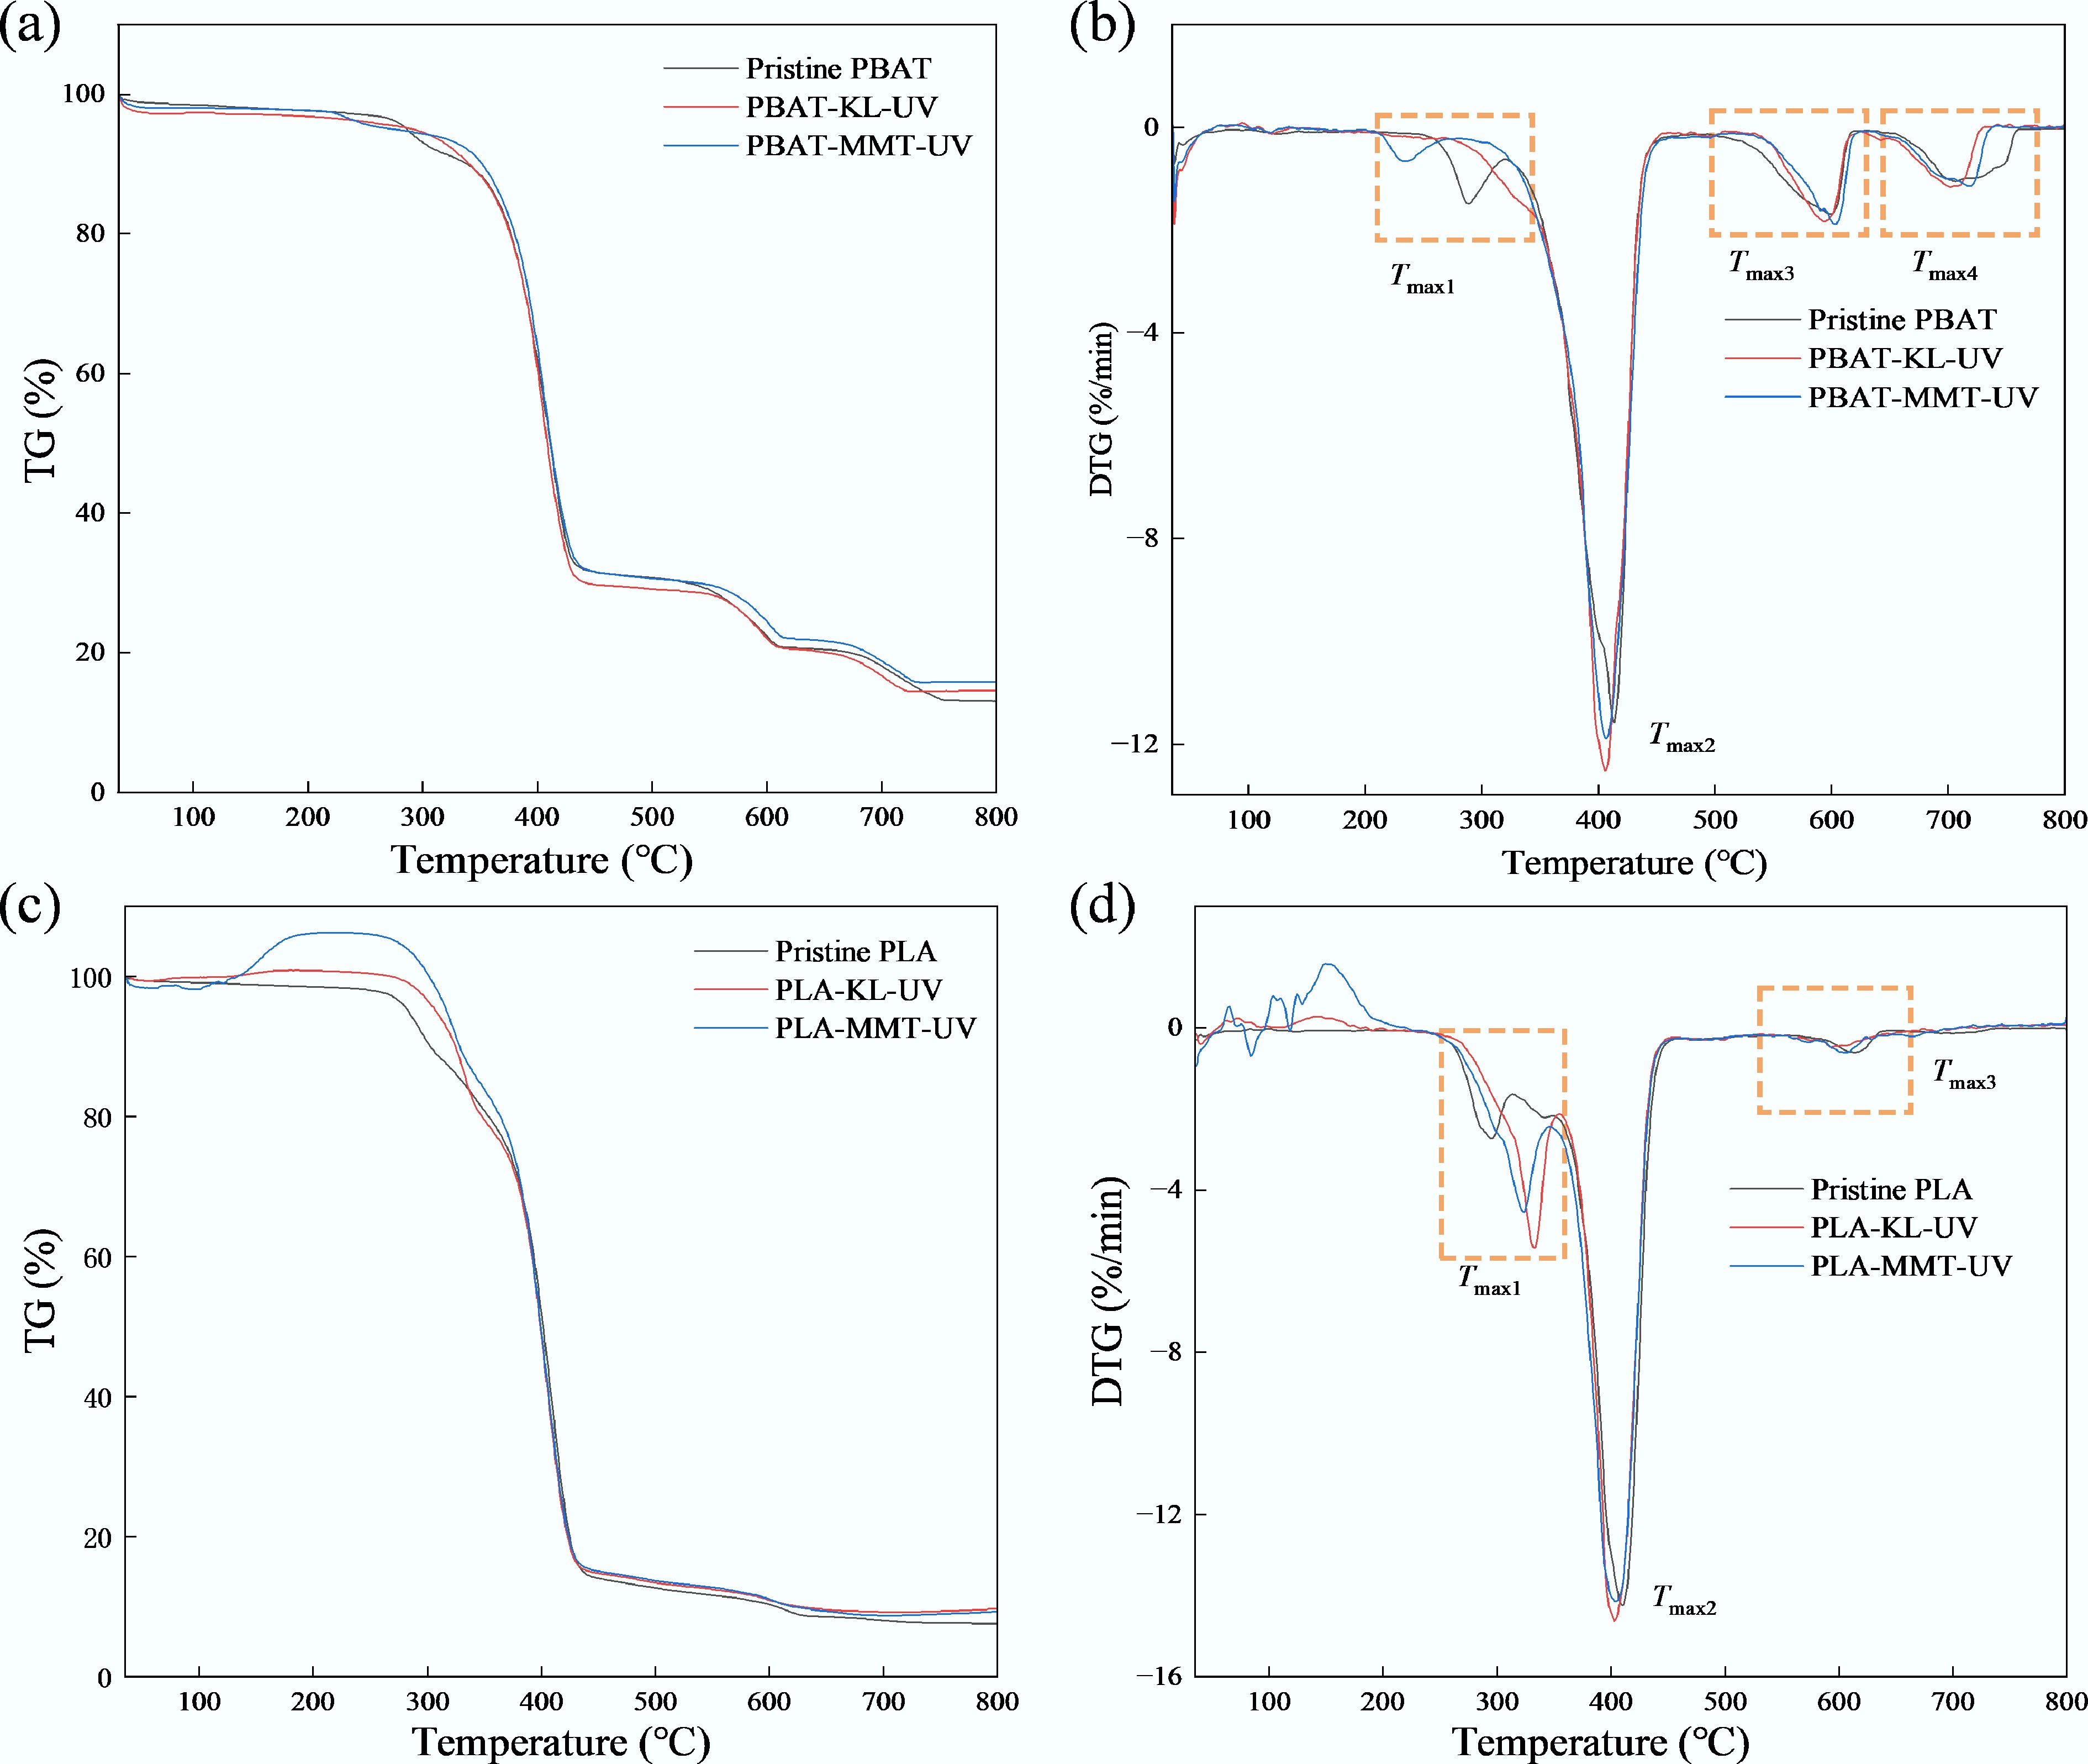
Figure 3.
TG and DTG curves of BDM: (a) TG and (b)DTG curves of PBAT; (c) TG and (d) DTG curves of PLA.
FTIR spectra revealed changes in the surface functional groups of BDM (Fig. 4a, b; Supplementary Fig. S2). For PBAT, the ATR-FTIR spectra under KL, MMT, water, and soil depth conditions are shown in Fig. 4a and Supplementary Fig. S2a–S2c, characteristic peaks included –CH3 stretching (2,960–2,860 cm−1), carbonyl (C=O) stretching (1,710 cm−1), –CH2 bending (1,450 cm−1), aliphatic/aromatic C–O stretching (1,270–1,250 cm−1), C–O–C bending (1,103–1,105 cm−1), and aromatic C–H out-of-plane bending (727 cm−1)[38,43−45]. The spectrum of PLA featured –CH3 stretching (2,990–2,850 cm−1), C=O stretching (1,710 cm−1), C–O stretching (1,180, 1,260 cm−1), and characteristic peaks at 1,452, 1,105, 871, and 727 cm−1. After 60 d of degradation, the –CH3 absorption peak in PBAT decreased markedly. For PLA, the ATR-FTIR spectra under KL, MMT, water, and soil depth conditions are shown in Fig. 4b and Supplementary Fig. S2d–S2f, the intensity of the C=O absorption peak increased after 30 d, while the –CH signal gradually diminished, indicating molecular chain breakage during the degradation process of the mulch film.
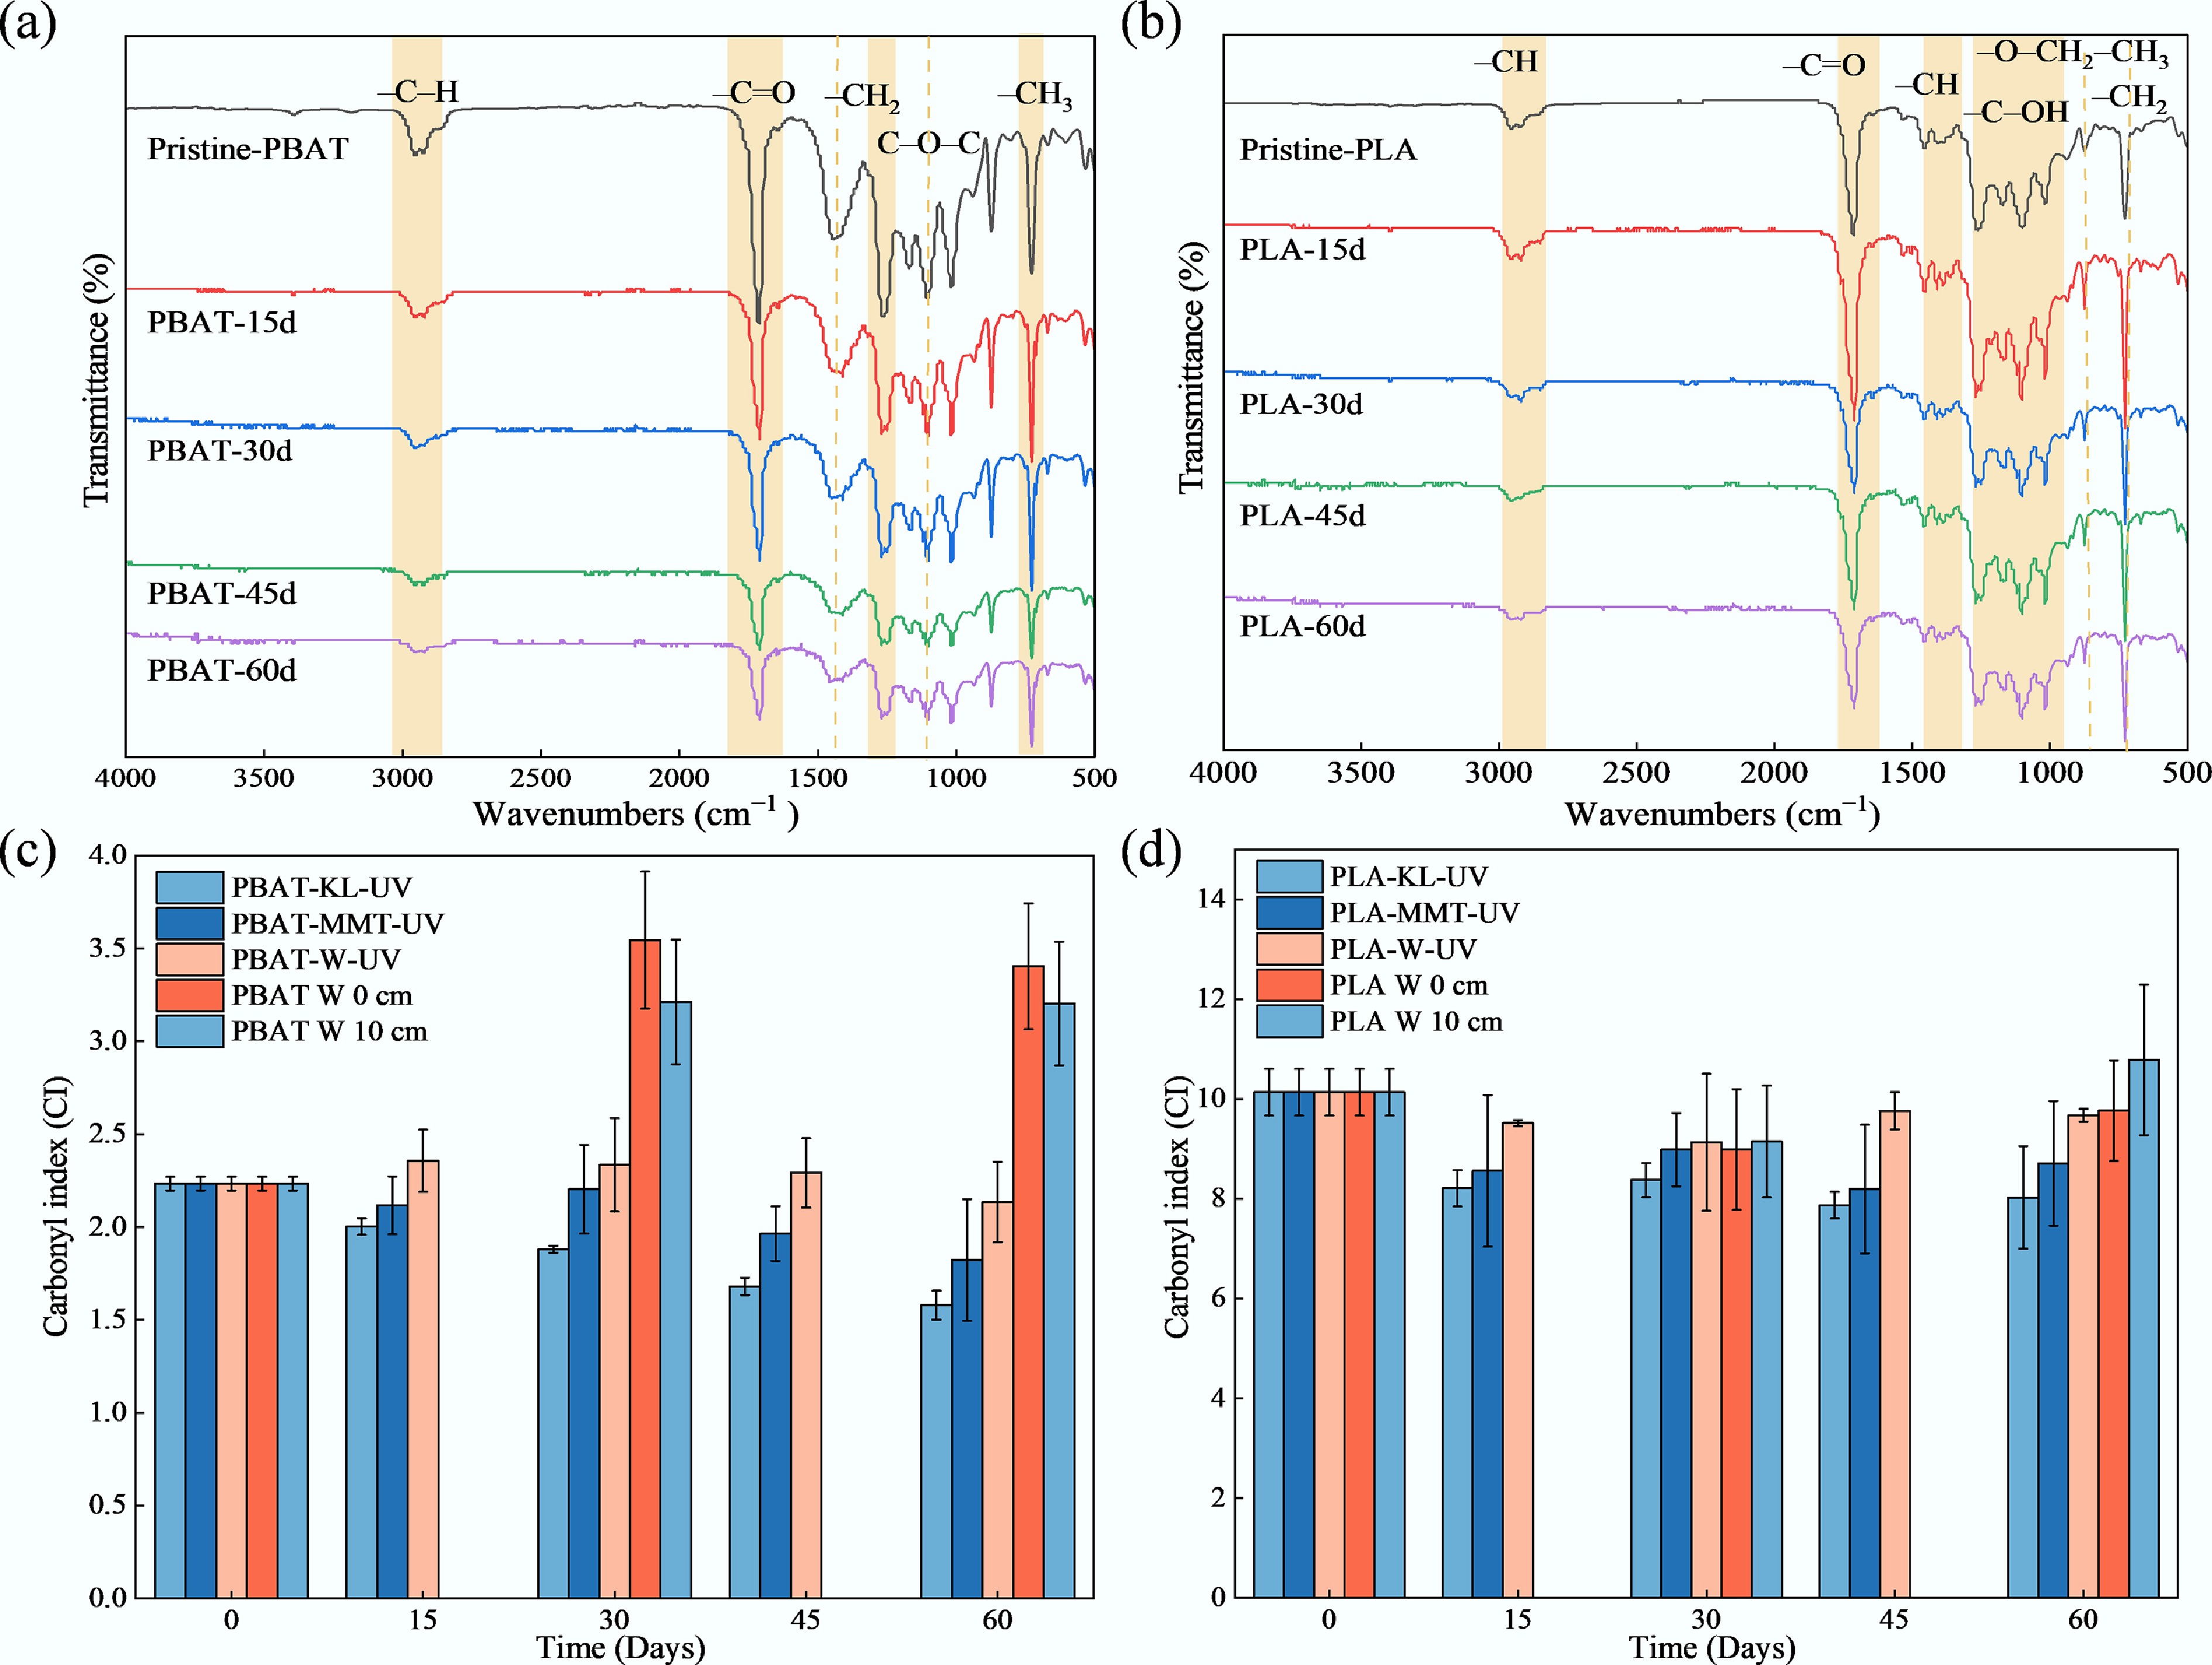
Figure 4.
ATR-FTIR spectra of (a) PBAT and (b) PLA in KL; carbonyl index of (c) PBAT and (d) PLA.
The carbonyl index (CI), calculated as the ratio of the C=O peak area to that of a reference peak (e.g., –CH2)[46], served as an indicator of plastic mulch film oxidation[47]. Under UV irradiation alone for 60 d, the CI values of PBAT and PLA decreased by 4.63% and 4.48%, respectively. In contrast, in the presence of KL, the CI values of PBAT and PLA decreased by 29.14% and 18.39%, respectively, whereas in the presence of MMT, they decreased by 20.83% and 14.11%, respectively (Fig. 4c, d). In addition, the CI values of BDMs decreased by 20.11%–30.37% under soil burial conditions, representing a larger numerical reduction compared with those observed under all photodegradation conditions.
Surface elemental composition and crystallinity
-
XPS analysis revealed significant alterations in surface elemental composition (Fig. 5; Supplementary Table S7). After 60 d, only the ultraviolet-irradiated group exhibited increases in the oxygen-to-carbon (O/C) ratio: for PBAT, from 0.21 to 0.36; for PLA, from 0.19 to 0.37. The addition of KL and MMT further increased the O/C ratios (PBAT: 0.38 and 0.48; PLA: 0.37 and 0.40). In the soil environment, the surface atomic O/C ratio of PBAT increased to 0.51 in the surface layer and 1.43 at 10 cm depth, while that of PLA increased to 0.51 and 0.81, respectively, indicating enhanced surface oxidation and the accumulation of oxygen-containing functional groups during soil aging.
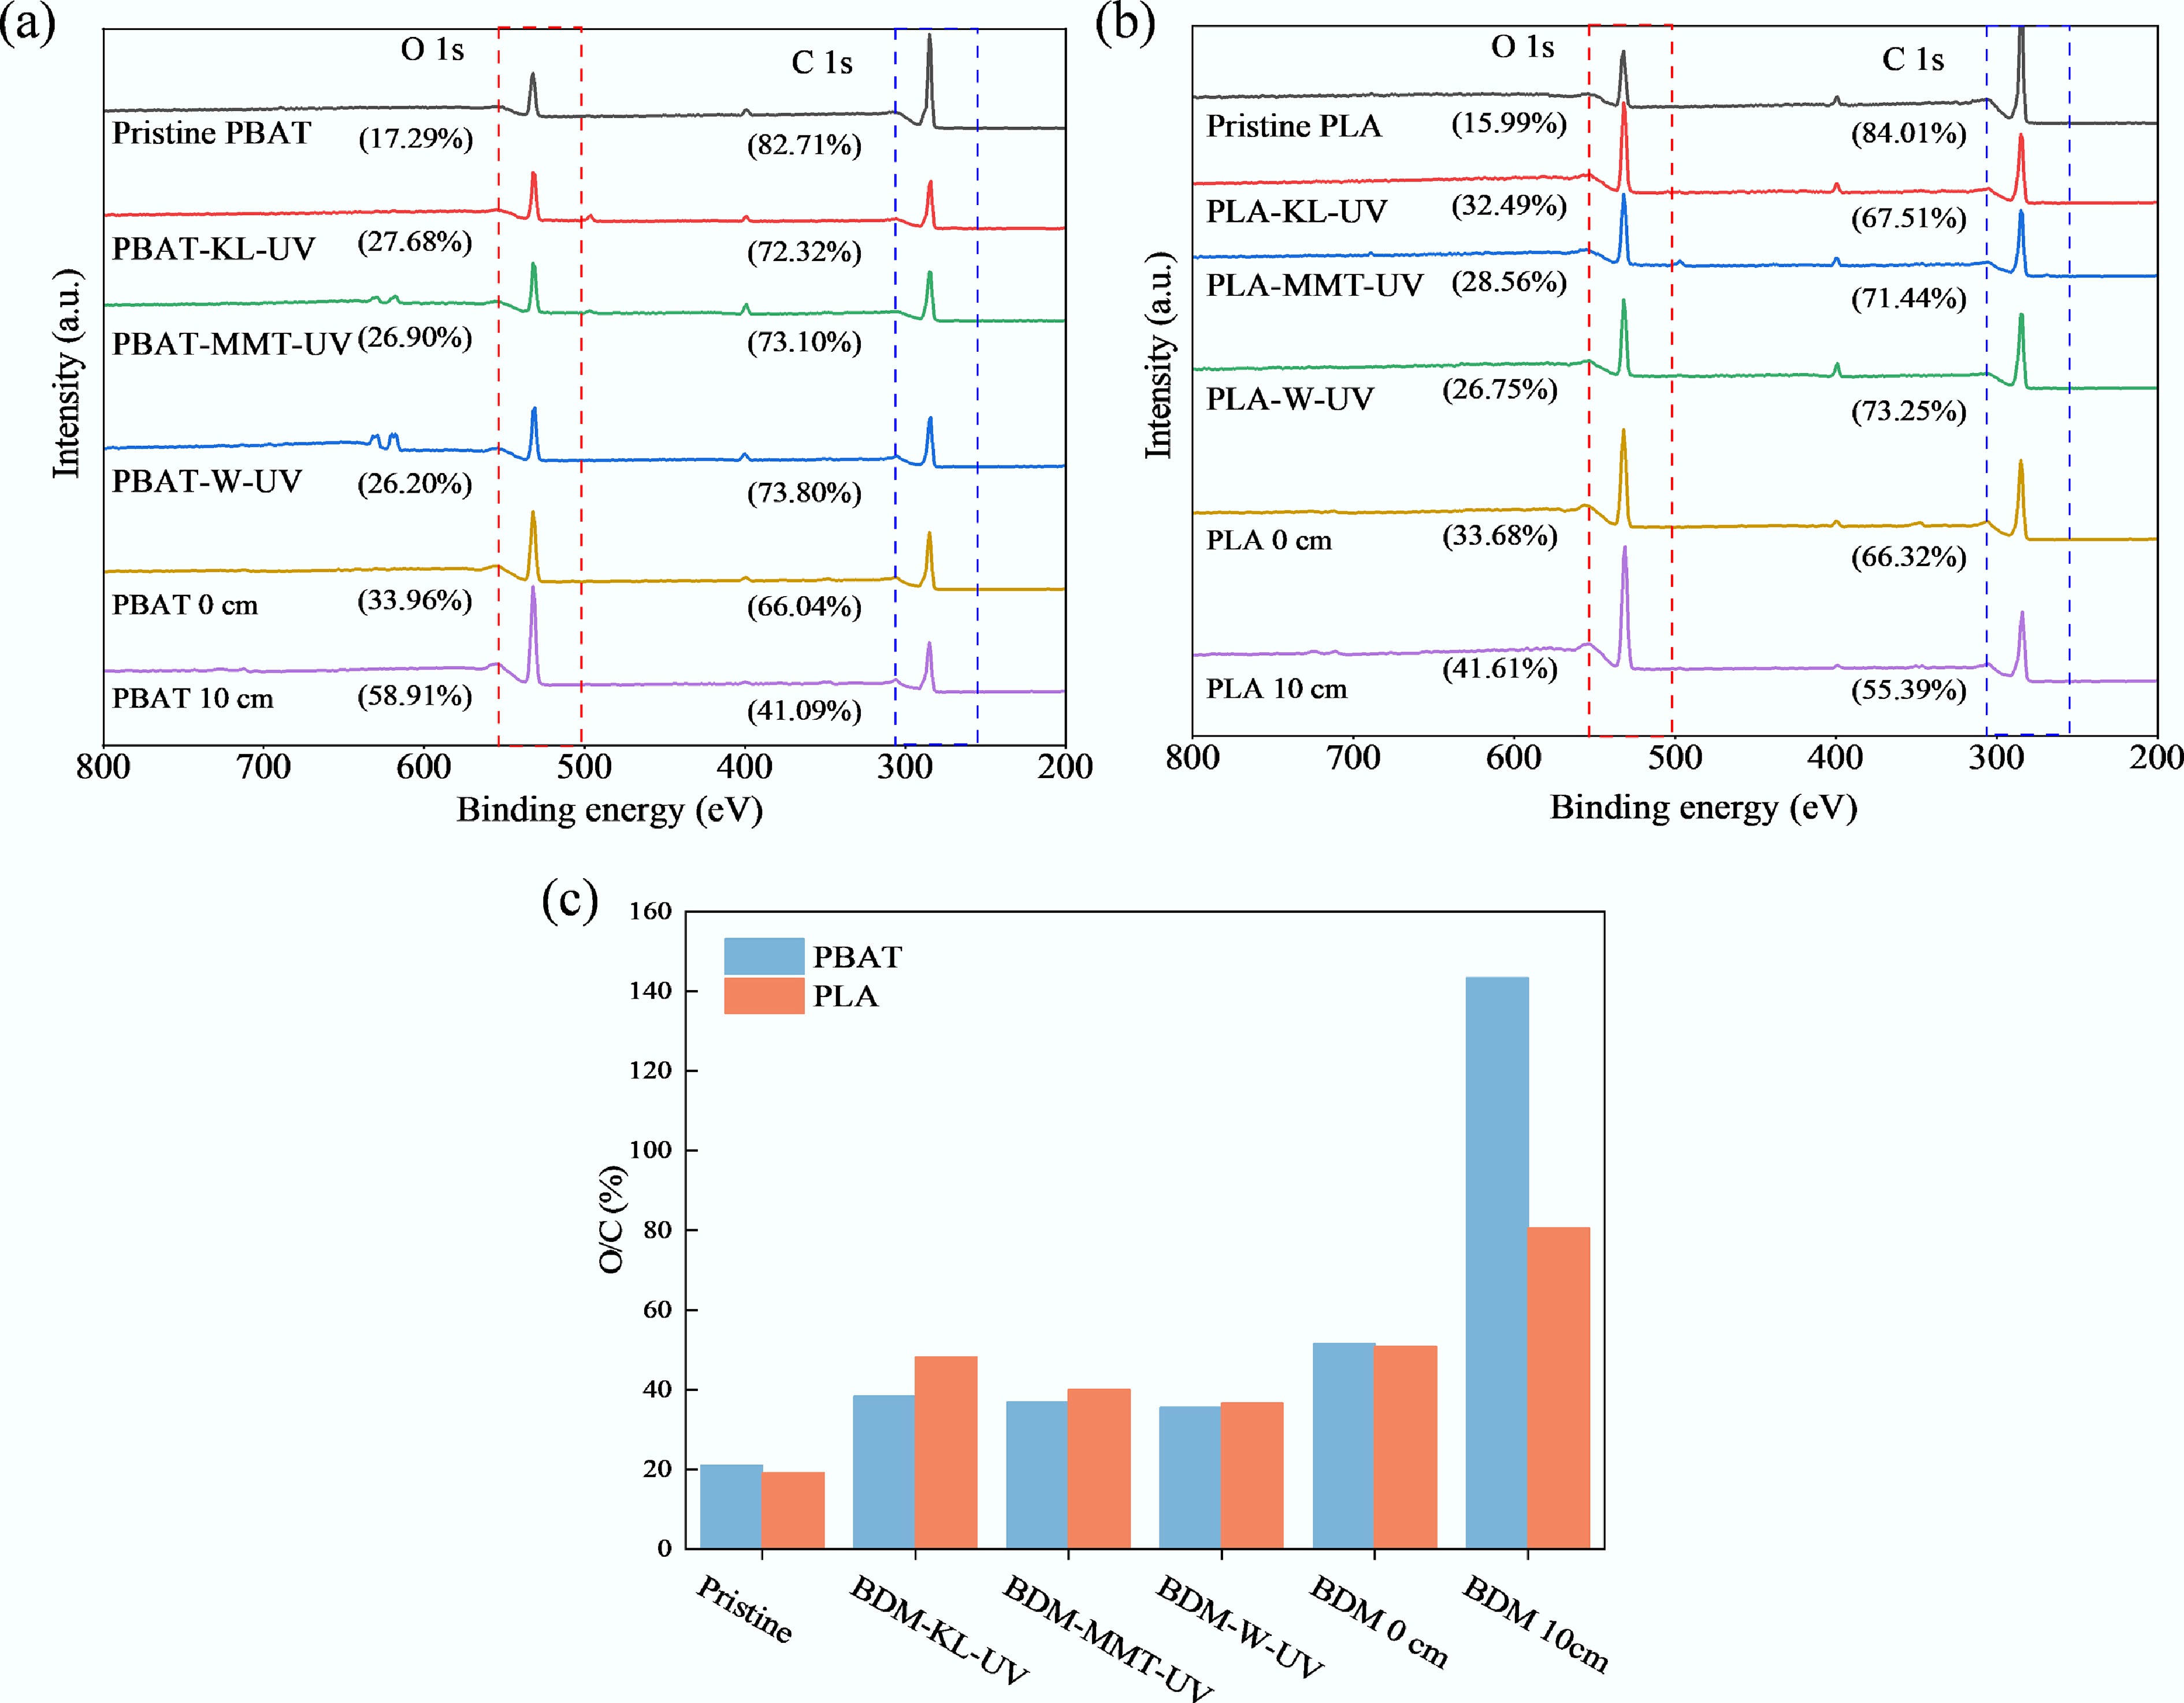
Figure 5.
(a), (b) XPS full spectrum of BDM. (c) O/C of PBAT and PLA.
The C 1s and O 1s spectra of BDM (Fig. 6) showed three primary bond types: C–C (284.8 eV), C–O (286.25 eV), and C=O (288.85 eV), as well as O 1s peaks corresponding to C=O (531.85 eV) and O–C=O (533.3 eV). Under KL-mediated and MMT-mediated photodegradation, the proportion of C–C bonds in PBAT decreased from 76.80% to 61.27% (KL) and to 74.40% (MMT), while the proportions of C–O and C=O bonds correspondingly increased. In the O 1s spectrum, the proportion of O=C–O bonds increased from 63.83% to 88.35% and 83.89%, respectively, whereas the proportion of O–C=O bonds decreased significantly (Fig. 6a, b). Under soil degradation conditions, the proportion of C–C bonds in PBAT decreased to 74.40% on the soil surface and 70.72% at a burial depth of 10 cm, with a corresponding increase in oxygen-containing functional groups (Supplementary Fig. S3). PLA exhibited a similar trend to PBAT. Under KL- and MMT-mediated photodegradation, the proportion of C–C bonds in PLA decreased from 79.46% to 68.26% (KL) and to 58.15% (MMT), while C–O and C=O bonds increased significantly. In the O 1s spectrum, the proportion of O=C–O bonds increased, whereas the proportion of O–C=O bonds decreased (Fig. 6c, d). Under soil conditions, the C–C bond proportion of PLA further decreased, accompanied by a corresponding increase in oxygen-containing functional groups (Supplementary Fig. S4).
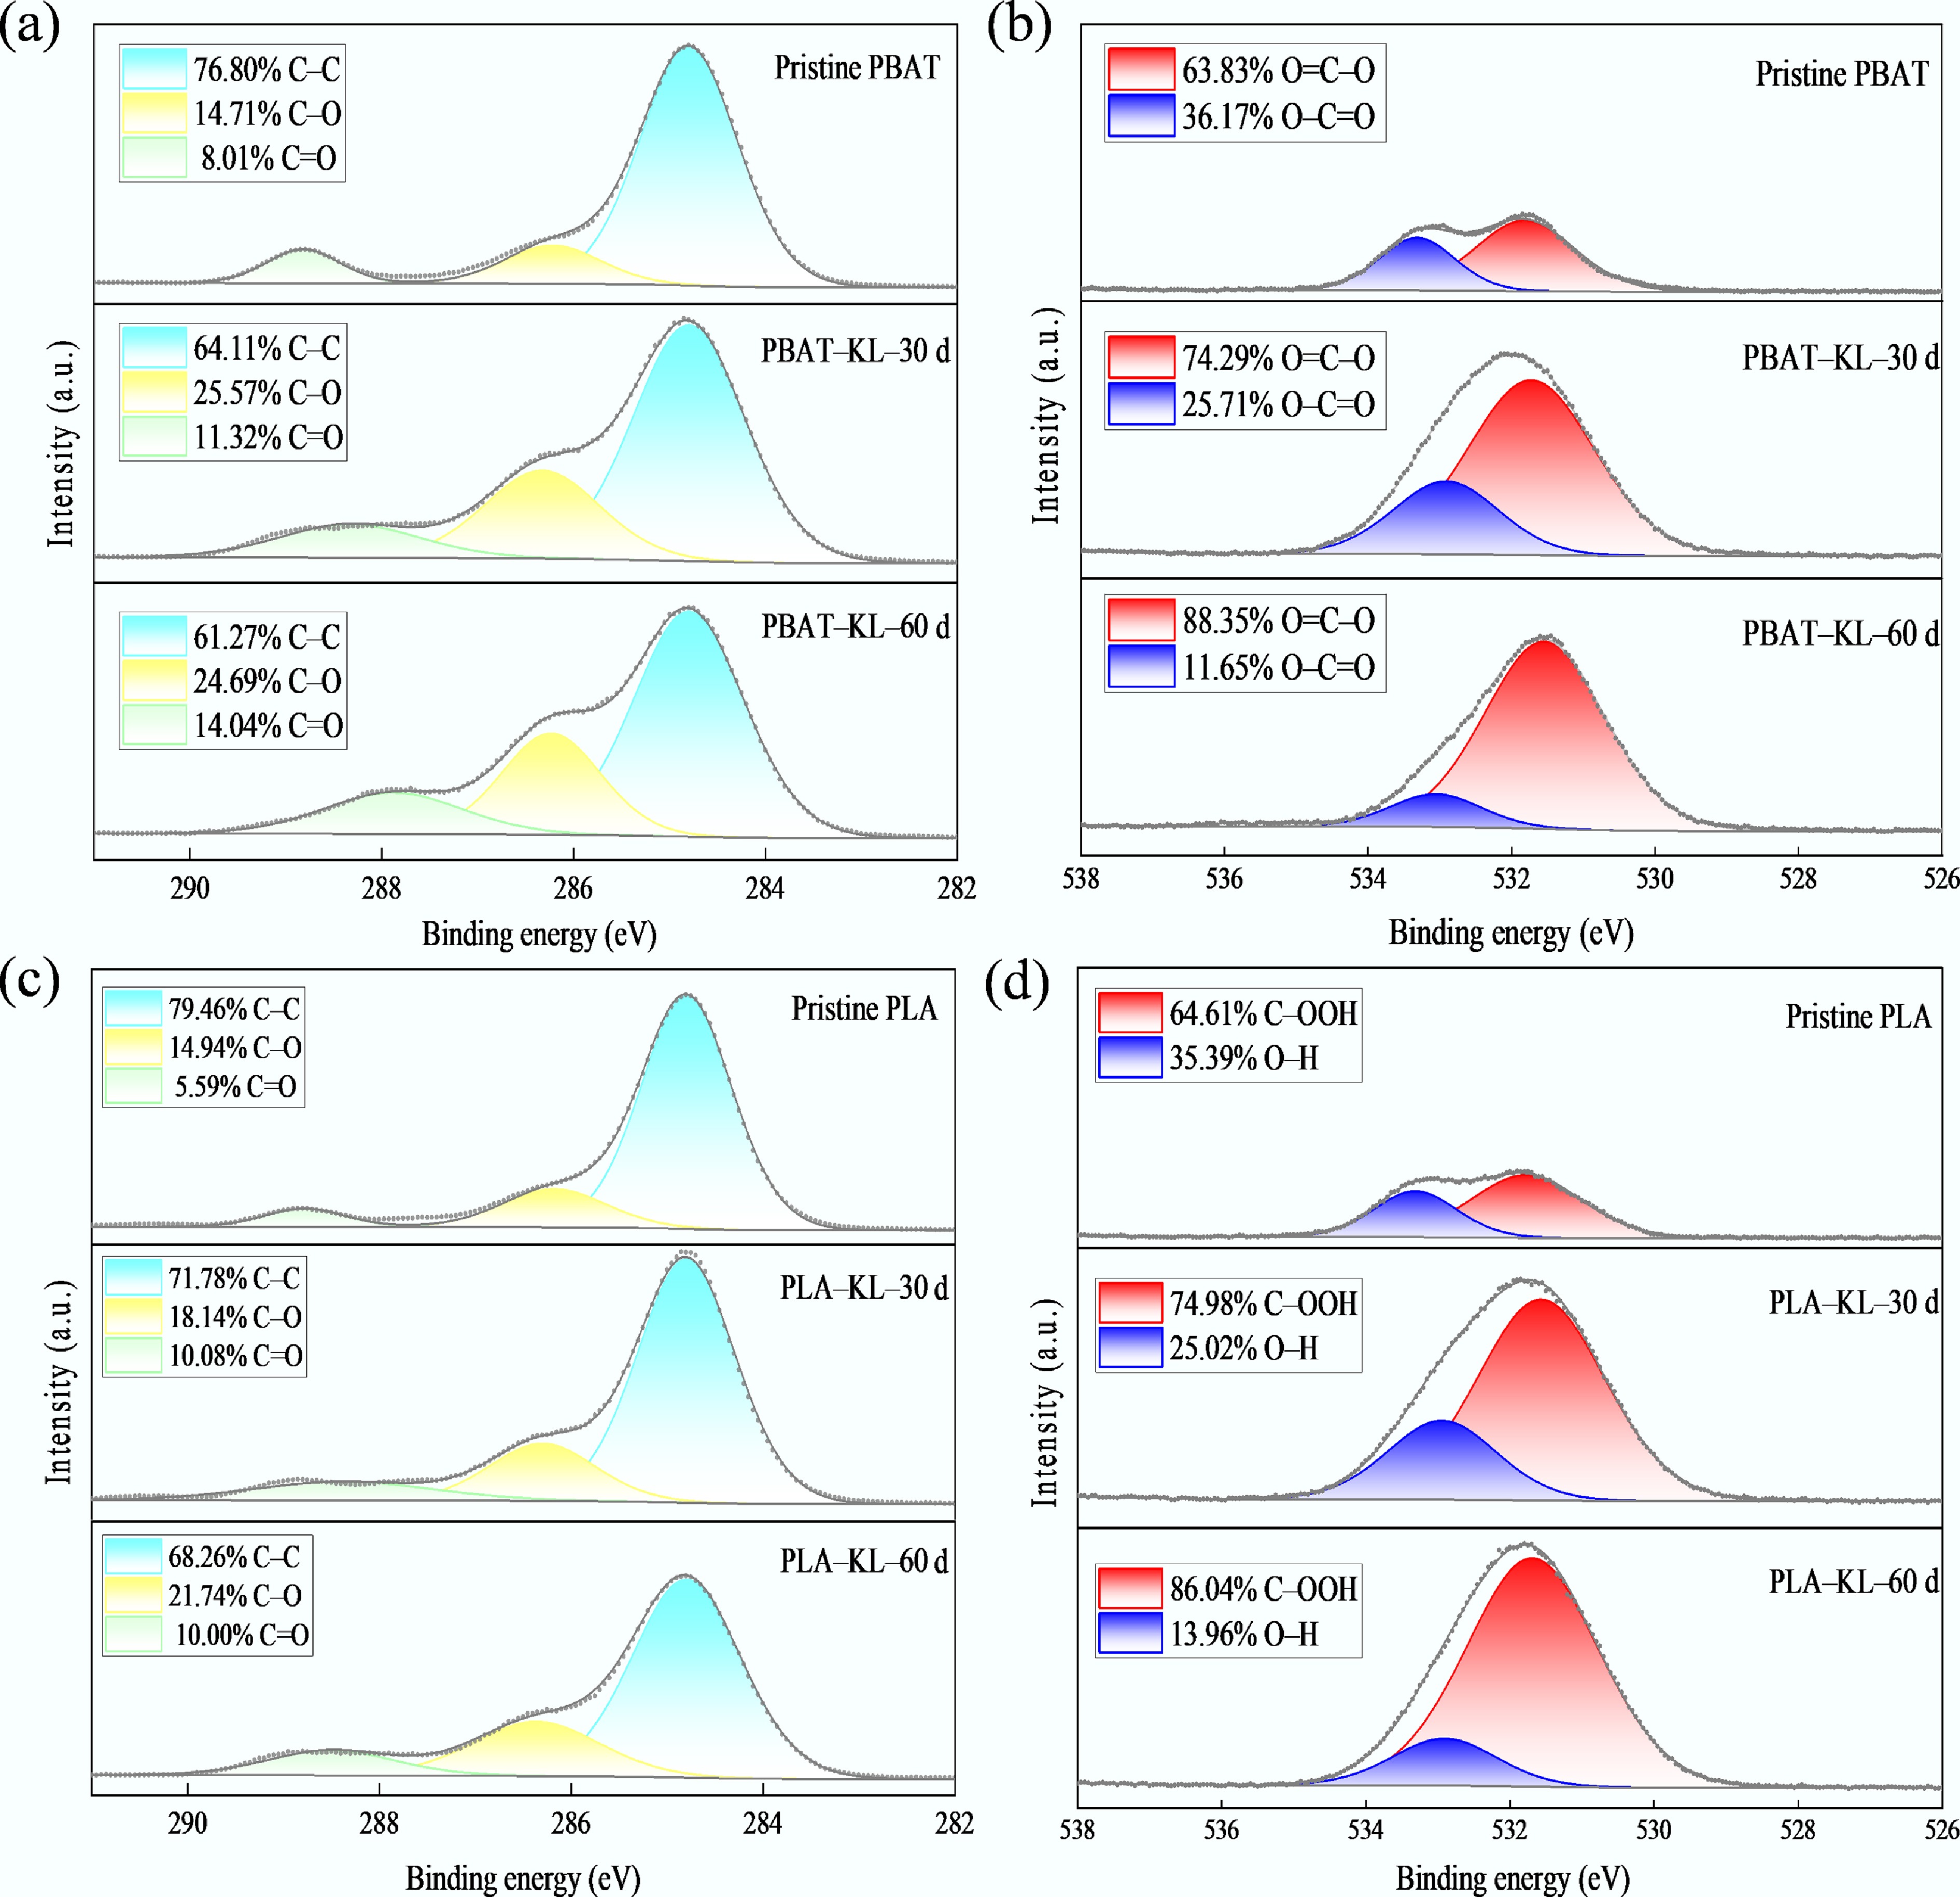
Figure 6.
High-resolution XPS spectroscopy regional spectra for C 1s and O 1s of (a), (b) PBAT, and (c), (d) PLA, in KL.
XRD analysis revealed that the crystalline structures of the polymers remained largely unchanged during degradation, whereas crystallinity changed significantly (Fig. 7a, b; Supplementary Table S8). Under photodegradation conditions, KL-mediated and MMT-mediated treatments increased the crystallinity of PBAT from 5.52% to 7.41% and 7.50%, respectively; the crystallinity of PLA decreased from 4.64% to 3.52% and 3.16%, respectively. In soil environments, PBAT crystallinity exhibited only minor fluctuations between the surface and 10 cm depth (5.98%–6.32%), whereas PLA crystallinity decreased substantially to 2.16%–4.13%.
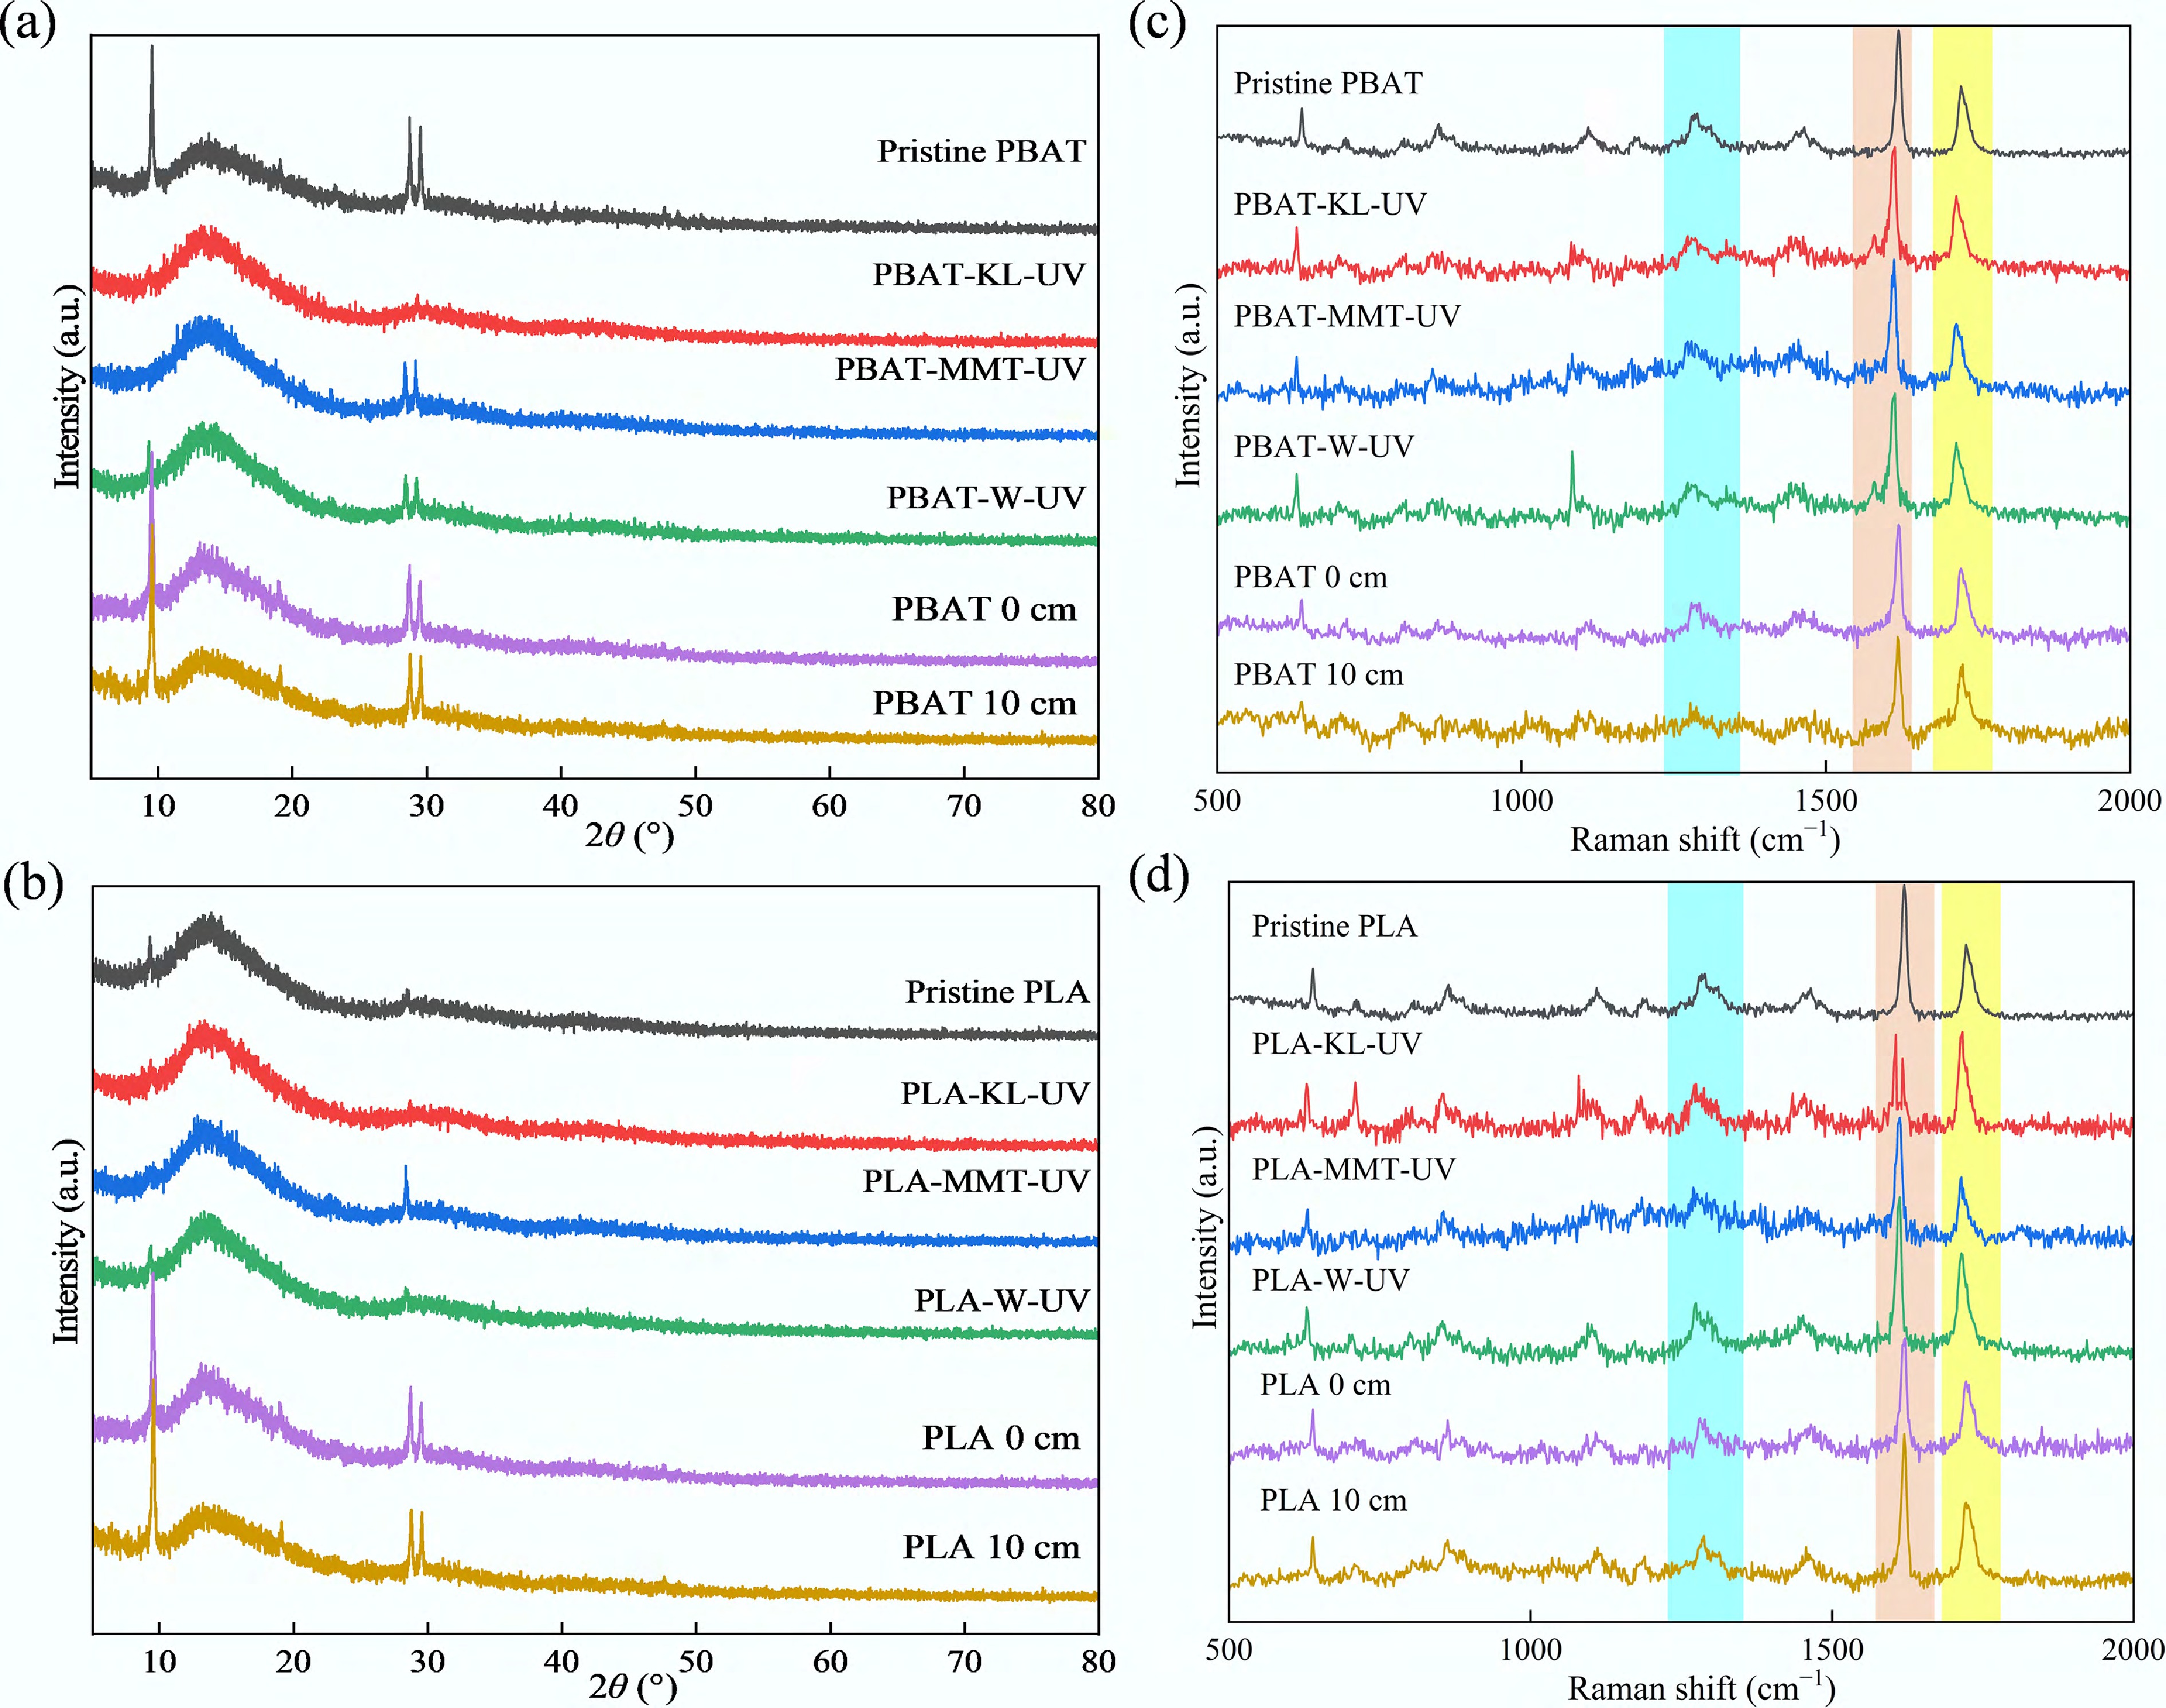
Figure 7.
XRD patterns of (a) PBAT, (b) PLA, and Raman spectra of (c) PBAT and (d) PLA of BDM (blue D band: 1,300 cm–1, orange G band: 1,580 cm–1, yellow C=O functional group band: 1,724 cm–1).
Raman spectroscopy provided supplementary insights into the BDM degradation process, particularly regarding molecular chain structure and crystalline state (Fig. 7c, d). The C=O stretching vibration (1,724 cm−1), methyl bending vibration (1,450 cm−1), and C–O–C stretching vibration (1,182 cm−1) showed a decrease in intensity and a shift to a lower wavenumber, confirming the FTIR and XPS analysis. The Raman index for PLA was calculated as the intensity ratio of the crystalline peak (870 cm−1) to the amorphous peak (1,450 cm−1), whereas for PBAT it was determined as the ratio of the carbonyl peak (1,720 cm−1) to the aromatic ring peak (1,285 cm−1) (Supplementary Table S8). Under various degradation conditions, the crystalline peak of PLA decreased whereas the amorphous peak increased, and the Raman index decreased[48]. In contrast, the ratio of the carbonyl peak to the ester-related peak in PBAT increased after degradation, leading to an elevated Raman index and reduced amorphous regions, consistent with XRD observations.
Sequential evolution of functional groups revealed by 2D-COS
-
Two-dimensional correlation spectroscopy (2D-COS) was applied to the ATR-FTIR spectra to analyze the sequential changes of functional groups. The synchronous spectra revealed coordinated changes among key functional groups. For PBAT, the main characteristic peaks appeared at 727, 1,105, 1,264, 1,450, and 1,710 cm−1, whereas for PLA, they were observed at 731, 873, 1,265, 1,452, and 1,710 cm−1 (Fig. 8; Supplementary Fig. S5). These peaks corresponded to –CH, C–O, –CH2, C–O, and C=O functional groups, respectively. Both auto-correlation and cross-correlation peaks were present in the synchronous spectra.
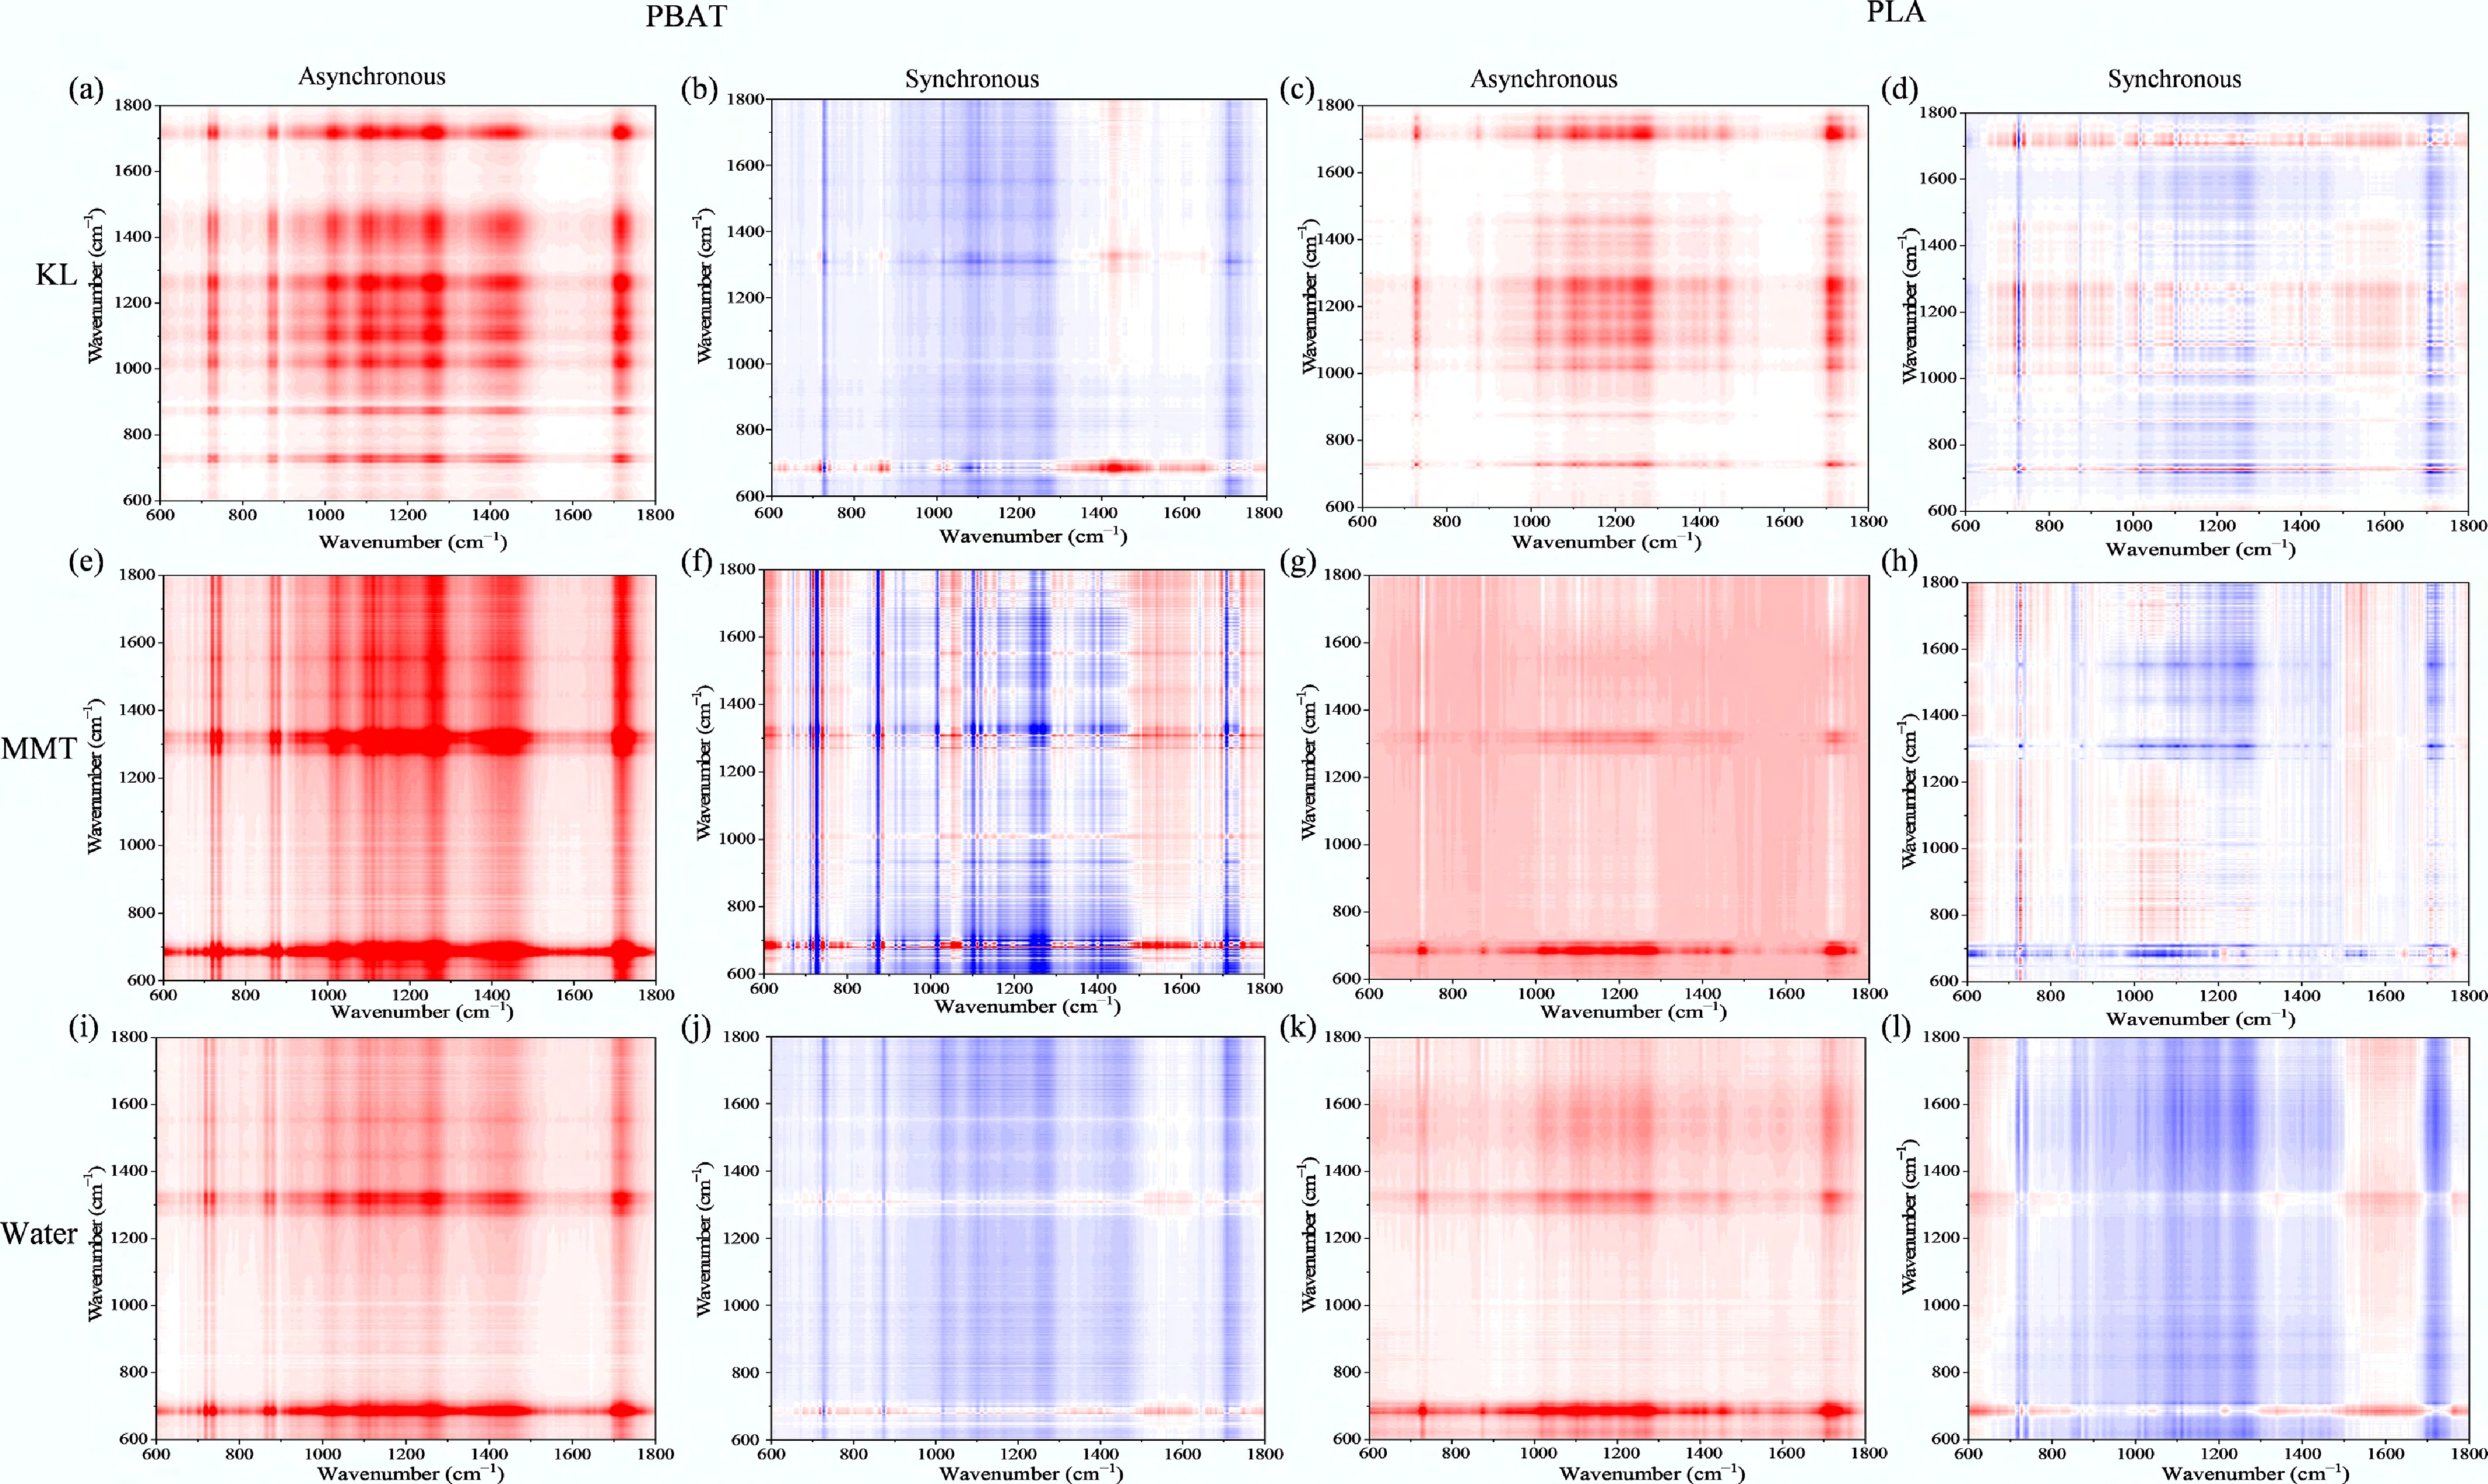
Figure 8.
Synchronous and asynchronous correlation maps of PBAT and PLA constructed based on ATR-FTIR spectra at different time intervals. (PBAT: a, e, i) and (PLA: c, g, k): synchronous maps; (PBAT: b, f, j) and (PLA: d, h, l): asynchronous maps under KL, MMT, and W-UV conditions.
According to Noda's rules[49,50], asynchronous spectra gave the sequential evolution of functional groups under different treatments (Supplementary Tables S9–S11). Under photodegradation conditions, the sequence of chemical bond changes in PBAT was: 727 (–CH) > 1,105 (C–O) > 1,710 (C=O) > 1,264 (C–O) > 1,450 cm−1 (–CH2). The benzene ring and CH2 groups changed only at later stages. During soil-mediated PBAT aging, the sequence of chemical bond alterations shifted to: 1,710 (C=O) > 727 (–CH) > 1,105 (C–O) > 1,264 (C–O) > 1,450 cm−1 (–CH2). For PLA under photodegradation conditions, the sequence was: 873 (O–CH–CH3) > 731 (–CH3) > 1,710 (C=O) > 1,265 (C–O) > 1,452 cm−1 (C–H). Under soil conditions, the sequence shifted to: 1,710 (C=O) > 731 (–CH3) > 1,265 (C–O) > 873 (O–CH–CH3) > 1,452 cm−1 (C–H).
Correlation analysis of BDM degradation
-
Correlation analyses were conducted on key aging parameters, including WL, CI, O/C, CA, and crystallinity (Supplementary Fig. S6). For PBAT, WL exhibited a significant negative correlation with C–C/H (C 1s) content (r = −0.92, p < 0.001). In contrast, WL showed a significant positive correlation with C=O (C 1s) content (r = 0.85, p < 0.05). The carbonyl index (CI) was negatively correlated with O–C=O (O 1s) content (r = −0.92, p < 0.01). In addition, C–C/H (C 1s) showed a significant negative correlation with C=O (C 1s) (r = −0.82, p < 0.05) and crystallinity (r = −0.83, p < 0.05), indicating that the destruction of the aliphatic carbon structure was accompanied by polymer chain scission. For PLA, C–C/H (C 1s) showed strong negative correlations with C=O (C 1s) (r = −0.99, p < 0.001) and O/C ratio (r = −0.91, p < 0.05). The contact angle (CA) exhibited a significant positive correlation with C–OOH (O 1s) content (r = 0.94, p < 0.01). Moreover, PLA crystallinity was positively correlated with CI (r = 0.94, p < 0.01).
-
SEM and water contact angle analyses revealed pronounced surface fragmentation, increased porosity, and progressive mechanical disintegration of the BDMs during degradation. At the same time, the results of XPS and FTIR showed important chemical transformations, including the reduction of C–C/C–H bonds and the enrichment of oxygen-containing functional groups, indicating continuous chain splitting and oxidation. In XRD analysis, the increase in crystallinity usually indicated the preferential degradation of the amorphous region, while the decrease in crystallinity indicated the destruction or erosion of the crystalline region. These opposite trends reflected the different degradation behaviors of PBAT and PLA. Specifically, PBAT mainly underwent preferential degradation in amorphous areas, resulting in a significant increase in crystallinity, while PLA underwent degradation in both amorphous and crystalline domains, resulting in a decrease in the overall crystallinity. These changes were particularly associated with degradation in amorphous regions, leading to increased surface brittleness and structural instability[51−54]. In addition, PCA clearly differentiated samples under different environmental conditions, confirming that ultraviolet irradiation, the presence of clay minerals, and soil environment had a significant impact on degradation behavior. In general, these multi-scale morphological, chemical, and statistical results together showed the gradual aging and structural evolution of BDM under environmental-related conditions.
PC1 and PC2 accounted for 35.3% and 20.7% of the total variance (Fig. 9a), respectively. PCA results showed that C–C/H (C 1s), C=O (C 1s), O=C–O (O 1s), and crystallinity were the main contributors to PC1, while O/C and C–O (C 1s) were negatively correlated with PC1. The moderate cumulative variance explained by PC1 and PC2 (56%) showed that other unmeasured factors could also cause BDM degradation; however, the EWM used for CAI integrated all available parameters and provided a practical degradation ranking. PBAT samples showed a more concentrated distribution between the treatment groups, while PLA samples were more widely distributed, reflecting the higher sensitivity and greater variability of PBAT to different environmental factors[55,56]. UV irradiation significantly accelerated the overall erosion degradation of PBAT, while PLA showed a mixed erosion mode, and its degradation kinetics were jointly regulated by many factors[57]. After photodegradation treatments (KL, MMT, and W), the PBAT sample mainly fell in the first and second quadrants, showing high positive values along the PC1 axis, and had obvious displacements along the PC2. For PLA, all degradation samples occupied the third quadrant. Compared with soil degradation, the samples treated with photodegradation were closer to the origin, and the values of PC1 and PC2 were relatively high. These observations showed the fundamental difference between light degradation and soil degradation. Therefore, the comprehensive aging index could be used to quantitatively evaluate the degree of degradation under different treatments.
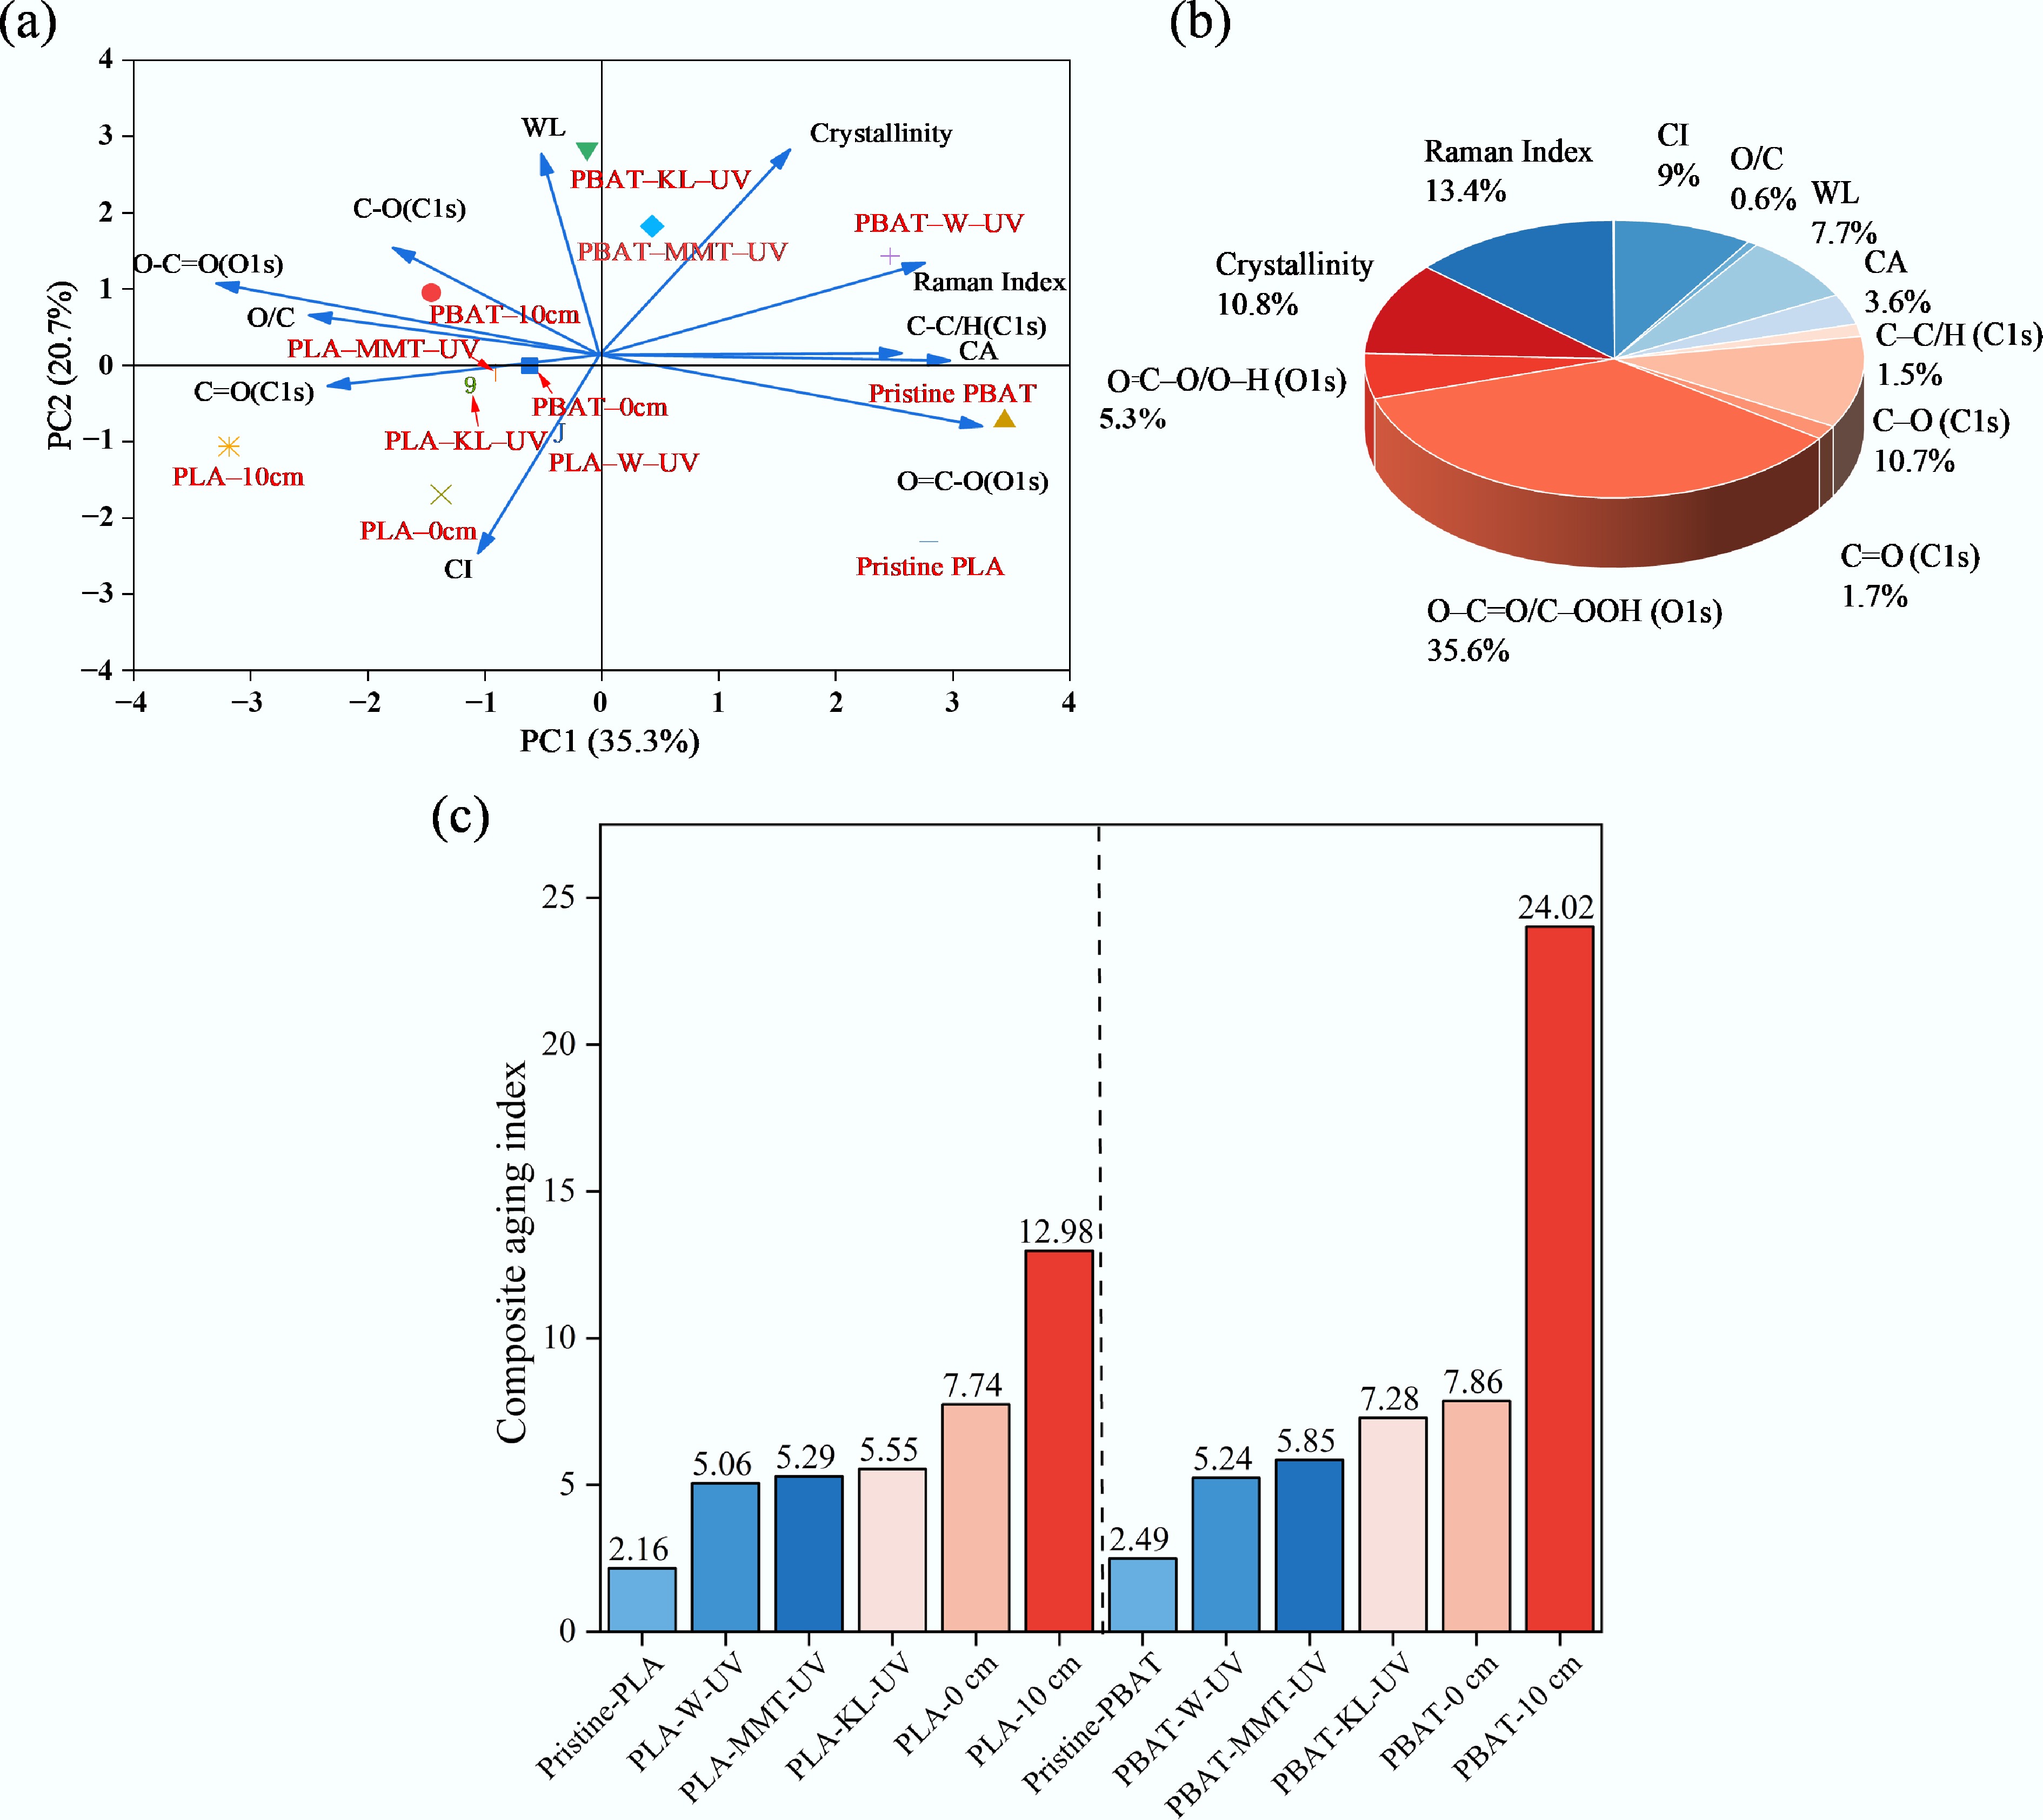
Figure 9.
(a) Principal component analysis (PCA) of BDM. (b) Pie chart showing the weights of each index. (c) The composite aging index.
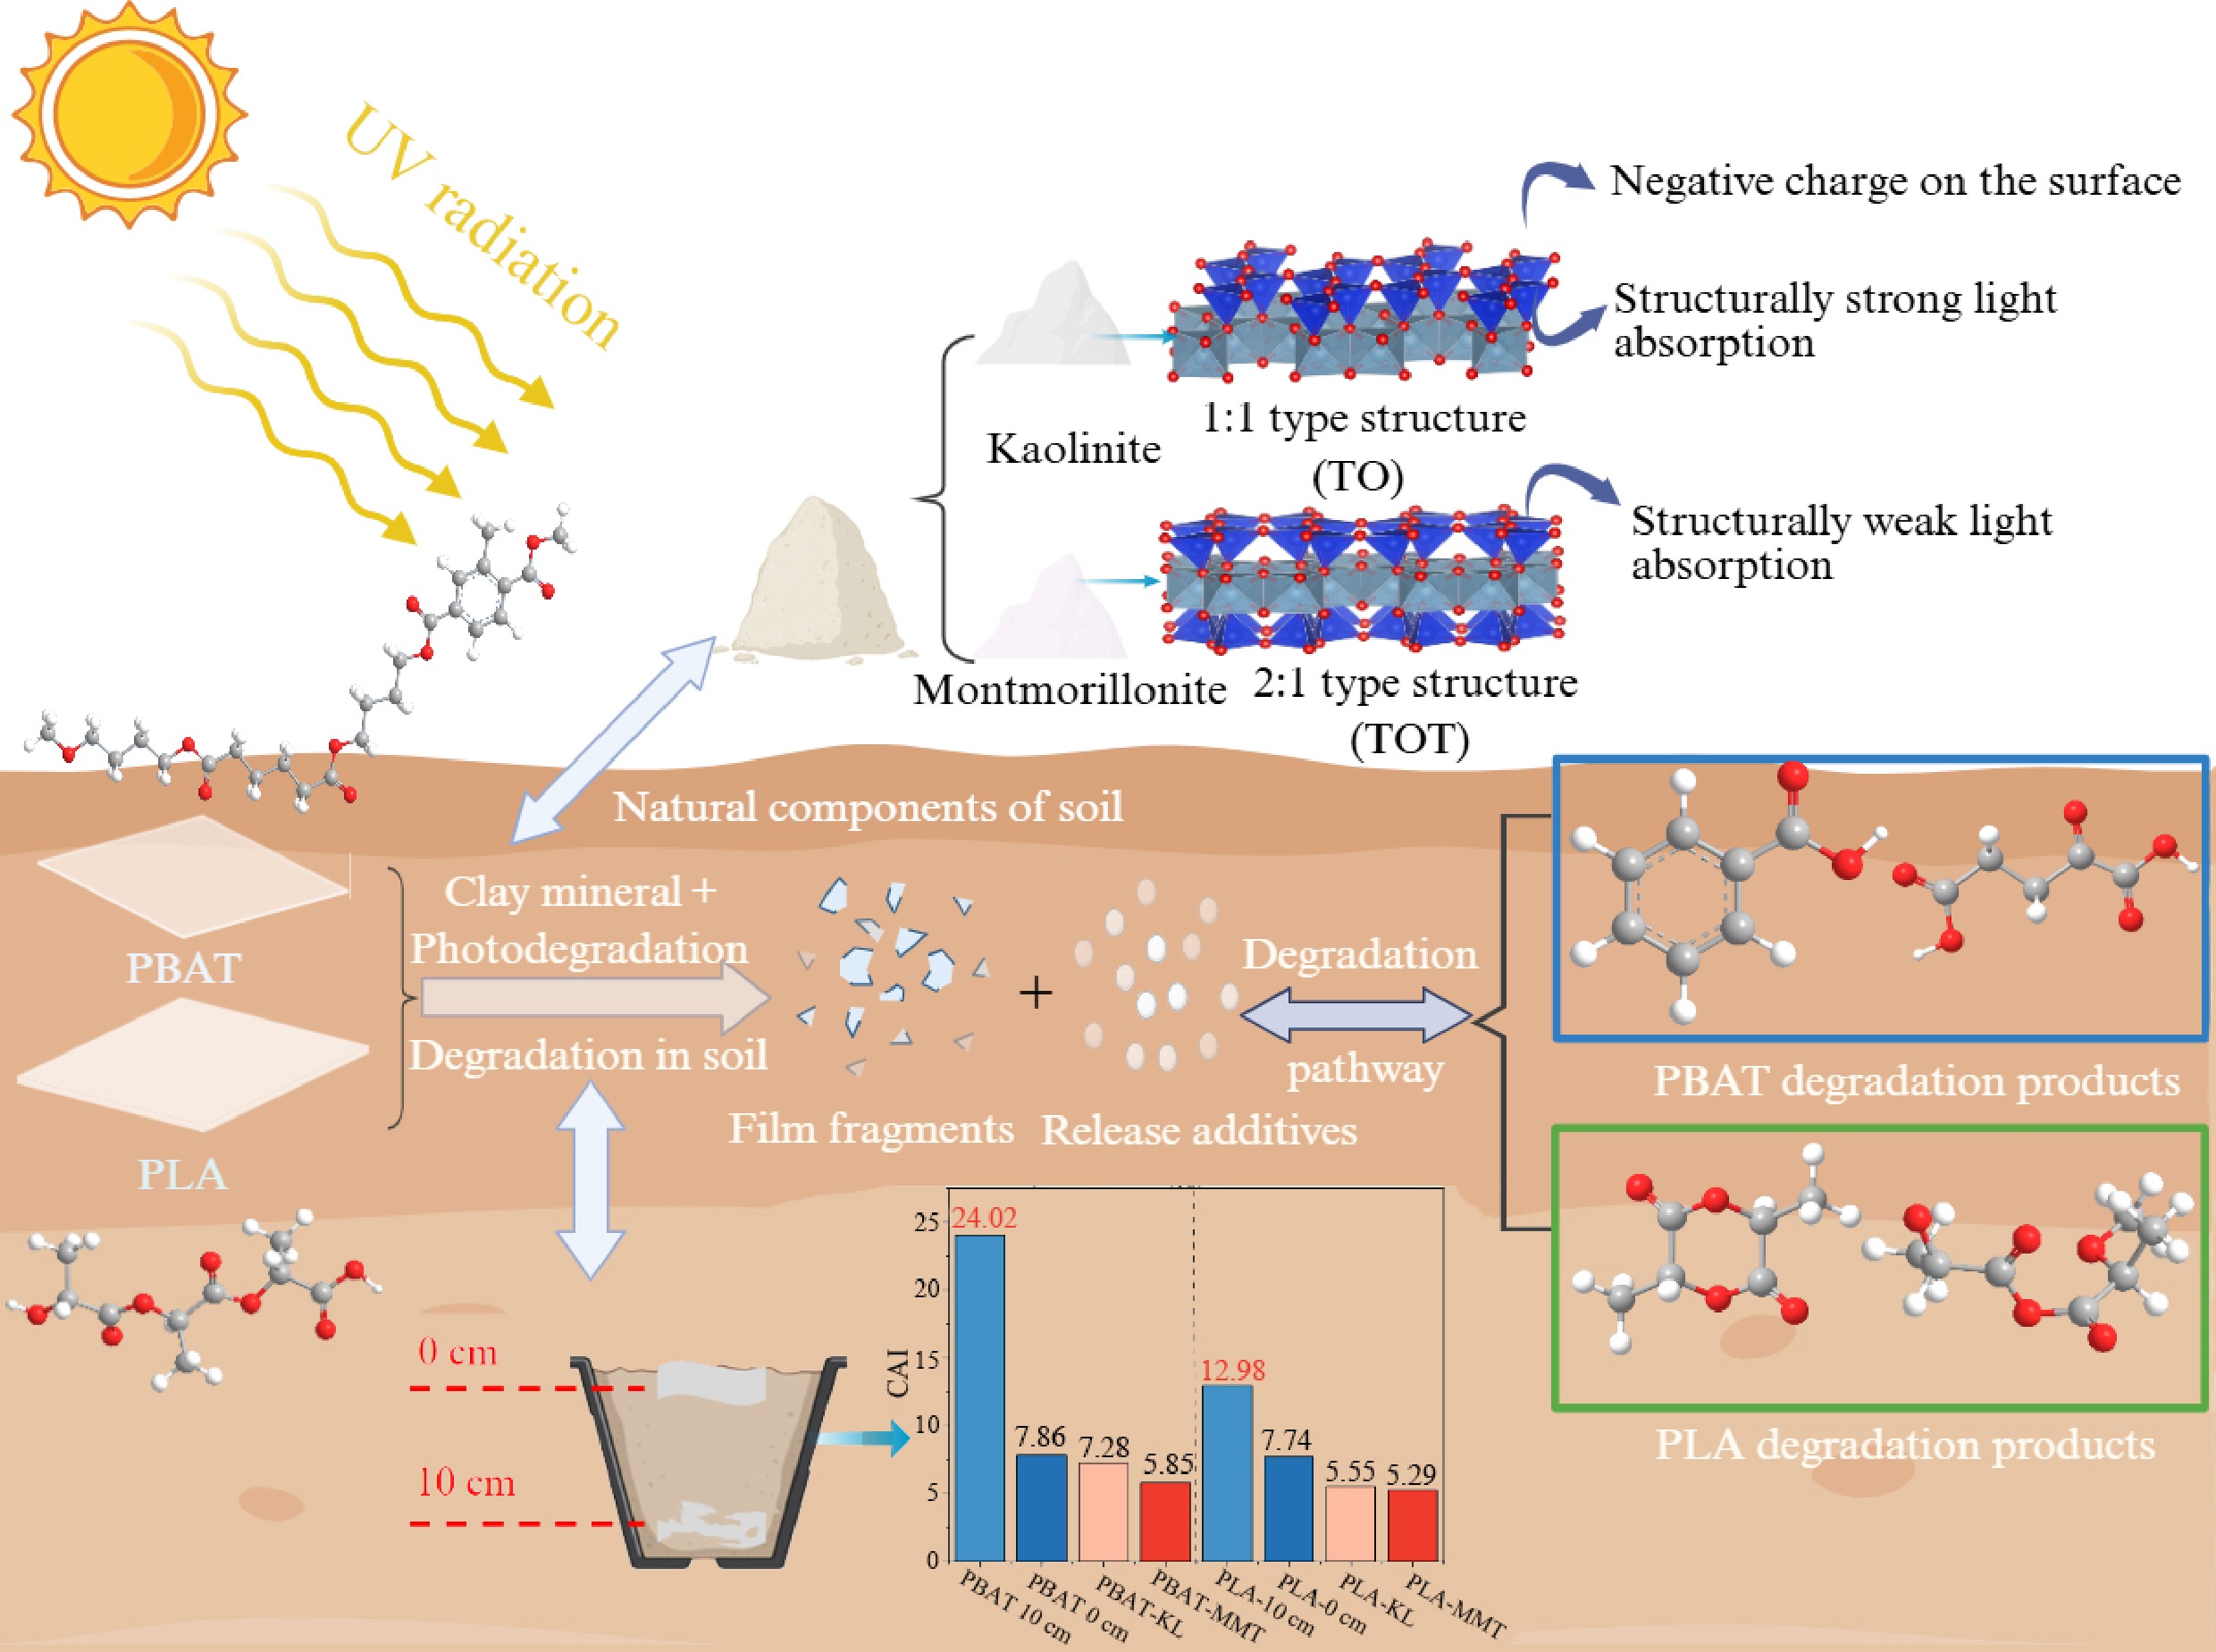
A CAI was constructed using EWM to quantitatively evaluate and compare the overall degradation levels (Fig. 9b, c). Detailed calculated values are presented in Supplementary Table S12. The results indicated that O–C=O/C–OOH (O 1s), O/C, crystallinity, C=O (C 1s), and CI carried higher weights in the CAI, suggesting that carbonyl oxidation and crystallinity changes represented the primary pathways of photodegradation. The CAI ranking (PBAT 10 cm > PBAT 0 cm > PBAT-KL > PBAT-MMT > PBAT-W > PLA 10 cm > PLA 0 cm > PLA-KL > PLA-MMT > PLA-W) showed that all PBAT-treated groups exhibited higher degradation than their PLA counterparts, consistent with prior studies (Fig. 9c). It was worth noting that the highest CAI value occurred in deep soil conditions (10 cm), which supported our second hypothesis that the depth of burial enhanced degradation. The photodegradation of BDM was mainly driven by ultraviolet-induced photooxidation, and clay minerals such as KL enhanced the degradation reaction by promoting ROS generation[34]. Soil degradation involved multi-factorial coupling of physicochemical properties, mineral composition, and microbial communities, in which moisture, enzyme reactions, and microbial activity interacted with photochemical processes[58−60].
Influence of clay minerals on BDM photodegradation
-
The octahedral structure of aluminum oxide in clay minerals (Supplementary Fig. S7) could trigger free radical reactions under light[61]. Specifically, aluminum oxide on the surface of minerals was easy to deprotonate, producing negatively charged active sites[62]. These sites reacted with oxygen to form O2•−, which oxidized plastics while simultaneously producing H2O2, H+, and •OH. The continuous action of these radicals accelerated the degradation process[37]. Compared with MMT, KL's excellent photocatalytic performance in promoting BDM degradation could be attributed to its unique physicochemical properties (Supplementary Fig. S8). KL showed a typical 1:1 layered structure with abundant surface hydroxyl groups. Its octahedral layer was directly exposed to the mineral surface, which promoted the effective interaction between active sites and polymer molecules. At the same time, KL adsorbed moisture and formed a stable hydration layer on the mineral surface, providing a favorable environment for ester bond hydrolysis and free radical-mediated oxidation reaction[63]. In contrast, MMT shows a 2:1 layered structure, in which its octahedral layer is sandwiched between two tetrahedral layers. This arrangement limits the accessibility of the active site, thus reducing its surface catalytic efficiency. This feature was also observed in the study of free radical-driven degradation of various organic pollutants[64,65].
The photoabsorption properties and space charge potentials of clay minerals were studied using ultraviolet-visible diffuse reflection spectroscopy (UV-vis DRS) and Mott–Schottky analysis. The results showed that the maximum light absorption wavelengths of KL and MMT were 435 and 400 nm, respectively (Fig. 10b), indicating that both minerals showed significant visible light absorption properties. Furthermore, the band gaps were determined using the Kubelka–Munk function (Eq. 1)[66]:
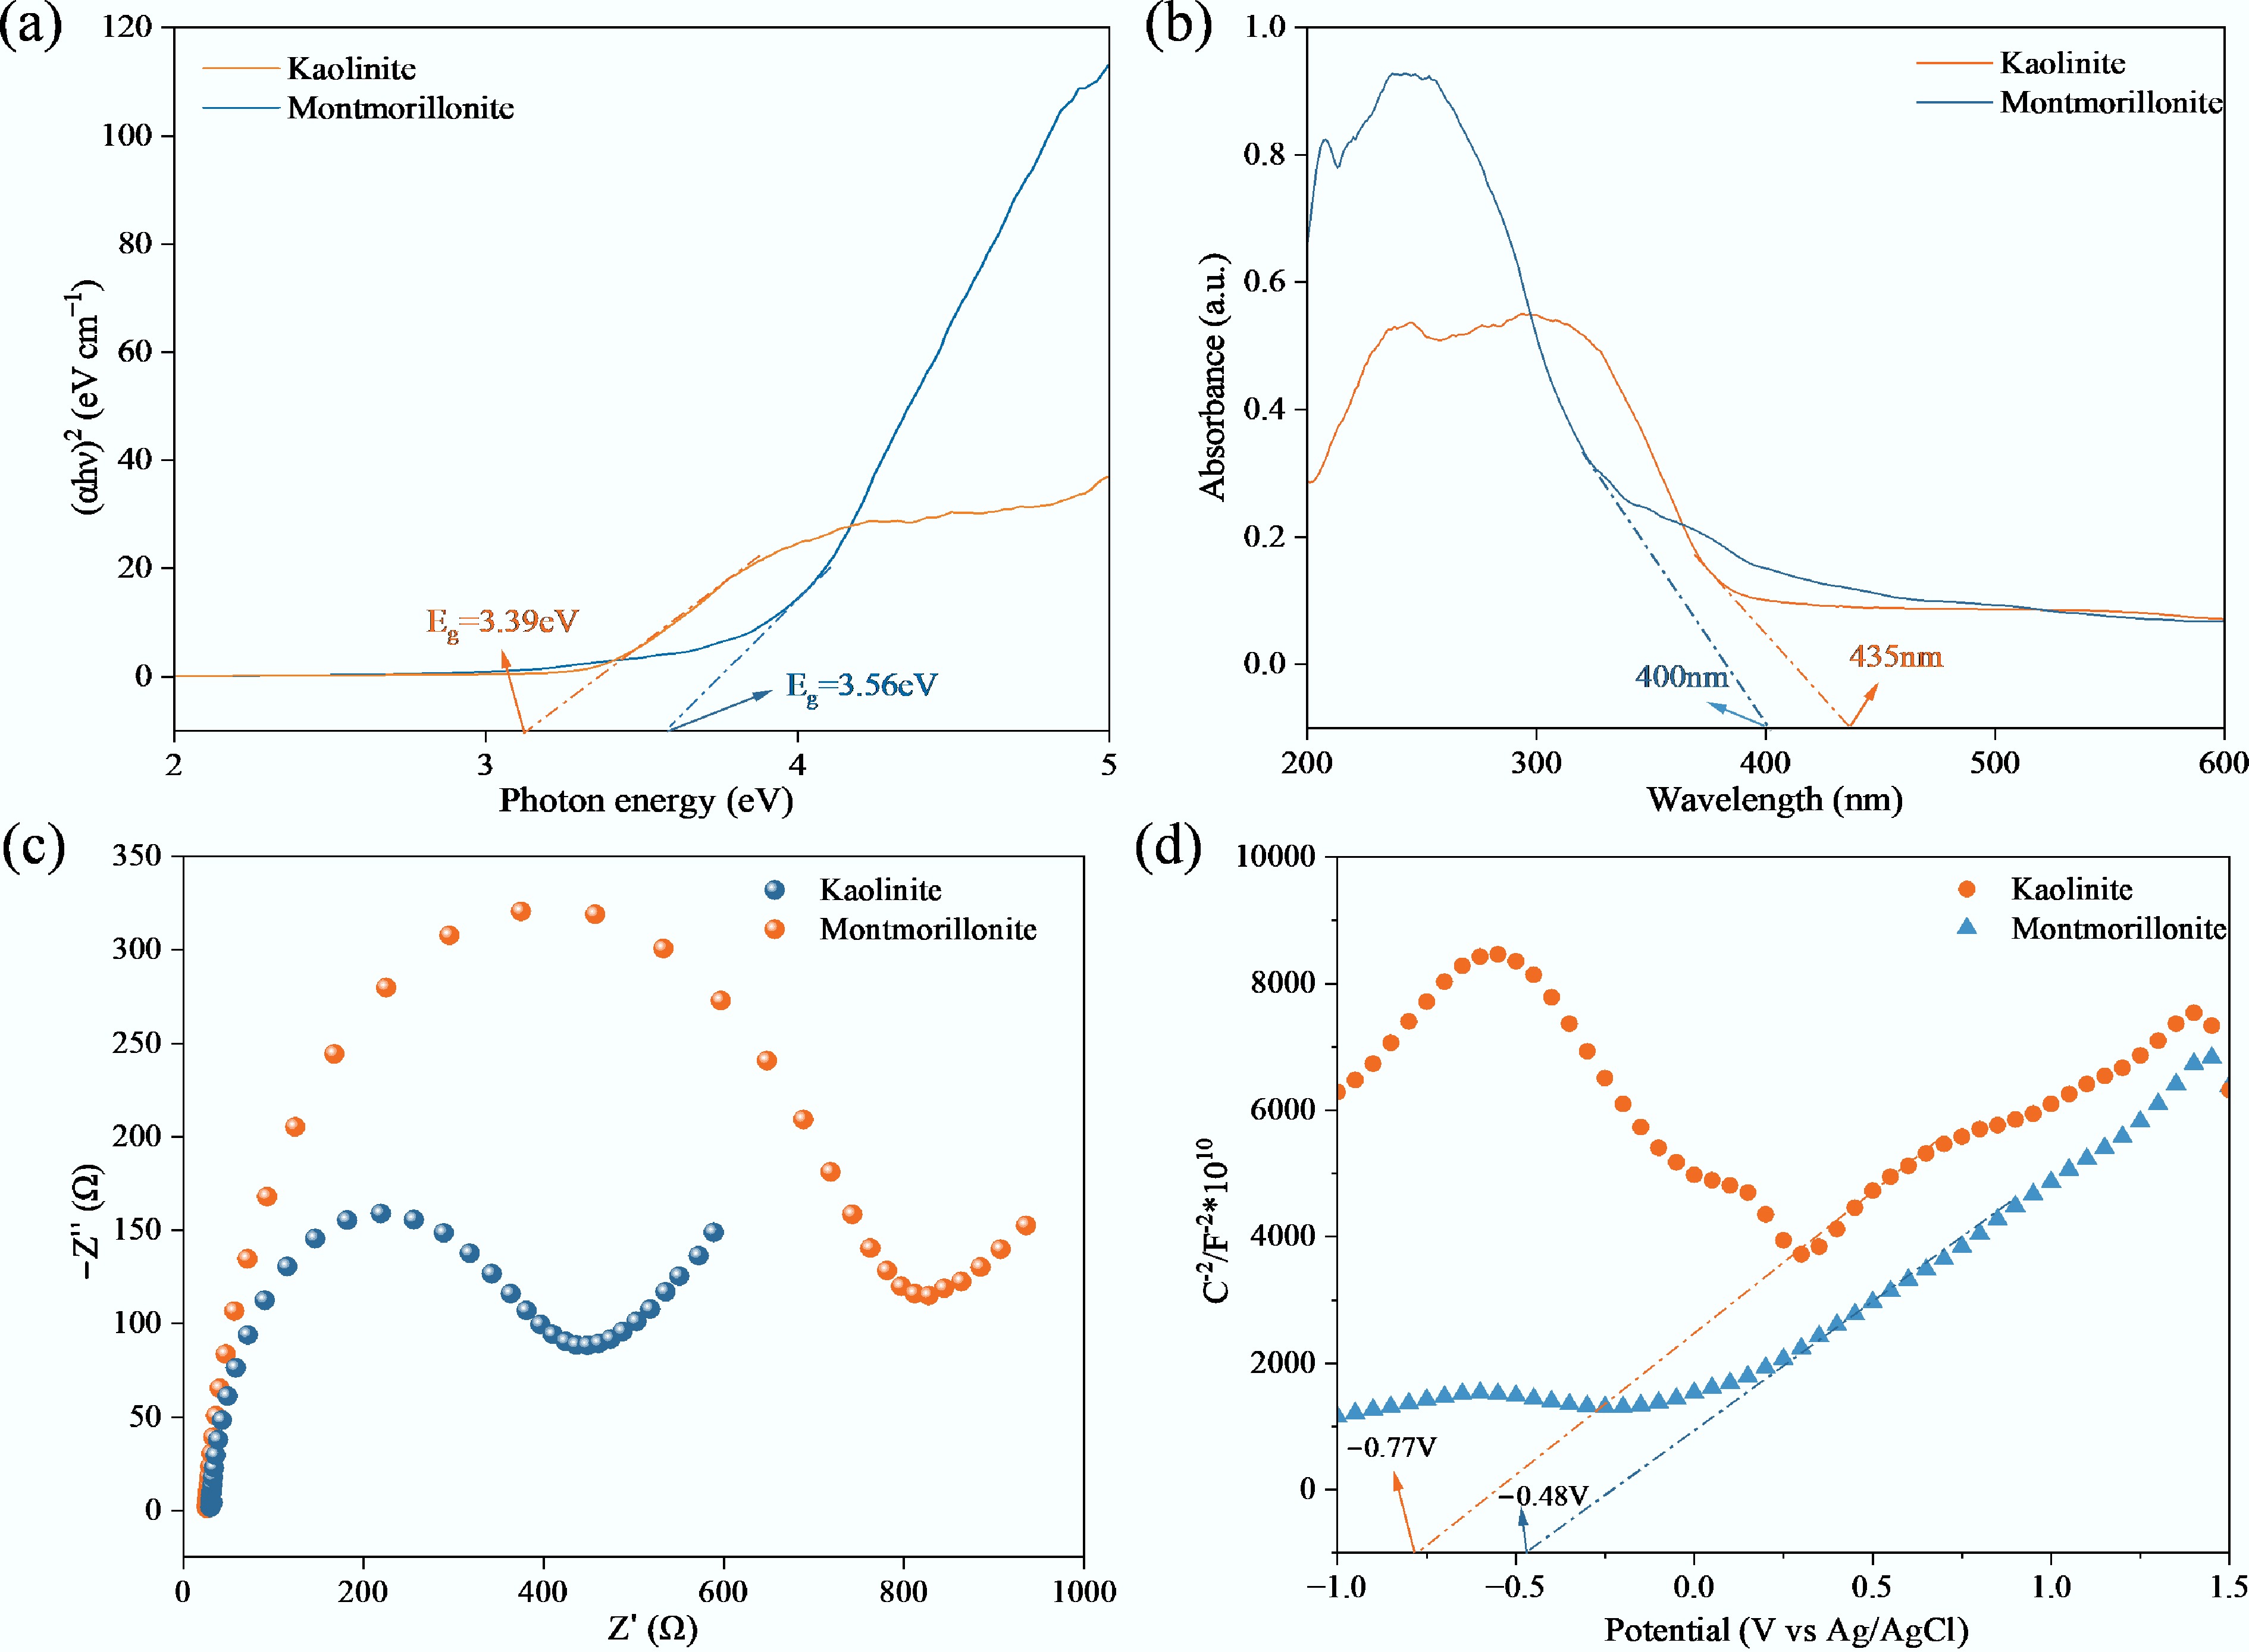
Figure 10.
(a) UV-DRS, (b) band gap, (c) EIS spectra, and (d) Mott–Schottky curves of KL and MMT.
$ \alpha h\nu=A(h\nu-E_g)^{n/2}, $ (1) where, α, h, v, Eg, and A are the absorption coefficient, Planck constant, the light frequency, the bandgap, and a constant, respectively. The coefficient n was determined by the characteristics of the material. Our experimental data strongly supported this mechanical explanation. Ultraviolet-visible diffuse reflectance spectroscopy (UV-vis DRS) and Mott–Schottky analyses confirmed that KL possessed a narrower band gap (3.13 vs 3.42 eV for MMT) and a more negative flat band potential (−0.24 V vs NHE, compared to −0.03 V for MMT) (Fig. 10a). The smaller band gap promoted the excitation of minerals under light, producing electrons and holes generated by light, indicating that KL showed greater photocatalytic potential than MMT.
Cyclic voltammetry (CV) curves (Supplementary Fig. S9) showed that KL exhibited more pronounced redox peaks and higher current responses, indicating greater active site availability and higher charge transfer efficiency, while MMT showed a weaker electrochemical response, which might have been due to its layered structure. The lower charge transfer resistance observed in the electrochemical impedance spectroscopy (EIS) spectrum and the more obvious redox peak in the CV curve of KL further supported this observation (Fig. 10c). Mott–Schottky plots (Fig. 10d) indicated that both minerals behaved as n-type semiconductors with indirect band gaps (n = 4). Compared with the flat band potential of the reference ordinary hydrogen electrode (NHE), the flat band potential of KL and MMT is determined to be −0.24 and −0.03 V, respectively, which indicates that KL has a stronger reduction ability[67]. Therefore, the conduction and valence band positions of KL are calculated as −0.24 and 2.89 V, respectively, and those of MMT are −0.03 and 3.39 V, respectively.
$ \mathrm{E}_{\mathrm{CB}}\mathrm{=E}_{\mathrm{VB}}\mathrm{-E}_{\mathrm{g}}, $ (2) where,
$ {\mathrm{E}}_{\text{CB}} $ $ {\mathrm{E}}_{\text{VB}} $ $ {\mathrm{E}}_{\mathrm{g}} $ Photocatalytic ROS generation of clay minerals
-
The ROS generated by clay minerals under ultraviolet irradiation was directly identified and quantified by ESR measurement (Supplementary Fig. S10; Supplementary Table S13). Both KL and MMT generated O2•− and •OH radicals, whereas 1O2 was only detected in the montmorillonite system. The signal intensity of •OH was markedly higher than that of other ROS species, indicating that •OH played a leading role in the process of photocatalytic degradation. Quantitative analysis further confirmed that ROS production increased with irradiation time. After 20 min of irradiation, the total spins of •OH and O2•− generated by KL reached 4.92 × 10¹² and 1.37 × 10¹³, respectively, which were substantially higher than those generated by MMT (2.58 × 10¹² and 9.69 × 10¹²). In contrast, no 1O2 was detected in the KL system, but it was observed in the MMT system that the total spin value was 3.25 × 10¹² after 20 min of irradiation. Importantly, the higher ROS yield produced by KL was consistent with its excellent photocatalytic degradation performance. Combined with DRS and photoelectrochemical results, this enhanced ROS generation was attributed to more efficient charge separation and electron transfer. Although MMT produced detectable1O2, its overall ROS yield, especially •OH, was still lower than that of kaolin. The high content of ROS, especially •OH, might have accelerated ester bond cleavage, oxidation, and chain cleavage, resulting in greater degradation of PBAT and PLA. These findings provide direct evidence that the superior catalytic performance of KL was closely associated with its stronger ROS generation capacity and the ROS-mediated photooxidation process.
Influence of soil on BDM degradation
-
While the preceding section focused on the intrinsic photocatalytic mechanisms of KL and MMT in simplified aqueous systems, the degradation of BDMs under soil burial conditions was further influenced by mineral-mediated reactions and depth-dependent physicochemical characteristics of the soil environment. Because the soil was sterilized prior to incubation, the degradation processes observed in this study mainly reflected abiotic mechanisms, including mineral–polymer interactions, moisture-mediated hydrolysis, and soil physicochemical regulation. Therefore, this section further elucidated the contribution of soil physicochemical factors to BDM degradation under a controlled, sterilized soil system.
During BDM degradation, lower soil pH, higher conductivity, and lower organic matter content were observed (Supplementary Fig. S11). These changes were mainly due to changes in the soil microenvironment under the plastic cover, in which acidic metabolites and released ions reduced the pH of the soil[68] and increased the conductivity. At the same time, changes in soil physicochemical properties and microbial communities might have affected SOM kinetics[69]. The decline in soil pH aggravated soil acidification, which might have accelerated the cleavage of ester bonds in BDM by acid-catalyzed hydrolysis[70]. Furthermore, Xie et al. showed that the polymer degradation rate increased with the increase of soil depth (2–14 cm)[71]. Consequently, BDM degradation rates in deeper soil layers consistently exceeded those observed in surface soils.
Importantly, the enhanced degradation observed at greater soil depth could not be explained by a simple additive effect, but was primarily attributed to the more complex mineral composition of soils, which further strengthened mineral-mediated interfacial reactions. Agricultural soils typically exhibited silico-aluminous characteristics and were mainly composed of SiO2 (approximately 66%) and Al2O3 (approximately 16%), along with other mineral phases such as Fe-, Ca-, K-, and Mg-containing components (Supplementary Table S2). These heterogeneous mineral combinations provide a variety of reaction sites and enhanced catalytic interfaces, thus promoting the degradation of BDM under soil conditions. These components can enhance photochemical activity through electron transfer or Fenton-like reactions. César et al.[72] reported that the degradation rate of polycaprolactone (PCL) in clay soil (72.5%) was significantly higher than that in sandy soil (60.5%), which is due to the higher surface content and stronger water retention of active minerals in clay-rich soils. In actual soil, KL adsorbs soil dissolved organic matter (DOM) through its hydroxyl functional group and polar surface, thus forming a mineral-organic complex[73]. Under humid or saturated conditions, the specific surface area and adsorption capacity of clay minerals were further enhanced[74], which promoted water retention and increased the probability of contact between the mineral surface and the polymer matrix. The hydration mineral interface provided abundant reaction sites and promoted non-biodegradation processes, including ester bond hydrolysis, surface-mediated electron transfer, and oxidative transformation. Therefore, the degradation of BDM was enhanced by the multi-component minerals in the soil through mineral-mediated catalytic reactions and physicochemical interactions under sterilized soil conditions.
Although UV penetration at a depth of 10 cm was negligible, the higher weight loss and CAI value (Figs 2a, 9c) observed at this depth indicated that non-photochemical degradation pathways became increasingly important. The enhanced degradation was likely dominated by hydrolytic reactions and mineral-mediated interfacial processes under the relatively stable moisture conditions of deeper soil layers.
Degradation pathways and intermediate products of BDM
-
The variation in TOC concentrations provided evidence that a fraction of polymer-derived carbon was converted into soluble carbon-containing products during BDM degradation, indicating the occurrence of partial mineralization. The maximum TOC concentration of PBAT reached 14.71 mg/L, and PLA reached 10.10 mg/L, indicating that the release of dissolved organic carbon helped to degrade the polymer materials. During the experiments, residual micro/nanoscale polymer fragments were collected, and the montmorillonite and kaolinite phases were further subjected to washing and desorption procedures. The recovered fragment mass accounted for only a negligible fraction of the initial film mass under the investigated conditions, suggesting that extensive accumulation of residual polymer fragments was unlikely to be the predominant degradation pathway. Therefore, the degradation process observed in this study was mainly attributed to two concurrent pathways: partial mineralization of polymer-derived carbon and molecular degradation involving polymer chain cleavage, oxidation, and structural transformation.
By integrating the results from morphology, surface chemistry, and structural analysis with LC-MS identification of intermediates, we propose detailed photodegradation pathways for PLA and PBAT (Fig. 11). The PLA degradation process was mainly carried out through three parallel pathways, namely photooxidation degradation of ester bonds, hydrolysis degradation, and direct ester bond cracking (Fig. 11a). Initially, the oligomeric lactic acid species was formed, and then the ethylene glycol intermediate was produced by intramolecular cyclization and was further hydrolyzed into lactic acid monomers. In the photooxidation pathway of the ester bond, the PLA backbone ester bond (m/z = 158) underwent a Norrish type II photochemical reaction under ultraviolet irradiation (hν) in the presence of O2. The initially formed hydrogen peroxide group (–OOH) acted as an endogenous photosensitizer, which significantly improved the photoabsorption efficiency of the carbonyl group, thus producing an excited triplet state (3PLA*) and 1O2[75]. Subsequently, decomposition of hydroperoxides produced O2•− and •OH, which induced polymer chain degradation via α-hydrogen abstraction and β-scission processes, yielding oxidation products such as pyruvic acid (m/z = 88), methoxyacetic acid (m/z = 174), and isobutyric anhydride (m/z = 130)[75]. Thereafter, intramolecular energy transfer further distributed excitation energy to adjacent C–H bonds, ultimately leading to complete photo-oxidative mineralization into carbon dioxide and water.
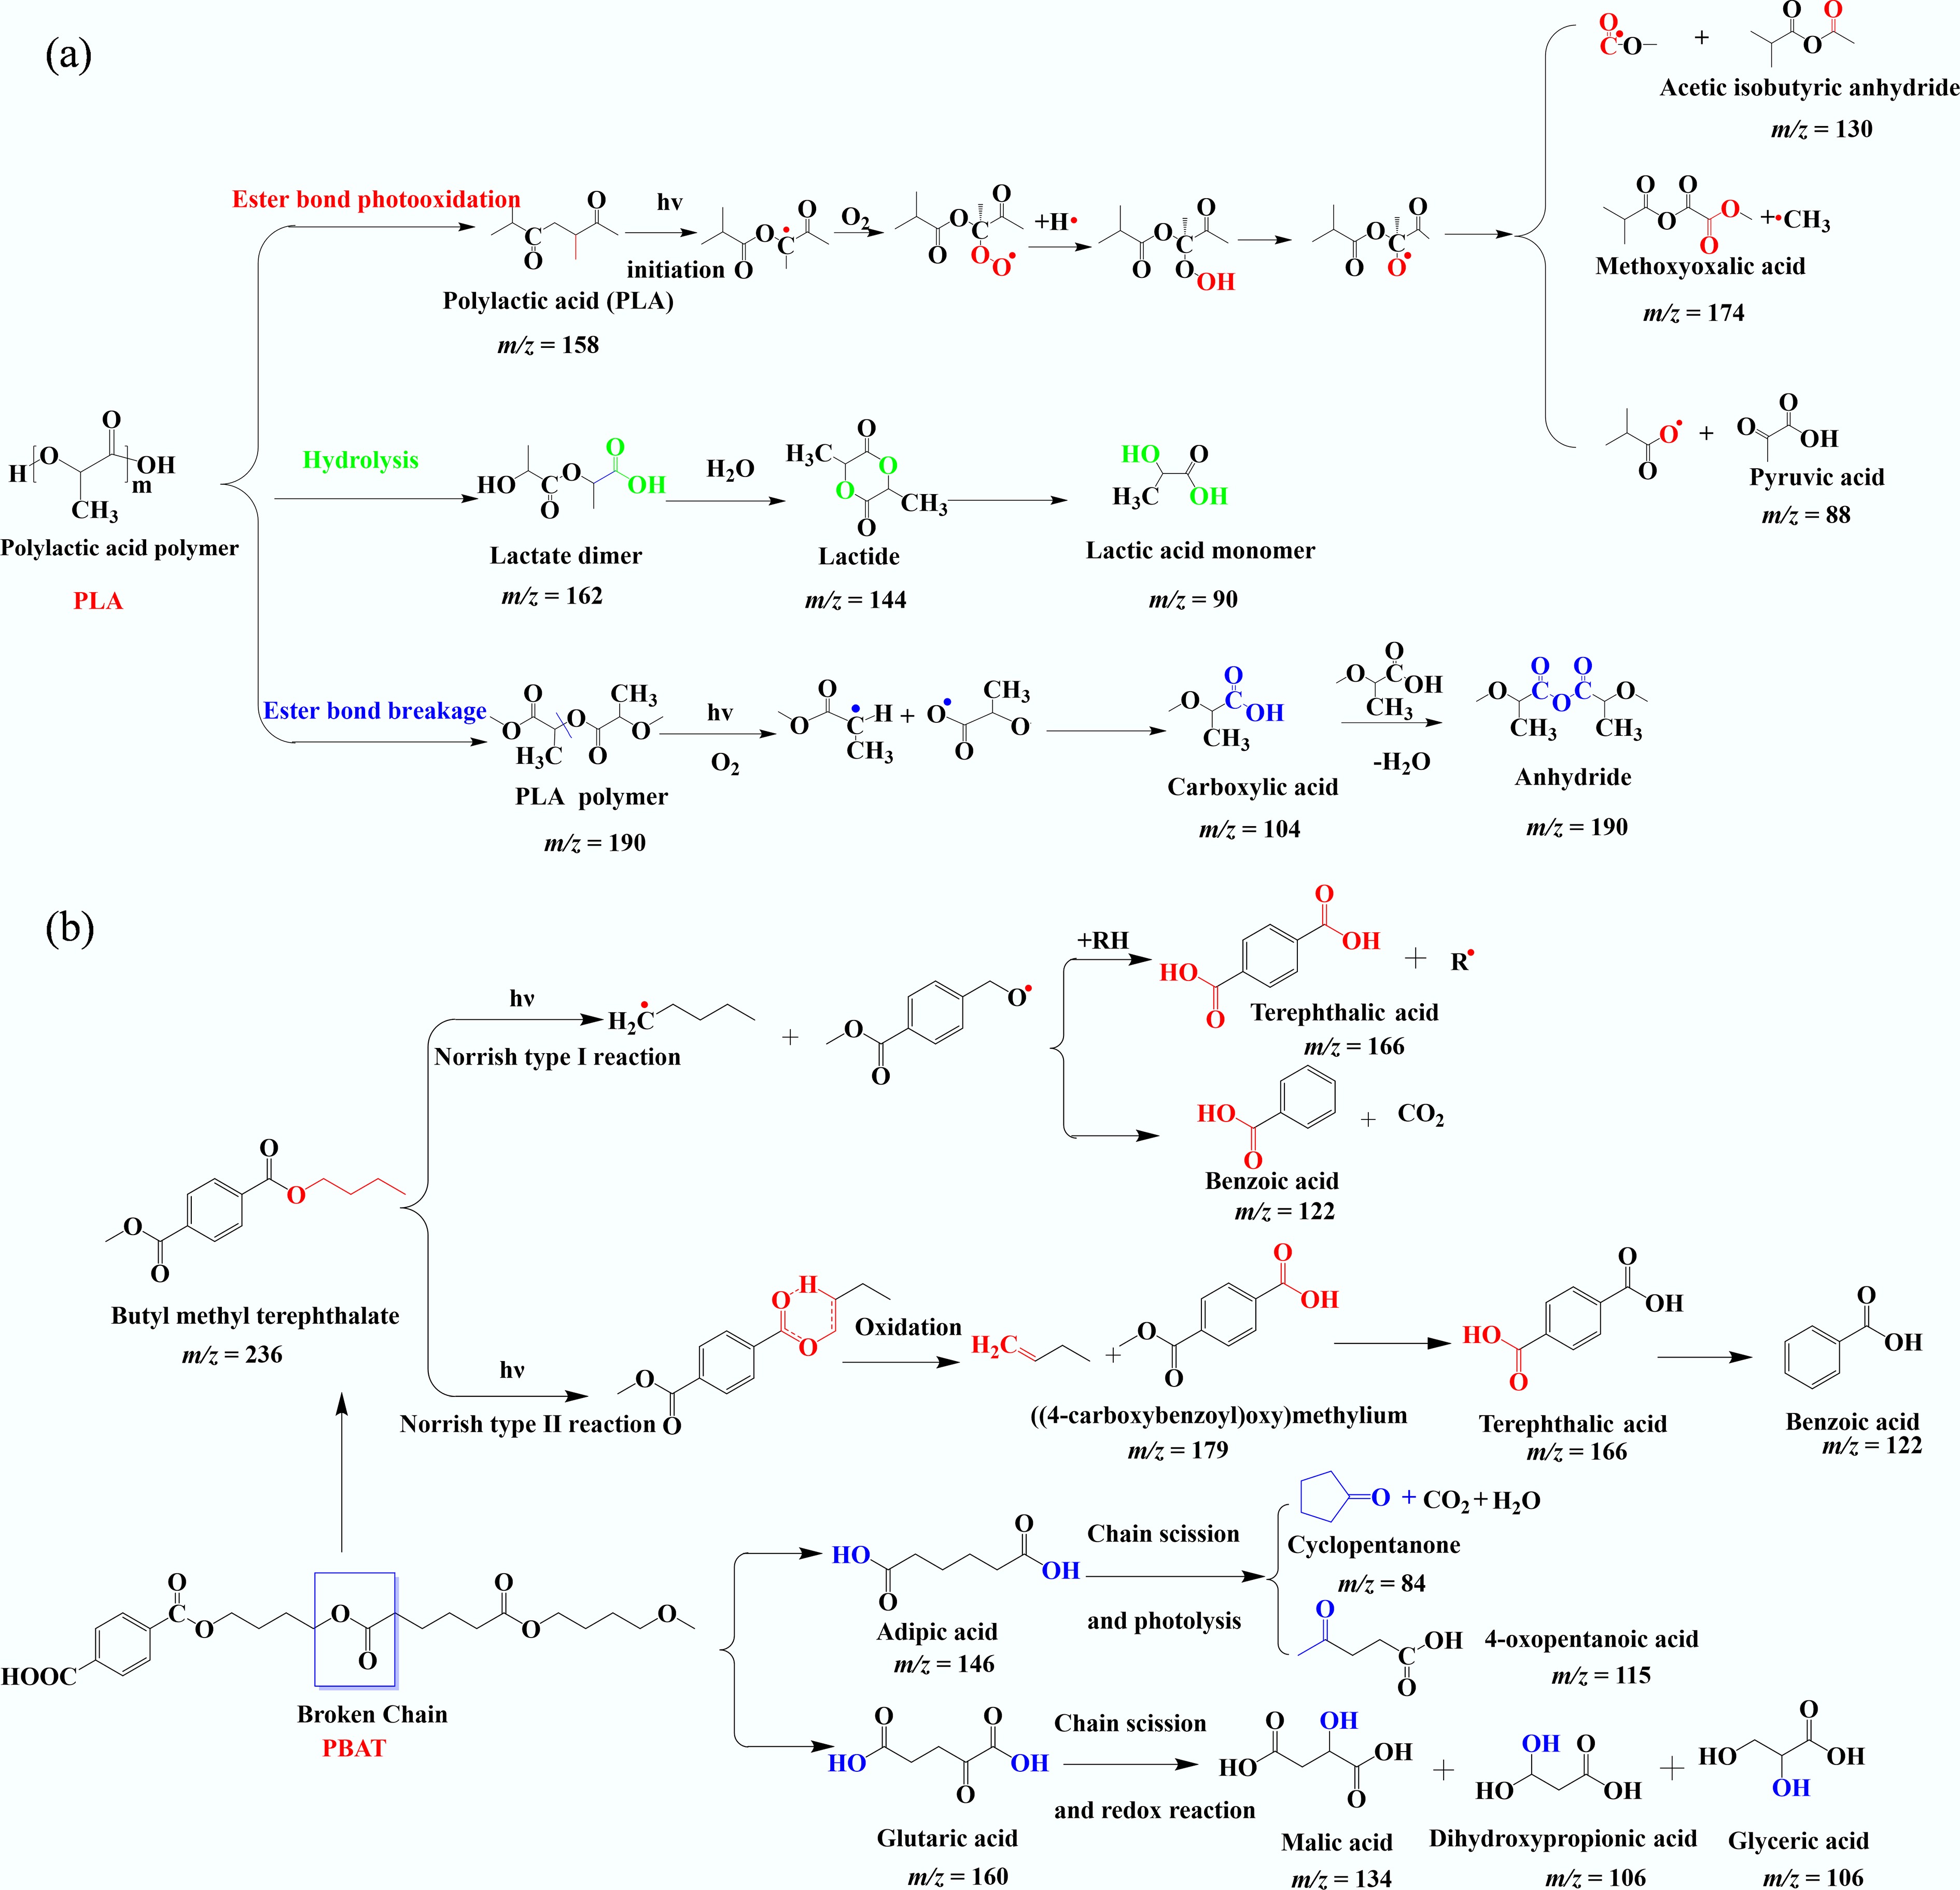
Figure 11.
Photodegradation pathways and products of (a) PLA and (b) PBAT.
PBAT degradation was initiated by cleavage of ester bonds in the polymer backbone, generating chain fragments and aromatic intermediates (m/z = 190) (Fig. 11b). These intermediates underwent further oxidative decomposition to form alcohols and carboxylic acids. Due to the presence of aromatic rings, PBAT strongly absorbed UV light (300–330 nm), causing the Norrish reactions[76,77]. In the Norrish type I pathway, UV excitation of he aromatic unit induced the homolysis of the α-carbon site, which produced free radical species. In the Norrish type II pathway, the excited carbonyl group underwent intramolecular hydrogen transfer through the six-element transition state, resulting in chain splitting and the formation of fragments and olefins containing carboxyl groups (m/z = 179)[78]. The aliphatic (PBA) segment mainly degraded via random chain scission and oxidative hydrolysis, producing adipic acid (m/z = 146) and glutaric acid (m/z = 134), which were further converted into hydroxy acids (m/z = 106, 134) and finally into cyclopentanone (m/z = 84) and 4-oxopentanoic acid (m/z = 115).
During soil mineral-mediated photo-oxidative degradation, both PBAT and PLA generate complex mixtures of oligomers, oxygen-containing groups, and low-molecular-weight products (Supplementary Figs S12, S13). Compared with PBAT, PLA was less sensitive to the degradation of clay minerals, which might be due to its higher crystalline retention or different surface chemistry, which limited the adsorption of free radicals. Notably, LC-MS detected six classes of additives: antioxidants, stabilizers, plasticizers, lubricants, antimicrobial agents, and chain extenders (Supplementary Table S14). Overall, photo-oxidative chain scission induced by clay minerals—especially KL—promotes the formation of low-molecular-weight oxygenated products, which are more readily assimilated by soil microorganisms, potentially accelerating the biodegradation of BDMs in agricultural soils.
Toxicity assessment of degradation intermediates
-
To evaluate the potential environmental risks associated with BDM degradation, the toxicity of major degradation intermediates was predicted using the T.E.S.T. Developmental toxicity and acute toxicity toward Daphnia magna (LC50) were selected as representative endpoints (Supplementary Fig. S14). The results showed that the toxic characteristics of degradation products were different depending on their chemical structure. For PBAT, developmental toxicity usually decreased after degradation, and the predicted value decreased from 1.0 to 0.34–0.78. However, the acute toxicity to large fleas showed significant changes, with LC50 values ranging from 15.7 to 3,317.7 mg/L (Supplementary Table S15), indicating that some intermediates might have enhanced aquatic toxicity. In contrast, the developmental toxicity of PLA degradation products was relatively small, ranging from 0.61 to 0.82. The predicted Daphnia magna LC50 values varied between 13.5 and 1,615.5 mg/L (Supplementary Table S15), indicating that some transformation products might still pose a potential risk to aquatic organisms. These results showed that degradation did not necessarily reduce toxicity, because oxygen-containing intermediates and low molecular weight products might still cause ecological risks. Therefore, the evolution of toxicity should be considered when evaluating the environmental safety of BDM. Most degradation products showed the predicted LC50 value within the scope of the model, indicating that the acute toxicity to large water fleas was relatively low. However, the LC50 value of PLA-P2, PLA-P3, and PLA-P10 was 0.00 mg/L. These values were considered to be model artifacts, not actual toxicity endpoints, because the close-to-zero LC50 value was physically unrealistic. Therefore, these predictions were classified as unavailable (NA) because they were located in T.E.S.T. beyond the scope of application of the model.
-
This study systematically analyzed the degradation behavior of two mainstream biodegradable mulch films (PBAT and PLA) under the photocatalytic influence of clay minerals and at different soil burial depths. The results showed that these two materials had different degradation pathways. PLA degradation was carried out through coordinated hydrolysis and photolysis, initially forming oligopolylactic acid and lactic acid monomers, accompanied by the formation of free radical-induced oxygen-containing functional groups, such as carboxylic acids, diketones, and anhydrides. In contrast, the degradation of PBAT was caused by the cracking of ester bonds, which produced chain and aromatic intermediates through Norrish type I and type II photooxidation reactions, and eventually produced carboxylic acid and olefin structural units. At the same time, BDM degradation led to the release of a variety of additives, including antioxidants, stabilizers, and plasticizers.
Different clay minerals showed obvious catalytic effects on BDM degradation. KL showed higher photocatalytic activity than MMT, which was due to its narrower band gap, stronger light absorption, and more efficient charge separation, which enhanced the generation of ROS. ESR results further revealed that KL produced higher levels of •OH and O2•− radicals, whereas MMT additionally generated 1O2 but with lower overall ROS yields. In particular, the high abundance of OH in KL played a leading role in accelerating the cracking of polymer chains. The depth of soil burial also had a significant impact on degradation, and the 10-cm sample showed more obvious aging than the sample on the soil surface. These trends were consistent with the CAI in the following order: PBAT 10 cm > PBAT 0 cm > PBAT-KL > PBAT-MMT > PBAT-W > PLA 10 cm > PLA 0 cm > PLA-KL > PLA-MMT > PLA-W. These findings supported our two hypotheses: (1) KL was more effective than MMT because it had superior photoelectrochemical properties; (2) a burial depth of 10 cm created a microenvironment that was more conducive to degradation than the soil surface.
In general, the light oxidation chain division induced by clay minerals (especially KL) promoted the formation of low molecular weight oxygen-containing products, which were more easily assimilated by soil microorganisms and might accelerate subsequent biodegradation. However, BDM degradation produced various transformation products under controlled laboratory conditions, which highlighted the importance of further assessing its environmental fate. The persistence, migration behavior, and bioavailability of these degradation products in natural agricultural soils were still unclear. Therefore, future environmental assessments should take into account soil types, mineral compositions, and agricultural management practices to better understand the long-term ecological impact of BDM application.
No acknowledgements are applicable for this work.
-
It accompanies this paper at: https://doi.org/10.48130/newcontam-0026-0024.
-
This study did not involve human participants, human data, or animal experiments. Therefore, ethical approval and informed consent were not required.
-
The authors confirm their contributions to the paper as follows: Cun Liang: conceptualization, methodology, writing – original draft; Wei Liu: material preparation, data collection, data analysis; Cheng Ji: data collection, data analysis, validation; Fang Feng: investigation, data analysis; Shutao Wang: investigation, visualization; Guiming Liu: methodology, validation; Zhen Liang: formal analysis, visualization; Yi Liang: data curation, validation; Shiming Su: supervision, resources; Bing Han: supervision, project administration; Huan Wang: conceptualization, supervision, writing – review & editing. All authors reviewed the results and approved the final version of the manuscript.
-
The datasets used or analyzed during the current study are available from the corresponding author upon reasonable request.
-
The authors declare that they have no known competing financial interests or personal relationships that could have appeared to influence the work reported in this paper.
-
Full list of author information is available at the end of the article.
- The supplementary files can be downloaded from here.
- Copyright: © 2026 by the author(s). Published by Maximum Academic Press, Fayetteville, GA. This article is an open access article distributed under Creative Commons Attribution License (CC BY 4.0), visit https://creativecommons.org/licenses/by/4.0/.
-
About this article
Cite this article
Liang C, Ji C, Feng F, Wang S, Liu G, et al. 2026. Enhanced degradation of biodegradable mulch films driven by interactions between clay minerals, UV light, and soil burial depth. New Contaminants 2: e027 doi: 10.48130/newcontam-0026-0024 

Enhanced degradation of biodegradable mulch films driven by interactions between clay minerals, UV light, and soil burial depth
- Received: 18 May 2026
- Revised: 24 August 2026
- Accepted: 20 September 2026
- Published online: 12 October 2026
Abstract: The widespread application of biodegradable mulch films (BDMs) in protected agriculture has raised concerns regarding their environmental degradation behavior under different soil mineral conditions. This study systematically investigated the degradation of two representative BDMs, poly(butylene adipate-co-terephthalate) (PBAT) and polylactic acid (PLA), under different clay mineral types and UV irradiation conditions, as well as in surface soil and buried (10 cm depth) environments. PBAT exhibited significantly faster degradation than PLA. The comprehensive aging index (CAI) of PBAT reached 24.02, which was about twice the PLA value (12.98). Electron spin resonance (ESR) analysis showed that clay minerals produced reactive oxygen species (ROS). Under ultraviolet irradiation, the level of •OH and O2•− produced by kaolin was higher than that of montmorillonite. Under ultraviolet conditions, kaolin showed enhanced light absorption, improved charge transfer ability, and narrower band gap characteristics, which promoted BDM photodegradation. Soil minerals, mainly SiO2 (66%) and Al2O3 (16%), also played an important role in accelerating polymer aging. In the soil environment, BDM buried at 10 cm showed more obvious degradation than BDM on the surface. Liquid chromatography-mass spectrometry (LC-MS) analysis showed that degradation mainly involved ester bond cleavage and free radical oxidation, resulting in oxygen-containing functional groups and low molecular weight products, such as oligomers, carboxylic acids, and alcohols. In addition, photodegradation promoted the release of additives, including antioxidants and stabilizers.