











-
Type 1 diabetes (T1D) is a chronic autoimmune condition in which the pancreas is unable to produce insulin due to the destruction of pancreatic β cells[1]. Children and adolescents living with T1D must continuously manage their blood glucose levels (BGLs) to avoid hyperglycemia (BGL > 180 mg/dL; > 10 mmol/L) and hypoglycemia (BGL < 70 mg/dL; < 3.9 mmol/L). Persistent hyperglycemia increases the risk of long-term complications such as cardiovascular disease and retinopathy, while hypoglycemia—often induced by exercise—may cause immediate dangers such as confusion, loss of consciousness, and even death. BGLs are influenced by different endogenous and exogenous factors, including physical activity (PA), carbohydrate (CHO) intake, insulin dosing, and stress. Predicting BGL fluctuations is therefore challenging, particularly in pediatric populations, where daily activities are often unplanned, and additional factors such as growth hormone and pubertal development further affect BGL variability.
Accurate BGL prediction is therefore a key clinical goal: anticipating glucose fluctuations ahead of time could allow children and caregivers to take preventive action, such as adjusting insulin doses, planning CHO intake, or modifying activity, before a dangerous episode occurs. Modern diabetes technologies, including continuous glucose monitoring (CGM) sensors, insulin pumps, automated insulin delivery (AID) systems, and wearable activity trackers, now generate large volumes of data. As a result, many recent studies have focused on developing machine learning and deep learning models for BGL prediction, though most published work has focused on adults, largely due to greater data availability. Studies in pediatric populations remain scarce, and even fewer have examined children and adolescents engaging in PA under free-living conditions.
In this paper, we use data from the Type 1 Diabetes EXercice Initiative (T1DEXI) and its pediatric extension (T1DEXI-P) to evaluate the accuracy and clinical safety of deep learning models for BGL prediction in children and adolescents with T1D. T1DEXI is a large multicenter study collecting real-world data—including CGM readings, PA, insulin doses, and CHO intake—from adults with T1D over 4 weeks. T1DEXI-P extends this protocol to children and adolescents, with data collected over a 10-d period. It includes participants treated with open-loop or closed-loop insulin pumps, as well as multiple daily injections (MDI). Because the availability of pediatric datasets poses a major challenge for developing reliable predictive models, we also investigate whether incorporating adult T1D data can help overcome this data scarcity and improve both the accuracy and clinical safety of BGL predictions in pediatric populations. The primary evaluation focuses on pediatric insulin pump users. An additional evaluation on MDI-treated patients was also performed to assess the generalizability of the proposed transfer learning approach to a different insulin delivery modality.
-
Two T1D populations were used to train the deep learning models: adults from the T1DEXI study and children and adolescents from the T1DEXI-P study.
T1DEXI-P is an observational study of physical activity in youth with T1D, including 251 participants aged 12–17 years, with data collected over 10 d. All participants wore a Dexcom G6 CGM sensor during the study. In addition, participants provided information on their age, health status, daily habits, diabetes self-management, and physical activity. Data collected included CGM readings, insulin doses, CHO intake, heart rate, step count, and PA. Heart rate, step count, and PA were collected using a wrist-worn Garmin device synchronized with the Garmin Connect application. Exercise-related information, including duration and subjective intensity, was also reported through the BANT smartphone application. Meal and snack data were captured through photographs taken before and after consumption, with CHO content entered in the app, while insulin data were obtained from personal insulin pump records for pump users. All entries were time-stamped. Detailed information on the recruitment sites and study procedures is provided in[2].
The proposed deep learning models were trained and primarily evaluated using participants treated with insulin pumps (open-loop or closed-loop), ensuring access to complete and automatically recorded insulin data, including basal delivery, bolus doses, and carbohydrate entries when reported by the user. An additional inclusion criterion was that participants had to report at least one PA event during the study period. Among the 87 participants who met these inclusion criteria, 3 participants were excluded because the amount of available CGM data differed substantially from the intended 10-d study duration, with either considerably longer or considerably shorter recording periods. Consequently, only 84 participants (58 males and 26 females) with approximately 10 d of data, as specified in the study protocol, were retained. Among them, 60 reported using a closed-loop insulin pump, 23 reported using an open-loop pump, and 1 participant reported using both open- and closed-loop modes. Table 1 first summarizes the demographic and clinical characteristics of the entire pediatric cohort (84 participants) and then presents these characteristics separately for the open-loop and closed-loop subgroups, excluding the participant who reported using both modes.
Table 1. Characteristics of the pediatric and adult populations used for model training.
Feature Min Q1 Mean Median Q3 Max Pediatric population
(n = 84)All selected pediatric patients
(n = 84)Time in range (TIR) (%) 31.71 60.04 70.69 72.99 80.45 94.91 Time below range (TBR) (%) 0.00 0.96 2.45 2.21 3.51 10.06 Time above range (TAR) (%) 0.72 17.13 26.86 24.41 39.24 67.62 Coefficient of variation (CV) (%) 22.50 31.07 35.24 34.62 39.24 49.51 Age (years) 12.00 12.75 13.75 14.00 15.00 17.00 Total PA duration (min) 107.97 523.64 844.07 801.78 1,152.65 1,765.00 Years since T1D diagnosis 1.00 7.00 9.05 10.00 12.00 16.00 HbA1c (%) 5.30 6.20 6.98 6.90 7.30 10.50 Weight (kg) 31.75 47.63 57.29 55.11 65.43 99.79 Height (m) 1.37 1.57 1.65 1.65 1.70 1.98 Body Mass Index (kg/m2) 13.67 18.68 20.89 19.83 22.64 32.49 Closed-loop pediatric subgroup
(n = 60)Time in range (TIR) (%) 50.02 63.29 72.09 73.17 79.65 93.42 Time below range (TBR) (%) 0.00 0.86 2.35 2.18 3.34 7.68 Time above range (TAR) (%) 3.96 18.17 25.56 23.37 33.03 47.39 Coefficient of variation (CV) (%) 22.50 30.82 35.15 34.79 39.19 48.71 Age (years) 12.00 13.00 13.95 14.00 15.00 17.00 Total PA duration (min) 107.97 569.66 848.80 808.13 1,179.35 1,765.00 Years since T1D diagnosis 1.00 6.75 8.78 10.00 12.00 15.00 HbA1c (%) 5.30 6.30 6.92 6.90 7.20 10.40 Weight (kg) 31.75 47.97 57.90 55.57 68.04 99.79 Height (m) 1.37 1.59 1.66 1.65 1.73 1.98 Body Mass Index (kg/m2) 13.67 18.68 20.85 19.80 22.40 32.49 Open-loop pediatric subgroup
(n = 23)Time in range (TIR) (%) 31.71 47.27 66.90 65.03 84.50 94.91 Time below range (TBR) (%) 0.21 1.26 2.78 2.42 3.90 10.06 Time above range (TAR) (%) 0.72 9.93 30.32 33.60 49.77 67.62 Coefficient of variation (CV) (%) 22.55 31.96 35.53 34.65 40.10 49.51 Age (years) 12.00 12.00 13.26 13.00 14.00 17.00 Total PA duration (min) 192.90 478.37 843.65 787.97 1,142.50 1,717.50 Years since T1D diagnosis 3.00 9.00 9.96 10.00 11.50 16.00 HbA1c (%) 5.40 6.05 7.11 6.80 8.10 10.50 Weight (kg) 36.29 47.40 55.14 51.71 62.14 83.46 Height (m) 1.40 1.55 1.62 1.63 1.70 1.88 Body Mass Index (kg/m2) 16.60 18.84 20.83 20.36 23.40 26.16 Adult population
(n = 380)Time in range (TIR) (%) 7.55 69.00 74.72 78.01 85.11 99.05 Time below range (TBR) (%) 0.00 1.11 3.11 2.17 4.00 17.41 Time above range (TAR) (%) 0.06 11.04 22.17 19.13 28.49 92.45 Coefficient of variation (CV) (%) 16.53 29.19 33.15 32.90 36.65 50.36 Age (years) 18.00 25.00 36.63 33.00 46.00 70.00 Total PA duration (min) 85.00 726.00 1,220.31 1,026.50 1,430.25 6,329.00 Years since T1D diagnosis 1.00 11.00 18.28 16.00 23.00 66.00 HbA1c (%) 4.80 6.10 6.61 6.50 7.10 9.40 Weight (kg) 46.72 63.50 73.18 70.76 81.19 127.01 Height (m) 1.47 1.63 1.69 1.68 1.75 1.96 Body Mass Index (kg/m2) 18.25 22.80 25.43 24.73 27.16 41.66 TIR: 70–180 mg/dL (3.9–10.0 mmol/L); TBR: < 70 mg/dL (< 3.9 mmol/L); TAR: > 180 mg/dL (> 10.0 mmol/L); CV: 100 × SD/mean glucose. Values summarize participants over their respective observation windows. The closed- and open-loop subgroups exclude one participant who reported using both modes. Bold text is used to distinguish the different cohorts and improve redability. T1DEXI is an observational study of at-home exercise in adults with T1D. Participants wore a Dexcom G6 CGM sensor and used either insulin pumps or multiple daily injections. The primary objective was to collect detailed information on both structured and free-living exercise sessions. Participants completed at least six structured exercise sessions over 4 weeks and provided sociodemographic, clinical, diabetes-management, and PA information. The full details on recruitment sites and procedures are provided in[2].
Only adult participants using insulin pumps were considered for model pre-training. This ensured consistency between the adult pre-training cohort and the primary pediatric study cohort, allowing us to leverage adult pump-based data during transfer learning for blood glucose prediction in pediatric patients. A total of 380 adult participants met this criterion (97 males and 283 females). Their characteristics are summarized in Table 1.
Data pre-processing and model inputs
-
The goal of this step is to integrate multiple data sources—CGM, heart rate, PA, CHO intake, insulin doses, and step count—and align them temporally with the CGM 5-min timeline. We then perform feature engineering to extract relevant information and improve the predictive performance of the proposed model.
Data pre-processing
-
The T1DEXI-P dataset (the pediatric population) shows several differences in data structure and completeness compared to the T1DEXI dataset (the adult population). To synchronize all available data with the CGM time axis, we adapted and applied the pre-processing pipeline initially developed for the T1DEXI dataset by Neumann et al.[3].
Dexcom G6 sensors typically record CGM values every 5 min. However, signal interruptions may occur in free-living conditions, resulting in missing CGM data for certain timestamps. In this study, we only considered the actual observed values as captured by the CGM sensor and did not apply any imputation procedure (e.g., interpolation). This choice is motivated by the fact that imputing missing values can produce estimates that deviate substantially from the true BGL values, particularly during rapid drops induced by PA. This risk becomes even greater when missing CGM measurements span long consecutive periods.
In the T1DEXI-P dataset, PA was recorded using two sources: a mobile application and a Garmin watch. We observed some inconsistencies between the two sources: for some timestamps, PA information was available from only one source, while for others, both sources reported a PA event but with non-overlapping start and end times. When both sources reported a PA with overlapping time windows, we prioritized the mobile application data; when only one source reported an event, that source was used. We also observed that some PA attributes available in the adult dataset (intensity and competitiveness) were missing when the data came from the mobile application and could not be reliably inferred, as they depend on the patient and the type of activity. We therefore retained only PA duration. Step counts were summed over each 5-min interval.
Heart rate data were recorded every 15 s by the Garmin watch and resampled into 5-min intervals. To limit information loss during resampling, three statistical measures were computed for each interval: the mean, the standard deviation, and the skewness.
CHO intake was reported by participants through photographs of their meals or snacks, which were analyzed by an AI algorithm to estimate the corresponding CHO amount. Timestamps with no reported CHO intake were assigned a value of zero.
The datasets considered for training include only patients using insulin pumps. We distinguish between basal insulin (delivered continuously at a specified rate) and bolus insulin (administered in response to CHO intake or to treat hyperglycemia). Three insulin features were included: basal insulin, meal boluses (administered in response to CHO intake), and correction boluses (administered to manage hyperglycemia).
In T1DEXI-P, basal insulin totals were reported over intervals that did not align with CGM timestamps; we therefore computed the basal injection rate per second and aggregated it over each 5-min CGM interval. For bolus insulin, exact administration times were available; when no bolus occurred within a 5-min interval, the value was set to zero, and when one or more boluses occurred within a 5-min interval, their total dose was assigned to the corresponding CGM timestamp.
Additional model inputs
-
In addition to the pre-processed data streams described above, several derived variables were computed to help capture clinically relevant patterns, following Neumann et al.[3]:
• Time-based features: hour of the day, day of the week, and a binary weekend indicator.
• CGM rate of change: rate of change in CGM values for the preceding 5 and 10 min.
• Time in hypoglycemia: elapsed time since the onset of the current hypoglycemic episode (BGL < 70 mg/dL, < 3.9 mmol/L); set to zero if no hypoglycemia was observed at timestamp t.
• CGM category: CGM values were categorized into five clinically meaningful glucose ranges:
▲ < 70 mg/dL (< 3.9 mmol/L)
▲ [70, 85) mg/dL ([3.9, 4.7) mmol/L)
▲ [85, 155) mg/dL ([4.7, 8.6) mmol/L)
▲ [155, 180) mg/dL ([8.6, 10.0) mmol/L)
▲ ≥ 180 mg/dL (≥ 10.0 mmol/L)
• CGM peak/hollow indicator: binary variable indicating whether a local peak or trough in CGM values occurred at the previous timestamp (t − 1).
• CGM relative standard deviation (RSD): computed over the preceding 30 min.
Predictive model development
-
Three models were developed, one for each prediction horizon (10, 20, and 30 min). Each model takes as input a 2-h window of patient data (24 consecutive 5-min readings) and outputs a single predicted BGL at the target horizon. The model architecture builds on the best-performing approach identified by Neumann et al.[3] and incorporates additional layers and a connection that allows the model to combine raw input signals with learned patterns, improving its ability to capture complex glycemic dynamics (Supplementary File 1: Fig. S1).
Because deep learning models require large amounts of training data, relying solely on the limited data available per pediatric patient (at most 10 d, with missing values) led to poor predictive performance. To address this, we designed two training strategies based on transfer learning, an approach where a model first learns general patterns from a large dataset before being adapted to a more specific or smaller one. The first strategy, pediatric transfer learning, uses only data from the pediatric cohort. The second strategy, referred to as adult-pediatric transfer learning, first trains the model on the adult cohort, then adapts it to the pediatric population.
Pediatric transfer learning
-
The model is first pre-trained on all pediatric patients except the target patient, using the first 80% of each patient's data (in chronological order) for training and the remaining 20% for validation. This 80%/20% split was chosen to maximize the amount of pediatric data available for training, since only 10 d of observations were available per patient. The model is then fine-tuned on the target patient, using the first 70% of their data for training, the next 10% for validation, and the final 20% for testing.
Adult-pediatric transfer learning
-
The model is first pre-trained on the adult cohort, using the first 75% of each patient's data for training and the remaining 25% for validation. Because the adult cohort contained substantially more data (4 weeks per participant), a 75%/25% split provided sufficient data for model pre-training. The resulting model is then pre-trained on the pediatric cohort and fine-tuned on the target patient following the same procedure as above. Figure 1 illustrates the three stages of this strategy. The pediatric transfer learning strategy corresponds to the same pipeline but omits stage 1.
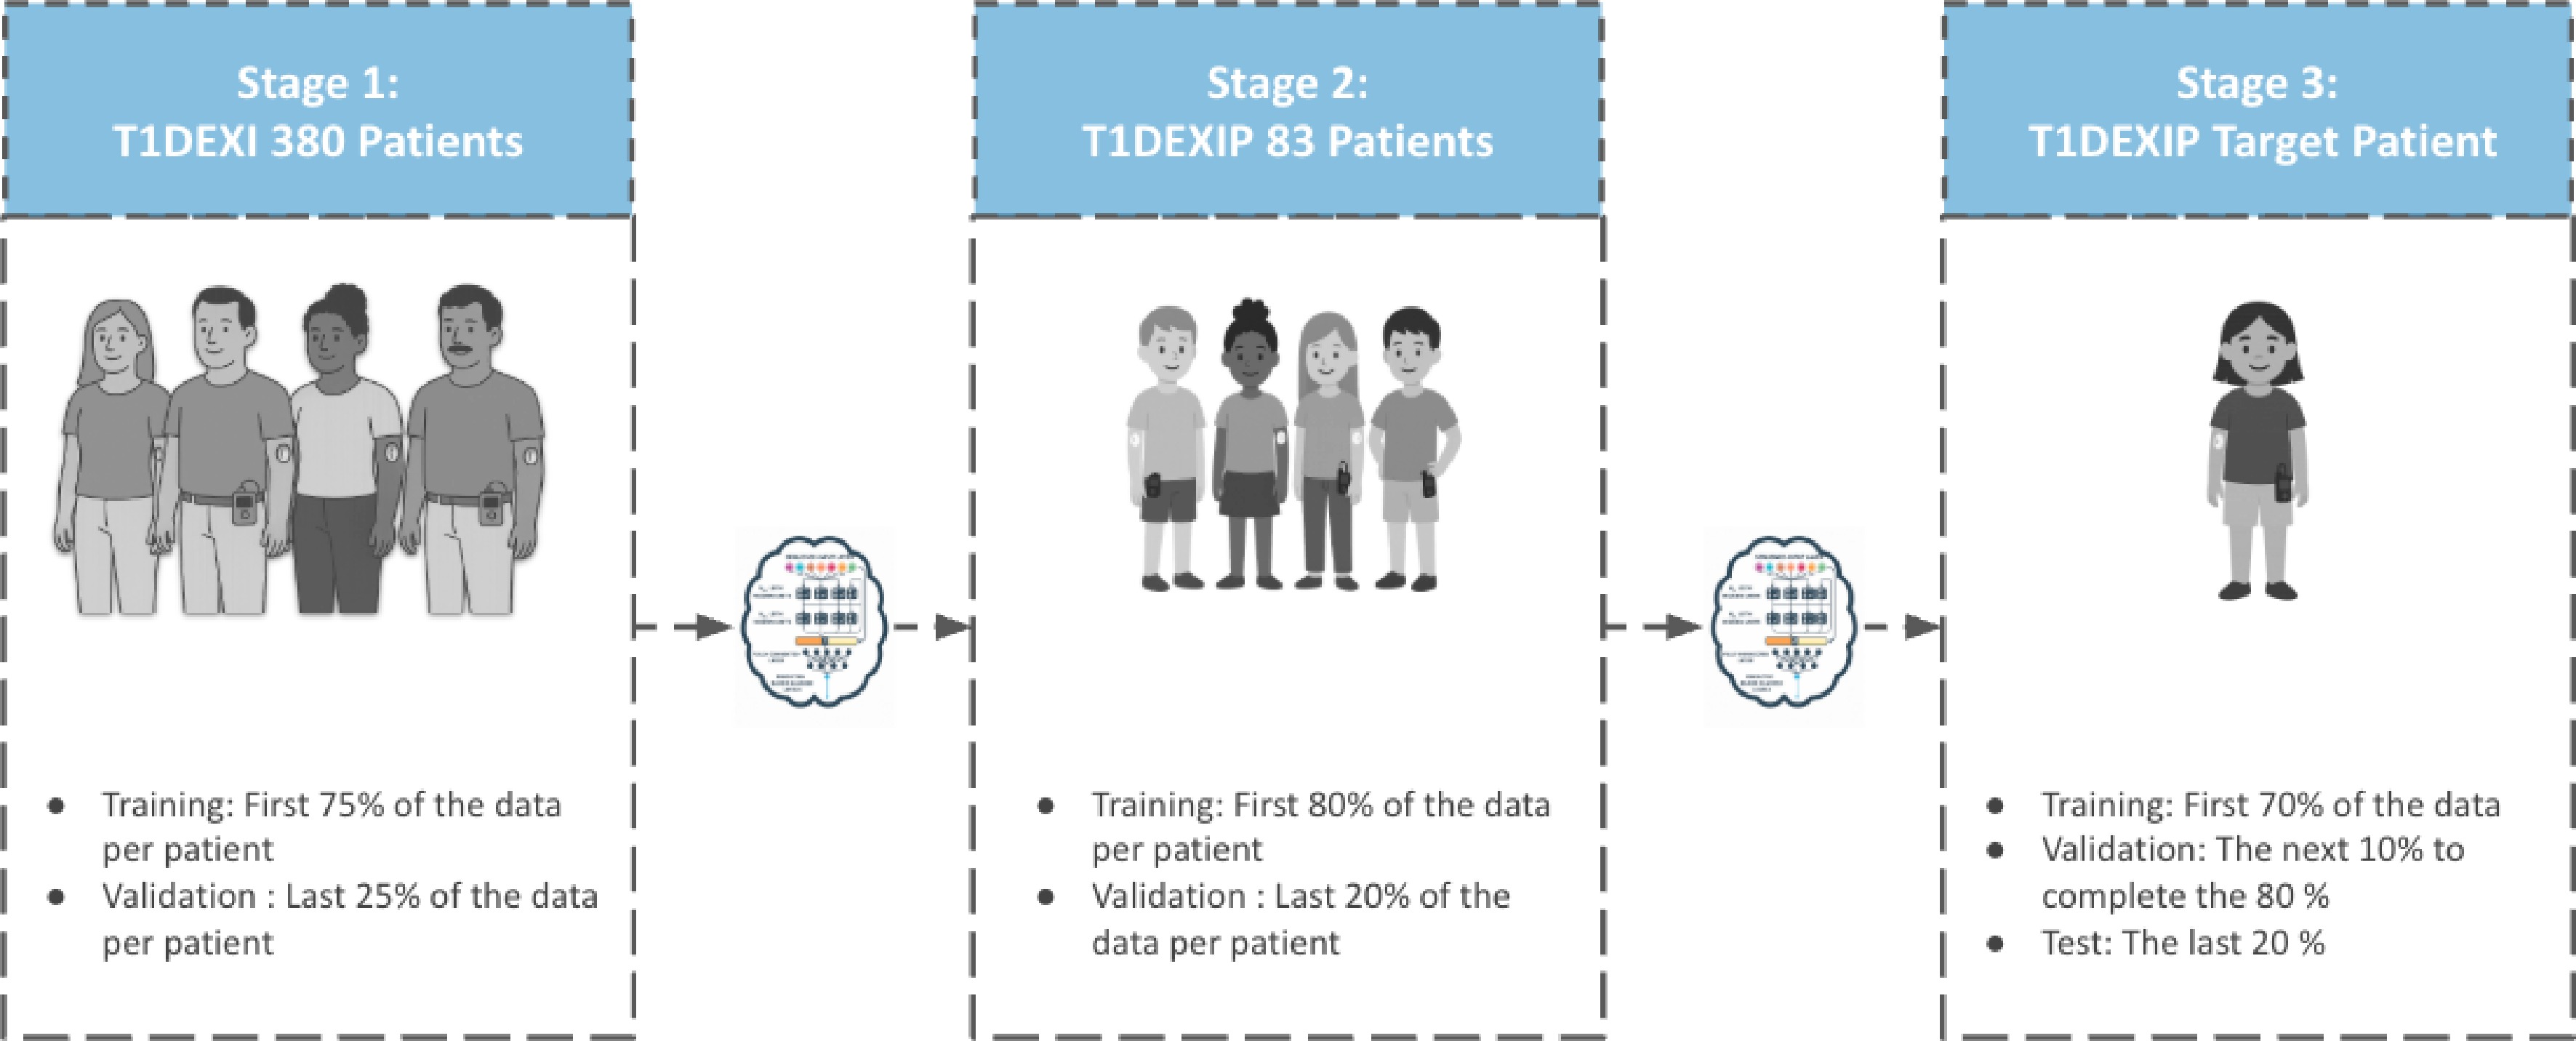
Figure 1.
Adult-pediatric transfer learning strategy.
Model training was performed on the high-performance computing infrastructure of the Digital Research Alliance of Canada, using Nvidia A100 GPUs.
Performance metrics
-
For each of the pediatric patients, we computed the RMSE (Eq. [1]) and the percentage of predictions falling in each Clarke Error Grid (CEG) zone (Eq. [2]) using only that patient's test set. This yields one RMSE value and one set of CEG zone percentages per patient. Summary statistics reported in Table 2 were then computed across patients. In the CEG, zones A and B correspond to clinically acceptable predictions; zone C may lead to unnecessary treatment decisions; zones Hypo D and Hyper D are considered potentially unsafe, as they reflect missed hypoglycemia or hyperglycemia events, with the model instead predicting a value within the target range; and zones Hypo E and Hyper E represent the most critical errors, where hypoglycemia is predicted as hyperglycemia (zone Hypo E) or hyperglycemia as hypoglycemia (zone Hyper E).
Table 2. Summary of prediction performance of the adult–pediatric transfer learning strategy for open- and closed-loop insulin pump users at 10-, 20-, and 30-min prediction horizons.
Stat RMSE Zone A (%) Zone B (%) Zone C (%) Zone D (%) Hypo D (%) Hyper D (%) Closed-loop subgroup
(n = 60)Prediction horizon: 10 min Min 4.69 95.03 0.00 0.00 0.00 0.00 0.00 Q1 6.44 97.69 0.18 0.00 0.00 0.00 0.00 Median 7.97 99.08 0.72 0.00 0.18 0.18 0.00 Mean 8.51 98.59 1.09 0.00 0.32 0.32 0.00 Q3 10.04 99.64 1.50 0.00 0.49 0.49 0.00 Max 18.65 100.00 4.74 0.00 1.81 1.81 0.21 Prediction horizon: 20 min Min 8.49 83.72 0.00 0.00 0.00 0.00 0.00 Q1 11.65 91.93 2.18 0.00 0.00 0.00 0.00 Median 13.88 94.18 4.37 0.00 0.75 0.75 0.00 Mean 14.33 94.18 4.74 0.00 1.08 1.04 0.04 Q3 16.51 97.74 6.24 0.00 1.84 1.80 0.00 Max 25.32 100.00 14.38 0.00 4.36 4.36 0.93 Prediction horizon: 30 min Min 12.41 70.07 2.50 0.00 0.00 0.00 0.00 Q1 16.43 84.12 6.77 0.00 0.59 0.32 0.00 Median 18.95 87.87 10.07 0.00 1.45 1.45 0.00 Mean 20.09 87.49 10.36 0.02 2.13 1.98 0.14 Q3 23.11 92.53 13.00 0.00 3.00 2.62 0.00 Max 35.66 97.50 25.38 0.43 9.80 9.80 1.52 Open-loop subgroup
(n = 23)Prediction horizon:
10 minMin 3.37 96.50 0.00 0.00 0.00 0.00 0.00 Q1 5.48 99.08 0.00 0.00 0.00 0.00 0.00 Median 6.01 99.00 0.18 0.00 0.00 0.00 0.00 Mean 6.71 99.20 0.55 0.00 0.25 0.25 0.00 Q3 8.35 100.00 0.54 0.00 0.40 0.40 0.00 Max 11.06 100.00 2.55 0.00 1.19 1.19 0.00 Prediction horizon: 20 min Min 7.17 89.18 0.25 0.00 0.00 0.00 0.00 Q1 10.51 93.12 1.76 0.00 0.34 0.34 0.00 Median 12.15 96.01 3.33 0.00 0.98 0.98 0.00 Mean 12.85 95.20 3.69 0.00 1.11 1.09 0.02 Q3 15.41 97.83 4.91 0.00 1.97 1.85 0.00 Max 19.49 99.25 8.64 0.00 3.09 3.09 0.25 Prediction horizon: 30 min Min 10.64 80.05 3.41 0.00 0.00 0.00 0.00 Q1 14.87 85.08 6.15 0.00 0.64 0.64 0.00 Median 18.00 89.78 8.42 0.00 2.31 1.79 0.00 Mean 18.23 88.92 9.05 0.00 2.03 1.95 0.07 Q3 22.51 92.94 11.80 0.00 3.04 3.04 0.00 Max 24.88 96.59 15.78 0.00 6.65 6.65 0.77 RMSE: root mean squared error. Zones A–D and Hypo/Hyper D are Clarke Error Grid (CEG) zone percentages. Hypo D: model predicts target range while patient is in hypoglycemia; Hyper D: model predicts target range while patient is in hyperglycemia. Values summarize the distribution across patients (Min, Q1, Median, Mean, Q3, Max) for each prediction horizon. One patient (# 292) reported using both open- and closed-loop insulin pumps. The participant was excluded from the open- and closed-loop subgroup summary statistics but remained included in the overall analyses. Detailed patient-level results are provided in Supplementary File 2. Bold text is used to distinguish the different cohorts and improve readability. $ RMSE\left(patient\; i\right)=\sqrt{\frac{1}{T_i}\sum\nolimits_{t=1}^{T_i}\left(\hat{y}_{it}-y_{i,t}\right)^2}, $ (1) where, RMSE (patient i): RMSE of patient i; Tᵢ: total number of observations in the test set of patient i; ŷi,t: predicted BGL value for patient i at timestamp t; yi,t: observed BGL value for patient i at timestamp t.
$ \begin{gathered} {\text{PZ}}\left({\mathrm{patient}}\;{\mathrm{i}}\right)=\frac{\mathrm{N}{\mathrm{B}}_{\text{it}}\left(\mathrm{Z}\right)}{{\mathrm{T}}_{\mathrm{i}}}\times 100,\\ \mathrm{Z}\in \{\mathrm{A},\mathrm{B},\mathrm{C},{\text{Hypo}}\;\mathrm{D},{\text{Hyper}}\;\mathrm{D},\mathrm{Hypo}\;\mathrm{E},\;\mathrm{Hyper}\;\mathrm{E}\} \end{gathered}$ (2) where, PZ (patient i): percentage of predictions for patient i falling in CEG zone Z; NBit (Z): total number of predictions for patient i falling in zone Z.
-
The adult–pediatric transfer learning strategy outperformed the pediatric-only strategy. The following sections present the results obtained with the best-performing strategy for the primary pediatric insulin pump cohort (84 patients) across three prediction horizons (10, 20, and 30 min). Although the primary focus of this study is pediatric insulin pump users, an additional evaluation on pediatric patients treated with MDI is also presented to evaluate whether the proposed transfer learning approach can be extended to a different insulin treatment modality. Prediction accuracy was assessed using RMSE, and clinical safety using the CEG zone distribution. Since no predictions fell within the unsafe zone E for the pediatric insulin pump cohort, only zones A, B, C, and D are reported. Zone D is further divided into Hypo D (model predicts target range while patient is hypoglycemic) and Hyper D (model predicts target range while patient is hyperglycemic).
Overall predictive performance
-
As shown in Table 2, predictions remained accurate and clinically safe for both open- and closed-loop insulin pump users across the three prediction horizons. No predictions fell within the unsafe zone E for either subgroup.
At 10 min, prediction performance was excellent in both subgroups, with RMSE remaining below 10 mg/dL (0.56 mmol/L) for 75% of patients, and at least 95% of predictions falling in the safe zone A for all patients. Clinically dangerous errors in zone D were extremely rare.
At 20 min, prediction accuracy remained high in both subgroups, with mean RMSE values not exceeding 14.33 mg/dL (0.8 mmol/L) and at least 83.7% of predictions in zone A. Undetected hypoglycemia events (zone Hypo D) were infrequent, averaging 1.09%, while undetected hyperglycemia (zone Hyper D) was absent for 75% of patients in both subgroups.
At 30 min, accuracy decreased slightly, but predictions remained clinically safe for most patients in both subgroups. Mean RMSE values did not exceed 20.09 mg/dL (1.11 mmol/L), and RMSE remained below 23.11 mg/dL (1.28 mmol/L) for 75% of patients. Undetected hypoglycemia (zone Hypo D) remained infrequent, averaging 1.98% and 1.09% for the closed- and open-loop subgroups, respectively.
Additional analyses stratified by sex, CGM coefficient of variation (CV), and time in range (TIR) are reported in Supplementary File 2: Tables S1–S3. Prediction accuracy and clinical safety were very similar for male and female participants across all three prediction horizons. Lower glycemic variability (CV ≤ 36%) and better glycemic control (TIR ≥ 70%) were associated with lower RMSE values. In addition, lower glycemic variability was also associated with slightly lower mean percentages of predictions falling within CEG zone D. Detailed results for the latter are provided in the Supplementary File 3.
Prediction quality in challenging patients
-
Although predictions were accurate and safe for most patients, a subset exhibited relatively high RMSE or elevated zone D errors (see maximum values in Table 2). We examined whether high RMSE values corresponded to clinically dangerous errors or to deviations within the target range, and whether elevated zone D percentages were associated with small or large prediction errors.
Challenging patients were defined using horizon-specific thresholds, reflecting the greater clinical urgency of short-horizon errors: RMSE > 10 mg/dL (0.55 mmol/L) or zone D > 1% at 10 min; RMSE > 20 mg/dL (1.11 mmol/L) or zone D > 3% at 20 min; RMSE > 27 mg/dL (1.5 mmol/L) or zone D > 4% at 30 min. Table 3 lists the challenging patients for 10-, 20-, and 30-min prediction horizons, respectively.
Table 3. Detailed results for challenging patients at 10-, 20-, and 30-min prediction horizons with the adult–pediatric transfer learning strategy.
Patient ID Pump Overall RMSE (mg/dL) (%) Zone Hypo D number RMSE (%) Zone Hyper D number RMSE Prediction horizon: 10 min 150 C 18.65 0.00 0 0.00 0.21 1 118.63 324 C 14.42 0.23 1 30.79 0.00 0 0.00 492 C 14.41 0.21 1 37.79 0.00 0 0.00 44 C 13.39 0.74 4 29.17 0.00 0 0.00 83 C 12.34 0.00 0 0.00 0.00 0 0.00 165 C 11.41 1.03 5 22.21 0.00 0 0.00 535 C 11.25 1.66 8 21.42 0.00 0 0.00 540 O 11.06 0.97 5 19.94 0.00 0 0.00 393 C 10.84 1.30 7 32.96 0.00 0 0.00 254 O 10.83 1.19 5 23.23 0.00 0 0.00 392 C 9.79 1.09 5 32.73 0.00 0 0.00 498 C 9.54 1.81 10 20.80 0.00 0 0.00 242 C 8.42 1.24 7 17.63 0.00 0 0.00 226 C 7.92 1.13 6 20.80 0.00 0 0.00 Prediction horizon: 20 min 150 C 25.32 0.21 1 13.96 0.21 1 132.36 44 C 22.28 1.90 10 26.55 0.19 1 81.91 492 C 21.32 1.90 9 36.44 0.00 0 0.00 389 C 21.08 0.18 1 19.25 0.36 2 75.52 324 C 21.08 1.17 5 26.13 0.93 4 78.83 114 C 20.83 2.61 10 21.90 0.00 0 0.00 404 C 20.21 1.08 6 21.95 0.00 0 0.00 357 C 18.36 4.33 22 23.37 0.00 0 0.00 393 C 17.46 4.36 23 37.55 0.00 0 0.00 290 O 15.39 3.09 12 21.01 0.00 0 0.00 498 C 14.39 3.66 20 27.42 0.00 0 0.00 Prediction horizon: 30 min 150 C 35.66 1.06 2 15.19 0.43 3 118.69 44 C 33.47 3.11 10 35.67 1.17 6 115.04 492 C 31.62 4.12 12 60.08 1.52 7 91.04 114 C 30.67 3.38 17 33.23 0.19 1 112.89 404 C 30.32 2.34 9 25.70 0.72 4 97.26 242 C 26.38 7.69 40 62.20 0.54 3 69.26 357 C 25.90 7.54 38 36.83 0.00 0 0.00 393 C 23.09 6.60 33 40.51 0.19 1 73.19 498 C 23.09 9.80 53 31.89 0.00 0 0.00 290 O 19.64 6.65 25 22.69 0.00 0 0.00 501 C 18.38 7.67 44 27.12 0.00 0 0.00 Pump: O = open-loop insulin pump user, C = closed-loop insulin pump user. RMSE: root mean squared error (mg/dL). Hypo D: model predicts target range while patient is in hypoglycemia; Hyper D: model predicts target range while patient is in hyperglycemia. (%) is the percentage of predictions in that category for the patient; 'Number' is the corresponding count of predictions; the RMSE columns are computed over the predictions within that category (0.00 if none). Bold text is used to distinguish the different cohorts and improve redability. At 10 min, 14 patients (16.7%) met these criteria. Most exhibited either elevated RMSE values with very few clinically unsafe predictions or a slightly larger number of Hypo D events associated with relatively small prediction errors. Hyper D events were almost absent, occurring in only one patient.
At 20 min, 11 patients were identified as challenging, 6 of whom had already been identified at 10 min, suggesting patient-specific factors contributing to prediction difficulty. Delayed hypoglycemia detection (Hypo D) remained the predominant source of clinically unsafe predictions, whereas Hyper D events remained rare.
At 30 min, 11 patients were again identified as challenging, 9 of whom were also challenging at 20 min. Both the number and magnitude of Hypo D errors increased with prediction horizon, whereas Hyper D events remained infrequent. Importantly, patients with the highest RMSE were not necessarily those with the largest proportions of clinically unsafe predictions.
Overall, the model predicted hyperglycemia reliably across all horizons. Unsafe predictions occurred predominantly as delayed hypoglycemia detection. For many patients, these errors remained isolated, suggesting that the model quickly readjusted, whereas only a small subset—primarily at the 30-min horizon—exhibited both frequent and large hypoglycemia prediction errors.
Detailed analysis of challenging patients
-
Detailed analysis was restricted to the four most challenging patients (#242, #393, #357, and #498), each exhibiting more than 30 undetected hypoglycemia events (Hypo D) with an RMSE exceeding 30 mg/dL (1.67 mmol/L) at the 30-min prediction horizon. For each patient, observed and predicted BGL curves are displayed alongside contextual data. Five glycemic zones are indicated by horizontal dashed lines: level 2 hypoglycemia (BGL < 50 mg/dL, < 2.78 mmol/L), level 1 hypoglycemia (BGL 50−70 mg/dL, 2.78−3.9 mmol/L), target range (BGL 70−180 mg/dL, 3.9−10 mmol/L), level 1 hyperglycemia (BGL 180−250 mg/dL, 10−13.89 mmol/L), and level 2 hyperglycemia (BGL > 250 mg/dL, > 13.89 mmol/L). PA periods are shown as horizontal green bands proportional in width to duration. The figures also include annotations for meal bolus, correction bolus, and basal insulin injections (rescaled by a factor of 4 for readability), as well as CHO intakes when available (rescaled by a factor of 1.5). The heart rate curve is shown when data are available. Time windows where predictions fell in zone Hypo D or zone Hyper D are highlighted in blue and pink, respectively. Curves for patients #393, #357, and #498 are provided in the Supplementary File 4; patient #242 is analyzed in detail below (Figs 2−4).
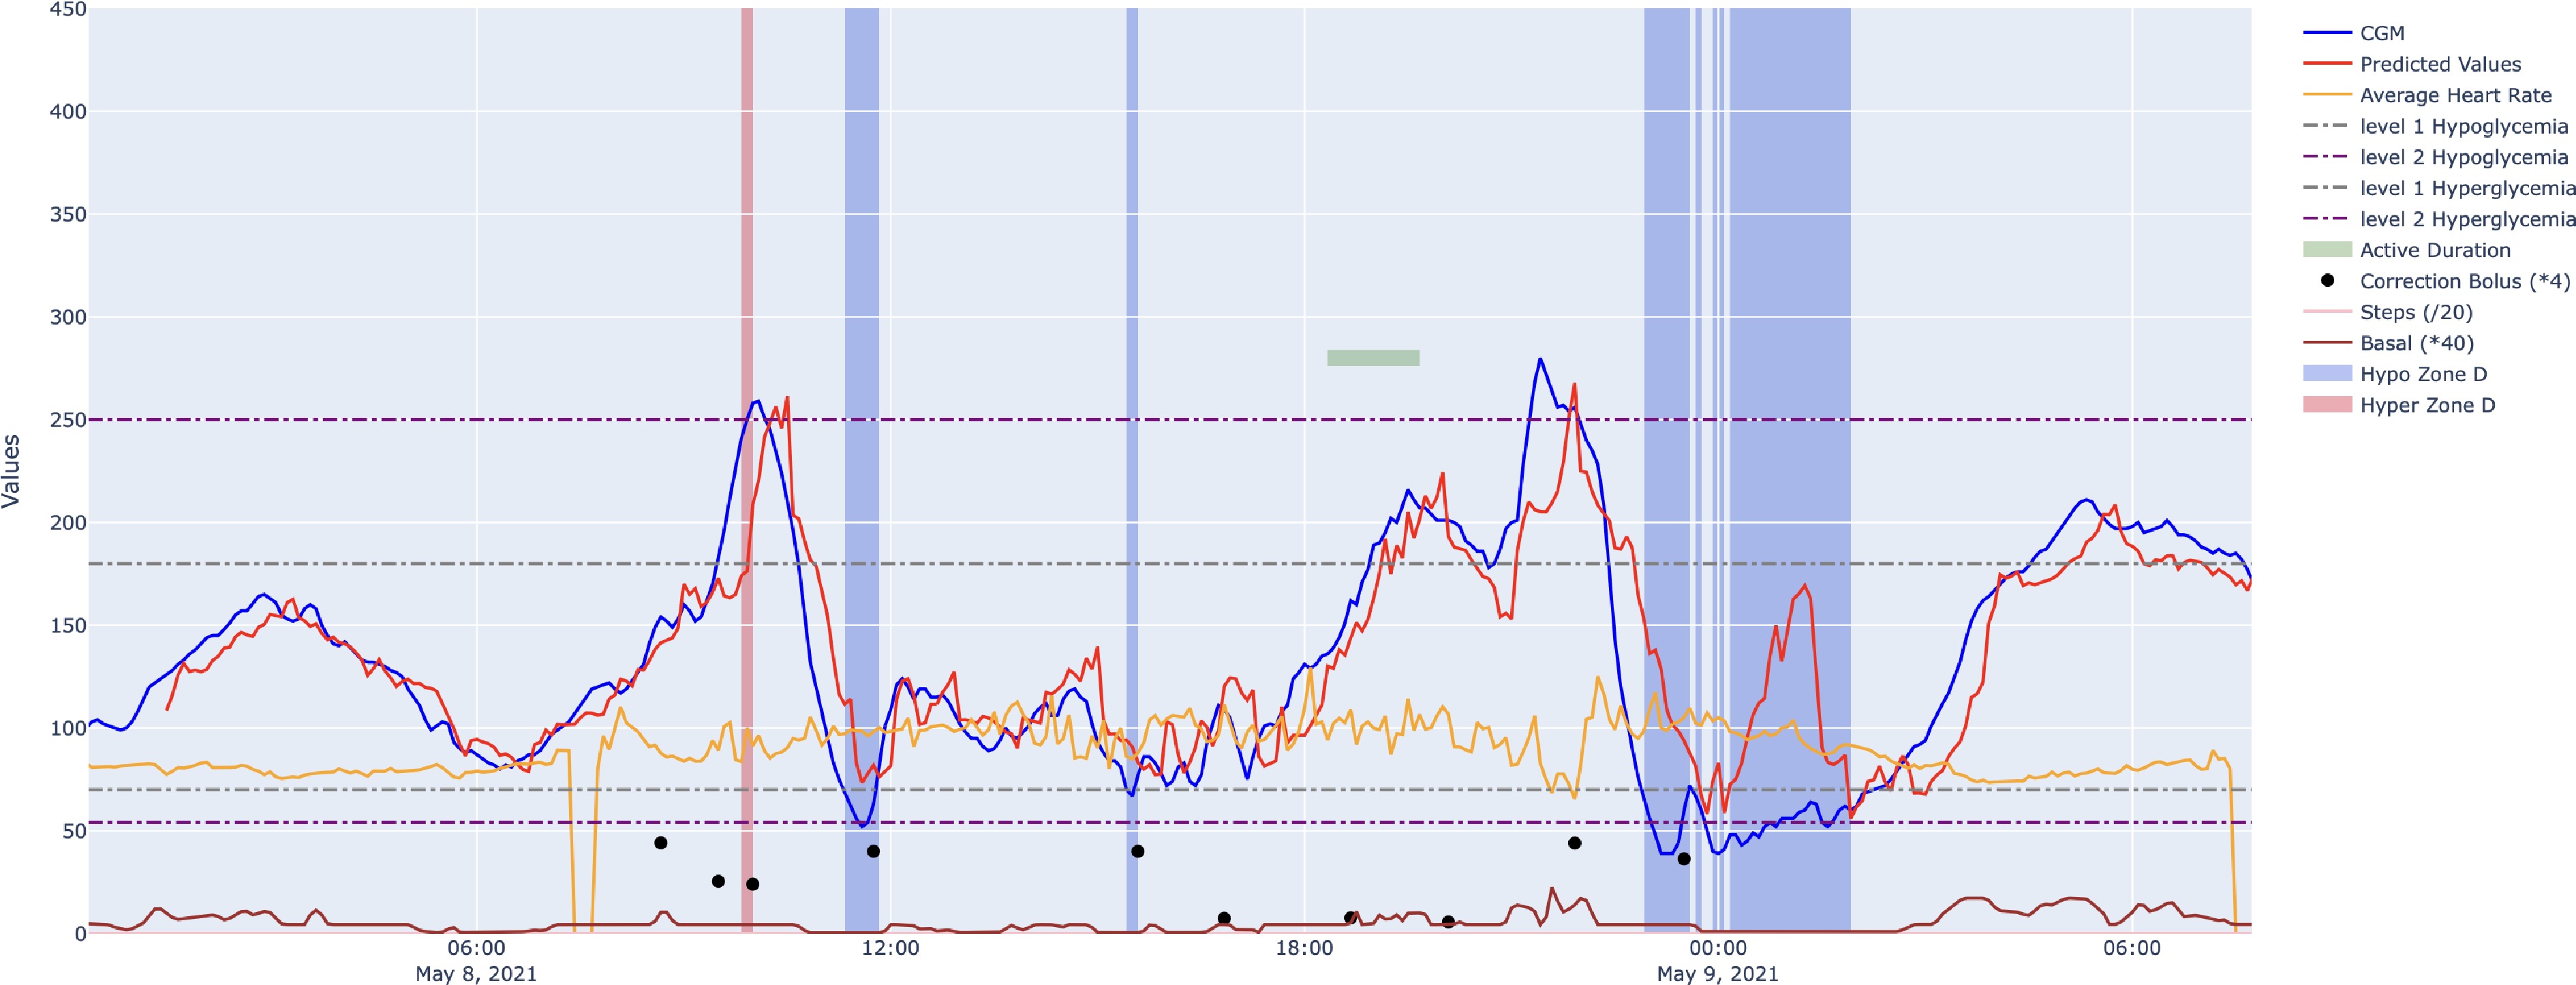
Figure 2.
Predicted vs observed CGM values for patient #242 on the first test day for a 30-min prediction horizon.
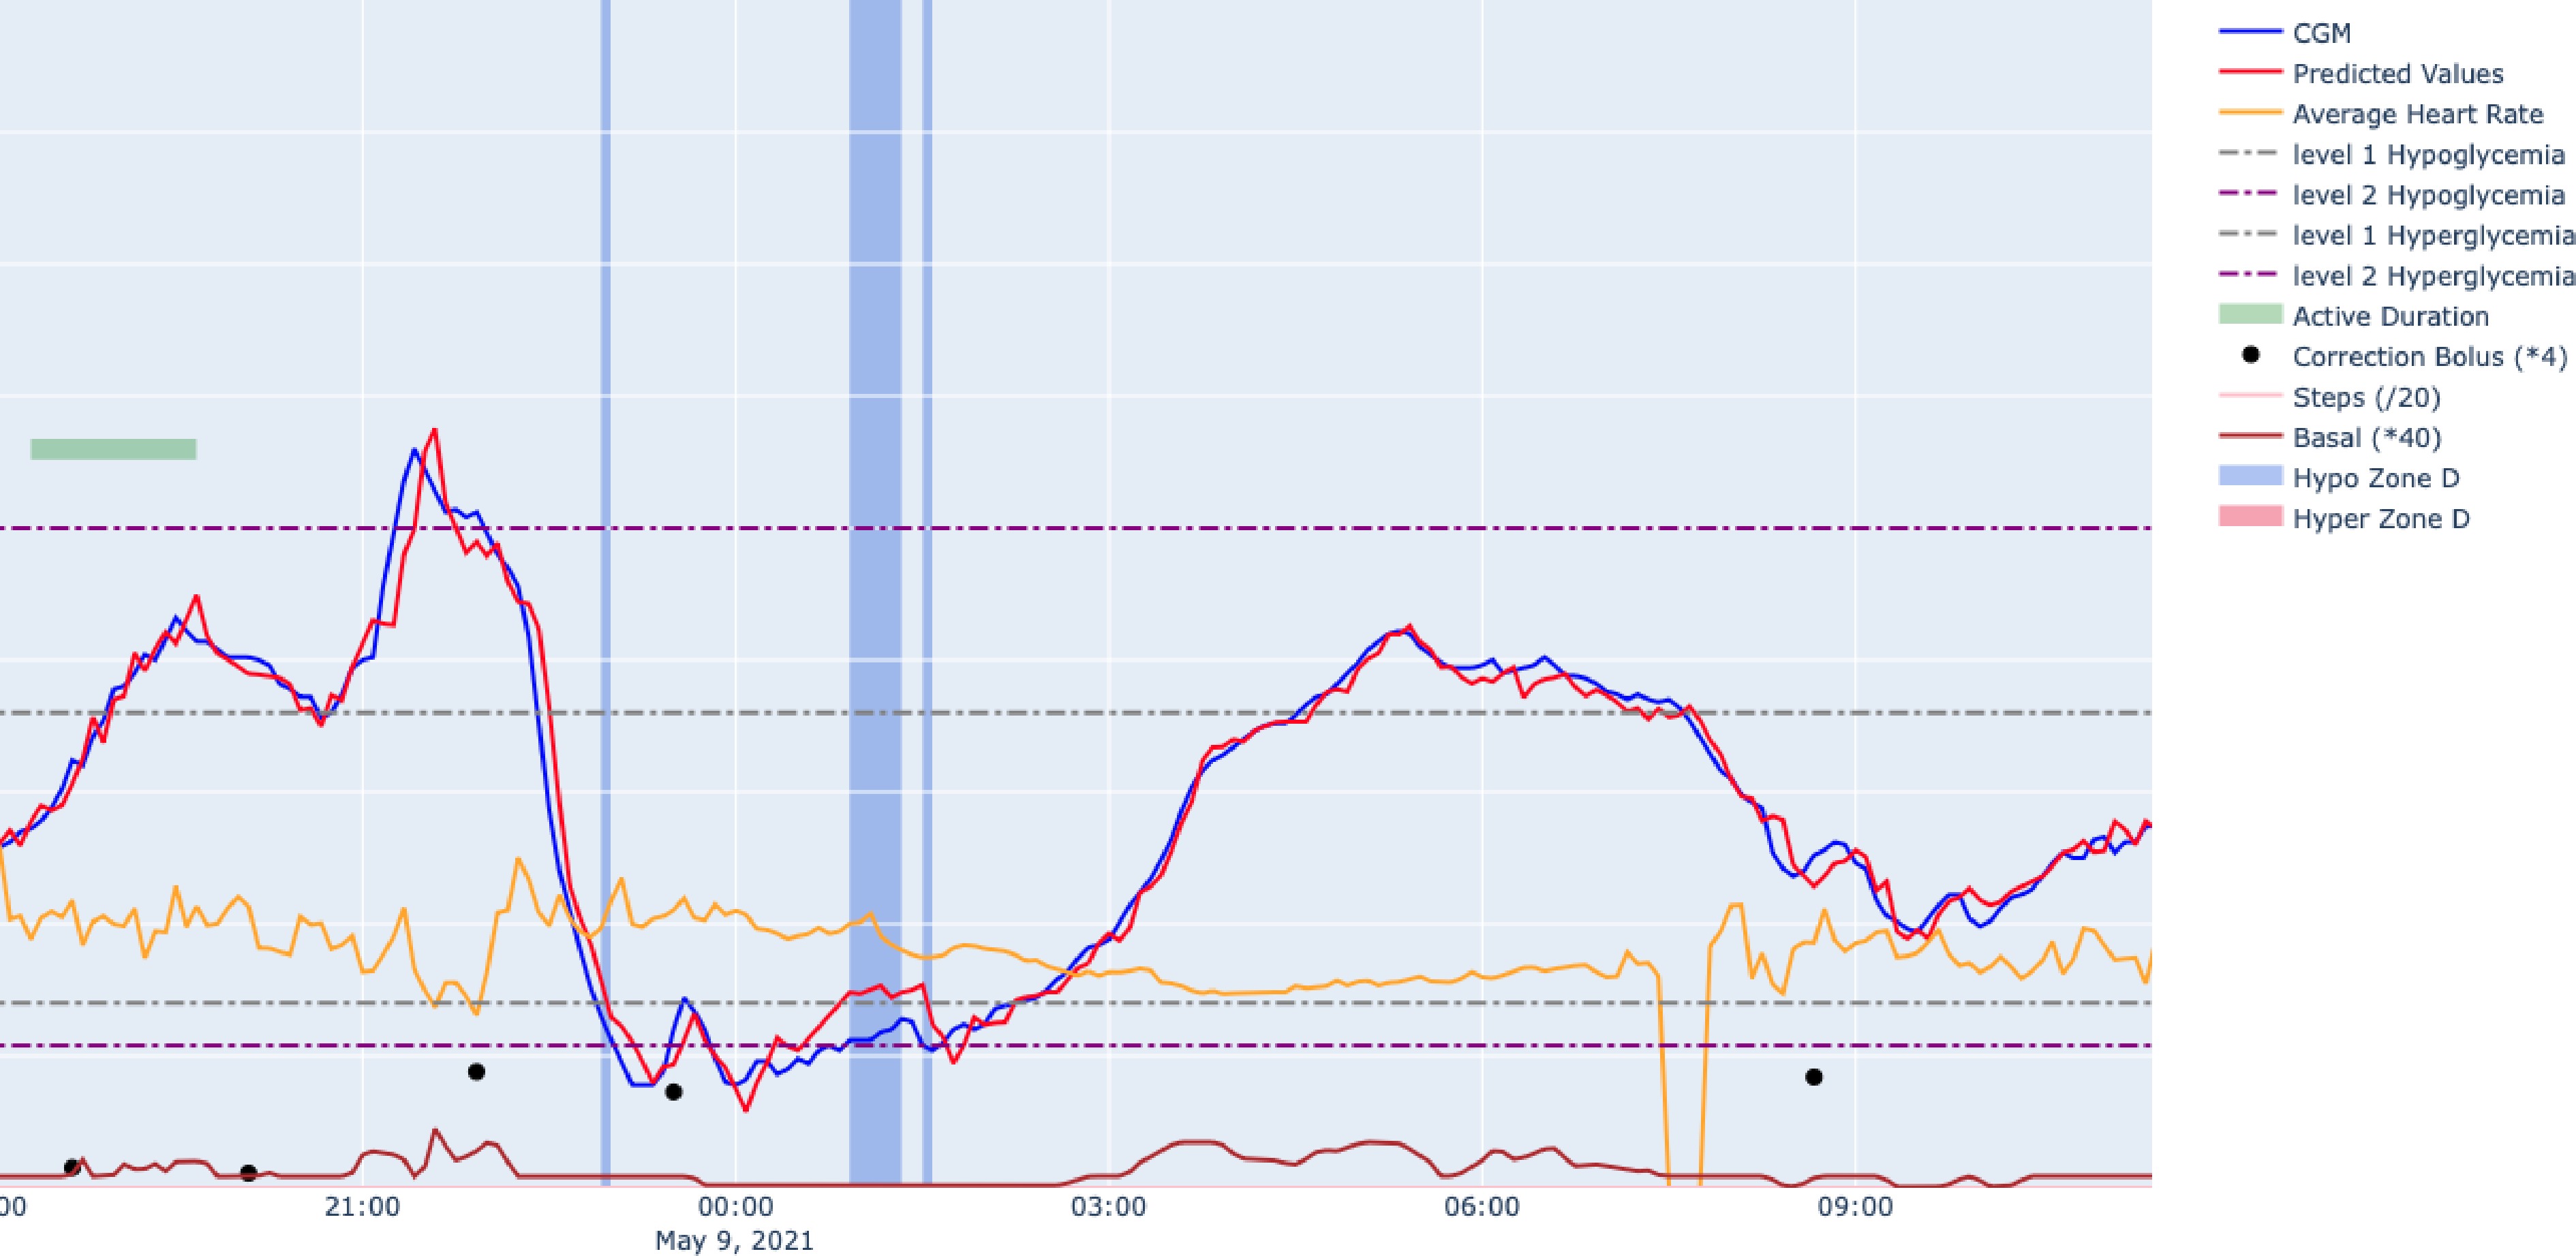
Figure 3.
Predicted vs observed CGM values for patient #242 on the first test day for a 10-min prediction horizon.
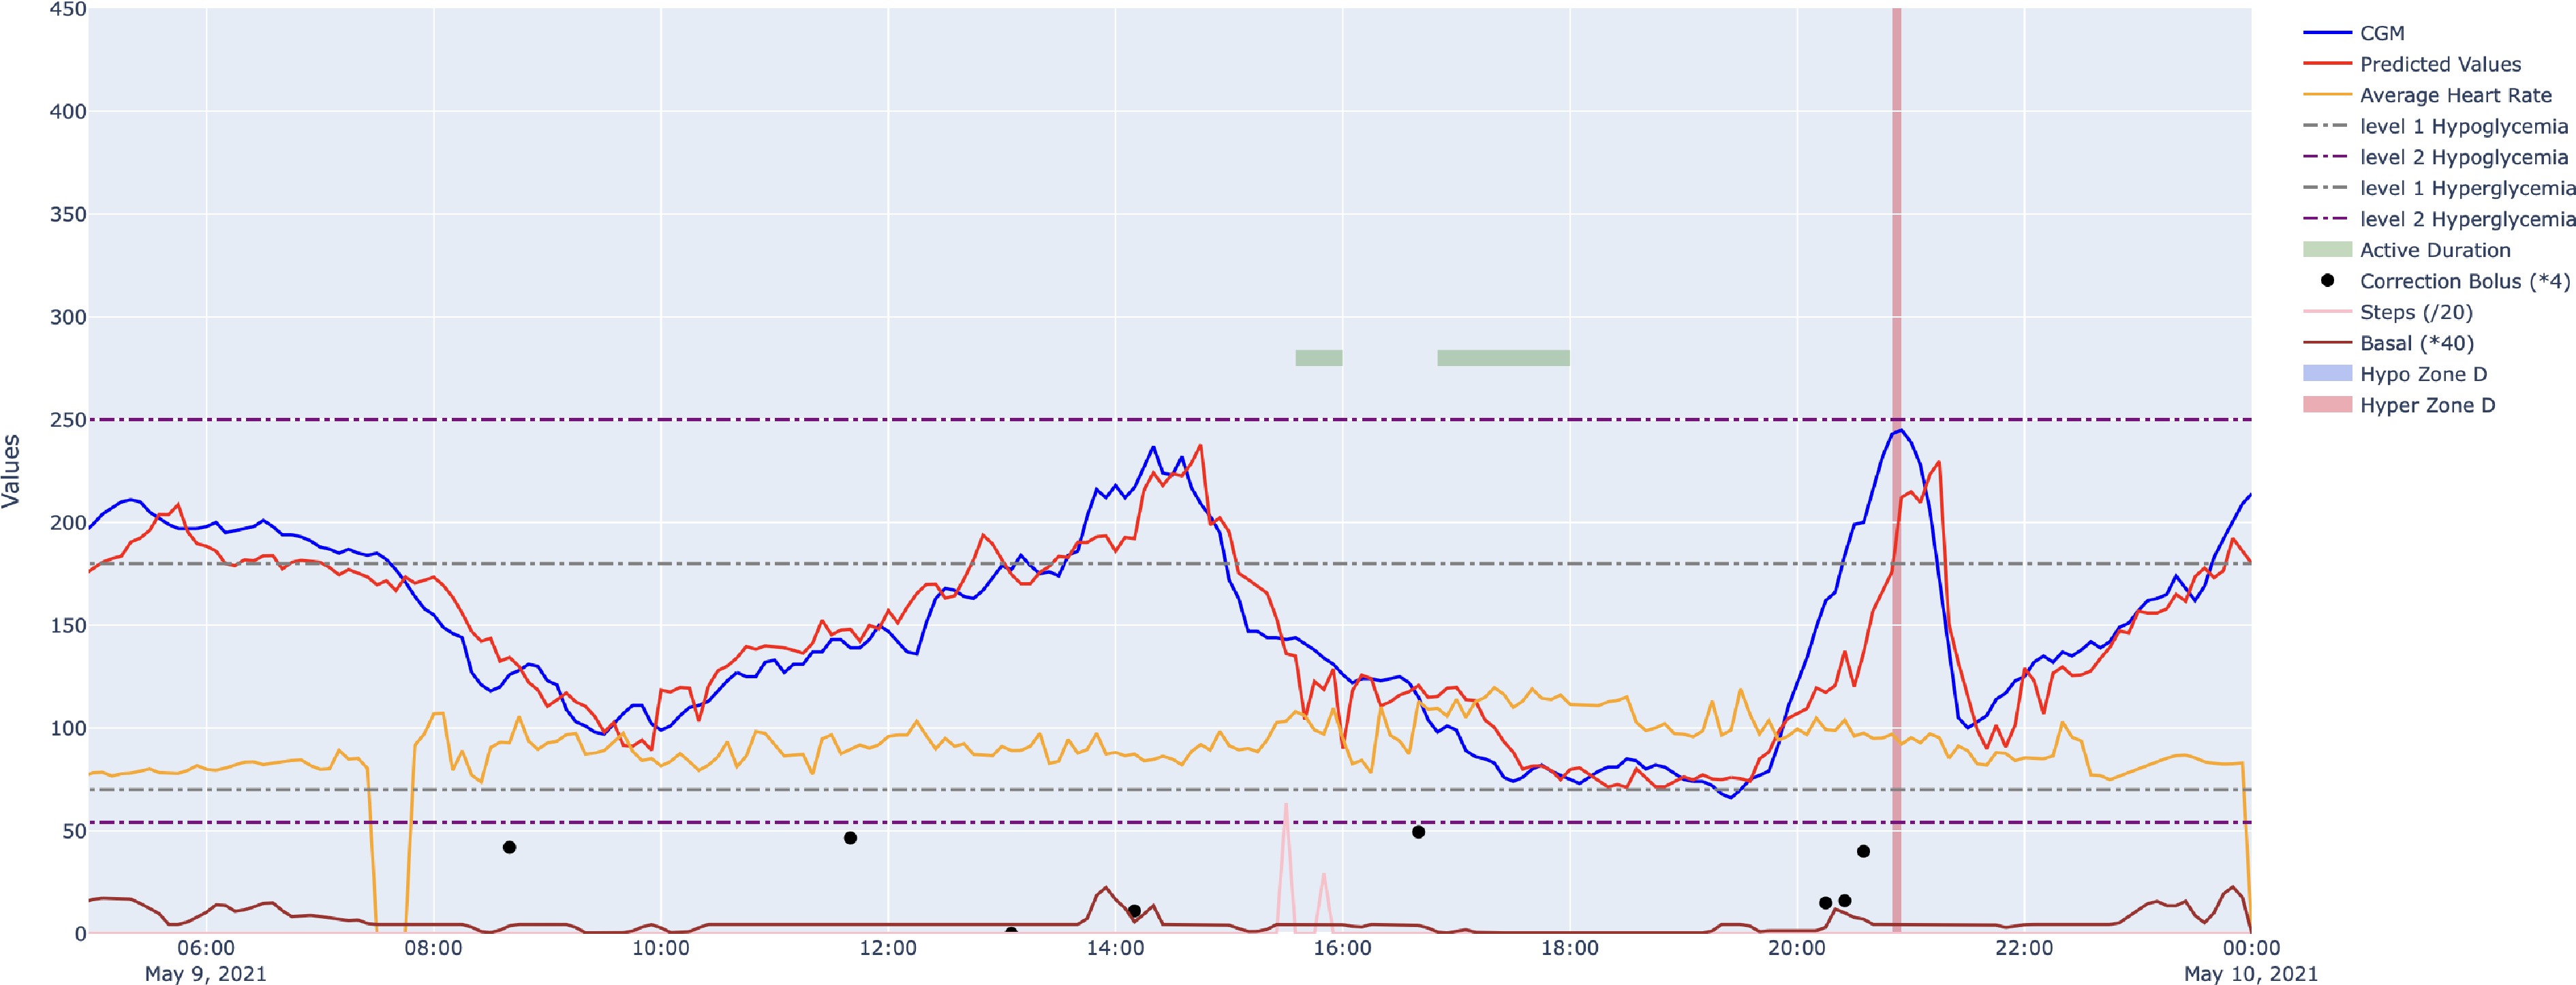
Figure 4.
Predicted vs observed CGM values for patient #242 on the second test day for a 30-min prediction horizon.
Patient #242 exhibited an overall RMSE of 26.38 mg/dL (1.47 mmol/L), increasing to 62.20 mg/dL (3.45 mmol/L) for predictions in zone Hypo D. Three hypoglycemic episodes occurring on the first test day accounted for these prediction errors. The first episode followed a rapid glucose decline after several correction boluses, causing the model to remain influenced by the preceding hyperglycemic trend. The second episode corresponded to a shallow hypoglycemia that was detected with only a short delay before the model rapidly readjusted. The third and most severe episode occurred after prolonged physical activity and successive boluses administered despite low glucose levels. In the absence of reported CHO intake, the model interpreted these boluses according to patterns learned during training, resulting in delayed hypoglycemia detection. Hyperglycemia prediction errors for this patient remained infrequent and were also associated with recent correction boluses, after which the model rapidly recovered.
Analysis of the remaining three patients revealed three recurring patterns explaining delayed hypoglycemia detection. In many cases, undetected hypoglycemia events were spaced out over time and detected only with a slight delay (the blue band is narrow in the figures), indicating rapid model readjustment. In other cases, detection was slower, particularly when glucose levels dropped rapidly below 50 mg/dL (2.78 mmol/L) (patients #242, #498, and #357), a pattern inherent to 30-min-ahead predictions. Nevertheless, in most cases, the model eventually readjusted, and the predicted glucose curve closely followed the true CGM curve, although with a slight delay. In some situations, delayed detection was attributable to missing information, such as unreported CHO intake (patient #242) or frequent CGM gaps (patient #393), or to atypical clinical events not represented in the training data, such as a correction bolus administered during hypoglycemia. When no relevant contextual sign, such as a bolus or PA event, is present in the 2-h history, a purely data-driven model cannot anticipate a rapid glucose decline it has not yet observed.
Additional evaluation of pediatric patients treated with MDI
-
To further assess the applicability of the proposed approach beyond insulin pump users, we additionally evaluated it on pediatric patients treated with MDI from the T1DEXI-P study. The same transfer learning strategy was applied. Specifically, the model was pre-trained on the same adult cohort, fine-tuned on the 84 pediatric insulin pump users, and finally personalized using data from the target MDI patient. The MDI cohort consisted of 30 pediatric patients, whose demographic and clinical characteristics are summarized in the Supplementary File 5: Table S11.
Overall, prediction accuracy decreased slightly compared with pediatric insulin pump users but remained clinically acceptable across all prediction horizons (Table 4). At 10 min, RMSE remained below 14.96 mg/dL (0.83 mmol/L) for 75% of patients, while at least 89% of predictions fell in the safe zone A for every MDI patient. Clinically unsafe predictions occurred only in zone D and remained rare. At 20 min, the mean RMSE increased to 23.61 mg/dL (1.31 mmol/L), while at least 89.58% of predictions remained in zone A for 75% of patients. Undetected hypoglycemia (zone Hypo D) and hyperglycemia (zone Hyper D) remained infrequent, averaging 0.92% and 0.15%, respectively. At 30 min, prediction accuracy further decreased (mean RMSE of 27.01 mg/dL [1.50 mmol/L]), but predictions remained clinically safe for most patients. All undetected hypoglycemia events were in zone Hypo D, with no predictions in zone Hypo E. Undetected hypoglycemia averaged 1.06%, whereas undetected hyperglycemia averaged 0.35%. Only one prediction, corresponding to a single patient, fell in zone Hyper E. Detailed patient-level results, including RMSE and CEG outcomes for each prediction horizon, are provided in the Supplementary File 5: Tables S12−S14.
Table 4. Summary of prediction performance of the adult–pediatric transfer learning strategy for MDI pediatric patients at 10-, 20-, and 30-min prediction horizons.
Stat RMSE Zone A (%) Zone B (%) Zone C (%) Hypo D (%) Hyper D (%) Hypo E (%) Hyper E (%) Prediction horizon: 10 min Min 5.83 89.28 0.00 0.00 0.00 0.00 0.00 0.00 Q1 9.71 94.15 0.98 0.00 0.00 0.00 0.00 0.00 Median 11.97 96.68 2.68 0.00 0.00 0.00 0.00 0.00 Mean 12.27 96.13 3.39 0.00 0.48 0.00 0.00 0.00 Q3 14.96 99.02 4.63 0.00 0.76 0.00 0.00 0.00 Max 23.97 100.00 10.54 0.00 3.08 0.00 0.00 0.00 Prediction horizon: 20 min Min 12.03 73.08 3.24 0.00 0.00 0.00 0.00 0.00 Q1 18.69 80.01 9.62 0.00 0.00 0.00 0.00 0.00 Median 23.43 84.94 13.65 0.00 0.00 0.00 0.00 0.00 Mean 23.61 85.05 13.84 0.03 0.92 0.15 0.00 0.00 Q3 28.55 89.58 18.36 0.00 1.14 0.16 0.00 0.00 Max 33.81 96.76 25.24 0.38 5.62 1.27 0.00 0.00 Prediction horizon: 30 min Min 13.27 70.17 3.45 0.00 0.00 0.00 0.00 0.00 Q1 20.98 76.72 10.90 0.00 0.00 0.00 0.00 0.00 Median 27.41 81.54 17.85 0.00 0.09 0.00 0.00 0.00 Mean 27.01 82.35 15.98 0.26 1.06 0.34 0.00 0.01 Q3 33.21 87.73 20.88 0.22 1.84 0.22 0.00 0.00 Max 40.60 96.55 24.68 1.43 5.29 2.96 0.00 0.21 RMSE: root mean squared error. Zones A–C and Hypo/Hyper D and Hypo/Hyper E are Clarke Error Grid (CEG) zone percentages. Hypo D: model predicts target range while patient is in hypoglycemia; Hyper D: model predicts target range while patient is in hyperglycemia; Hypo E: model predicts hyperglycemia while patient is in hypoglycemia; Hyper E: model predicts hypoglycemia while patient is in hyperglycemia. Values summarize the distribution across patients (Min, Q1, Median, Mean, Q3, Max) for each prediction horizon. Bold text is used to distinguish the different cohorts and improve readability. -
Diabetes management in the pediatric population is particularly challenging under free-living conditions because children often engage in spontaneous physical activity, have irregular daily routines, and may not always report carbohydrate intake or other contextual information. These characteristics make accurate blood glucose prediction substantially more difficult than in controlled settings. This study is, to our knowledge, the first to use the T1DEXI-P dataset for blood glucose prediction in children and adolescents with T1D exercising under free-living conditions. Previous studies on pediatric glucose prediction have included at most 49 patients[4], relied on smaller cohorts and shorter observation periods[5−11], and rarely incorporated PA as a model input. Only two previous studies[9,11] explicitly included PA as a model input, both using the DiCAMP dataset (14 participants, 7 d), and both reported worse performance than ours at the 30-min horizon. A key strength of our study is the use of a substantially larger real-world pediatric cohort (84 participants, 10 d) with a rich set of synchronized inputs including CGM, insulin delivery, heart rate, step counts, and PA. By explicitly incorporating this contextual information together with CGM dynamics, our approach provides personalized predictions under realistic conditions. Such predictions could help children and adolescents with T1D, as well as their parents, better anticipate exercise-induced glucose fluctuations and support timely preventive actions during planned or spontaneous physical activity. They could also provide valuable support in school settings, where parents are often absent, and early anticipation of hypoglycemia may facilitate timely interventions by school personnel. This is particularly relevant because physical activity remains one of the most challenging situations to manage in pediatric T1D.
In recent years, closed-loop insulin pumps, also referred to as automated insulin delivery (AID) systems, have become increasingly adopted in the T1D population because they improve overall glycemic control by continuously adjusting insulin delivery based on CGM measurements. Unlike open-loop insulin pumps, which deliver insulin according to user-programmed settings, closed-loop systems incorporate an embedded control algorithm that automatically modulates insulin delivery in response to changes in CGM values. In our pediatric cohort, the closed-loop subgroup indeed exhibited slightly better overall glycemic control than the open-loop subgroup, with higher TIR and lower TAR and TBR on average, while PA duration was comparable between the two groups. A slightly better prediction performance was observed for the open-loop subgroup, and most of the challenging patients were using closed-loop systems. One possible explanation is the slightly higher coefficient of variation (CV) observed in the closed-loop subgroup. The coefficient of variation reflects the degree of glucose variability throughout the 10-d study period, and greater glycemic variability is generally associated with more complex glucose dynamics that are inherently more difficult to predict. Indeed, when prediction performance was stratified according to glycemic variability, participants with CV ≤ 36% exhibited lower RMSE values than those with CV > 36% across all three prediction horizons. A similar trend was observed when prediction performance was stratified according to TIR, with participants achieving the recommended TIR target (≥ 70%) exhibiting lower RMSE values than those with TIR < 70%. Lower CV was also associated with slightly lower mean percentages of predictions falling within CEG zone D. In contrast, when prediction performance was stratified by sex, very similar prediction accuracy and clinical safety were observed for male and female participants. Although sex-related differences in insulin sensitivity, pubertal hormonal changes, and glucose regulation could potentially influence blood glucose dynamics and, consequently, prediction performance, no meaningful differences were observed between male and female participants in the present study. This observation was made despite the pediatric cohort including substantially fewer female than male participants (26 vs 58).
Our findings suggest that, in this study, prediction performance was not determined by the insulin control algorithm implemented in the pump. Although closed-loop systems improved overall glycemic control, they did not systematically lead to more accurate glucose predictions than open-loop systems. This observation is consistent with the fact that current AID systems still face important limitations during physical activity, particularly because they mainly react to changes detected by the CGM rather than anticipating the rapid glucose excursions induced by exercise. These findings further support the need for next-generation AID systems that explicitly incorporate contextual information related to physical activity, such as its type, timing, duration, and intensity, sufficiently in advance to enable more proactive insulin adjustments.
In this study, we went beyond reporting average performance by analyzing variability across the pediatric population and by focusing on challenging patients with high RMSE values and/or elevated proportions of clinically unsafe predictions, examining predicted BGL trajectories together with contextual data to help explain prediction errors. Although delayed hypoglycemia detection was observed for a small number of patients, its potential clinical implications should not be overlooked. A delayed hypoglycemia prediction may postpone preventive actions, such as CHO intake or treatment adjustment, thereby increasing the risk of prolonged or severe hypoglycemia, particularly during or after physical activity when glucose levels may decline rapidly. In our study, these delays were mainly observed for the longest prediction horizons and typically occurred during abrupt glucose decreases, when some contextual information is missing (e.g., missing heart rate data or CGM gaps), or in atypical situations not represented in the training data. In most cases, however, the model rapidly readjusted, and the predicted glucose trajectory closely followed the CGM values.
Our results show that the 10-min predictions were excellent across all 84 patients using insulin pumps, with very few undetected hypoglycemia events and only one undetected hyperglycemia event. This prediction horizon is clinically sufficient to prevent hypoglycemia, as fast-acting CHO typically corrects low glucose within 10 min. Reliable short-horizon predictions would be particularly valuable for automated insulin delivery systems, enabling proactive basal insulin adjustments before hypoglycemia occurs. At 20 min, accuracy remained high and predictions clinically safe. Longer horizons may be useful for anticipating exercise-induced hypoglycemia episodes or post-meal hyperglycemia, but in children, especially in younger ones, PA is rarely planned, and energy expenditure is highly variable, making 30-min-ahead predictions less clinically actionable during the day. A more promising application of longer horizons may be nocturnal hypoglycemia prediction, where external perturbations such as PA and CHO intake are unlikely to occur. These findings suggest that, in situations where rapid glucose changes are expected or when contextual information is incomplete, greater emphasis could be placed on shorter prediction horizons, particularly the 10-min horizon, which achieved the highest prediction accuracy and safety in our study. Since predictions are updated regularly, successive short-term predictions may provide early confirmation of a downward glucose trend, allowing timely preventive actions to reduce the severity of impending hypoglycemic events. Although the proposed model already incorporates contextual variables such as insulin administration, CHO intake, and PA, improving the completeness of these data whenever possible—and incorporating planned future activities when available—could further reduce delayed hypoglycemia detection, especially for longer prediction horizons.
We also investigated the use of adult T1D data to improve pediatric predictions; an approach explored previously with only one smaller cohort using the DiaCamp dataset[11]. Pre-training on adult data improved predictive performance for the pediatric cohort considered in this study. Adult datasets are generally larger and more complete than pediatric ones, as diabetes management in younger children is often handled by parents who are not always present during school or daycare hours, leading to more frequent gaps in CGM data (signal loss), unreported CHO intake (free CHO consumed without a bolus), and unrecorded PA (often unplanned). Using adult data to initialize the model helps compensate for this scarcity, consistent with the findings of Ryser et al.[11]. Although transfer learning from adult data improved prediction performance in our study, physiological and behavioral differences between adults and children with T1D, including differences in insulin sensitivity, hormonal regulation (e.g., growth hormones), and exercise patterns, may limit the transferability of blood glucose response patterns learned from adult data and potentially affect model performance in other pediatric populations. In our approach, adult data were used only for model pre-training. The models were then fine-tuned on the pediatric cohort to adapt to the pediatric physiological characteristics, followed by a second fine-tuning step on the target pediatric patient to personalize the model to the individual's blood glucose dynamics. Although our results on the T1DEXI-P cohort support the effectiveness of this hierarchical transfer learning strategy, further validation on larger and independent pediatric cohorts is needed before generalizing these findings.
To further evaluate the applicability of the proposed approach, we additionally tested it on pediatric patients from the T1DEXI-P study treated with MDI. Although prediction performance was slightly worse than for insulin pump users, the results remained clinically acceptable for most patients. This reduction is expected, as MDI therapy provides less detailed information on insulin delivery than insulin pumps, making glucose prediction inherently more challenging. These additional results suggest that the proposed transfer learning approach can be extended beyond insulin pump users. However, the present study was not designed to optimize transfer learning for MDI-treated patients. Future work should investigate transfer learning strategies specifically tailored to MDI populations and validate them on larger pediatric cohorts.
Several limitations should be noted. Data were collected over only 10 d, limiting evaluation of performance across different contexts and potential day-of-week effects. Models were evaluated on a single pediatric cohort; external validation on an independent cohort of children and adolescents with T1D would assess their generalizability and portability. Missing data remained a key source of error, particularly for patients with frequent CGM gaps or unreported CHO intake. Most clinically unsafe predictions were associated with sudden and sharp CGM drops that were not explained by the available contextual data; predicting such rapid declines earlier would improve the safety of the model for the most challenging patients. As purely data-driven models, our predictions cannot generalize to clinical scenarios absent from the training data, especially actions that patients typically avoid for safety reasons, such as administering insulin boluses during hypoglycemia or consuming large amounts of CHO during hyperglycemia. We observed such extreme actions for some patients in their test data, and the model was unable to predict an appropriate CGM trend in these cases.
The better performance for hyperglycemia than hypoglycemia prediction partly reflects the data distribution, which contains more hyperglycemic than hypoglycemic events: time above range averaged 26.86% and 22.17% for the pediatric and adult populations, respectively, compared to 2.45% and 3.11% for the time below range.
Finally, the model strongly depends on the availability of complete and high-quality data, requiring patients to use a CGM, a smartwatch, an insulin pump, and to carefully log their CHO intake, which can be burdensome. Recent studies have explored ways to reduce this burden, particularly for closed-loop users, by relaxing the need to report CHO manually. Although our models showed some capacity to infer the effect of CHO intake without explicit reporting, this inference cannot be relied upon for clinical safety.
Despite these limitations, this work represents an important step toward intelligent and personalized decision-support systems for pediatric T1D management. Reliable and personalized short-term blood glucose prediction is a prerequisite for recommendation algorithms capable of evaluating alternative therapeutic actions before they are implemented. As the predictive component of recommendation systems, the proposed approach could enable what-if scenario analyses to estimate the effect of different interventions, such as carbohydrate intake, insulin dose adjustments, or planned physical activity, before recommending the safest option. Such capabilities could complement existing diabetes technologies, including AID systems, by enabling proactive and personalized treatment adjustments that explicitly account for physical activity—a major determinant of glucose variability in children that remains insufficiently exploited by current systems.
-
This study evaluated deep learning models for blood glucose prediction in 84 children and adolescents with T1D, treated with insulin pumps and exercising under free-living conditions, using data from the T1DEXI-P study. Models were trained on CGM, insulin, CHO intake, heart rate, step counts, and PA data collected over 10 d, with predictions made 10, 20, and 30 min ahead.
The best-performing strategy involved pre-training stages on 380 adults from the T1DEXI study, followed by fine-tuning on the pediatric cohort and then on each individual patient. This approach yielded accurate and clinically safe predictions for most patients. For the small subset of challenging patients, detailed analysis of predicted BGL trajectories alongside contextual data explained most cases of delayed hypoglycemia detection, which were attributable to rapid glucose declines, missing data, or atypical clinical events rather than fundamental model limitations. The proposed approach also demonstrated promising performance in a secondary evaluation on 30 pediatric patients treated with multiple daily injections, suggesting that transfer learning using both adult and pediatric data may generalize beyond insulin pump users.
Reliable 10-min predictions are sufficient to support hypoglycemia prevention in a pediatric population during daytime and could be integrated into AID systems for proactive insulin adjustments. Predicting nocturnal hypoglycemia over longer horizons represents a promising next step, given the absence of PA and dietary perturbations during sleep.
Current work focuses on improving model interpretability to identify the features with the greatest impact on predictions at the individual patient level. Current guidelines for exercise-related hypoglycemia prevention assume a uniform patient response; our approach instead seeks to identify patient-specific influential features and derive personalized recommendations, with the goal of more effectively preventing both hypoglycemic and hyperglycemic events in children with T1D.
This paper is based on research using data from the Type 1 Diabetes EXercise Initiative (T1DEXI) study and its pediatric extension (T1DEXI-P) that has been made available through Vivli, Inc. Vivli has not contributed to, approved, or is in no way responsible for the contents of this publication.
-
The study was conducted in accordance with the Declaration of Helsinki, and the protocol was approved by the Research Ethics Board of Université Laval (Project identification code: 2024-076, approval date: March 6, 2024). The data used in this study were provided by Vivli, Inc. and collected from the T1DEXI and T1DEXI-P studies.
-
The authors confirm their contributions to the paper as follows: study conception and design: Zghal Y, Cremona MA, Rekik M; data collection and curation, software development, visualization: Zghal Y; formal analysis and interpretation of results: Zghal Y, Cremona MA, Henderson M, Rekik M; draft manuscript preparation: Zghal Y, Rekik M; review and editing, funding acquisition: Cremona MA, Henderson M, Rekik M; supervision: Cremona MA, Rekik M; project administration and resources: Rekik M. All authors reviewed the results and approved the final version of the manuscript.
-
The datasets analyzed during the current study are not publicly available but are available from Vivli, Inc. upon reasonable request.
-
The authors declare that they have no conflict of interest.
-
accompanies this paper online at: https://doi.org/10.48130/pedi-0026-0010.
- Supplementary File 1 ResLSTM Architecture.
- Supplementary File 2 Supplementary results of the adult-pediatric transfer learning strategy in pediatric insulin pump users.
- Supplementary File 3 Supplementary results of the pediatric transfer learning strategy in pediatric insulin pump users.
- Supplementary File 4 Predicted versus observed CGM values for challenging patients #357, #393 and #498 for the 30-minute prediction horizon.
- Supplementary File 5 Results of the adult-pediatric transfer learning strategy in pediatric patients treated with MDI.
-
Copyright © 2026 by the author(s).
Pediatric Diabetes published by Maximum Academic Press on behalf of John Wiley & Sons Ltd. This is an open access article under the terms of the Creative Commons Attribution License, which permits use, distribution and reproduction in any medium, provided the original work is properly cited. -
About this article
Cite this article
Zghal Y, Cremona MA, Henderson M, Rekik M. 2026. Deep learning-based blood glucose prediction in pediatric type 1 diabetes patients exercising in free-living conditions. Pediatric Diabetes 2026: e011 doi: 10.48130/pedi-0026-0010 

Deep learning-based blood glucose prediction in pediatric type 1 diabetes patients exercising in free-living conditions
- Received: 02 April 2026
- Revised: 06 August 2026
- Accepted: 17 August 2026
- Published online: 15 October 2026
Abstract: This paper evaluates deep learning models for blood glucose prediction in children and adolescents with type 1 diabetes using insulin pumps and investigates whether transfer learning from adult data improves prediction accuracy and safety. Models were trained using data from the Type 1 Diabetes Exercise Initiative Pediatric study (84 pediatric insulin pump users) and its adult counterpart (380 adult insulin pump users). Two transfer learning strategies were compared: one using pediatric data only and another pre-training the model on adult data before fine-tuning it on the pediatric cohort and each target patient. Prediction accuracy and clinical safety were assessed using root mean square error (RMSE) and the Clarke Error Grid (CEG) at 10-, 20-, and 30-min prediction horizons, with results analyzed separately for open-loop and closed-loop users. Pre-training on adult data yielded the best performance. At 30 min, mean RMSE was 19.61 mg/dL (1.09 mmol/L), with at least 92.64% of predictions falling within zone A of the CEG for 75% of patients. No predictions fell within the unsafe zone E. Delayed hypoglycemia detection occurred only in a small subset of patients and was mainly associated with missing contextual information or atypical clinical events. An additional evaluation on pediatric patients treated with multiple daily injections (MDI) demonstrated clinically acceptable prediction accuracy and safety, supporting the applicability of the proposed transfer learning approach to MDI users. These findings demonstrate that transfer learning from adult data effectively mitigates pediatric data scarcity and enables accurate, clinically safe blood glucose prediction under free-living conditions.