


-
The continuous increase of plastic waste has become a major global challenge in the fields of ecology and human health. Among various types of plastic waste, agricultural plastic film is particularly typical, which is mainly made of materials such as low-density polyethylene (LDPE). In 2021, approximately 17.3 million hectares of farmland in China was covered with agricultural plastic mulch, marking a dramatic increase relative to 1981. While the consumption of agricultural plastic mulch hit a peak of 1.5 million metric tons in 2016, and decreased moderately to 1.3 million metric tons in 2021, China still maintains its status as the world's largest consumer of such materials[1]. In the United States, agricultural plastic mulch is widely applied in the cultivation of strawberries, tomatoes, and various other vegetables, with the covered area reaching millions of acres and the annual usage estimated to range from 50,000 to 100,000 metric tons. In Europe, agricultural plastic mulch constitutes a major component of agricultural plastic consumption. In 2019, the total volume of the European agricultural plastic market stood at 579,000 metric tons, of which 320,000 metric tons were consumed in vegetable production, and the dedicated consumption of mulch reached 83,000 metric tons. Taking Germany as an example, the annual agricultural plastic consumption amounts to 1.1 million metric tons, accounting for 4.7% of the country's total plastic consumption (23.6 million metric tons). The plastic recycling rate in the EU's agricultural sector is approximately 37%, indicating that this sector leads many other industries in the implementation of the circular economy[2]. A significant portion of discarded plastic mulch film (WPF) is not properly managed, resulting in persistent pollution of the soil and the environment. Since the natural degradation cycle of WPF can last up to a hundred years, and incineration treatment would release toxic chemicals, further exacerbating pollution and posing health risks, it is urgent to explore more sustainable disposal methods.
Currently, the resource utilization of low-density polyethylene waste mainly includes mechanical recycling and chemical recycling. Mechanical recycling can reprocess waste plastics into products, but after multiple melting-reforming processes, the mechanical and chemical properties of the recycled polyolefin often significantly decline, limiting its high-value application[3]. In contrast, chemical recycling is regarded as a more promising solution, which mainly includes traditional pyrolysis, catalytic pyrolysis, hydrogenation cracking, solvent decomposition, and hydrolysis. Among them, pyrolysis technology is particularly of concern, as it breaks down long-chain hydrocarbons through thermal cracking, and triggers molecular rearrangement, converting the polymer into small organic molecules, ultimately obtaining liquid fuels that are convenient for storage and transportation or high-value monomers that can be used as chemical raw materials[4]. Microwave heating has attracted increasing attention in various types of plastic waste recycling, owing to its characteristics of bulk heating, rapid temperature rise, and high energy efficiency[5]. This method is particularly suitable for treating polymers with low thermal conductivity, such as LDPE films. For thin-layer waste plastic mulch, conventional external heating usually leads to uneven heat transfer, as well as melting and agglomeration issues. In contrast, when microwave radiation is combined with susceptor materials (e.g., SiC), intense thermal gradients can be generated at the interface between the susceptor materials and the plastic, which facilitates rapid devolatilization, and may alter the dominant pyrolysis mechanisms. Furthermore, the selective heating capability of microwaves enables efficient and directional energy transfer to the downstream catalytic bed, thereby enhancing the catalytic reforming process[6]. Thus, microwave-assisted pyrolysis exhibits significant advantages in the efficient conversion of waste plastic films into high-value products[7].
However, the efficiency of pyrolysis and the product distribution are severely affected by the selection of catalysts. In this regard, biochar, due to its high reactivity, large specific surface area, and strong structure, can serve as an excellent carrier, providing an attractive option for catalyst preparation. Converting biomass waste into this high-value catalyst not only improves the utilization efficiency of materials but also provides a sustainable approach for the management of agricultural waste. As a catalyst, biochar plays a role in various carbon-containing raw material pyrolysis and gasification processes: for example, Li et al.[8] used poplar wood gasification biochar to reveal its differential catalytic mechanism in the thermal decomposition of polyethylene for LDPE and HDPE, while Jiang et al.[9] achieved efficient co-pyrolysis of bamboo powder and LDPE with aromatic hydrocarbons and syngas through H3PO4 activation of biomass-activated carbon at low temperatures. Walid et al.[10] successfully prepared nitrogen-doped catalysts (NACC) using coconut shell biochar, and applied them to the thermal decomposition of LDPE waste plastics. These achievements collectively highlight the significant potential of biochar in regulating the pyrolysis process and enhancing product value. Walnut shells are an ideal biomass raw material due to their abundant annual production, low cost, and status as widely generated agricultural by-products. These characteristics prompted their selection as the precursor for catalysts in this study. The main role of the catalyst is to lower the activation energy of the reaction, accelerate the pyrolysis rate, and guide the process towards the formation of ideal products. Although it has these advantages, biochar catalysts are prone to deactivation due to coking. This is mainly because the tar deposits physically block internal pores and chemically mask active acid sites, preventing volatile products from entering the catalytic center[11]. Therefore, conducting a thorough study on the kinetics and chemical properties of carbon formation on the biochar catalyst is essential for the development of a stable and effective pyrolysis system. In the research of pyrolysis kinetics, thermogravimetric analysis (TGA) assumes a pivotal role. It accurately measures the mass changes of carbonaceous materials in real time under controlled conditions. The isoconversional method (also referred to as the model-free method) enables the calculation of activation energy using TGA data obtained at multiple heating rates. On the premise of assuming a first-order reaction model, it can also estimate the pre-exponential factor[12]. Furthermore, the model-fitting approach is employed to screen for the solid-phase reaction mechanism model that most closely matches the experimental data. Such models are generally expressed as a function of the conversion degree α and encompass a variety of forms, including diffusion models, power-law models, reaction-order models, and nucleation mechanisms[13]. Each type of kinetic parameter unveils the inherent reaction mechanism from distinct perspectives.
However, existing studies have mainly focused on product analysis at a single temperature or catalyst deactivation phenomena, lacking systematic research that correlates catalytic temperature, evolution of reaction pathways, chemical properties of coke, and its kinetic behavior. Therefore, the core novelty of this study lies in establishing a multidimensional analytical framework that, for the first time, clarifies how catalytic temperature dynamically modulates the governing reaction pathways, and the corresponding catalyst deactivation mechanisms during the ex-situ catalytic pyrolysis of waste plastic feedstock (WPF) by linking the composition of gaseous products, the chemical nature of coke, and pyrolysis kinetics. This work provides fundamental principles for understanding the inherent trade-off between target product selectivity and catalyst deactivation/regeneration behavior, thereby laying a critical theoretical foundation for the design of efficient and stable valorization processes for waste plastics.
-
In this study, walnut shells were sourced from Shihezi City, Xinjiang, China. The shells were washed with deionized water, dried, and subsequently ground using a crusher. The crushed walnut shells were passed through a sieve with a mesh size of 40 to 80, maintaining the particle size within the range of 187.5 to 425 μm. Then, 25 g of walnut shell particles were mixed with 27.4 mL of 55% phosphoric acid solution at an immersion ratio of 1:2 (ratio of walnut shell to solution by mass), and were treated by immersion for 12 h. The phosphoric acid solution used was purchased from Maclean Company (purity ≥ 85%). After impregnation, the material was dried in an oven at 120 °C. The dried samples were carbonized under a nitrogen atmosphere using microwave-assisted heating at a temperature of 650 °C for 50 min. Finally, the resulting products were washed with deionized water until a neutral pH was achieved and dried to constant weight, yielding the walnut shell-derived catalyst.
Pyrolysis and catalytic reforming of WPF
-
WPF was taken from discarded mulch waste in farmland in Shihezi City, Xinjiang, China, with an elemental ratio of C (28):H (4):O (1). Pyrolysis was carried out in a microwave-assisted pyrolysis reactor, and the resulting volatiles were catalytically reformed in a catalytic reactor system, as illustrated in Fig. 1. The system primarily consists of a gas supply unit, a dedicated quartz reactor, and thermocouples for temperature measurement. The catalytic reformer comprises an independent microwave heater, a condenser, and a liquid collection system. Specifically, 5 g (± 0.05 g) of WPF was placed in the quartz reaction vessel, while 2.5 g of catalyst was loaded into the catalytic reforming zone and secured with quartz wool. Under microwave irradiation, silicon carbide balls in the quartz reactor were heated to 500 °C, and the catalytic reformer was simultaneously heated to the target temperature. The microwave operated at a frequency of 2.45 GHz with a power of 800 W, which achieved a heating rate of 35 °C/min; identical parameters were applied in both the catalytic and pyrolysis zones. High-purity nitrogen was introduced into the system at a flow rate of 50 mL/min to maintain an inert atmosphere. The resulting liquid pyrolysis oil was cooled, collected, and weighed. A small amount of coking coal was observed in the pyrolysis reactor, and the yield of non-condensable gases was determined based on the mass difference between the feedstock and the coking coal.
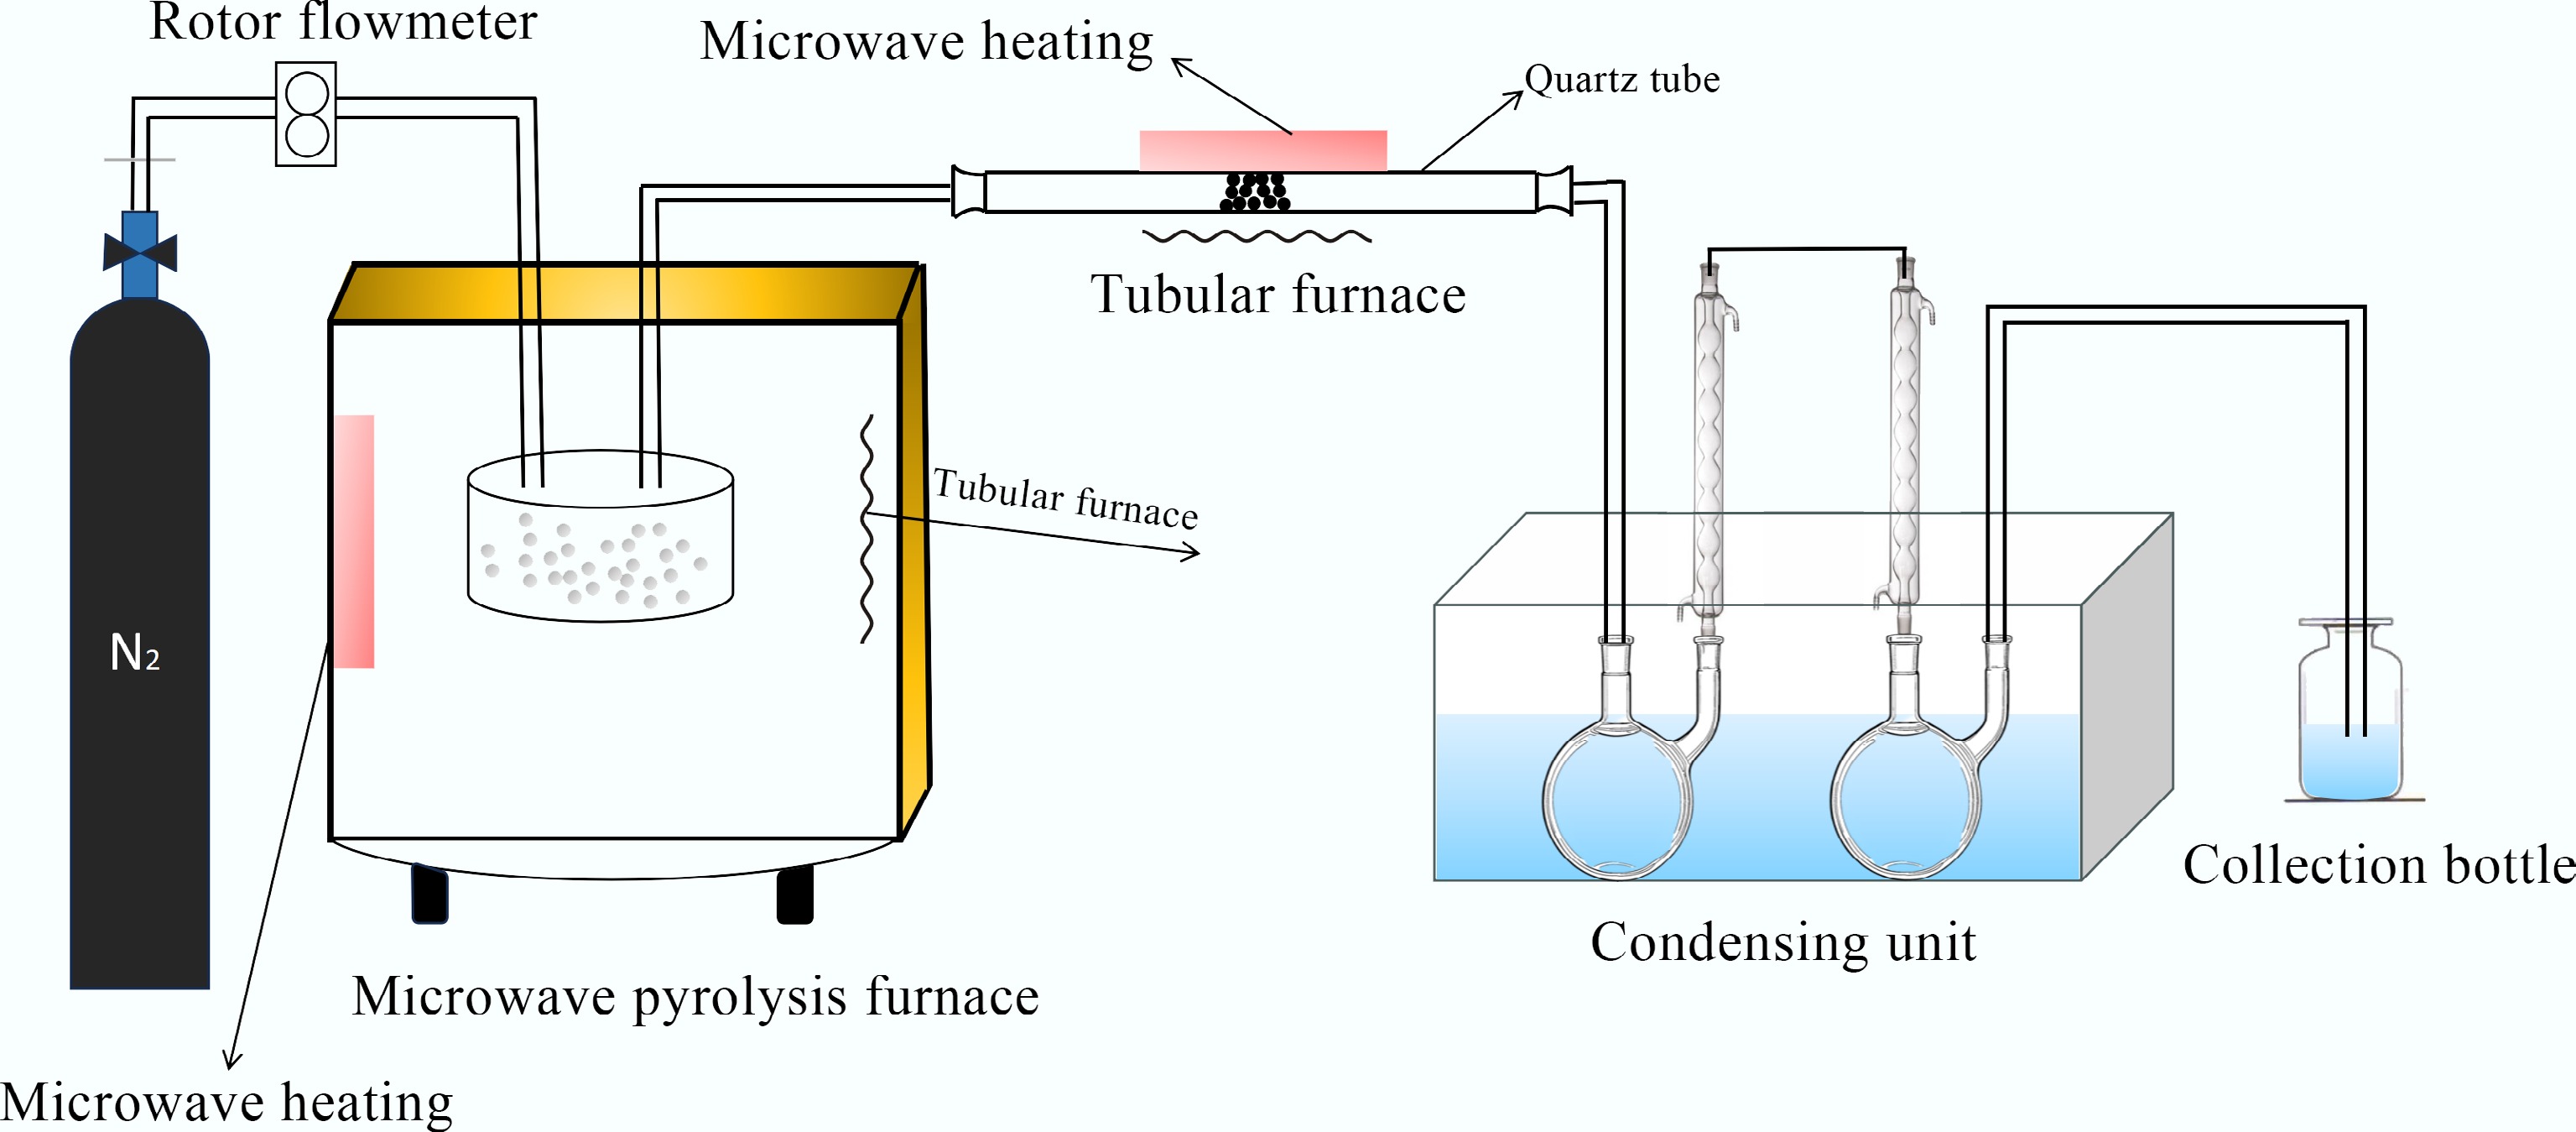
Figure 1.
Microwave ex-situ catalytic pyrolysis device.
Collection of tar
-
The waste walnut shell-derived catalyst obtained from different catalytic reforming processes was entirely collected and promptly weighed. Subsequently, 0.1 g of the waste catalyst was mixed with 5 mL of dichloromethane, and stirred on a magnetic stirrer for 30 min. The mixture was then subjected to treatment in a tri-frequency ultrasonic processor for 60 min, with the three frequencies set at 20, 28, and 40 kHz, and a power of 300 W. During the sonication, ice water was continuously added to the ultrasonic container to maintain the temperature below 15 °C, thereby preventing solvent evaporation and oxidation. Finally, the solution was filtered through a 1-μm organic membrane filter to obtain a dichloromethane solution containing tar. This extract was concentrated to a final volume of 2 mL using a rotary evaporator under reduced pressure, yielding the tar-containing solution for analysis.
Analysis of tar catalysts and products
-
Thermogravimetric analysis of WPF and tar was performed using a thermogravimetric analyzer (DTG-60H, Shimadzu). Approximately 10 mg of sample was placed in an alumina crucible within the TG furnace. Under a high-purity N2 (99.99%) atmosphere, the furnace was heated from ambient temperature to a target temperature of 800 °C at three different heating rates: 5, 10, and 20 °C/min.
The collected pyrolysis oil and tar samples were analyzed by gas chromatography-quadrupole mass spectrometry from Agilent Technologies. The collected pyrolysis oil samples were diluted five times with dichloromethane, and then filtered through a 1-μm organic membrane filter using a 10-mL syringe. They were transferred to a chromatographic injection bottle and injected directly using chromatographic-grade dichloromethane as the solvent. The collected tar samples were injected directly for analysis without pretreatment. Subsequent analysis of both tar and pyrolysis oil was conducted using a GC-MS system (Model 8890-5977B) equipped with an Agilent HP-5 chromatographic column. Condensable components were identified by comparing the mass spectra with the NIST14 mass spectral library. The temperature program was set as follows: initial temperature of 40 °C held for 5 min, increased to 110 °C at a rate of 2 °C/min and held for 40 min, then ramped at 12 °C/min and held for 5 min (total run time: 59 min). The main components were further verified by comparison with standard mass spectra. The specific surface areas of fresh and used walnut shell-derived carbon-based catalysts were determined with an automatic specific surface area and porosity analyzer (Micromeritics ASAP 2460, USA). The variations in functional groups of the fresh and used walnut shell-derived carbon-based catalysts were characterized using a Fourier transform infrared (FTIR) spectrometer (Model: Bruker Vertex 70V).
Kinetic analysis
-
WPF and tar possess complex structures and compositions, involving numerous parallel and sequential reactions[14,15]. Pyrolysis kinetics were employed to investigate the pyrolysis behavior of WPF and the mechanism of tar formation over biomass-derived catalysts during the catalytic process. The basic equations of thermal analysis kinetics are available in 'S1' in Supplementary Text 1.
Model-free method
-
Model-free methods are widely accepted approaches in pyrolysis kinetics. The core concept involves determining the activation energy at each point of the reaction progress directly from experimental data, without presuming any specific reaction mechanism function. This allows for a deeper understanding of complex reaction mechanisms, and validation of hypothetical models[16,17]. To obtain the apparent activation energy (Ea) accurately and reliably, this study employed three integral methods of equal conversion rate (FWO, KAS, and Starink) for kinetic analysis simultaneously. By using multiple methods for mutual verification, errors that might be introduced by a single method in the temperature integration approximation can be overcome. This is particularly applicable to the systems involving complex reactions in the present study. Among them, the Starink method can provide more reliable results by optimizing the approximate constant over a wider temperature range.
The Flynn-Wall-Ozawa (FWO) method[18] is a model-free isoconversional integral approach in pyrolysis kinetics, independently developed by Flynn, Wall, and Ozawa. It is a waste to determine the reaction activation energy (Eₐ) from multiple sets of experimental data at different heating rates without presuming any specific reaction mechanism. The method employs the Doyle approximation to handle the temperature integral, establishing a linear relationship between the logarithm of the heating rate, and the reciprocal of temperature to derive kinetic parameters. Based on the isoconversional principle, the integral form of the kinetic equation, after applying the Doyle approximation, yields the following expression:
$ \mathrm{lg}\beta=\mathrm{lg}\left[\dfrac{\text{AE}}{\text{RG}(\alpha)}\right]-\text{0.4567}\dfrac{\text{E}}{\text{RT}_{\alpha}}-\text{2.315} $ (1) The Kissinger–Akahira–Sunose (KAS) method[9] is an integral isoconversional model-free kinetic approach widely employed to study the apparent activation energy and reaction mechanism during the pyrolysis of materials. Based on the Coats–Redfern approximation, the KAS method linearizes the integral form of the Arrhenius equation, yielding the following expression:
$ \ln\dfrac{\beta}{\text{T}^{\text{2}}}=\ln\left[\dfrac{\text{AR}}{\text{Eg}(\alpha)}\right]-\left(\dfrac{\text{E}}{\text{RT}}\right) $ (2) The Starink method[19] is a highly accurate model-free isoconversional integral approach in pyrolysis kinetics, proposed by MJ Starink in 2003. It aims to improve the temperature integral approximation error associated with conventional methods (such as the FWO and Kissinger methods), particularly for calculating activation energy in complex reaction systems[16]. By optimizing the approximation constants to reduce computational deviation, the Starink method provides more reliable kinetic parameters over a wider temperature range. Based on the general integral form of the kinetic equation and recalibration of the temperature integral approximation constants, the Starink method yields the following expression:
$ \ln \left(\dfrac{{\beta}}{{\text{T}}^{\text{1.92}}}\right)={\rm{Const}}-1.0008\dfrac{{\text{E}}_{{\alpha}}}{\text{RT}} $ (3) The apparent activation energy of pyrolysis can be determined at a constant conversion level from the slope of the linear plot of ln
$ \left(\dfrac{{\beta}}{{\text{T}}^{\text{1.92}}}\right) $ Model-fitting method
-
While model-free methods offer a more direct and reliable approach by avoiding the need for complex mathematical models, their predictive capability is relatively limited due to the absence of an explicit model to describe the pyrolysis process. These methods are confined to analysis and inference based on existing experimental data and cannot extrapolate to unknown conditions[20]. In contrast, model-fitting methods, by building upon known reaction mechanisms and kinetic parameters, enable relatively accurate predictions of the plastic pyrolysis process. Common mechanisms for solid-state thermal reactions are summarized in Table 1[17,21]. In this study, the Criado method[22] was employed to identify the kinetic model for the pyrolysis of WPF. This approach compares experimental data with theoretically calculated values based on reaction mechanism functions, thereby enabling the determination of the kinetic reaction mechanism governing the pyrolysis process[23]. The method is defined by the following equation:
$ \dfrac{\text{z}(\alpha)}{\text{z}(0.5)}=\left[\dfrac{\rm{f(\mathit{\alpha})g(\mathit{\alpha})}}{\mathrm{f}(0.5)\mathrm{g}(0.5)}\right]=\left(\dfrac{\text{T}_{\alpha}}{\text{T}_{\text{0.5}}}\right)^{\text{2}}\dfrac{\text{(}\rm{d\alpha/dt)}_{\alpha}}{\rm{(d\alpha/dt)}_{0.5}} $ (4) where, T0.5 and (dα/dt)0.5 represent the temperature and conversion rate at α = 0.5, respectively. The left side of the equation, f(α)g(α)/f(0.5)g(0.5), corresponds to the theoretical curves of various reaction models listed in the table above, while the right side represents the reduced rate curve derived from experimental data using Eq. (4). By comparing the theoretical master plots with the experimental reduced rate curves, the most appropriate reaction mechanism can be determined[16,20].
Table 1. Theoretical kinetic models for solid-state kinetics with expressions for f(α) and g(α) functions
Mechanism model Differential form f(α) Integral form g(α) Order of reaction First order (F1) 1 – α –ln (1 – α) Second order (F2) (1 – α)2 (1 – α)−1 – 1 Third order (F3) (1 – α)3 [(1 – α)−2 – 1]/2 Diffusion models One-dimensional diffusion (D1) 1/2α α2 Two-dimensional diffusion (D2) [–ln(1 – α)]−1 [(1 – α) ln(1 – α)] + α Three-dimensional diffusion, Jandel (D3) 3(1 – α)2/3/[2(1 –
(1 – α)1/3)][1 – (1 – α)1/3]2 Diffusion control (D4) 3/2[(1 – α)−1/3 – 1] 1 – (2α/3) – (1 – α)2/3 Nucleation growth models Two-dimensional (A2) 2(1 – α)[–ln(1 – α)]1/2 [–ln(1 – α)]1/2 Three-dimensional (A3) 3(1 – α)[–ln(1 – α)]3/2 [–ln(1 – α)]1/3 Four-dimensional (A4) 4(1 – α)[–ln(1 – α)]3/4 [–ln(1 – α)]1/4 Geometrical contraction models One dimension (R1) 1 α Two dimensions (R2) 2(1 – α)1/2 1 – (1 – α)1/2 Three dimensions (R3) 3(1 – α)2/3 1 – (1 – α)1/3 Experimental nucleation models Power law (P2) 2α1/2 Α1/2 Power law (P3) 3α2/3 Α1/3 Power law (P4) 4α3/4 Α1/4 -
The thermal decomposition behavior of WPF at different heating rates (5, 10, and 20 °C/min) is depicted in the TG and DTG curves presented in Fig. 2. The primary decomposition stage for all heating rates occurred within a narrow and consistent temperature window, indicating a uniform pyrolysis process. This process could be delineated into three distinct stages. The first stage, from ambient temperature to approximately 400 °C, involved the gradual softening and melting of the polymer, accompanied by a minor mass loss of 0.5%–2%. The second stage, spanning 400 to 520 °C, constitutes the main decomposition zone, where random chain scission reactions predominated and accounted for the vast majority of the mass loss (97%–99%). The final stage, from 520 to 600 °C, involved the decomposition of residual carbonaceous material, leaving negligible solid residue. Furthermore, the DTG profiles showed that the maximum mass loss rate shifts to higher temperatures with increasing heating rates. This confirmed that the initial, final, and peak decomposition temperatures all increased with rising heating rates.
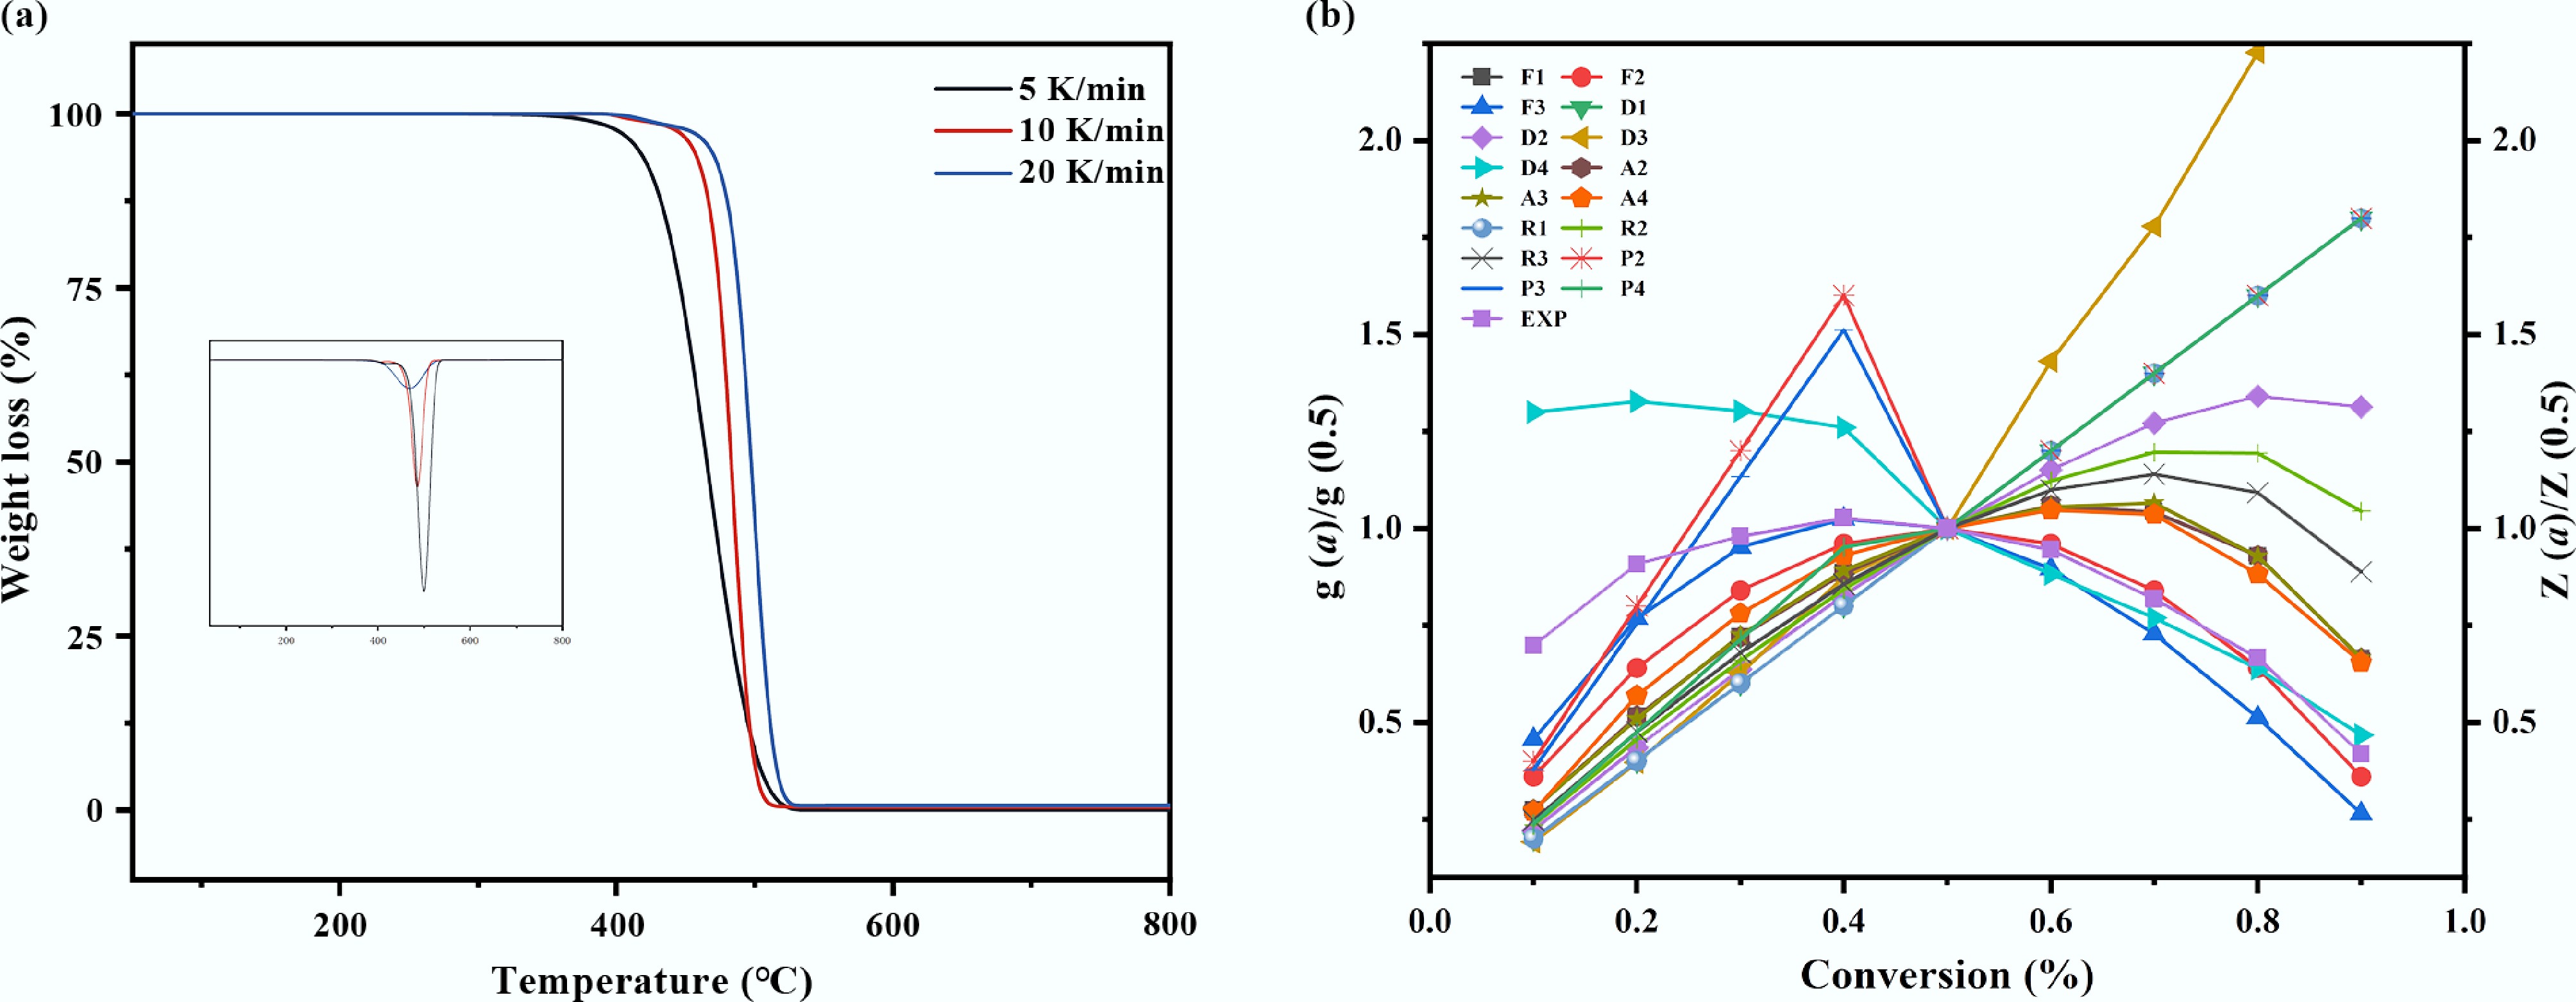
Figure 2.
Thermal decomposition of mulch film. (a) TG analysis of plastic mulch at different heating rates, (b) model fitting diagram of Criado method for plastic mulch.
This systematic shift in decomposition temperatures was governed by intrinsic heat and mass transfer limitations. At lower heating rates, sufficient time was allowed for heat to permeate the material uniformly, enabling pyrolysis to initiate and conclude at relatively lower temperatures. Conversely, higher heating rates induced a significant thermal lag between the sample surface and its interior, creating a substantial temperature gradient[15,24]. Under these conditions, the external regions of the polymer underwent rapid decomposition, while the internal sections had not yet reached the critical degradation temperature. This heat transfer delay resulted in incomplete internal pyrolysis at any given moment, thereby necessitating a higher external temperature to achieve full conversion and shifting the degradation profile to a higher temperature range[25].
Complementing the physical perspective, the temperature shift was also governed by chemical kinetic constraints[26]. Under rapid heating, the generation rate of free radicals was significantly accelerated. However, the subsequent reaction rates involving these radicals—such as β-scission and intermolecular hydrogen transfer—may not keep pace with their rapid formation. This kinetic mismatch promoted radical recombination reactions, leading to the formation of more stable, cross-linked, or higher molecular weight species[27]. The formation of these recalcitrant structures effectively increased the apparent activation energy required for complete volatilization, thereby elevating the characteristic temperatures—including that of the maximum mass loss rate—observed in the DTG profiles. Collectively, the interplay between heat transfer limitations and chemical kinetic barriers necessitated the application of higher temperatures to achieve efficient pyrolysis at elevated heating rates.
To quantitatively assess the pyrolytic reactivity inferred from the thermal profiles, the apparent activation energy (Ea) was determined. This parameter defines the minimum energy barrier that must be overcome for the reaction to proceed, where a lower value signifies a more thermodynamically favored process[28]. The isoconversional plots generated using the FWO, KAS, and Starink methods are presented in Supplementary Fig. S1, all of which exhibited strong linearity (R2 > 0.993). The close agreement of the Ea values derived from these independent methods, with a deviation of less than 1.3% between the FWO and KAS models, strongly indicated that the pyrolysis of WPF was governed by a single dominant reaction mechanism across the investigated conversion range. As summarized in Table 2, the average activation energy for the conversion range of α = 0.1–0.9 was calculated to be 232.5 ± 6.3 kJ/mol, providing a reliable quantitative baseline for the thermal degradation kinetics of this material.
Table 2. Apparent activation energy (Eɑ, kJ/mol) values of WPF pyrolysis with the FWO, KAS, and Starink methods
Conversion FWO KAS STA E (kJ/mol) R2 E (kJ/mol) R2 E (kJ/mol) R2 0.1 227.3 0.99855 226 0.9984 234 0.9984 0.2 233.7 0.99713 232 0.9969 224 0.9969 0.3 237.5 0.99388 236 0.9933 226 0.9934 0.4 238.5 0.99357 237 0.9929 234 0.9930 0.5 239.1 0.99534 236 0.9952 232 0.9949 0.6 237 0.99775 235 0.9975 235 0.9976 0.7 233.1 0.99968 231 0.9997 229 0.9997 0.8 228.9 0.99972 227 0.9997 223 0.9997 0.9 220.6 0.99603 220 0.9955 206 0.9956 A detailed analysis of the activation energy (Ea), as a function of conversion (α), revealed a nonlinear dependency, signifying an evolution in the rate-limiting steps throughout the pyrolysis process (Table 2). In the initial stage (α < 0.4), Ea increased from 229.1 kJ/mol at α = 0.1 to 233.2 kJ/mol at α = 0.3, an increase of 1.7%. This rising trend was likely attributable to the prior photo-oxidative degradation of the WPF and the presence of oxygen-containing additives, both of which can modify the initial polymer structure and elevate the energy required for decomposition[29]. During the main reaction stage (α = 0.4–0.6), a peak Ea value was observed at α = 0.5. This maximum was consistent with the high energy barrier characteristic of random scission within the polyolefin backbone, a process controlled by chemical kinetics and well-described by a first-order reaction model. In the final stage (α > 0.6), a systematic decrease in Ea was observed, culminating at 215.3 kJ/mol by α = 0.9—a reduction of approximately 9.5% from the peak value. This decline suggested a shift in the dominant mechanism, from the kinetically controlled bond cleavage to a regime influenced by diffusion limitations. The accumulating pyrolytic carbon layer likely impeded the egress of volatile products, thereby lowering the apparent activation energy. Furthermore, the average Ea for WPF was found to be significantly higher than values typically reported for pure LDPE[30]. This discrepancy could be rationalized by the long-term environmental exposure of the WPF, including ultraviolet radiation[29], and the presence of industrial additives such as heat stabilizers and antioxidants, which collectively enhance the thermal stability of the polymer matrix.
While model-free methods provide a reliable estimation of the activation energy without presupposing a reaction model, they offer limited insight into other kinetic parameters. To gain a more comprehensive kinetic description, model-fitting approaches were employed, which explicitly account for the reaction mechanism function, f(α). This enables the simultaneous determination of the pre-exponential factor (A), and the identification of the most probable reaction model[31]. Among these, the Criado method is particularly advantageous as it is independent of heating rate and relies exclusively on the functional form of the kinetic model. To identify the dominant reaction mechanism, the experimental curve of y(α) = f(α)/f(0.5) vs conversion (α), obtained at a heating rate of 5 °C/min, was compared against a library of theoretical master plots of z(α) = g(α)/g(0.5) vs α, as presented in Fig. 3. The optimal match between the experimental and theoretical profiles pinpointed the governing reaction mechanism for WPF pyrolysis.
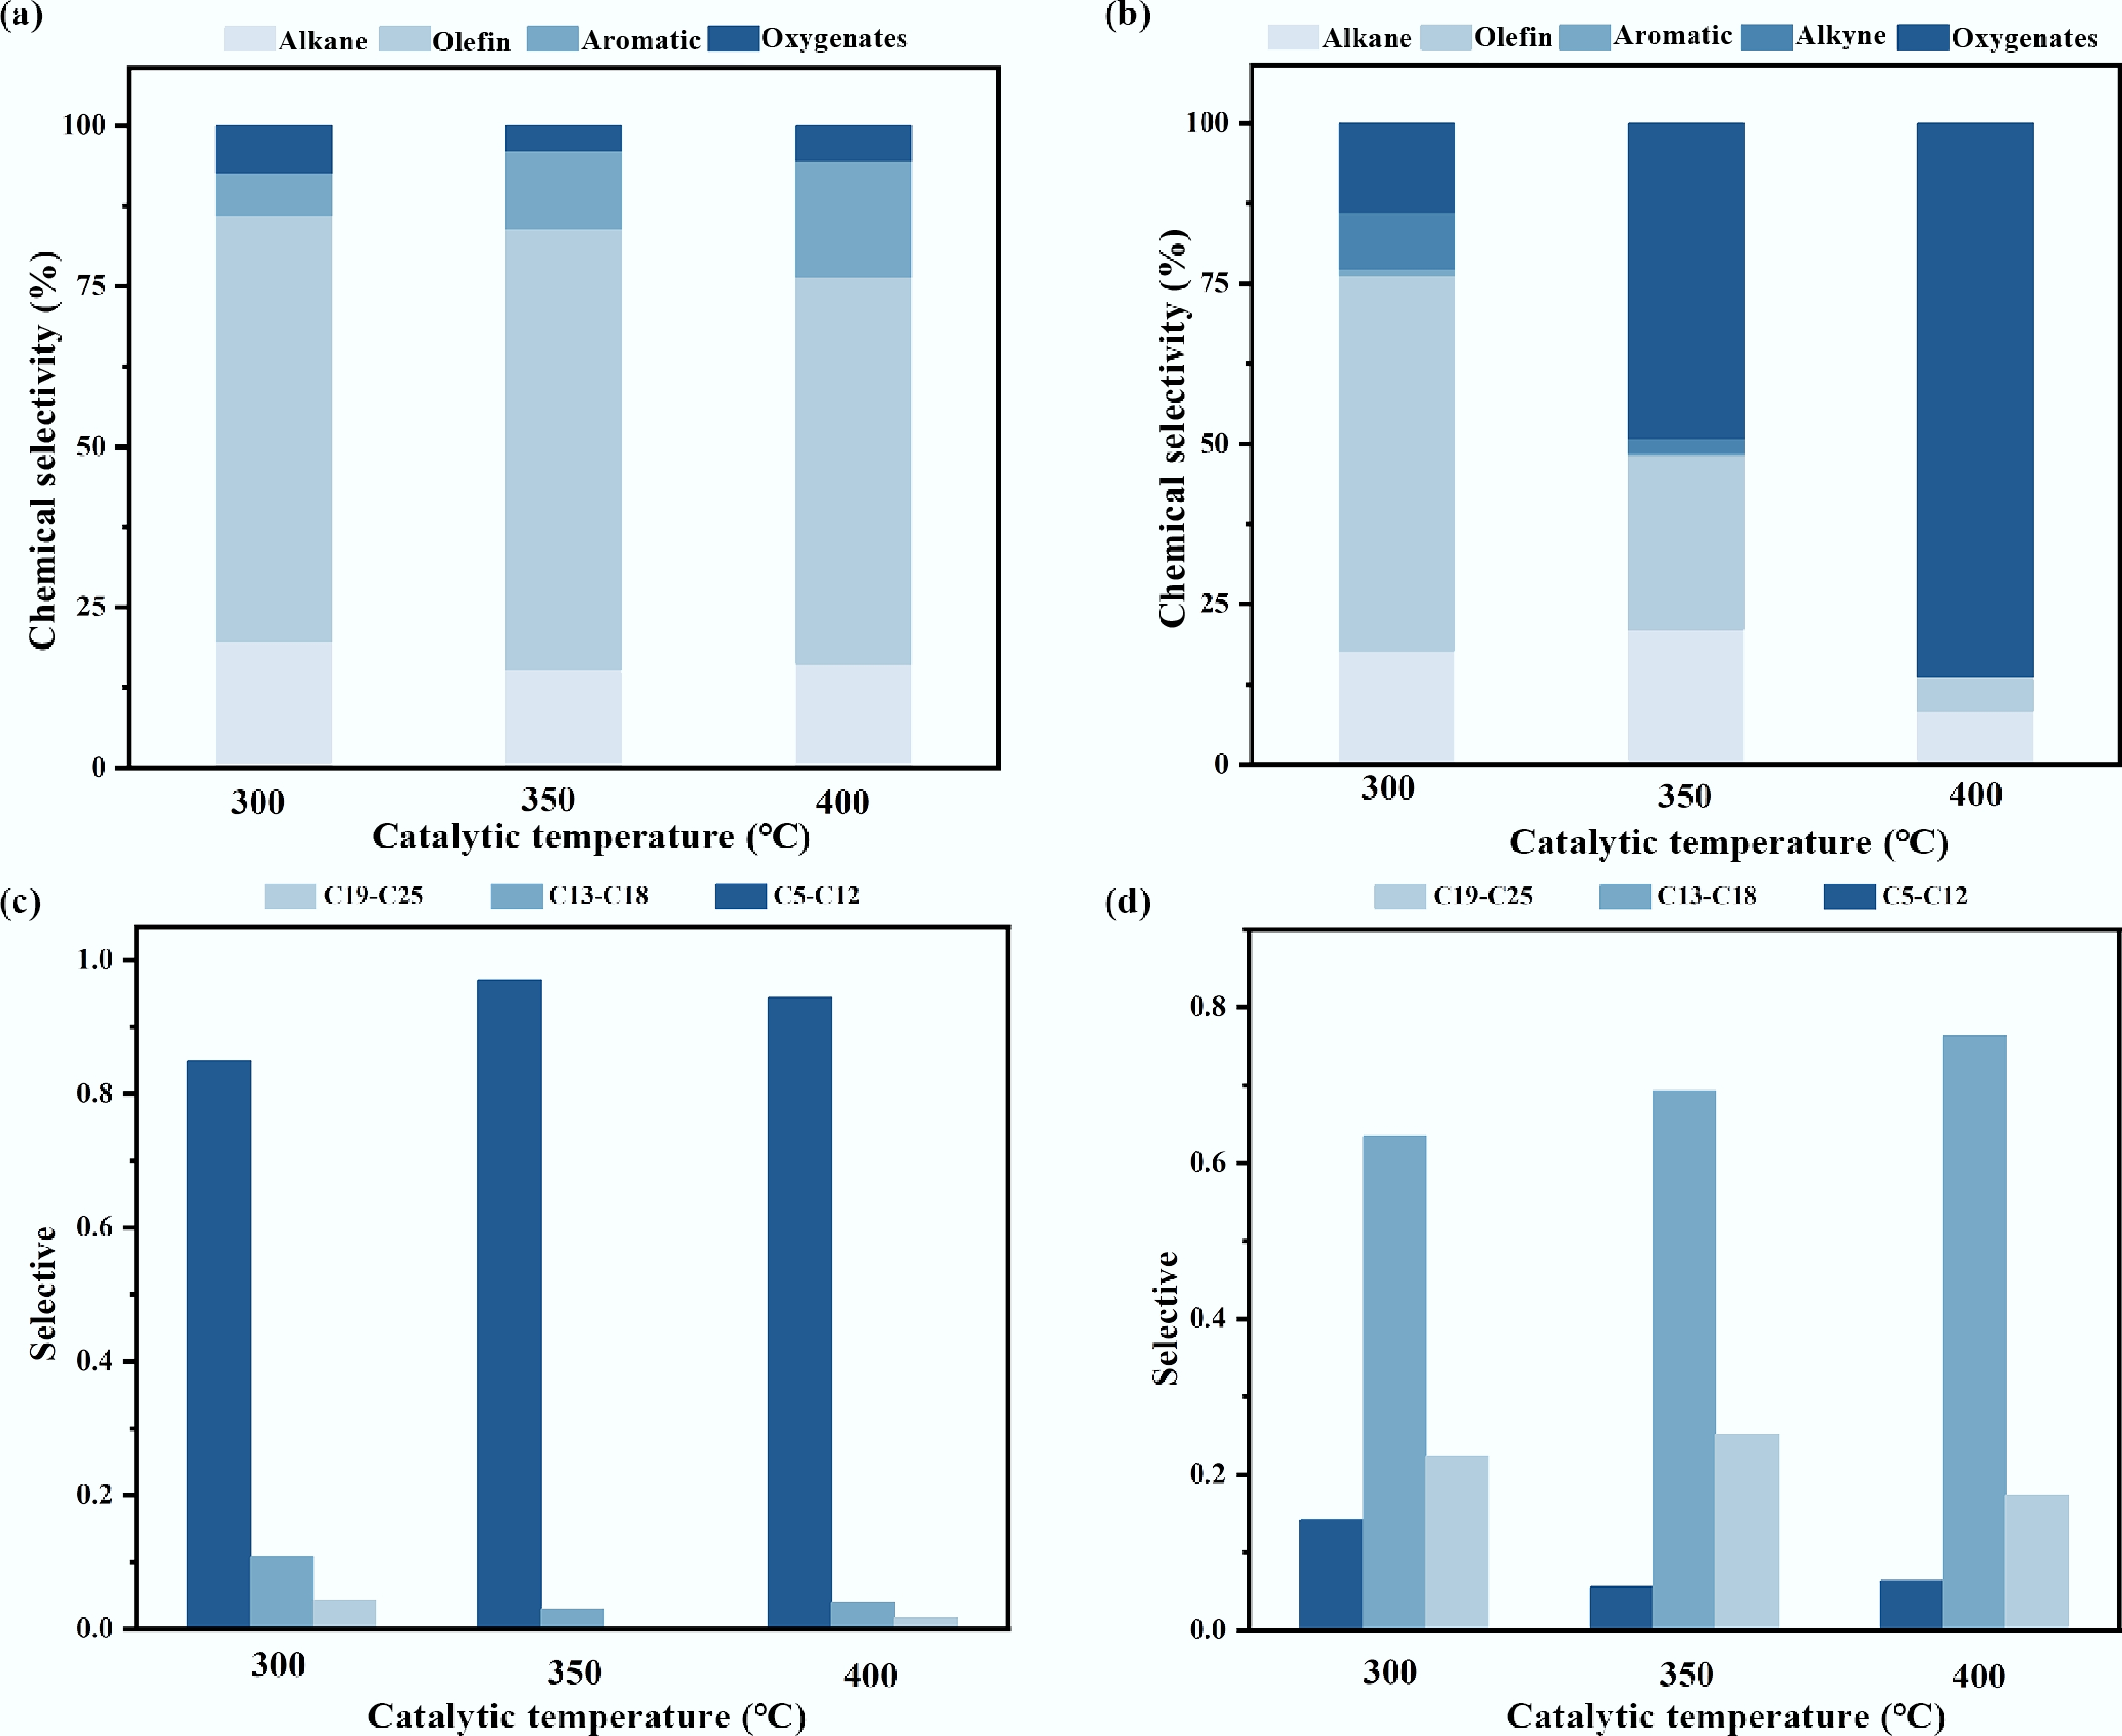
Figure 3.
Product analysis in ex-situ catalytic pyrolysis: (a) Selective of pyrolysis oil components; (b) Selective of tar components in catalysts; (c) The carbon number distribution of the pyrolysis oil components; (d) Carbon number of tar in the catalyst.
The master plot analysis revealed that the experimental data across the majority of the conversion range (α = 0.2–0.9) were most accurately described by the F2 nucleation model. As shown in Fig. 3, the theoretical curve for this model aligned almost perfectly with the experimental data points, demonstrating the best fit among all candidate mechanisms. A slight deviation was observed only at the very initial stage (α = 0.1–0.2), which was likely due to the interfering decomposition of oxygen-containing groups within the WPF. The F2 model corresponds to a kinetic mechanism of random nucleation followed by growth. This identified mechanism implied that the pyrolysis of WPF, primarily composed of LDPE, initiated at discrete, vulnerable sites. These sites included the roots of long-chain branches, residual catalyst particles, or tertiary carbon atoms distributed randomly along the polymer backbone. The formation of these initial radical sites is a stochastic process in both time and spatial location[32]. Once nucleated, these reactive sites propagate along the polymer chains, instigating subsequent chain reactions such as β-scission, and intermolecular radical transfer[17]. This autocatalytic growth process ultimately leads to the rapid reduction of molecular weight and the concerted release of volatile fragments.
Catalytic analysis
Catalytic pyrolysis products
-
The coke deposition on the catalysts and the composition of the pyrolysis oil were systematically analyzed to elucidate the temperature-dependent behavior. The product distribution quantified by mass yield is summarized in Supplementary Table S1. The pyrolysis oil yield reached a maximum of 72.0 wt% at 350 °C, aligning perfectly with the peak olefin selectivity (69%), indicating optimal conditions for target liquid production. Conversely, the gas yield increased significantly from 21.2 wt% at 300 °C, to 30.4 wt% at 400 °C, while the tar deposition decreased accordingly. The amount of tar deposited, quantified by the mass difference of the catalysts before and after testing, decreased with increasing catalytic bed temperature in the following order: 0.63 g at 300 °C > 0.41 g at 350 °C > 0.28 g at 400 °C. Subsequently, automated surface area and porosity analysis (BET) was conducted on both fresh and spent walnut shell biochar catalysts. The results revealed a significant difference in specific surface area between the two (Supplementary Table S2), confirming severe pore clogging by tar in the catalyst after use. Furthermore, the present study found that the components of the tar clogging the catalyst include hydrocarbons, which have been clearly confirmed by Fourier transform infrared spectroscopy (FTIR) tests conducted on both fresh and spent walnut shell catalysts. The chemical composition and carbon number distribution of this deposited tar were subsequently characterized by GC-MS. The analysis confirmed a significant presence of the antioxidants 2246 and 264 within the oxygenated compound fraction. After excluding these identified antioxidant additives, the distribution of the remaining, reaction-derived oxygenated compounds is presented in Supplementary Fig. S2.
The product distribution at a catalytic temperature of 300 °C was characterized by a high yield of aliphatic hydrocarbons, and limited aromatic formation. As shown in Fig. 3a and c, the pyrolysis oil comprised 81% alkanes and alkenes, while aromatic compounds accounted for only 7%. The carbon number distribution was broad, with the C5–C12 fraction being the most predominant among all tested conditions. This product profile suggests that 300 °C primarily supplied the thermal energy for initial LDPE cracking, sufficient to initiate free-radical chain reactions but inadequate for fully activating the acid sites of the catalyst. Consequently, the process was dominated by a free-radical pyrolysis mechanism, leading to random chain scission and the formation of a diverse mixture of hydrocarbons[33]. The catalyst exhibited limited efficacy in promoting targeted bond cleavage and aromatization at this stage, possibly facilitating some isomerization and preliminary C=C scission, while more demanding reactions like efficient cyclization and dehydrogenation were constrained. Consistent with the oil composition, the tar deposited at 300 °C (Fig. 3b) was predominantly composed of alkenes and alkanes and contained the lowest abundance of oxygenated species. This tar primarily consisted of incompletely cracked heavy hydrocarbons (e.g, waxes and long-chain alkenes), which were retained within the catalyst pores via physical adsorption or weak chemisorption[34]. The prevalence of these heavy, non-volatile fragments explains the highest observed tar mass at this temperature. Conversely, their effective retention on the catalyst resulted in the lowest concentration of oxygenated compounds being released into the final pyrolysis oil.
When the catalytic temperature rises to 400 °C, the gas yield increases significantly, and the selectivity of liquid products also changed significantly, characterized by enhanced aromatization and reduced olefin yield. At the same time, the tar yield decreased. As delineated in Fig. 3a, the olefin content in the pyrolysis oil decreased to 60%, while the aromatic fraction increased to its maximum level of 18% among the three temperatures tested. Concomitantly, the carbon number distribution narrowed, with C13–C18 hydrocarbons becoming predominant. This profile indicated that the higher thermal energy robustly activated the catalyst's acid sites, significantly enhancing its cracking and aromatization functions. These activated sites effectively promoted secondary reactions such as oligomerization, cyclization, and dehydrogenation of primary olefinic intermediates, thereby converting them into aromatic compounds[35]. Correspondingly, the tar deposited at 400 °C exhibited the highest relative abundance of oxygenated compounds (Fig. 3b). This suggests that oxygen-containing groups originating from the WPF matrix readily interacted with the abundant surface oxygen functional groups on the phosphoric acid-activated biochar catalyst, facilitating in-situ esterification and other condensation reactions that incorporated oxygen into the tar structure[36]. The abundant functional groups identified in the FTIR (Supplementary Fig. S3) of the catalyst verify the possibility of this phenomenon. The high catalytic activity at this temperature ensured efficient cracking of hydrocarbon precursors, leading to the lowest total tar yield. Furthermore, the active sequestration of oxygenated species into the solid tar phase via chemical reactions resulted in their relatively low concentration in the volatilized pyrolysis oil.
At the intermediate temperature of 350 °C, the catalytic pyrolysis exhibited optimal selectivity for olefin production. The pyrolysis oil attained the highest olefin content (69%) observed in this study, coupled with a distinct shift in the carbon number distribution toward lighter C5–C12 hydrocarbons (Fig. 3a). This product distribution is characteristic of a carbocation-mediated reaction pathway facilitated by the catalyst's strong acid sites. These sites preferentially adsorb and protonate olefinic intermediates, generating carbocations that readily undergo selective β-scission, which is responsible for the high yield of light olefins[8]. A concurrent series of secondary reactions, including oligomerization, cyclization, and dehydrogenation of a portion of these olefins and dienes on the acid sites, led to an increase in the aromatic content to 15%. The composition of the deposited tar at this temperature was intermediate between that observed at 300 and 400 °C. The proportion of oxygenated compounds was moderate, and a noticeable reduction in C18–C24 heavy hydrocarbons was evident compared to the 300 °C condition (Fig. 3b). These observations regarding the intermediate nature of the deposits and the efficient cracking of heavy components were further corroborated by scanning electron microscopy analysis of the spent catalysts (Supplementary Fig. S4).
Tar kinetics analysis
-
Building on the distinct compositional profiles of the deposited tar, their thermal degradation behavior and reactivity were further investigated to elucidate the catalyst deactivation mechanism. Thermogravimetric analysis (TGA) was performed on the spent catalysts to probe the nature of the carbonaceous deposits. To clarify the thermal behavior of the deposited tar and compare it with the thermal stability of the catalyst support itself, thermogravimetric analysis (TGA) was first conducted on the fresh catalyst (Supplementary Fig. S5). As shown in Supplementary Fig. S5, under an inert atmosphere, the fresh catalyst exhibited only a negligible mass loss when heated from room temperature to 800 °C, which was mainly attributed to the removal of residual water at around 100 °C, and the pyrolysis of a trace amount of surface oxygen-containing functional groups. This result demonstrates that the catalyst support possesses excellent thermal stability within the catalytic reaction temperature range adopted in this work (≤ 400 °C). Therefore, the significant mass loss observed for the spent catalyst in subsequent tests can be fully ascribed to the thermal decomposition of the deposited tar rather than the consumption of the catalyst itself. Figure 4 displays the mass loss profiles of these catalysts from room temperature to 800 °C. Distinctive TGA patterns were observed for catalysts used at each temperature, reflecting fundamental differences in the structure and thermal stability of the deposited species.
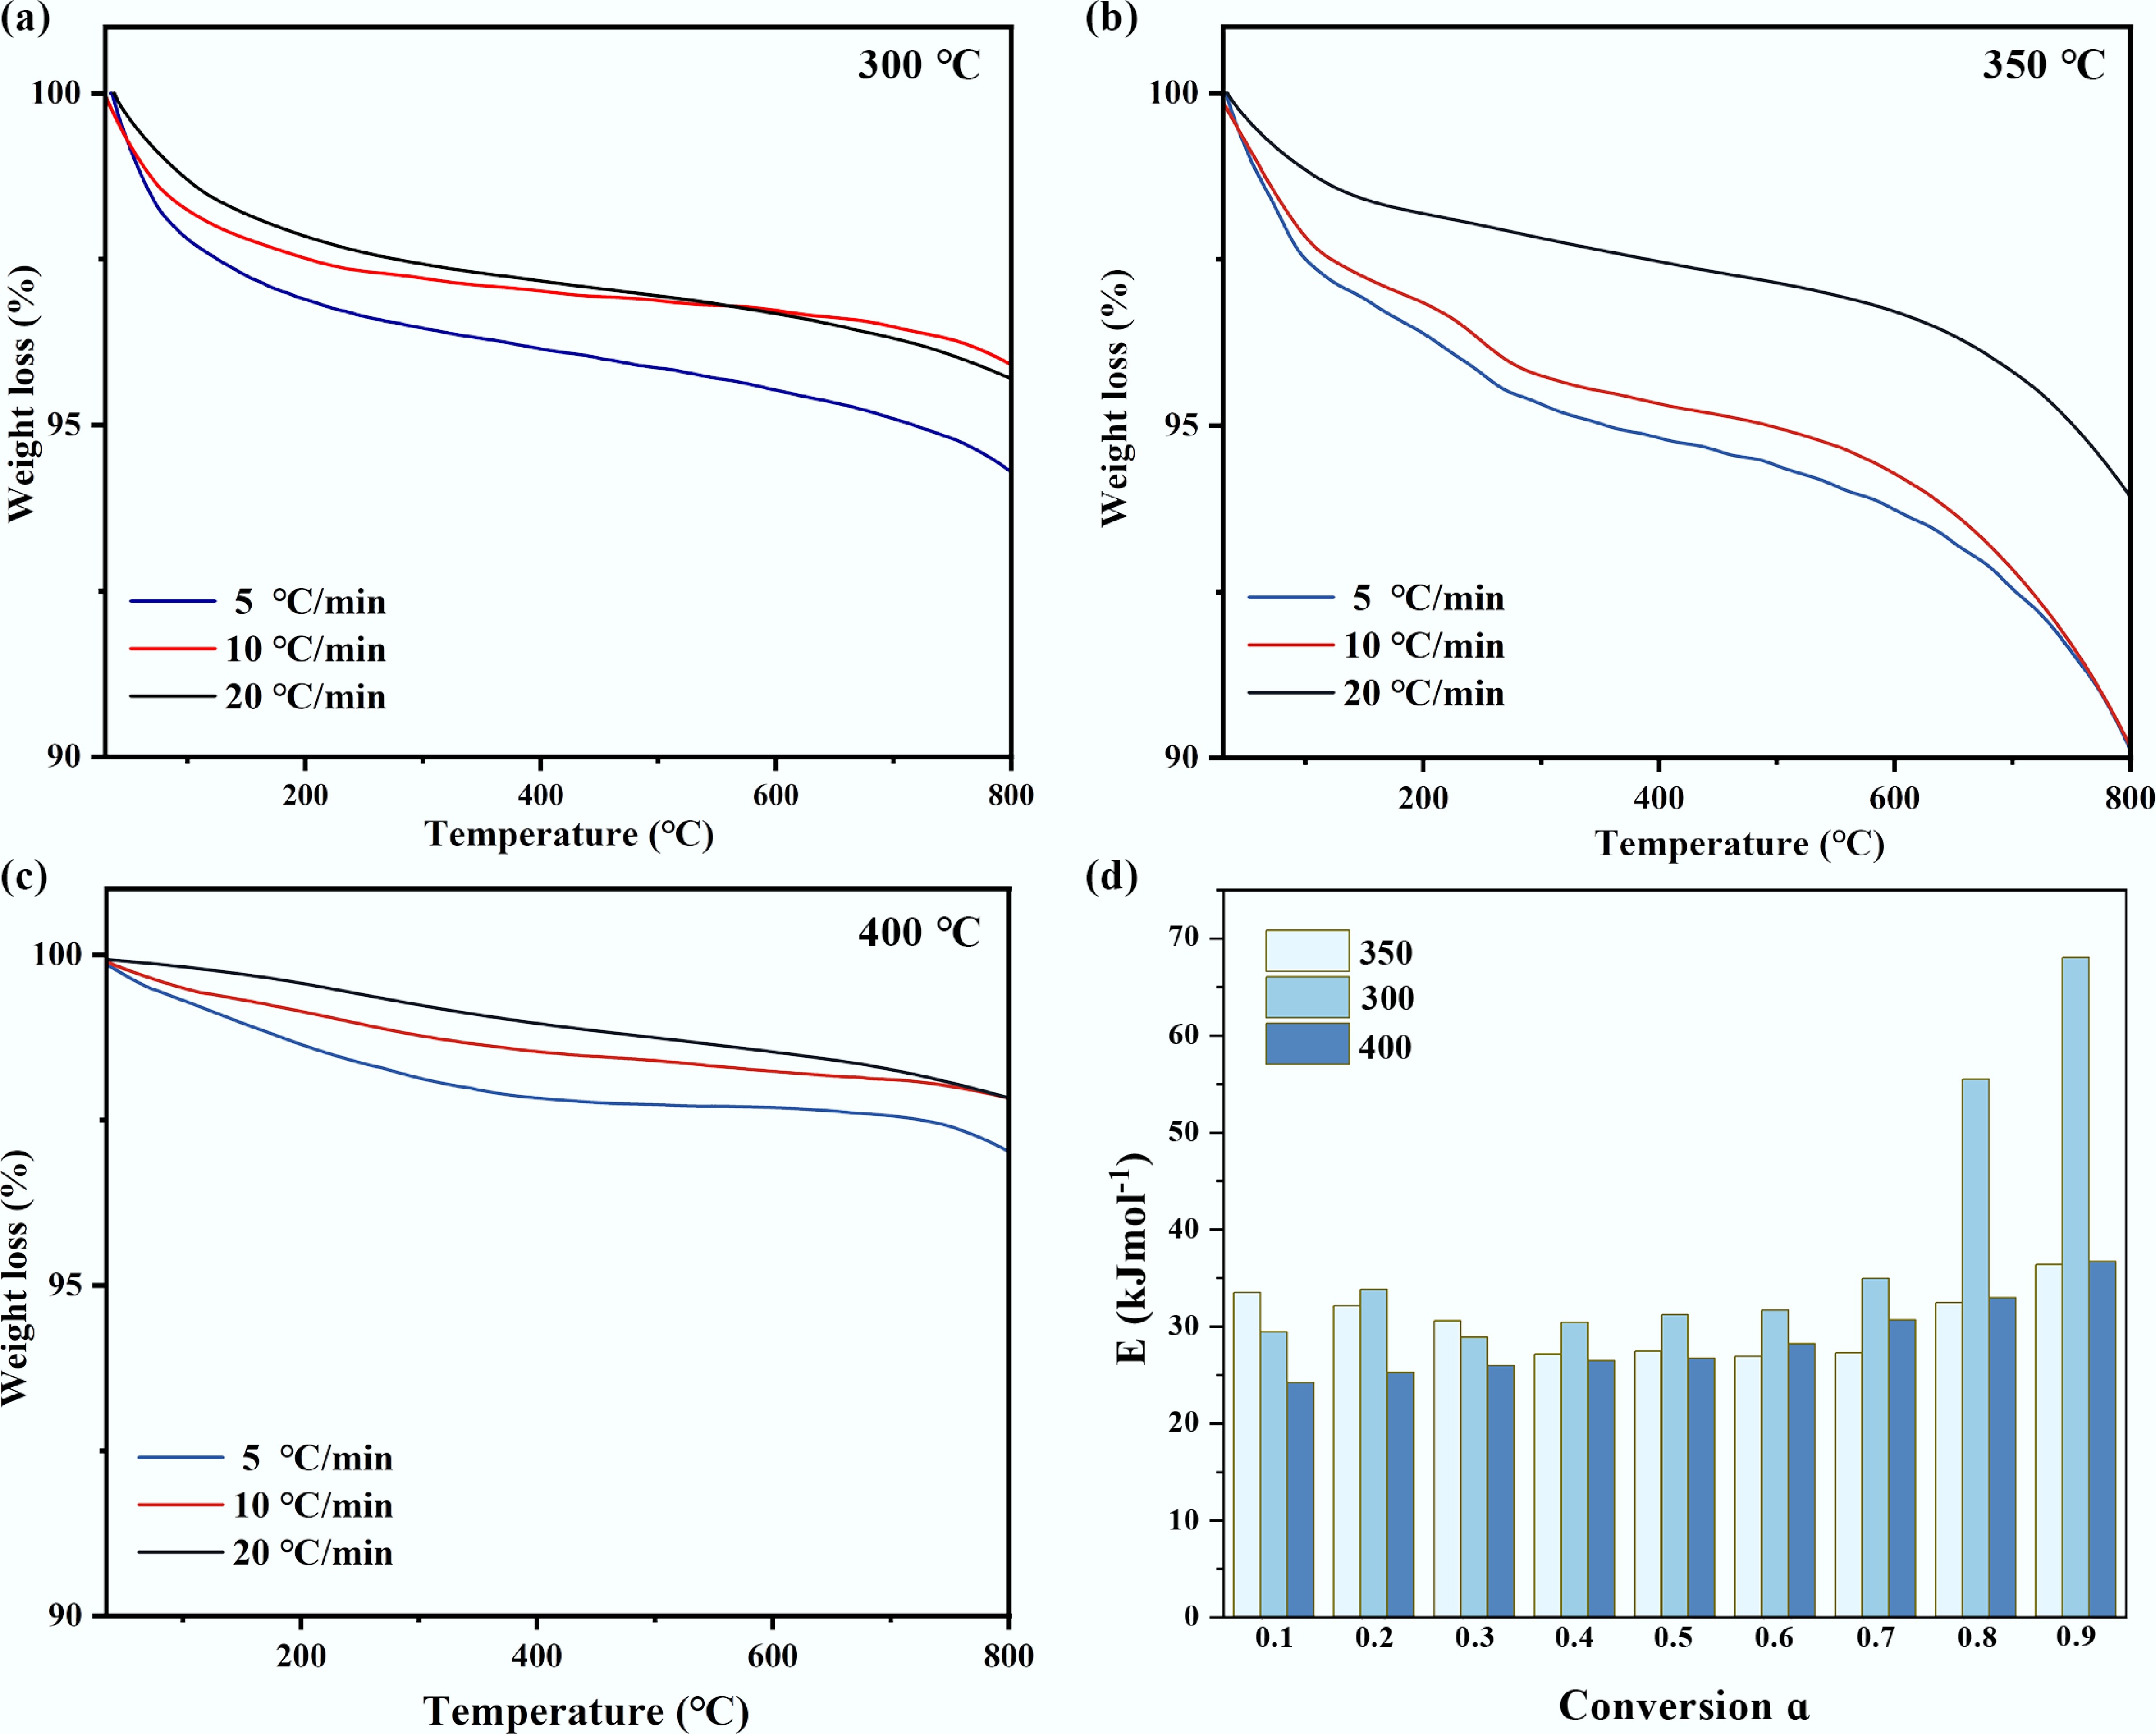
Figure 4.
TG of waste catalysts at different catalytic temperatures: (a) 300 °C, (b) 350 °C, (c) 400 °C, (d) activation energy distribution of tar obtained by the model-free method of pyrolysis kinetics.
The spent catalyst from the 300 °C reaction exhibited a broad mass loss range from 125 to 550 °C. The initial minor mass loss at lower temperatures was attributable to the volatilization of light oxygenated compounds, such as antioxidant additives. The TGA profile, marked by a high onset temperature and a wide decomposition window, was indicative of a tar deposit dominated by heavy hydrocarbons with high boiling points. This finding was consistent with the GC-MS results, which identified a high proportion of long-chain n-alkanes and alkenes (C18–C25) in the tar. The prevalence of these high-molecular-weight species, coupled with the observed thermal stability, confirmed that the deposited tar primarily consisted of incompletely upgraded primary pyrolysis products. This outcome was a direct consequence of the insufficient activation of the catalyst's acid sites at 300 °C, which limited profound cracking and led to the physical deposition of these heavy, non-volatile fragments.
In stark contrast, the TGA curve for the catalyst used at 400 °C was characterized by a sharp, single-step mass loss. This distinct profile signified a tar composition with minimal long-chain hydrocarbons but enriched with low-boiling-point plastic additives (e.g., antioxidants) and, more critically, complex oxygenated macromolecules formed in situ. While the additives volatilize at low temperatures, the oxygenated esters decompose at moderate temperatures due to the relative lability of bonds such as C–O and C–C bonds adjacent to carbonyl groups (β-position). The high-energy environment at 400 °C facilitated not only the volatilization and deposition of inherent additives but also drove vigorous acid-catalyzed reactions, including esterification and condensation, between LDPE-derived cracking fragments and oxygen-containing functional groups on the catalyst surface. Consequently, catalyst deactivation at this temperature was primarily caused by the chemical deposition of these catalytically generated, oxygen-rich macromolecular species, which effectively blocked the active sites.
The TGA profile of the tar deposited on the catalyst at 350 °C exhibited intermediate characteristics, with its peak decomposition temperature and apparent activation energy lying between the values observed for the 300 and 400 °C cases. This intermediate thermal stability reflected a transitional composition and structure of the carbonaceous deposits. The thermal behavior aligned with the GC-MS identification of specific esters as major tar components. This observation suggested that 350 °C represented an optimal functional window for the catalyst: the acid sites were sufficiently activated to efficiently catalyze selective β-scission, yielding the target olefins collected in the pyrolysis oil, yet simultaneously promote competing surface reactions such as esterification[37]. Consequently, the tar formed at this temperature was a competitive product arising from the coexistence of the desired catalytic pathway and unavoidable side reactions, ultimately leading to specific chemical poisoning of the active sites.
Furthermore, the peak decomposition temperature of the deposited tar systematically shifted to higher values with increasing TGA heating rates, confirming that tar cracking was a kinetically controlled process. This finding validates the subsequent application of pyrolysis kinetic analysis.
The activation energies for the tar deposited at each catalytic temperature, calculated using model-free methods, are summarized in Tables 3−5. Notably, the activation energies for tar decomposition fell within a relatively narrow range of 40–60 kJ/mol across all catalytic temperatures. This range is significantly lower than the values reported for graphitized carbon (> 150 kJ/mol), and even below those typical of amorphous carbon (100–200 kJ/mol). These results strongly indicate that the carbon deposits in this ex-situ catalytic system consist primarily of highly amorphous, hydrogen-rich 'soft carbon' or 'soluble coke'[38], irrespective of the specific catalytic temperature employed.
Table 3. Apparent activation energy (Ea, kJ/mol) values of 300 °C tar pyrolysis with the FWO, KAS, and Starink methods
Conversion FWO KAS STA E (kJ/mol) R2 E (kJ/mol) R2 E (kJ/mol) R2 0.1 38.61 0.948 31.50 0.966 30.49 0.973 0.2 36.97 0.981 29.36 0.989 30.12 0.982 0.3 35.79 0.976 27.59 0.987 28.41 0.978 0.4 32.71 0.971 23.94 0.986 24.81 0.973 0.5 33.36 0.922 24.06 0.963 24.99 0.929 0.6 33.15 0.924 23.36 0.966 24.34 0.931 0.7 33.92 0.942 23.44 0.976 24.49 0.948 0.8 39.68 0.996 28.31 0.997 29.44 0.996 0.9 41.57 0.964 33.18 0.978 34.42 0.966 Table 4. Apparent activation energy (Ea, kJ/mol) values of 350 °C tar pyrolysis with the FWO, KAS, and Starink methods
Conversion FWO KAS STA E (kJ/mol) R2 E (kJ/mol)) R2 E (kJ/mol) R2 0.1 26.84 0.993 33.93 0.990 27.55 0.990 0.2 31.08 0.993 38.60 0.988 31.83 0.988 0.3 26.03 0.994 33.85 0.989 26.79 0.989 0.4 27.33 0.989 35.72 0.979 28.17 0.980 0.5 27.95 0.983 36.86 0.967 28.84 0.969 0.6 28.14 0.974 37.91 0.948 29.12 0.952 0.7 31.07 0.956 41.75 0.916 32.13 0.922 0.8 51.16 0.968 62.99 0.949 52.34 0.951 0.9 63.29 0.975 76.27 0.962 64.59 0.964 Table 5. Apparent activation energy (Ea, kJ/mol) values of 400 °C tar pyrolysis with the FWO, KAS, and Starink methods
Conversion FWO KAS STA E (kJ/mol) R2 E (kJ/mol) R2 E (kJ/mol) R2 0.1 28.92 0.992 21.53 0.989 22.27 0.989 0.2 30.16 0.993 22.38 0.990 23.16 0.990 0.3 31.22 0.991 22.86 0.986 23.84 0.988 0.4 31.96 0.995 23.33 0.994 24.20 0.994 0.5 32.49 0.998 23.40 0.998 24.31 0.998 0.6 34.30 0.999 24.67 0.998 25.64 0.999 0.7 37.15 0.999 26.93 0.998 27.95 0.998 0.8 39.86 0.999 29.02 1.000 30.10 0.999 0.9 44.06 0.999 32.44 0.998 33.60 0.998 The low activation energy for tar decomposition can be attributed to two primary factors concerning the chemical nature of the deposits, and the catalytic environment. Firstly, the tar is a complex mixture of hydrocarbons, encompassing compounds from waxy long-chain alkanes to mono- and poly-cyclic aromatics. The inherent presence of relatively weak chemical bonds—such as long-chain aliphatic C–C bonds and certain C–O bonds in oxygenated species—within these components lowers the overall energy barrier for their thermal scission[39]. Secondly, the phosphoric acid-activated walnut shell catalyst provides abundant acid sites, and a developed pore structure[40]. During pyrolysis, these active sites facilitate the continuous cracking and restructuring of deposited hydrocarbon species, effectively preventing the formation of highly stable, graphitized carbon structures and instead stabilizing the deposits in a more reactive, hydrogen-rich state[38].
The distribution of the apparent activation energy (Ea) of the tar decomposition reaction as a function of the conversion rate is shown in Fig. 4d. Its unique morphology directly reflects the regulation effect of temperature on the carbon deposition path. The catalytic temperature significantly affects the thermal stability of carbon deposits by regulating their chemical structure, which is reflected in the regular shift of activation energy with temperature change[41]. At a relatively low temperature of 300 °C, the carbon deposits were mainly composed of long-chain hydrocarbons with relatively intact molecular structures, which had high order and required overcoming a large energy barrier for pyrolysis, thus showing the highest activation energy (close to 60 kJ/mol). When the temperature rose to 400 °C, the catalytic cracking reaction intensified, generating a large number of active intermediates that rapidly polymerized to form highly disordered soft carbon structures. These carbon deposits had low bond energy and poor thermal stability, resulting in the activation energy dropping to the lowest range (40–50 kJ/mol). At the intermediate temperature of 350 °C, the cracking and polymerization processes tended to balance, and the formed carbon deposits had transitional structural characteristics, with their activation energy also lies between the above two. The above kinetic data mutually confirmed and systematically revealed the mechanism of the evolution path of carbon deposits with temperature changes: from physical condensation at low temperatures leading to pore blockage, to the formation of transitional states in the medium temperature zone, and then to the rapid pore filling process dominated by polymerization at high temperatures. The deactivation is due to carbon deposits.
Analysis of the tar formation mechanism
-
As delineated in the preceding analysis, the catalytic temperature critically governed the chemical nature, stability, and deactivation behavior of the deposited tar by modulating the available energy for surface reactions. As shown in Fig. 5, under the relatively mild condition of 300 °C, the activity of the catalyst was limited, the reaction was dominated by initial cleavage and isomerization, and the aromatization process was blocked, resulting in the lowest content of aromatic hydrocarbons in the product, and the highest proportion of oxygen-containing components that were not fully transformed[42]. Consequently, the high-molecular-weight carbon product had a stable structure, and was difficult to desorb or fracture, which corresponded to the highest apparent activation energy. When the temperature rose to the optimal point of 350 °C, the acid sites of the catalyst were efficiently activated, the reaction path shifted to one dominated by carbocation-mediated β-fracture, and a large amount of light olefin was generated. Simultaneously, the oxygenic intermediate was converted by a competitive esterification reaction, so that the tar composition reached a dynamic equilibrium between long-chain hydrocarbons and oxygenic compounds. Its thermal stability and apparent activation energy also showed moderate characteristics. Under the high temperature condition of 400 °C, the reaction entered the thermodynamic depth control region, which not only promoted the secondary conversion of olefin to aromatics, but also triggered the violent oxidation-esterification-condensation cascade reaction, which generated complex macromolecular esters and caused the proportion of oxygen-containing compounds to reach its peak[43]. These components were eventually converted into defect-rich oxygen-doped non-graphitized carbon layers, whose high intrinsic activity resulted in them being most easily gairfied during thermogravimetric analysis, exhibiting the lowest apparent activation energy. These three independent temperature points clearly outlined the complete evolution map of the reaction from kinetic restriction to thermodynamic domination, and of the catalyst from selective catalysis to deep transformation, and gradually facing inactivation.
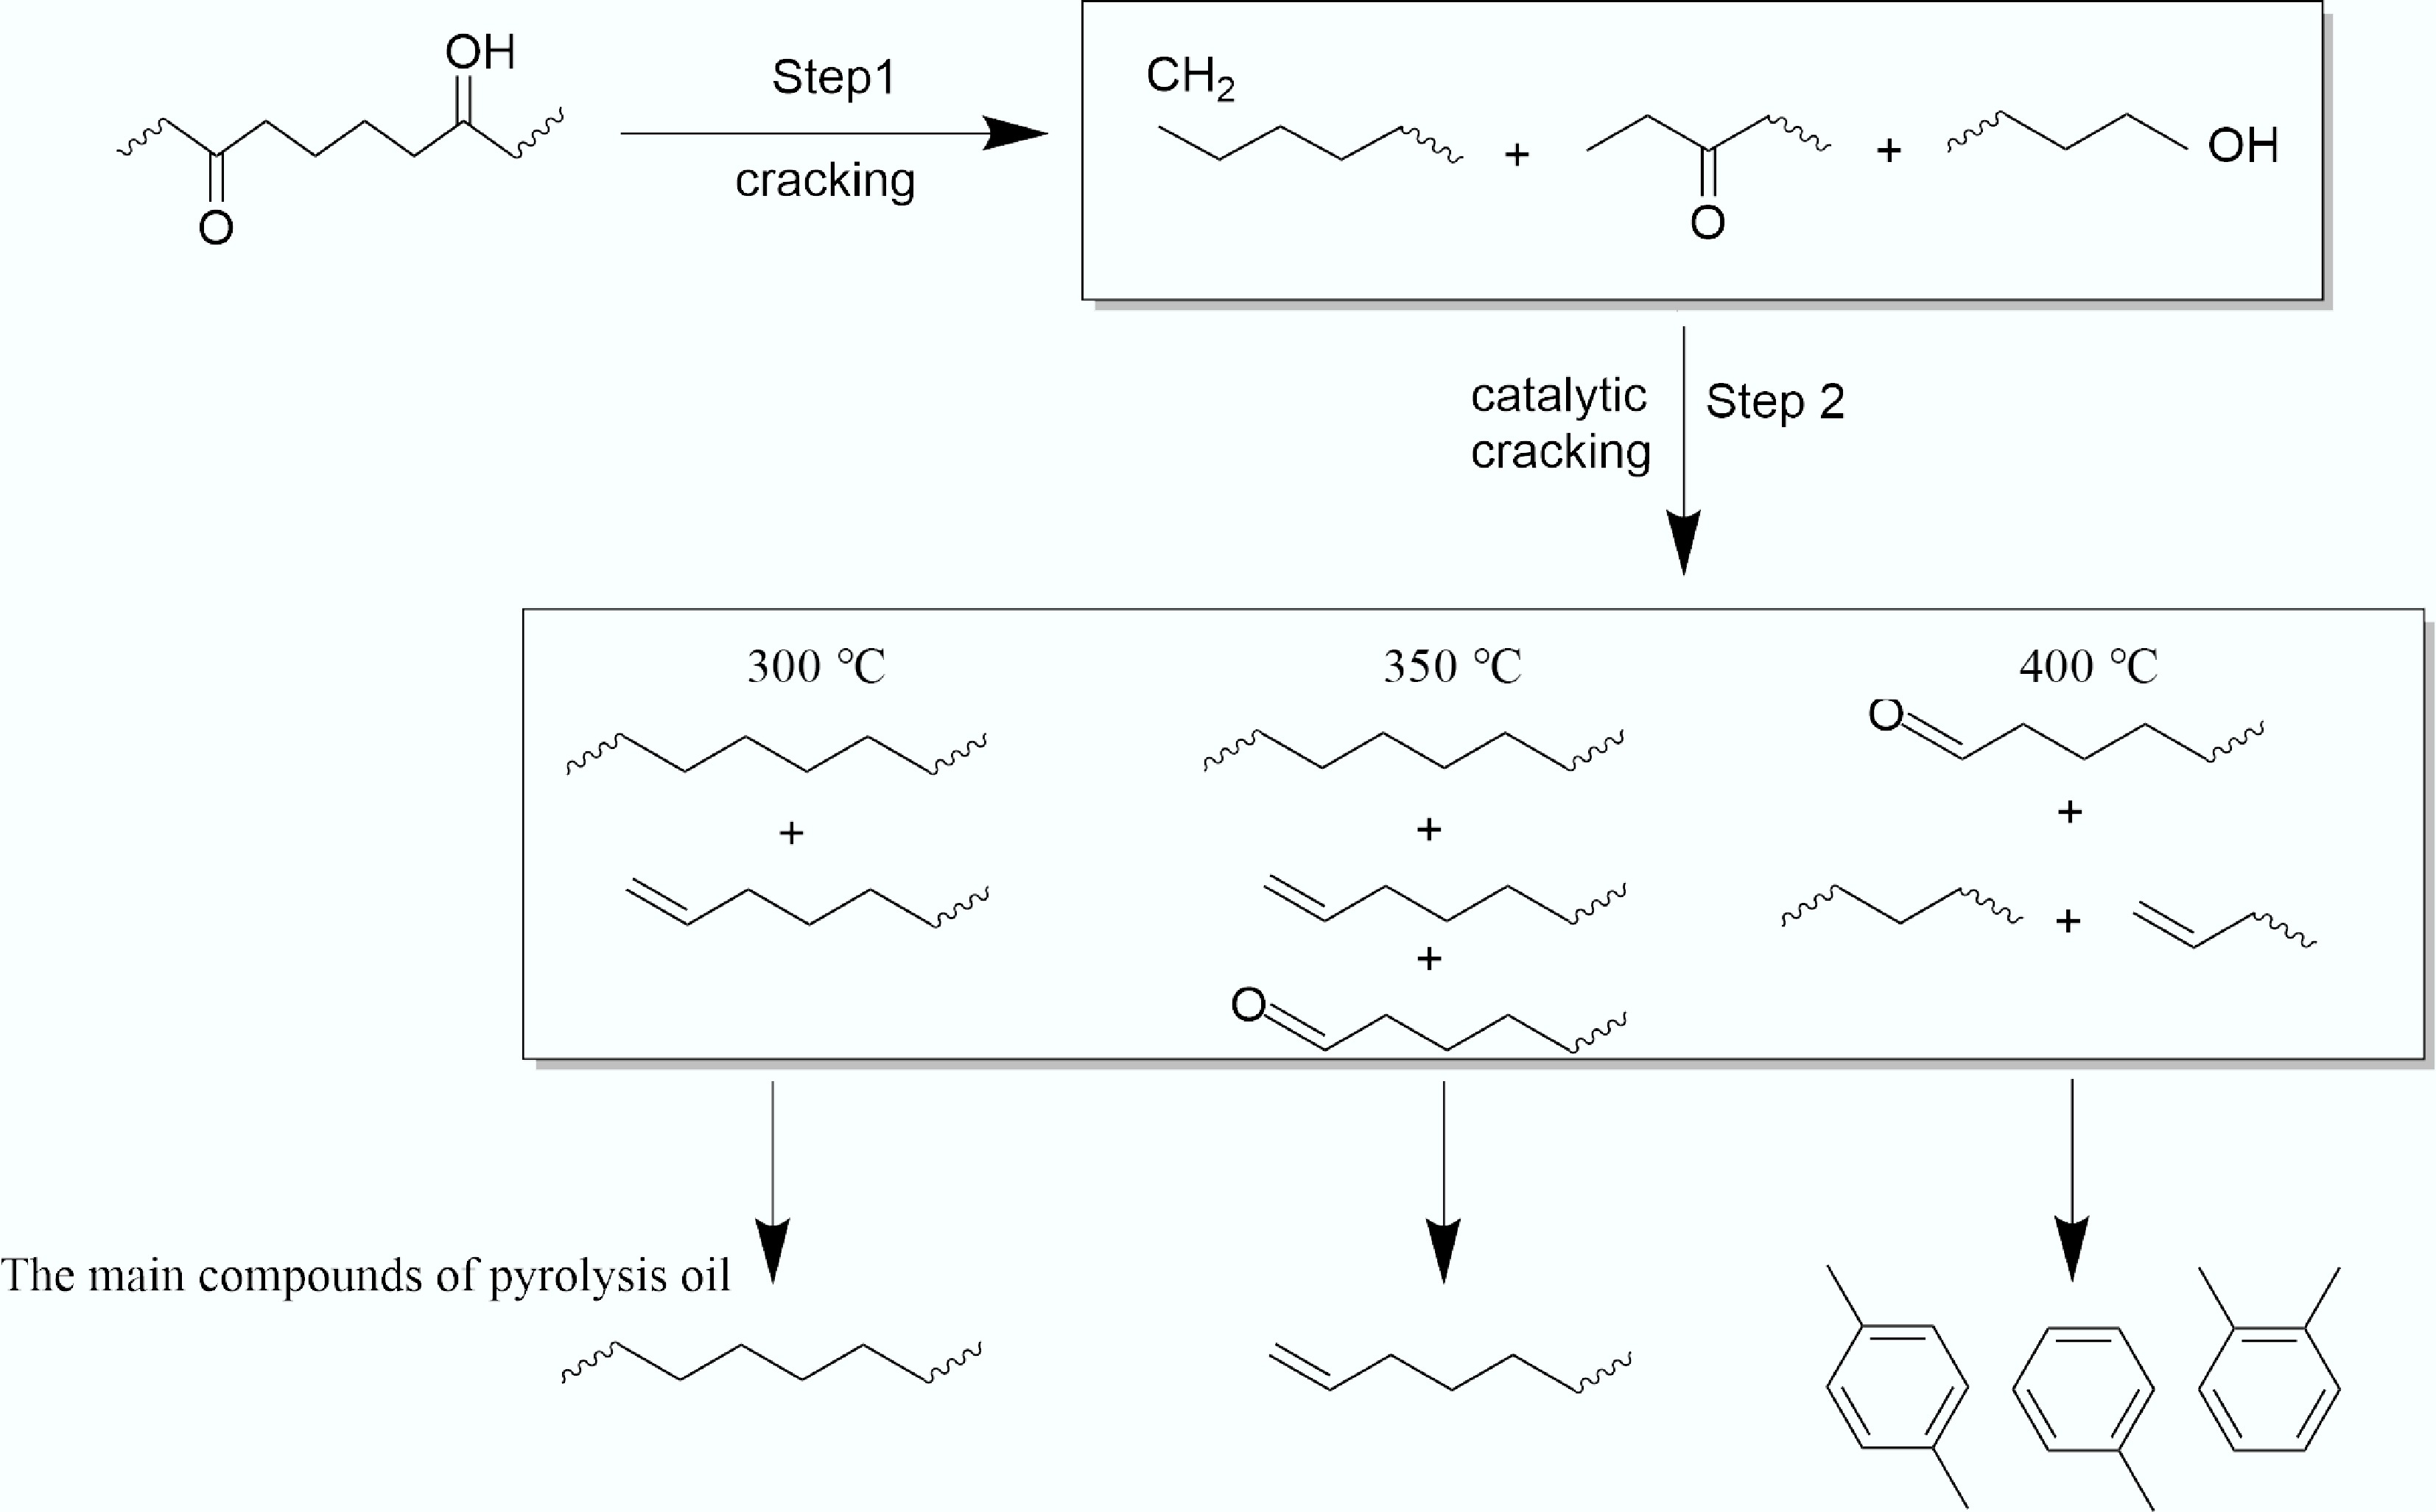
Figure 5.
Mechanism of tar formation in ex-situ catalytic pyrolysis of WPF.
-
This study indicates that catalytic temperature played a core regulatory role in the ectopic pyrolysis of WPF and its catalytic upgrading process. At a low temperature of 300 °C, the catalyst tended to physically adsorb heavy hydrocarbons that had not been fully converted, forming relatively stable tar. At 350 °C, the acid site was optimally activated, and olefins were efficiently generated through β-cleavage, but the associated esterification reaction produced moderately stable tar. At a high temperature of 400 °C, a deep reaction generated macromolecular ester tar rich in weak bonding structures, whose apparent activation energy was the lowest among the three. The research reveals a temperature-dependent trade-off between maximizing the target product and the long-term performance of the catalyst: the reaction Windows for optimizing olefin yield (350 °C) and maintaining the catalyst's regenerative capacity (400 °C) are mutually exclusive. By establishing the correlation between the chemical composition, thermal behavior and formation mechanism of carbon deposits, this study provides a diagnostic framework for understanding the catalyst deactivation in the actual catalytic upgrading process of waste plastics, and offers a key scientific basis for designing efficient and stable value-added strategies.
The SEM and GC-MS data were obtained with the assistance of the Analytical and Testing Center of Shihezi University.
-
It accompanies this paper at: https://doi.org/10.48130/scm-0026-0004.
-
The authors confirm their contributions to the paper as follows: All authors contributed to the study conception and design. Yunfeng Zhao: material preparation, writing − review and editing, and funding acquisition. Erguang Huo: writing − review and editing. Yunpu Wang: writing − review and editing, data curation. Leilei Dai: writing − review and editing. Haiyan Yan: writing − review and editing, funding acquisition. Jian Zhang: writing − review and editing, funding acquisition. Data collection and analysis were performed by Chentao Tan, Xiaoyan Lan, and Xun Chen. The first draft of the manuscript was written by Chentao Tan, and all authors commented on previous versions of the manuscript. Yuting Jiang and Hang Gou: validation. Yue Zhang: formal analysis. All authors reviewed the results and approved the final version of the manuscript.
-
The datasets used or analyzed during the current study are available from the corresponding author upon reasonable request.
-
Part of the financial support comes from the Xinjiang Production and Construction Corps Guidance Project (KX009303), the High-level Talent Project of Shihezi University (2022ZD060), the Training Project of Shihezi University (CXPY202212), the Tianchi Talent Young Doctor Project (CZ0023406), and the Key Field Innovation Team Construction Project of Xinjiang Production and Construction Corps (2019CB The financial support was provided by the Research Platform Project of Shihezi University (Project Number: KYPT201904) and the Key Laboratory of Nutrition and Special Food Safety of the Eighth Division of Shihezi City (2022PT02).
-
The authors declare that they have no conflict of interest.
-
A synergistic waste valorization of plastic film and walnut shells was achieved.
The formation mechanism of tar was deciphered by using pyrolysis kinetics.
A key trade-off exists between maximizing product yield and catalyst lifetime.
-
Full list of author information is available at the end of the article.
- The supplementary files can be downloaded from here.
- Copyright: © 2026 by the author(s). Published by Maximum Academic Press, Fayetteville, GA. This article is an open access article distributed under Creative Commons Attribution License (CC BY 4.0), visit https://creativecommons.org/licenses/by/4.0/.
-
About this article
Cite this article
Tan C, Lan X, Chen X, Wang Y, Dai L, et al. 2026. Controlling catalyst deactivation: temperature regulation for the directed synthesis of easily regenerable and refractory tar in the pyrolysis of waste films. Sustainable Carbon Materials 2: e008 doi: 10.48130/scm-0026-0004 

Controlling catalyst deactivation: temperature regulation for the directed synthesis of easily regenerable and refractory tar in the pyrolysis of waste films
- Received: 13 November 2025
- Revised: 15 January 2026
- Accepted: 21 January 2026
- Published online: 05 March 2026
Abstract: The pollution caused by waste plastic mulch film (WPF) poses a severe environmental issue. This study investigated the decisive role of catalytic bed temperature (300, 350, and 400 °C) in governing product selectivity and catalyst deactivation during the ex-situ catalytic pyrolysis of WPF using phosphoric acid-activated walnut shell biochar. By correlating pyrolysis oil composition with the chemical properties and pyrolysis kinetics of deposited tar, the temperature-driven evolution of reaction pathways was investigated. The results demonstrated that at 350 °C, the highest olefin selectivity (69%) in pyrolysis oil was achieved, but this condition promotes in-situ esterification, generating oxygen-containing tar that induces chemical deactivation. In contrast, at 400 °C, aromatization was enhanced (aromatics content reaches 18%), while carbon deposits evolve into a highly reactive O-doped structure. Kinetics analysis revealed that the tar formed at 300 °C exhibits the highest apparent activation energy (close to 60 kJ/mol), and that at 400 °C, the lowest (40–50 kJ/mol), indicating improved regenerability at higher temperature. This work highlights a temperature-controlled trade-off: while 350 °C maximizes target olefin production, 400 °C facilitates the formation of more readily regenerable coke. These findings provide critical guidance for designing selective and regenerable catalysts for plastic upcycling.
-
Key words:
- Plastic mulch film /
- Catalytic pyrolysis /
- Ex-situ catalysis /
- Tar formation /
- Pyrolysis kinetics