


-
Urban forests constitute a critical component of urban ecosystems, offering irreplaceable services such as carbon sequestration and oxygen release, microclimate regulation (cooling and humidification), air pollution mitigation, water quality improvement, and biodiversity conservation. These functions position urban forests as nature-based solutions for enhancing urban sustainability[1,2]. Global warming has markedly increased both the intensity and frequency of drought events, exerting substantial negative impacts on forest ecosystems[3]. However, most reports have concentrated on arid and semi-arid regions, whereas seasonal droughts in humid and sub-humid regions have received comparatively limited attention[4,5]. Studies indicate that forest ecosystems in humid regions are more sensitive to drought events than those in drier climates, exhibiting greater declines in forest productivity and elevated mortality rates[6]. This sensitivity is particularly pronounced in urban forest ecosystems, where rapid urbanization further exacerbates environmental problems—such as the urban-heat-island and urban-dry-island effects—thereby increasing the threats to forest health[7,8]. Timely and accurate monitoring of drought events in urban forests is an essential prerequisite for mitigating their adverse impacts. Such monitoring is critical for assessing ecosystem health, managing drought-related risks, and exerting the potential service functions of the ecosystem.
Due to the lack of effective indicators, tracking the daily water status of urban-forest ecosystems still faces many challenges[9]. It is well established that the earliest phase of drought is perceived by root systems, which respond by synthesizing and translocating abscisic acid (ABA) to the leaves. Elevated ABA concentrations in the apoplast of guard cells trigger rapid stomatal closure, thereby increasing diffusive resistance within the leaf and suppressing transpiration. Consequently, stomatal conductance (gs) is considered the most sensitive indicator of plant water deficit and provides a mechanistic basis for the early detection of drought stress[10], whereas transpiration rate (Tr) quantifies the actual water consumption of the plant. Nevertheless, the acquisition of gs and Tr demands professional equipment capable of only single-point measurements that are operationally challenging, labor-intensive, and often impractical in tall-stature trees[11,12]. Eddy covariance systems enable direct, automated determination of canopy conductance (gc), evapotranspiration rate (ETa), and its energy equivalent, latent heat flux (LE), at the ecosystem scale. However, their high cost, intensive maintenance, strict theoretical assumptions, and large source-area requirements limit their widespread deployment in urban forests[13]. Additionally, soil water content (SWC) and vapour pressure deficit (VPD), representing root-zone water supply and atmospheric evaporative demand, respectively, are both tightly coupled to vegetation growth and readily available, rendering them widely used indirect indicators of ecosystem water status. The IPCC Sixth Assessment Report, for instance, uses SWC and VPD to evaluate drought status in forest ecosystems. However, studies indicate that low SWC is the principal determinant of drought risk in arid regions[14], whereas in humid regions, vegetation growth is more sensitive to changes in VPD[15].
Declines in gs and Tr weaken the evaporative cooling process, resulting in elevated canopy temperature (Tc). Since Tc responds rapidly to stomatal behavior, it acts as a sensitive indicator of plant water deficit and can provide early warning of drought events. However, Tc is the result of the canopy energy balance and is influenced not only by plant water status but also by external environmental factors[16]. To overcome this defect, Tc or the canopy-air temperature difference (dT) must be normalized using thermal indices. Currently, commonly used thermal indices include the empirical plant water stress index (PWSIe), the theoretical plant water stress index (PWSIt), and the simplified plant water stress index (PWSIs)[17]. These thermal indices are derived, respectively, from (1) the empirical negative relationship between dT and VPD under well-watered conditions, known as the non-water-stressed baseline (NWSB)[18]; (2) the canopy energy balance and the Penman-Monteith equation[19]; and (3) artificial or natural dry- and wet- reference surface temperatures[20]. Each approach defines the Tc or dT expected under non-water-stressed and non-transpiring conditions, thereby normalizing the observed Tc or dT. Due to the flexibility of mounting thermal infrared cameras on platforms such as towers, unmanned aerial vehicles (UAVs), or satellites, these thermal indices may be well-suited for daily monitoring of water status in patchily distributed urban forest ecosystems. However, to date, research on water status monitoring technology based on Tc has primarily focused on crops such as maize, wheat, cotton, rice, sunflower, soybean, and pumpkin[17,21−23].
Unlike annual crops, perennial woody plants generally adopt conservative water-use strategies to enhance stress tolerance[24,25]. This conservatism lowers transpirational cooling and weakens the Tc response to water deficit relative to annual crops. Additionally, the taller canopies of woody plants exhibit greater aerodynamic roughness for momentum and heat exchange, further weakening the expression of water-status differences in Tc[26]. Combined with the high variability of Tc caused by environmental influences, this may increase the difficulty of detecting drought in trees by thermal approaches. Moreover, the plant water stress index (PWSI) based on Tc was originally developed in the arid climate of Arizona, USA, where strong atmospheric evaporative demand amplifies transpirational forcing and facilitates the diagnosis of plant water status. However, in the low atmospheric evaporative demand of humid-region urban forests, the performance of PWSI in detecting the water deficit of perennial woody vegetation remains unclear and needs to be systematically evaluated. Additionally, the optimal monitoring window must be determined in order to facilitate future UAV-based urban forest water status diagnosis.
Nanchang, a major forest city in China, has a forest coverage of 21.27%. Although located in a humid climatic zone, the city is regularly subjected to seasonal drought events (summer and autumn droughts) that increasingly threaten the health of its urban forests. The extreme drought of 2022, for example, caused partial tree mortality across the region[27,28]. Against this background, continuous measurements of Tc, ecosystem-scale water fluxes, and key meteorological variables were conducted within Nanchang's urban forest. The objectives were: (1) to assess the suitability of traditional water-status indicators and canopy-temperature-based thermal indices for detecting water deficits in humid-region urban forests; (2) to elucidate the underlying reasons for their performance; and (3) to determine the optimal monitoring window.
-
This study was conducted at the Jiangxi Nanchang Urban Ecosystem Observation and Research Station (28°45′ N, 115°46′ E, average altitude: 248.50 m), which is located 12.5 km from downtown Nanchang, China (Fig. 1). The study area has a subtropical humid monsoon climate, with an average annual temperature of 17.40 °C and an average annual precipitation of 1,848.70 mm. The soil type at the station is dominated by red earth and mountain yellow-red earth. Also, the main tree species in the plantation area include Quercus acutissima, Sassafras tzumu, Cinnamomum camphora, Taxus chinensis var. mairei, and Magnolia denudata, covering an area of approximately 133 ha, and having an average age of 60 years. The forest coverage rate at the site exceeds 90%, with an average tree height of 10 m and a maximum leaf area index (LAI) of 4.40. The understory is dominated by Pyracantha fortuneana, Rhododendron simsii, and Litsea cubeba. Although the canopy remains fully closed from April to October in the study area, frequent cloud cover and precipitation events during the earlier period (April–June) degrade the data quality of optical remote sensing. Consequently, analyses were restricted to sunny-day observations from July to October to evaluate the performance of traditional water-status indicators and the canopy-temperature-based PWSI in detecting water deficits within the urban forest ecosystem.
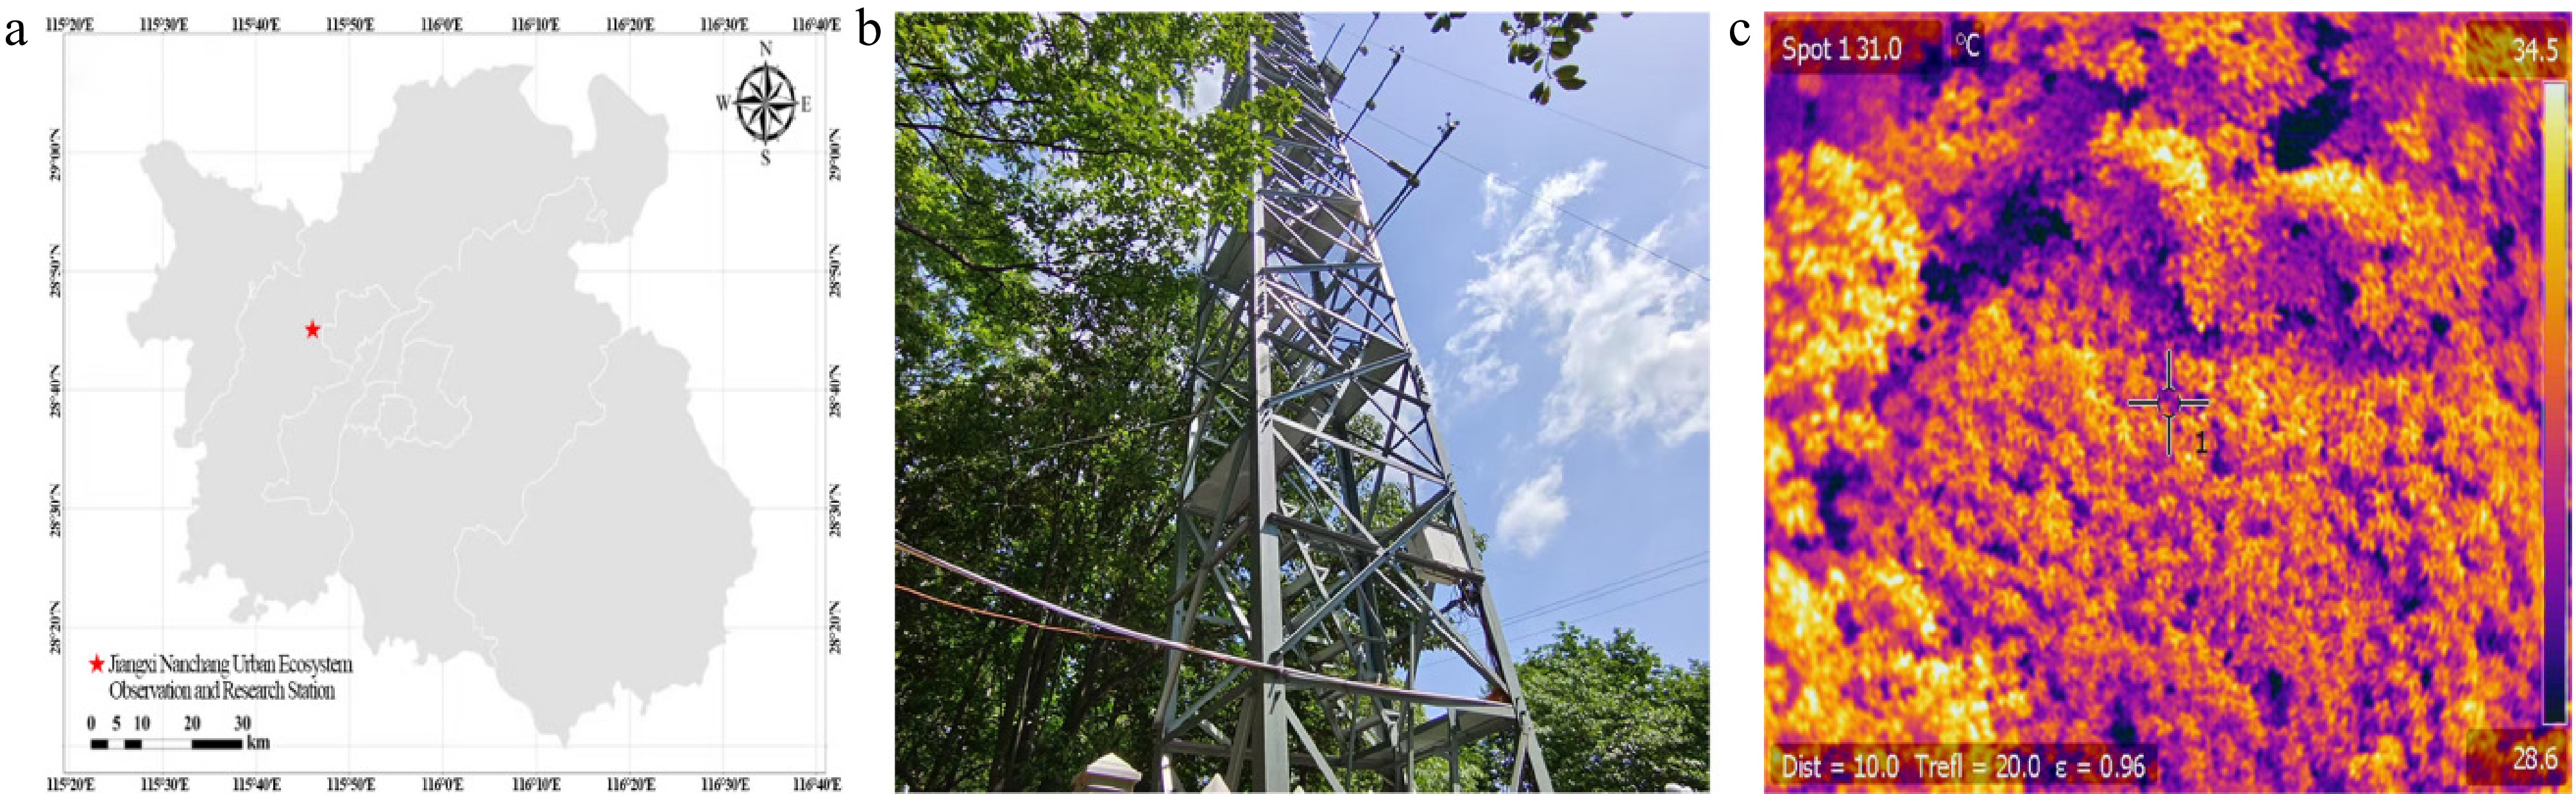
Figure 1.
The location of (a) the research site, (b) the illustration of flux tower, and (c) the thermal infrared imagery collected from the urban forest ecosystem.
Measurements
Canopy temperature
-
The canopy temperature of the Nanchang urban forest ecosystem was automatically monitored using a thermal infrared camera (FLIR A308, FLIR Systems Inc., Wilsonville, OR, USA) mounted on the flux tower platform at a height of 10 m above the canopy. Before the observation, the thermal infrared camera was calibrated with a commercial blackbody surface. The camera faced northeast with a sensor zenith angle of 45°. It uses an uncooled microbolometer to detect long-wave radiation between 7.50–13.00 µm and converts it to the temperature. Specifications include 320 × 240 pixel resolution, a 25° × 18.8° field of view, and an accuracy of ± 2 °C or ± 2% of the reading. The camera's emissivity was fixed at 0.96, and the images were collected every 5 min and transmitted to the server via a wireless transmission device. The canopy pixels were extracted from the thermal images using the temperature-threshold method. The temperature of the canopy pixels, derived through sky-temperature and path radiance calibration in the FLIR Tools software, was used to calculate Tc as their average temperature. Detailed processing steps can be found in Liu et al.[29].
Meteorological factors, ecosystem fluxes, and canopy structure parameters
-
Meteorological and eddy-covariance systems were installed on the 30 m flux tower. The meteorological observation system consisted of a temperature and humidity sensor (HMP155, Vaisala Inc., Vantaa, Finland), an anemometer (WindSonic, Gill Inc., Lymington, UK), a four-component net radiometer (CNR4, Kipp and Zonen Inc., Delft, Netherlands), and a rainfall gauge (TE525MM, Campbell Scientific Inc., Logan, UT, USA). Except for the four-component net radiometer, which was mounted 7 m above the canopy, all other sensors were installed at a height of 20 m. Additionally, four soil water content probes (CS655, Campbell Scientific Inc.) were inserted at depths of 10, 30, 50, and 70 cm, while two soil heat-flux plates (HFP01SC-L, Hukseflux Inc., Finland) were placed 5 cm below the surface at two points around the flux tower. All data were logged by a CR1000 data logger (Campbell Scientific Inc.) that stored 10 min averages. The eddy-covariance system, mounted at 30 m and comprising a three-dimensional sonic anemometer (CSAT3, Campbell Scientific Inc.) and a fast-response infrared gas analyzer (Li-7500A, Li-Cor Inc., Lincoln, NE, USA), continuously quantified water vapour exchange between the urban forest ecosystem and the atmosphere. Raw data were sampled at 10 Hz and recorded by a data logger (Model Li-7550, Li-Cor Inc.).
In addition, the plant canopy analyzer (LAI-2200C, Li-Cor Inc.) was used to measure the LAI of the urban forest ecosystem every 20 d, and linear interpolation was used to determine LAI values across the 20-d interval.
Data analysis
Flux data processing
-
Raw 10 Hz data were processed with EddyPro v7.0.7 (LI-COR Inc.) following standard quality-control steps: spike detection, 2-D coordinate rotation, Webb–Pearman–Leuning correction, block-averaging detrending, and friction velocity (u*) filtering (u* < 0.25 m·s−1). Subsequently, 30-min averages of ecosystem latent heat fluxes (LE) were computed, and 75% of records passed quality control. Remaining gaps were filled using the marginal distribution sampling algorithm in the REddyProc R package (
https://cran.r-project.org/package=REddyProc ). The energy balance closure was 0.85. Detailed procedures follow Liu et al.[30] and Zhou et al.[31].Sunny sky definition
-
In this study, the clear sky index (CI) was used to distinguish between cloudy and sunny days, and was calculated as follows, Gu et al.[32]:
$ {CI=}\frac{{{S}}_{{r}}}{{{S}}_{{e}}} $ (1) $ {{S}}_{{e}}={{S}}_{{sc}}\times\left[{1+0.033 \times \cos(360}{{t}}_{{d}}/{365)}\right]\times {\sin \varepsilon} $ (2) $ \sin\text{ε = sinφ × sinδ + cosφ × cosδ × cosω} $ (3) where, Sr is the total radiation above the canopy (W m−2), Ssc is the solar constant (1,367 W m−2), Se is the astronomical radiation (W m−2), ε is the solar elevation angle, td is the Julian day, φ is the local latitude, ω is the time angle, δ is the declination of the sun. When the daily mean CI is greater than 0.5, the day is defined as sunny; otherwise, it is defined as cloudy[33].
Plant water stress index
-
The PWSI was calculated as follows, Idso et al.[18]:
$ {\text{PWSI}}=\dfrac{{dT-}{{dT}}_{{ll}}}{{{dT}}_{{ul}}-{{dT}}_{{ll}}} $ (4) where, PWSI is the plant water stress index based on canopy temperature, dT is the measured canopy-air temperature difference (°C), dTll is the lower limit of dT, corresponding to the non-water-stressed condition, and dTul is the upper limit of dT, representing the non-transpiring condition (°C). Theoretically, the PWSI value ranges from zero to one, representing plant water status from well-watered to non-transpiring conditions.
Based on the different calculation methods for dTll and dTul, PWSI can be further categorized into PWSIe, PWSIt, and PWSIs. Among these, PWSIs rely on manual observation of the reference surface temperature, which limits their application to automated monitoring of water status in forest ecosystems. Therefore, this study focuses only on the applicability of PWSIe and PWSIt.
PWSIe
-
The PWSIe was introduced by Idso et al.[18]. The dTll and dTul were determined by NWSB, defined as the negative linear relationship between dTll and VPD. Following Liu et al.[34] and Supplementary Fig. S1, this study identified eight well-watered days as those with gc > 15 mm s−1 and established the NWSB from the corresponding dTll and VPD data.
Once the NWSB is determined, dTll and dTul are calculated as follows:
$ {dT}_{ll}=a\times VPD+b $ (5) $ VPD=0.6108\times {e}^{17.27\times {{T}_{a}}/({{T}_{a}}+237.3)}\times (1-RH) $ (6) $ {dT}_{ul}=a\times VPG+b $ (7) $ VPG=0.6108\times {e}^{17.27\times {{T}_{a}}/({{T}_{a}}+237.3)}-0.6108\times {e}^{17.27\times {{(T}_{a}}+b)/({{T}_{a}}+b+237.3)} $ (8) where, the coefficients a and b represent the slope and intercept of NWSB, VPD is the vapor pressure difference (kPa), VPG is the vapor pressure gradient (kPa), Ta is the air temperature ( °C), and RH is the air humidity (%).
PWSIt
-
PWSIt estimates dTll and dTul through the canopy energy balance and the Penman–Monteith equation. Specifically, dTll is calculated by assuming the canopy resistance at potential transpiration, while dTul is derived by setting the canopy resistance to infinity. Detailed calculations follow Jackson et al.[19]:
$ {dT}_{ll}=\dfrac{{r}_{a}\times {R}_{n}}{\rho {c}_{p}}\cdot \dfrac{\gamma \left(1+\dfrac{{r}_{cp}}{{r}_{a}}\right)}{\Delta +\gamma \left(1+\dfrac{{r}_{cp}}{{r}_{a}}\right)}-\dfrac{VPD}{\Delta +\gamma \left(1+\dfrac{{r}_{cp}}{{r}_{a}}\right)} $ (9) $ {dT}_{ul}=\dfrac{{r}_{a}{R}_{n}}{\rho {c}_{p}} $ (10) where, Rn is the net radiation (W·m−2), ρ is the air density (kg·m−3), cp is the heat capacity of the air (1,013 J·kg−1·°C−1), Δ is the slope of the saturation vapor pressure‒temperature relationship (kPa·°C−1), ra is the aerodynamic resistance (s·m−1), γ is the psychrometric constant (kPa·°C−1), rcp is the minimum canopy resistance (s·m−1), and is calculated as follows Tong et al.[35]:
$ {r}_{cp}=\dfrac{{r}_{min}}{{LAI}_{e}} $ (11) $ {LAI}_{e}=\left\{\begin{array}{*{20}{l}} LAI & (LAI\leq 2)\\ 2+\dfrac{LAI-2}{3} & \left(LAI \gt 2\right)\\ \end{array}\right. $ (12) where, rmin is the minimum leaf stomatal resistance (90 s·m−1)[35], LAI is the leaf area index (m2·m−2), and LAIe is the effective LAI (m2·m−2).
ra was calculated using the semi-empirical equation presented by Thom & Oliver[36] and recommended by Jackson et al.[37]:
$ {r}_{a}=4.72{\left\{ln\left[\dfrac{\left(z-d\right)}{{z}_{0}}\right]\right\}}^{2}/(1+0.54u) $ (13) where, z is the reference height (20 m), zo and d are the roughness length (m) (zo = 0.075 h) and zero-plane displacement (m) (d = 0.66 h)[30], respectively, u is the wind speed at the reference height (m·s−1).
Canopy conductance
-
In this study, gc was calculated based on the Penman-Monteith equation[38]:
$ {g}_{c}=\dfrac{LE\times \gamma }{\Delta \times {r}_{a}\times \left({R}_{n}-G\right)+\rho {C}_{p}\times VPD-LE\times {r}_{a}\times (\Delta +\gamma )} $ (14) where, gc is canopy conductance (mm·s−1), G is the soil heat flux (W·m−2), LE represents ecosystem latent heat flux (W·m−2).
Statistical analysis
-
In this study, Pearson correlation analysis and partial correlation analysis were first employed to quantify the relationship among environmental factors, dT, and LE, and to identify the main driving factors of dT. According to the studies of García-Tejero et al.[39] and Bian et al.[40], gc and LE served as indicators of the urban forest's actual water status, and the performance of SWC, VPD, and PWSI in tracking water status was evaluated by coefficients of determination (R2) and significance levels (p-values). Among them, the p-values in this study were derived using t-statistics based on Newey-West adjusted standard errors. The above analyses were conducted using OriginPro 2024 (OriginLab Corporation, Northampton, MA, USA) and Python 3.11.0 with the statsmodels, scikit-learn, and NumPy libraries.
-
The seasonal variations in the environmental parameters in the Nanchang urban forest ecosystem during the experimental period are shown in Fig. 2. Rn increased gradually in spring, peaked in summer, and declined thereafter, with pronounced fluctuations attributed to meteorological conditions. Particularly from April to June, frequent cloud cover and precipitation events led to relatively lower Rn values. Air temperature (Ta) followed the same trend, ranging from −4.52 °C in January to 33.64 °C in August. VPD was relatively high between July and August, with a peak value of 2.62 kPa. The wind speed (Ws) generally fluctuated around 2 m·s−1, with a maximum value of 6.95 m·s−1. Total rainfall in 2024 was 1,714.98 mm, less than the long-term mean. However, 62% of precipitation occurred from March to June, whereas July to October contributed only 19.7%, resulting in mean SWC (10, 30, 50, and 70 cm depths) of 0.17 m3·m−3 in March–June and 0.15 m3·m−3 in July–October, respectively. This seasonal imbalance indicates marked drought stress during the late growing season.
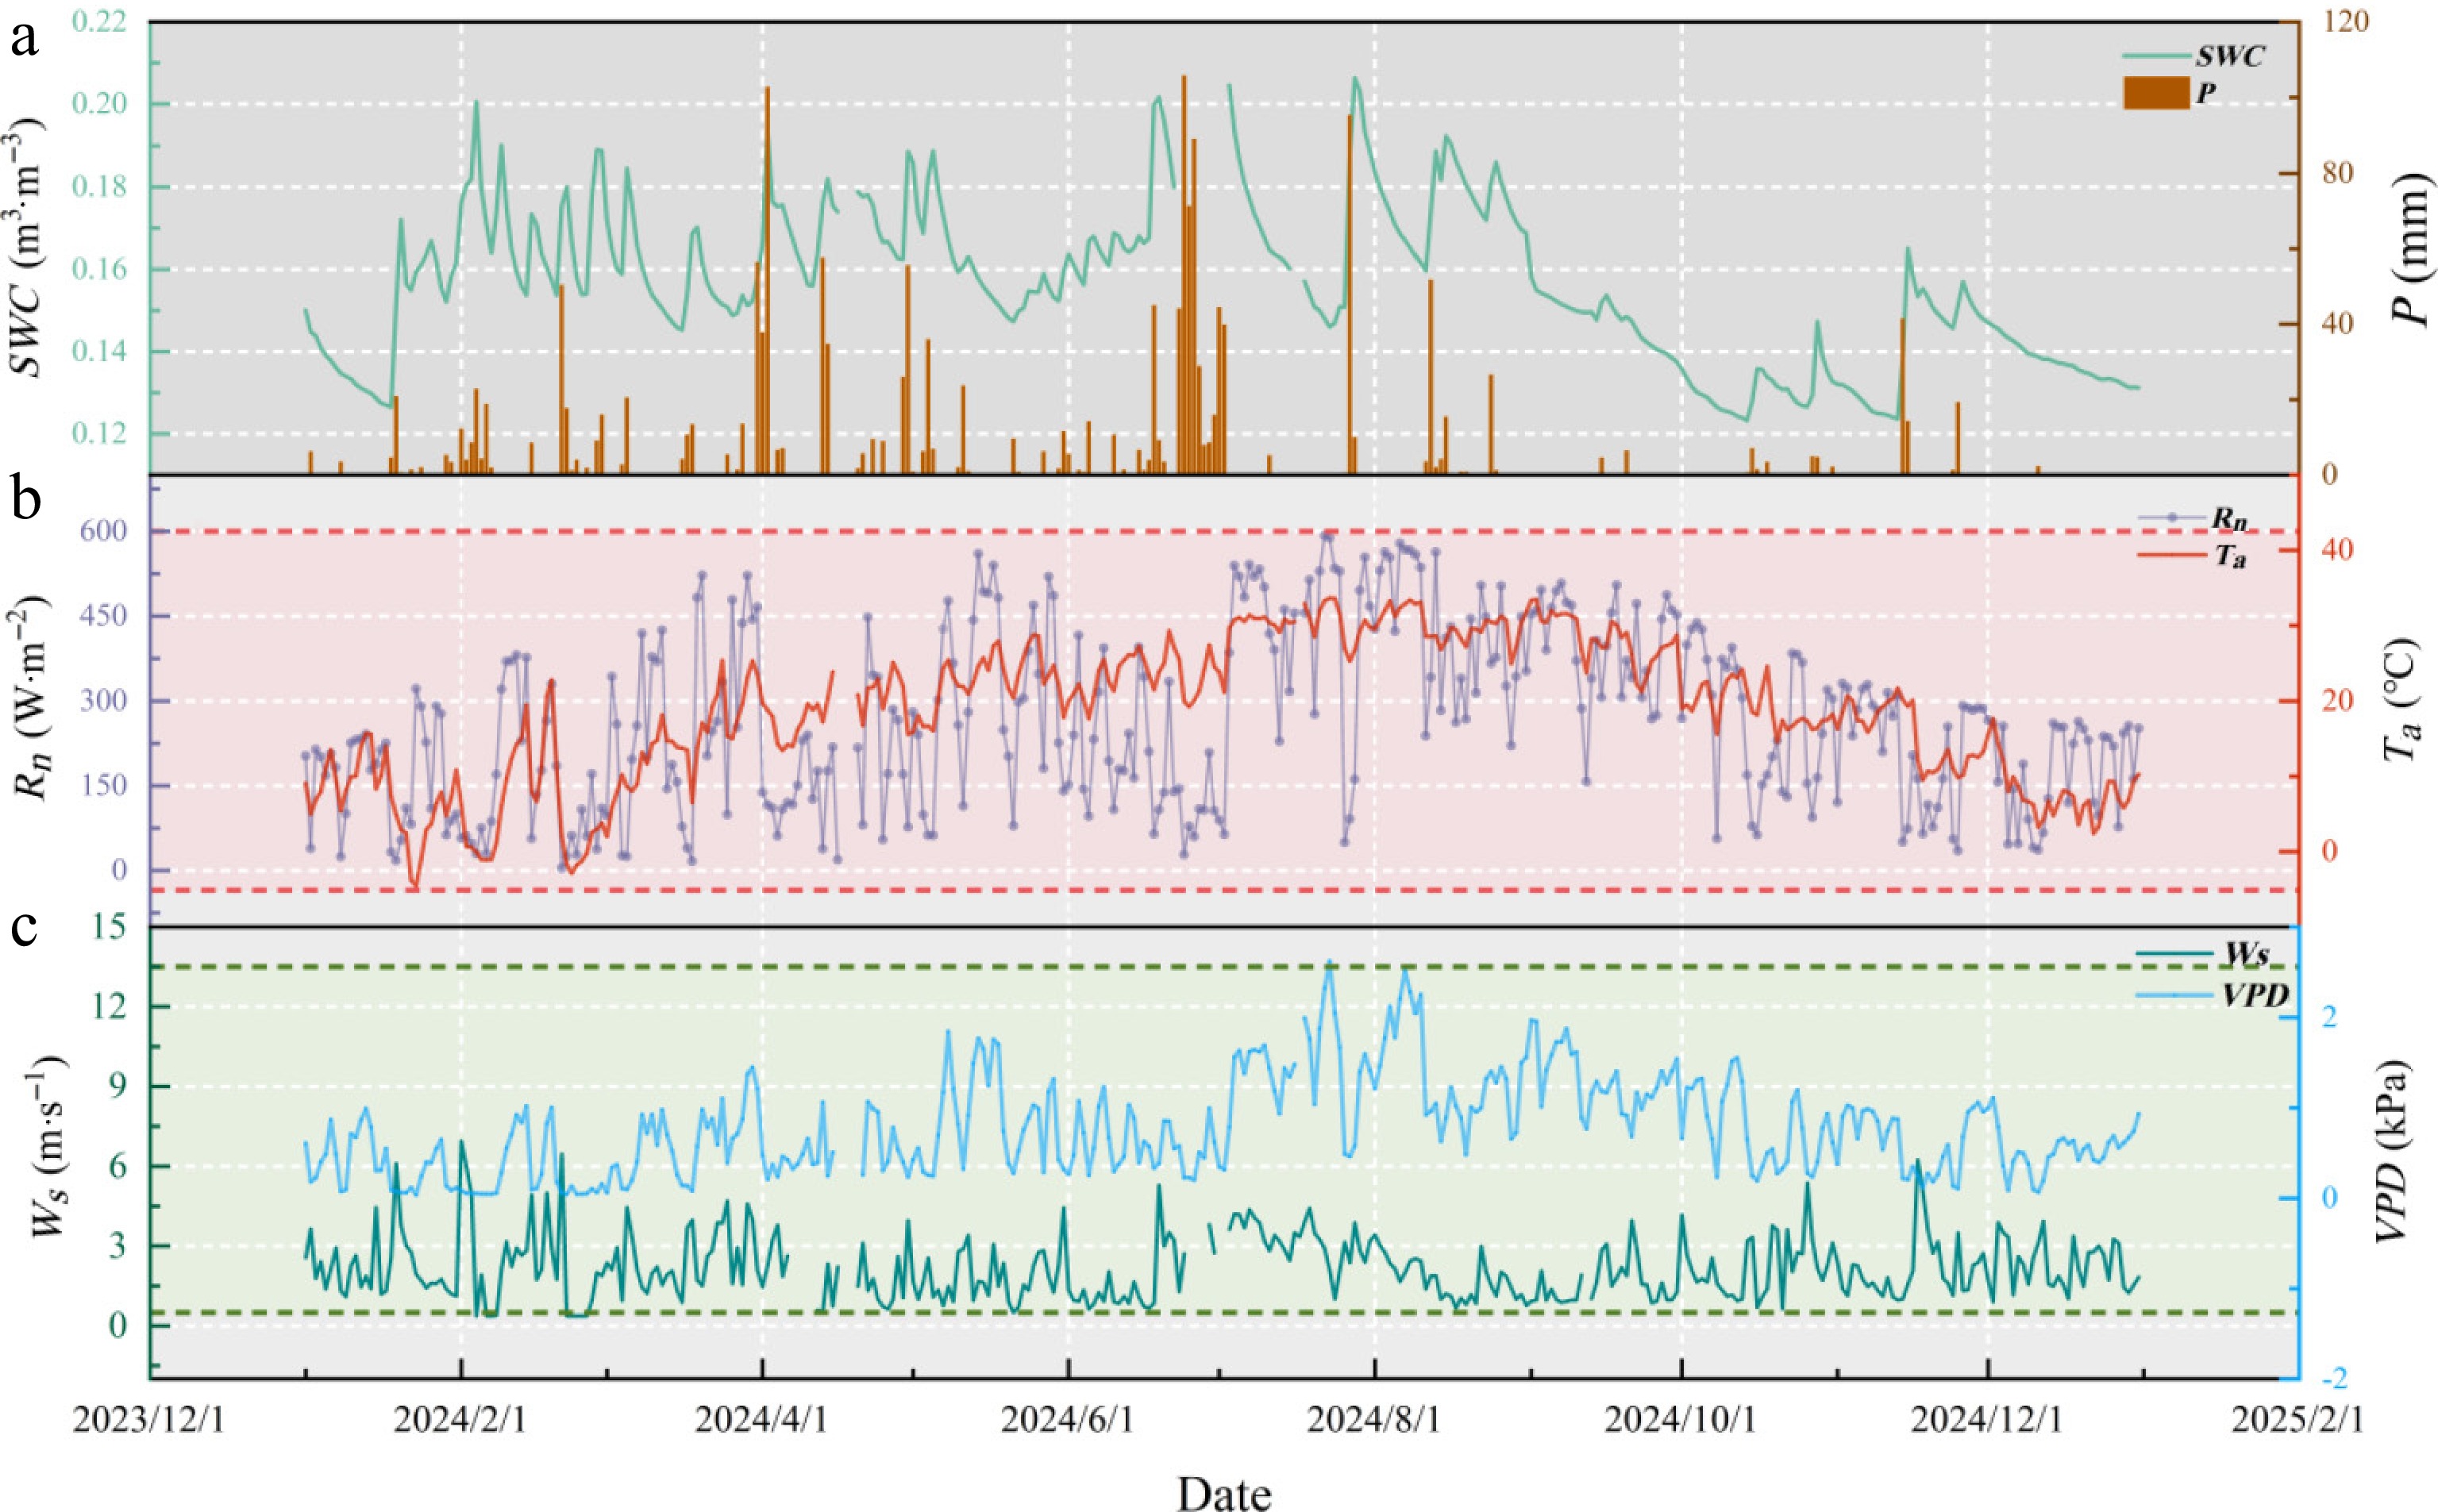
Figure 2.
Seasonal dynamics in (a) soil water content (SWC) and precipitation (P), (b) air temperature (Ta) and net radiation (Rn), (c) wind speed (Ws) and vapor pressure deficit (VPD) in the Nanchang urban forest ecosystem.
Relationship between canopy-air temperature difference and environmental factors
-
The dT in the Nanchang urban forest ecosystem was strongly influenced by environmental factors. Except for Ta, VPD, and SWC, all remaining variables were significantly correlated with the dT (p < 0.01). Rn was the dominant control factor, with a Pearson correlation coefficient (r) of 0.83, markedly higher than those of the other factors. RH and Ws followed, with coefficients of 0.14 and 0.13, respectively. In addition, LE and dT showed a significant positive correlation (r = 0.51, p < 0.01); with increasing heat dissipation, the dT of the urban forest ecosystem increased (Fig. 3).
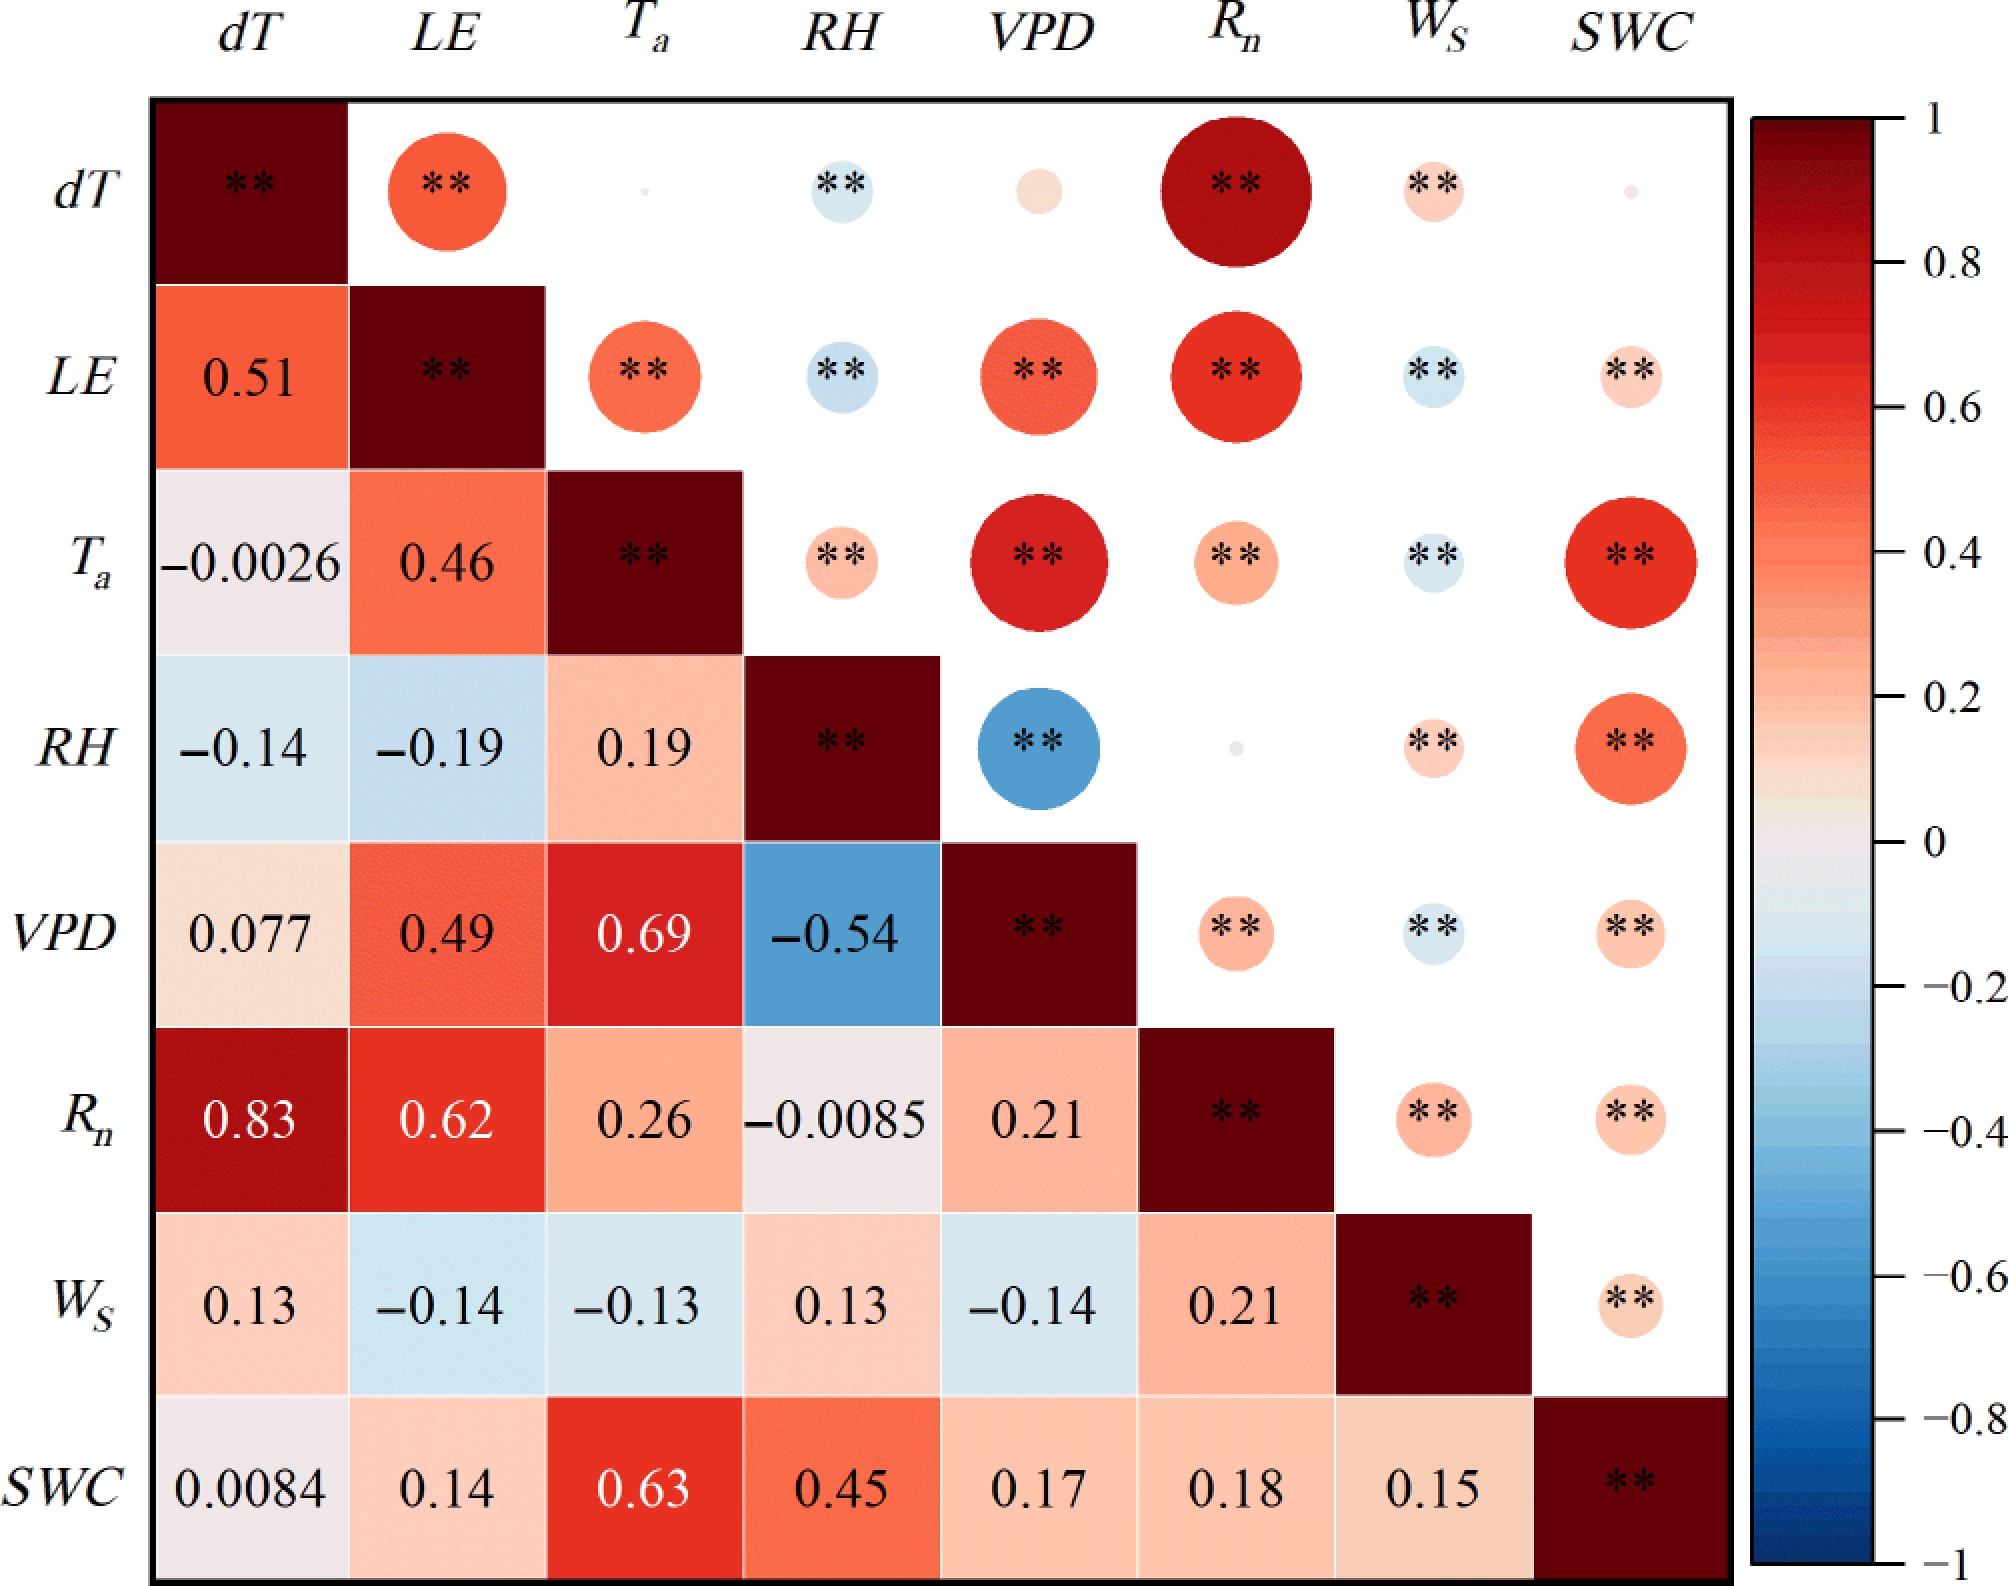
Figure 3.
Pearson's correlation coefficients among the canopy-air temperature difference (dT), latent heat flux (LE), and environmental variables under sunny days in the Nanchang urban forest ecosystem. ** represents p < 0.01; * represents p < 0.05.
Traditional indicators for urban forest water-status detection
-
During the study period, LE and gc in the Nanchang urban forest ecosystem ranged from 100–450 W·m−2 and 4–20 mm·s−1, respectively (Fig. 4). LE increased significantly with SWC (p < 0.01), yet SWC explained only 11% of the variance in LE. In contrast, LE did not exhibit a declining trend under elevated VPD; instead, a positive correlation was observed between the two variables. Although gc tended to increase with higher SWC and lower VPD, neither SWC nor VPD was significantly correlated with gc (p > 0.05) (Fig. 4). These results indicate that traditional water-status indicators fail to track variations in gc or LE in humid-region urban forests and are insensitive to early drought events.
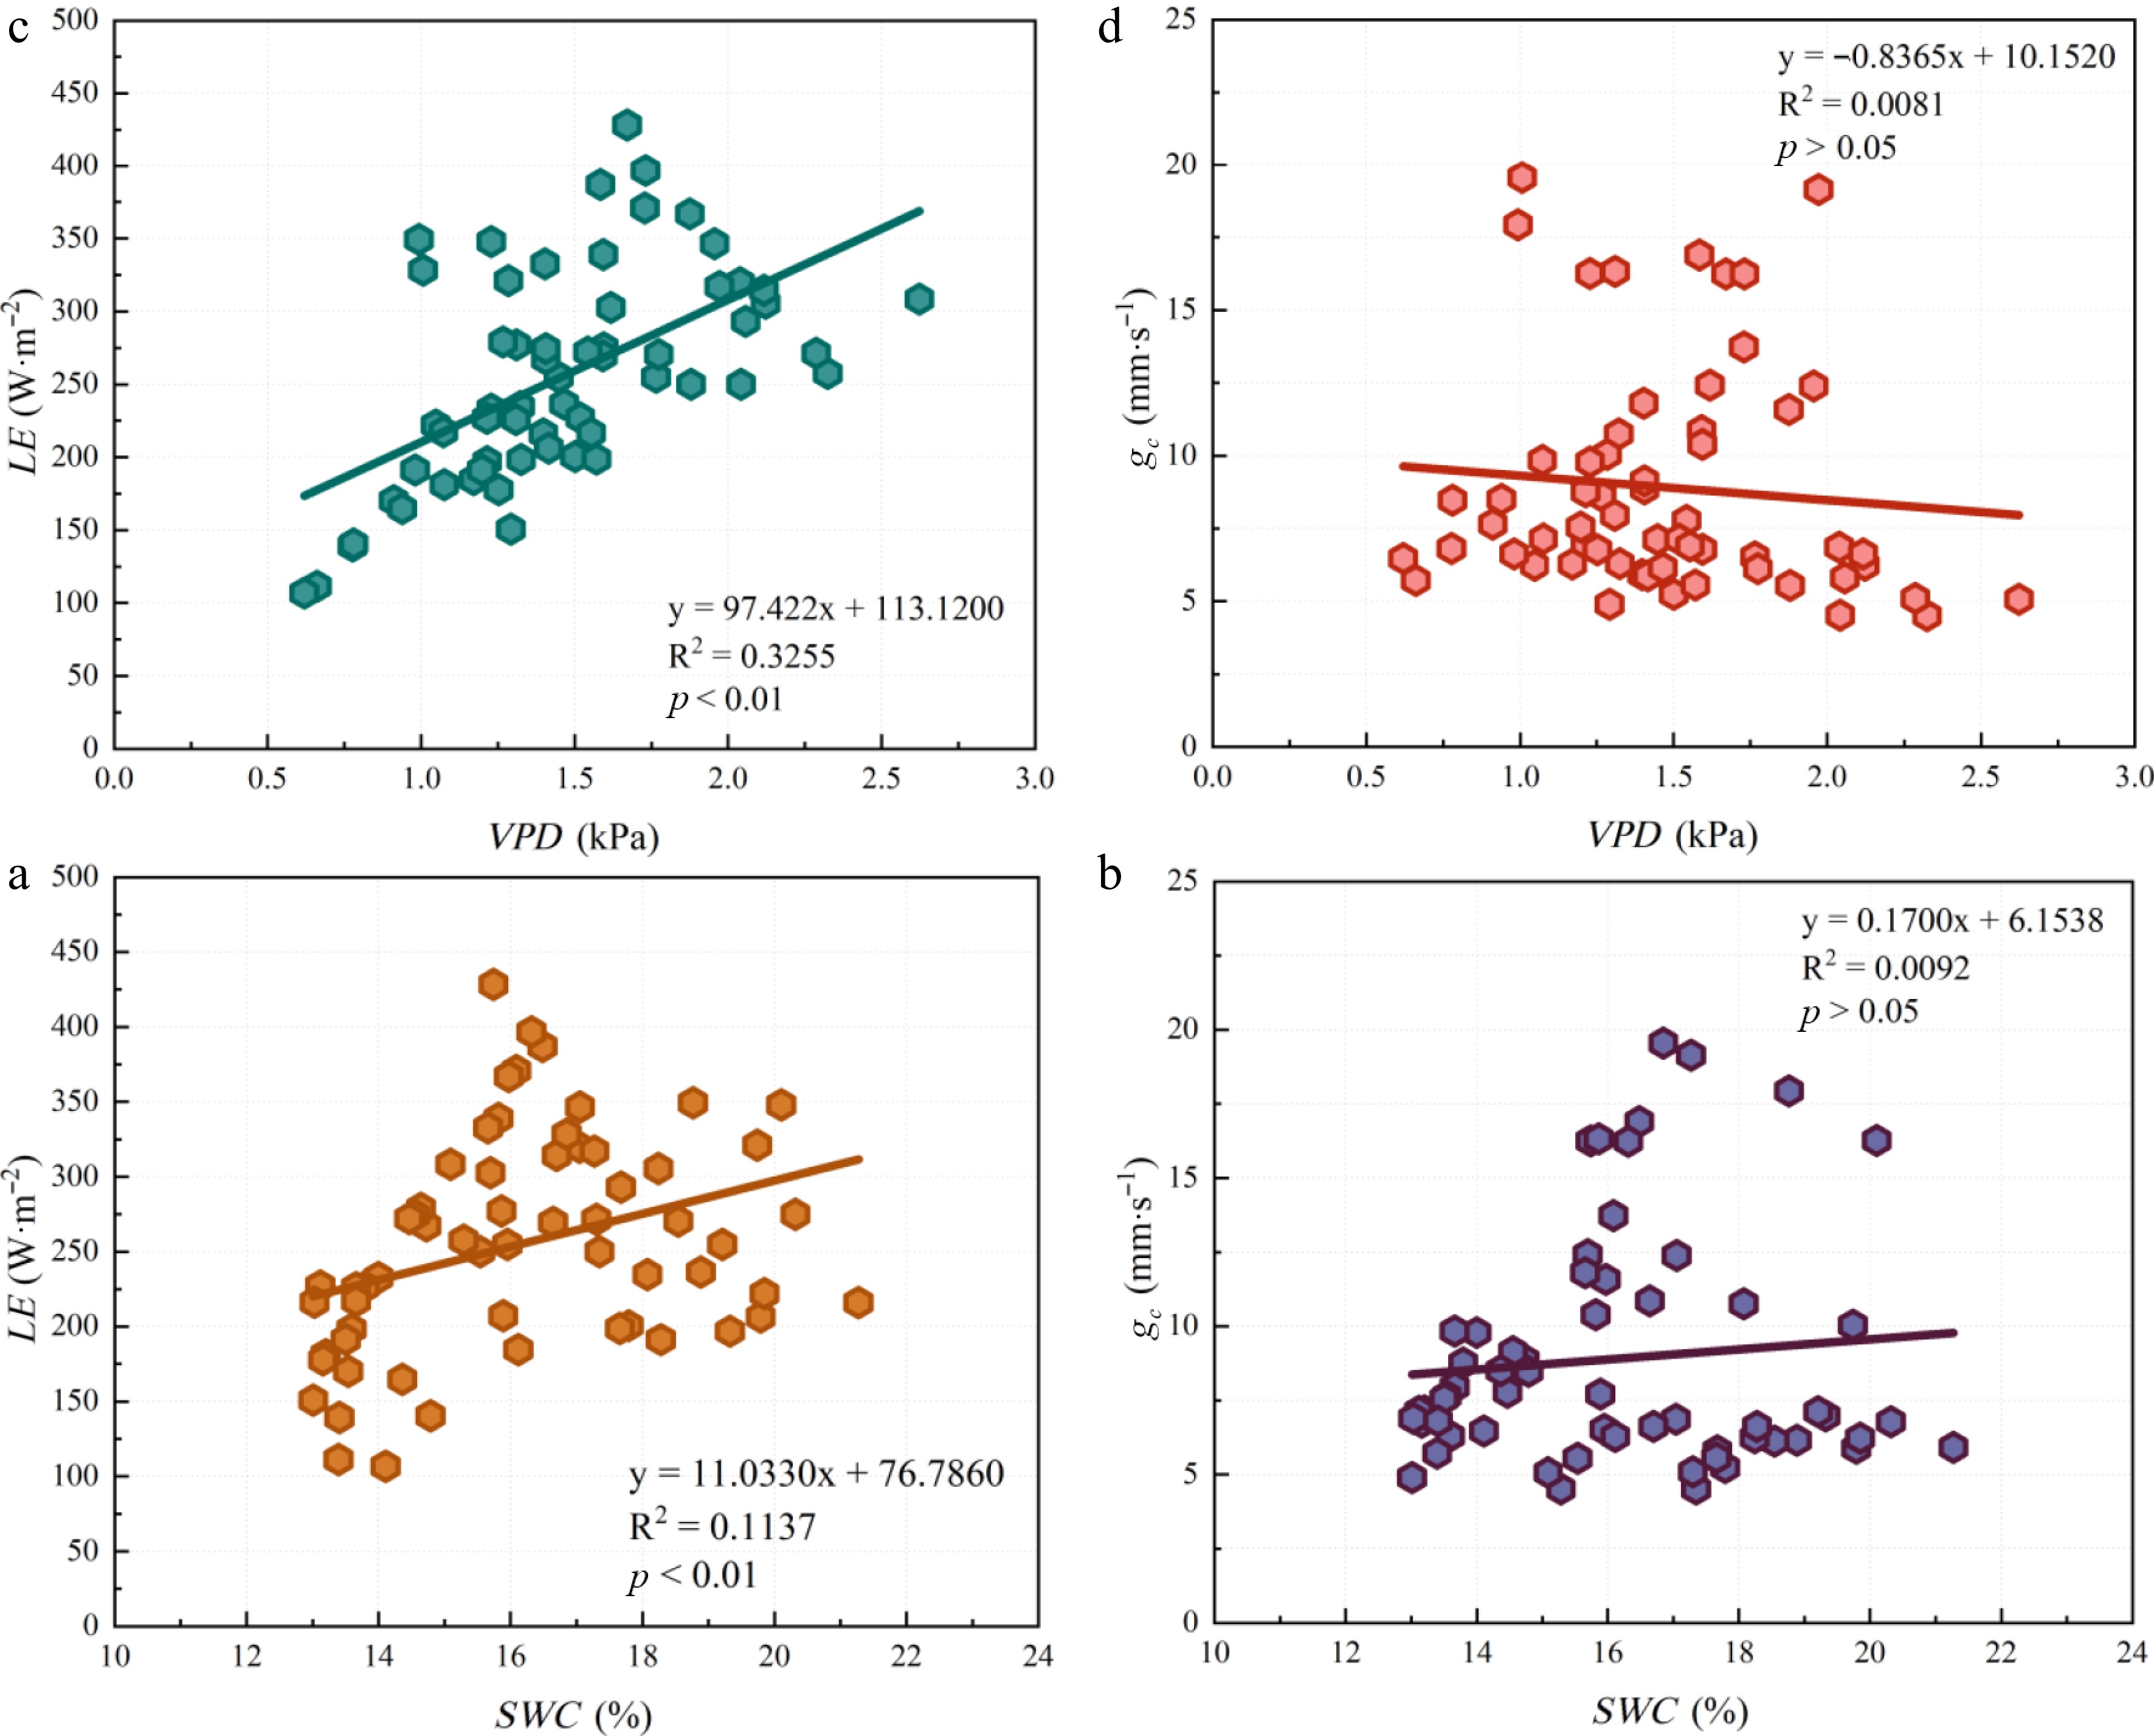
Figure 4.
Relationships among the soil water content (SWC), vapor pressure deficit (VPD), latent heat flux (LE), and canopy conductance (gc). ** represents p < 0.01; * represents p < 0.05.
PWSIe for urban forest water-status detection
Establishment of the NWSB
-
The calculation of PWSIe relies on the relationship between dTll and VPD to derive the NWSB. Figure 5 shows the result of NWSB, which was established by pooling dTll and VPD data from all daytime hours on sunny days throughout the study period. dTll ranged from −1.04 to 4.81 °C, and VPD from 0.38 to 2.31 kPa (the maximum hourly VPD recorded during the study period was 3.10 kPa). However, the data in Fig. 5 were too scattered to yield a reliable NWSB.
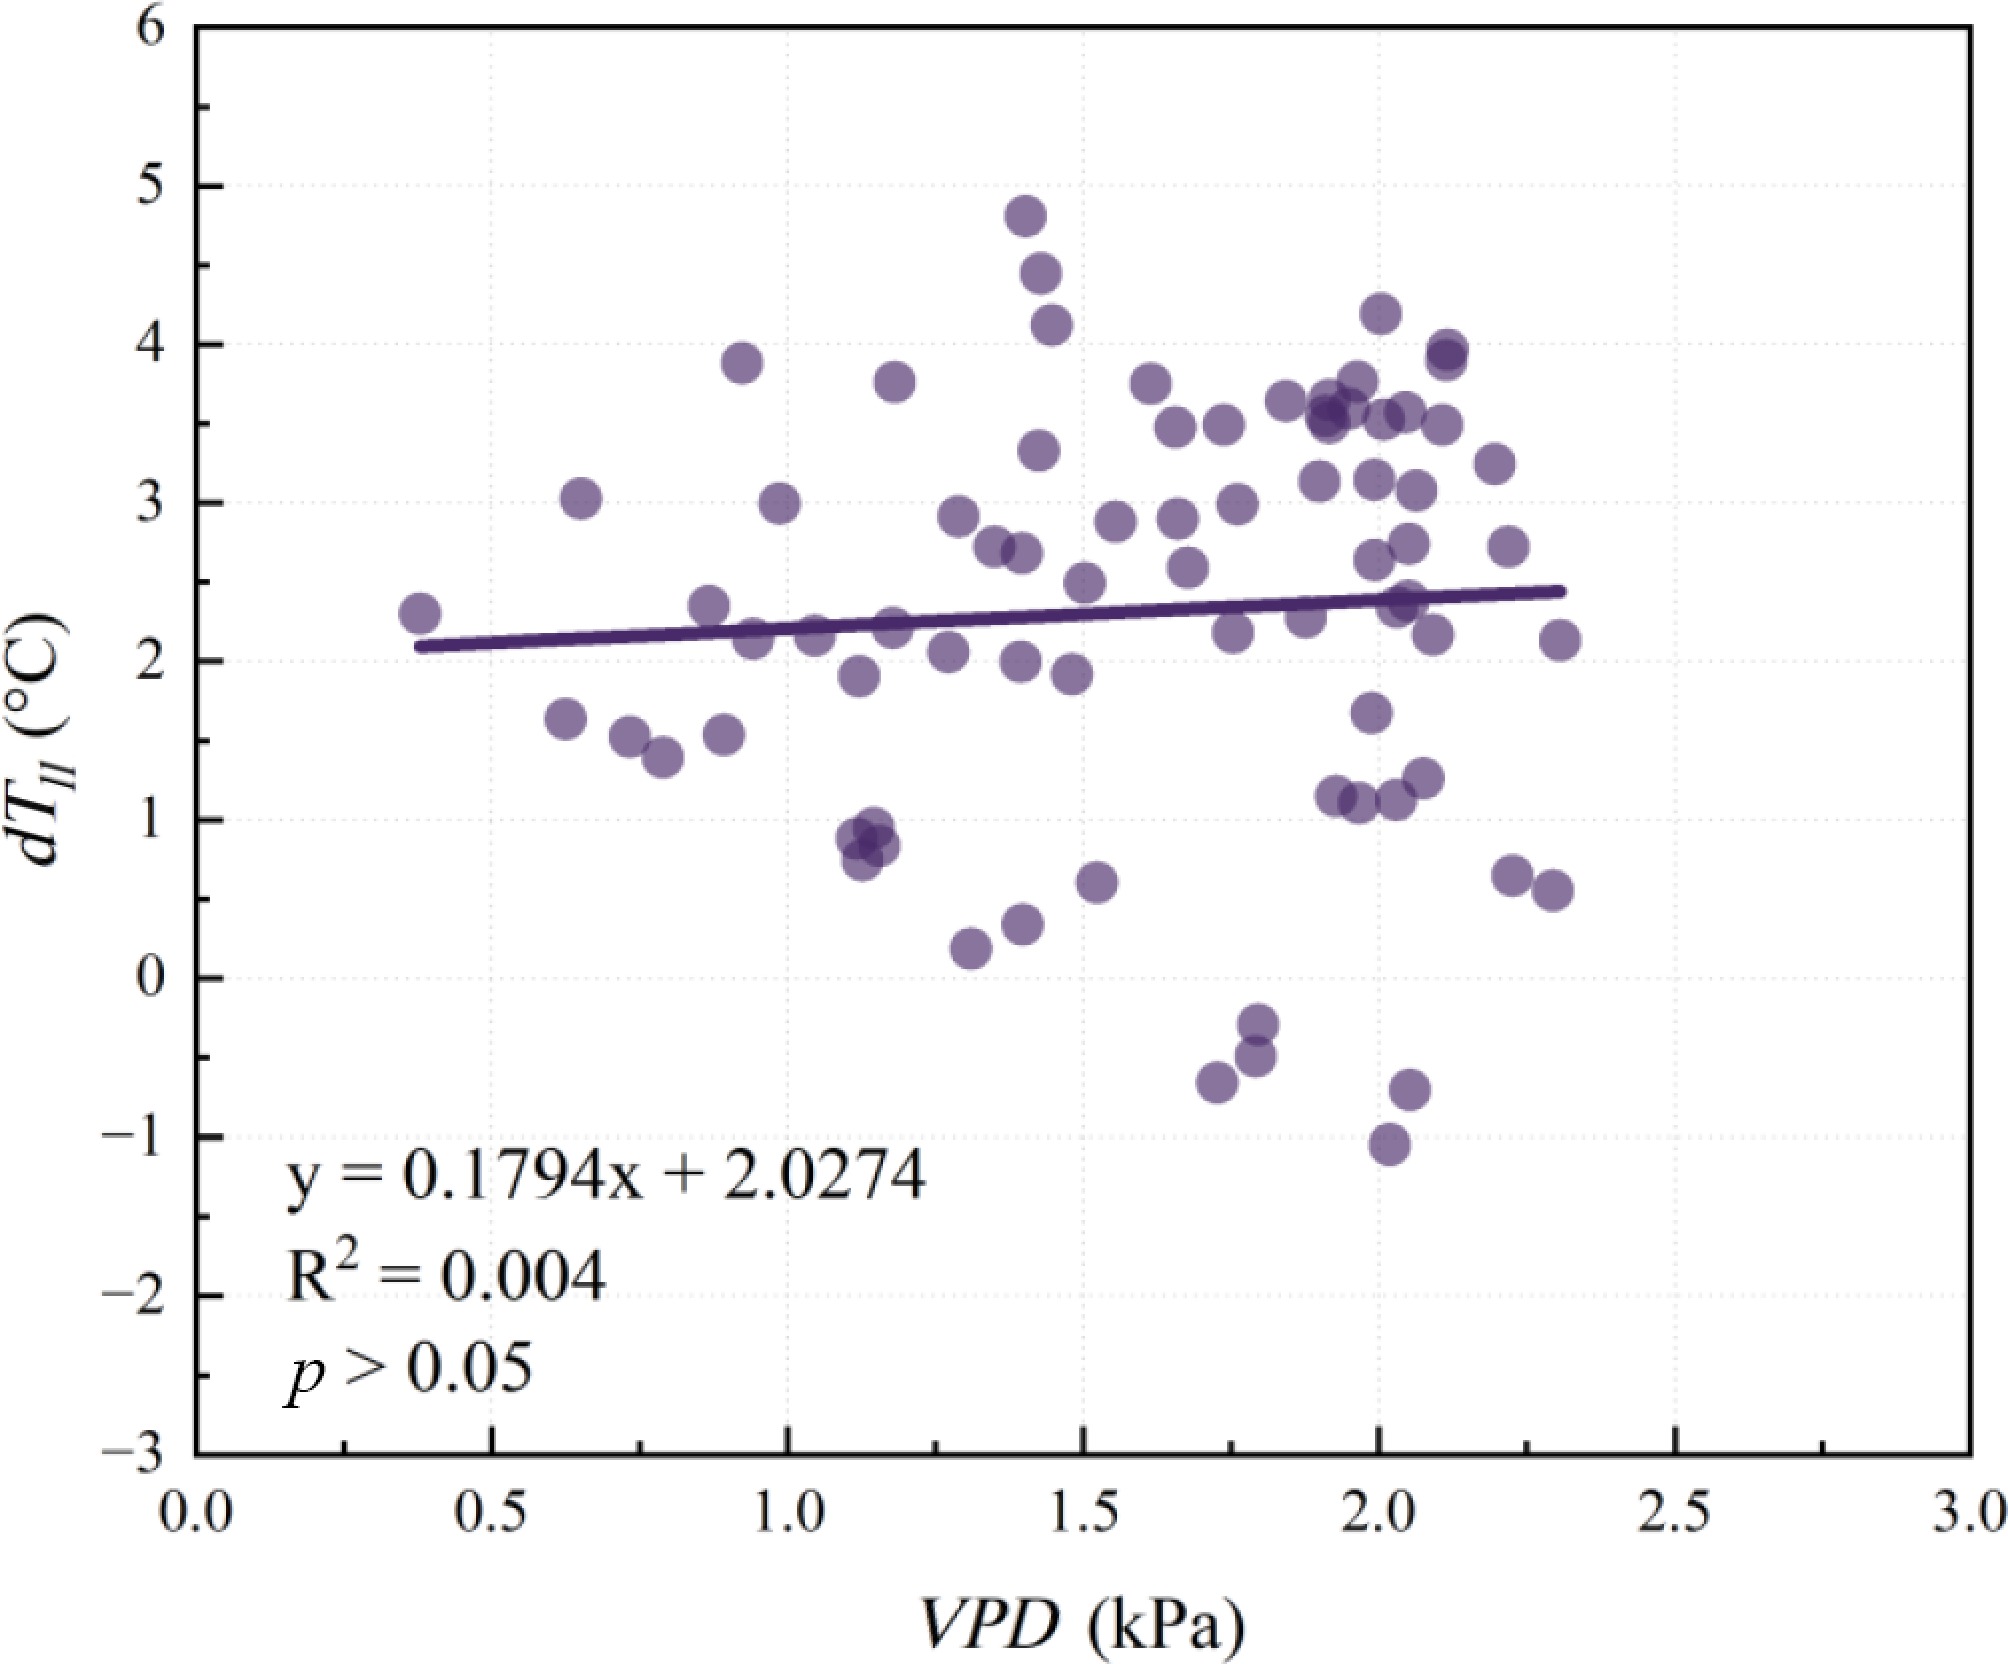
Figure 5.
Canopy-air temperature difference (dTll) vs vapour pressure deficit (VPD) under well-watered conditions (all daytime hours data on sunny days were pooled together). ** represents p < 0.01; * represents p < 0.05.
To accurately define the NWSB, the data were assessed in different ways. First, the NWSBs for the different hours of the daytime were determined (Table 1). Across all hours, dTll and VPD were negatively correlated, but the regression parameters varied markedly. Coefficients of determination (R2) ranged from 0.08 to 0.87 and exhibited a clear diurnal pattern: R2 followed a U-shaped trend, peaking at 0.84 in the early morning (08:00) and 0.87 in the late afternoon (17:00), and reaching a pronounced minimum of 0.08 at noon (12:00). An opposing trend was evident in the intercept values, which rose from 2.11 at 08:00 to 5.55 at 13:00 before declining to 2.37 at 17:00. By contrast, the slopes of the fitted relationships varied little, ranging from −0.54 to −1.02, except at 12:00, 14:00, and 17:00.
Table 1. Fitted parameters for non-water-stressed baselines.
Time Slope (°C·kPa−1) Intercept (°C) R2 8:00 −0.9226 2.1068 0.8366** 9:00 −0.6772 2.7285 0.5622* 10:00 −0.6640 3.4301 0.2670 11:00 −0.5382 3.7108 0.1008 12:00 −0.2808 3.9867 0.0761 13:00 −0.8012 5.5463 0.5116* 14:00 −0.3989 4.3425 0.1421 15:00 −1.0205 4.4587 0.6430* 16:00 −0.8735 2.6552 0.2374 17:00 −1.5884 2.3692 0.8748** 8:00 − 17:00 −0.8227 3.5879 0.8633** ** represents p < 0.01; * represents p < 0.05 (same in all tables). Subsequently, the NWSB was established using the daytime mean values of dTll and VPD. The results revealed a significant negative correlation between dTll and VPD (p < 0.01), with an R2 of 0.86. The corresponding regression slope and intercept were −0.82 and 3.59, respectively (Table 1).
Relationships between the PWSIe and physiological variables
-
Table 2 summarizes the performance of hourly PWSIe, based on NWSBs derived from different daytime periods, in detecting water-status changes in the Nanchang urban forest ecosystem. Between 09:00 and 11:00, PWSIe correlated negatively with gc and LE (p < 0.05), yet the R2 was relatively low: 0.15, 0.25, and 0.22 for gc; 0.19, 0.29, and 0.31 for LE, respectively. Outside this narrow window, relationships deteriorated markedly; in some instances, PWSIe was positively correlated with gc or LE, implying an anomalous increase in these variables under greater drought stress. These results indicate that hourly PWSIe derived from single-hour NWSBs is poorly suited for tracking the water status of humid-region urban forests and is subject to substantial uncertainty.
Table 2. Relationships between empirical plant water stress index (PWSIe) and canopy conductance (gc) and between PWSIe and latent heat flux (LE) at various times.
Time Slope Intercept R2 8:00 gc −0.0050 −0.0095 0.0036 LE 0.0008 −0.2655 0.0278 9:00 gc −0.0289 0.5331 0.1609** LE −0.0019 0.7765 0.2080** 10:00 gc −0.0595 0.9084 0.2507** LE −0.0037 1.3350 0.2891** 11:00 gc −0.0729 1.2223 0.2154** LE −0.0050 1.8831 0.3102** 12:00 gc −0.0781 1.0197 0.0282 LE −0.0078 2.3512 0.0838* 13:00 gc 0.0087 −0.2427 0.0040 LE 0.0020 −0.6967 0.0656 14:00 gc 0.0253 −0.3908 0.0066 LE 0.0055 −1.6110 0.0958* 15:00 gc 0.0043 −0.1196 0.0013 LE 0.0036 −1.0096 0.2621** 16:00 gc −0.0103 0.0991 0.0063 LE 0.0031 −0.8023 0.1704** 17:00 gc −0.0086 0.0288 0.0090 LE 0.0017 −0.4991 0.1077* Figure 6 illustrates the performance of the daily PWSIe, based on NWSB derived from daytime mean values of dTll and VPD, in detecting water-status changes in the urban forest ecosystem. Daily PWSIe fluctuated mainly between −0.4 and 0.5 (negative values account for 39% of the data), deviating markedly from the theoretical range of 0−1 for PWSI. Urban forest ecosystem LE was almost unaffected by daily PWSIe (p > 0.05). Although gc decreased significantly as daily PWSIe increased (p < 0.01), the relationship was weak and highly scattered. These results indicate that daily PWSIe provides only limited insight into the water-status dynamics of humid-region urban forests.
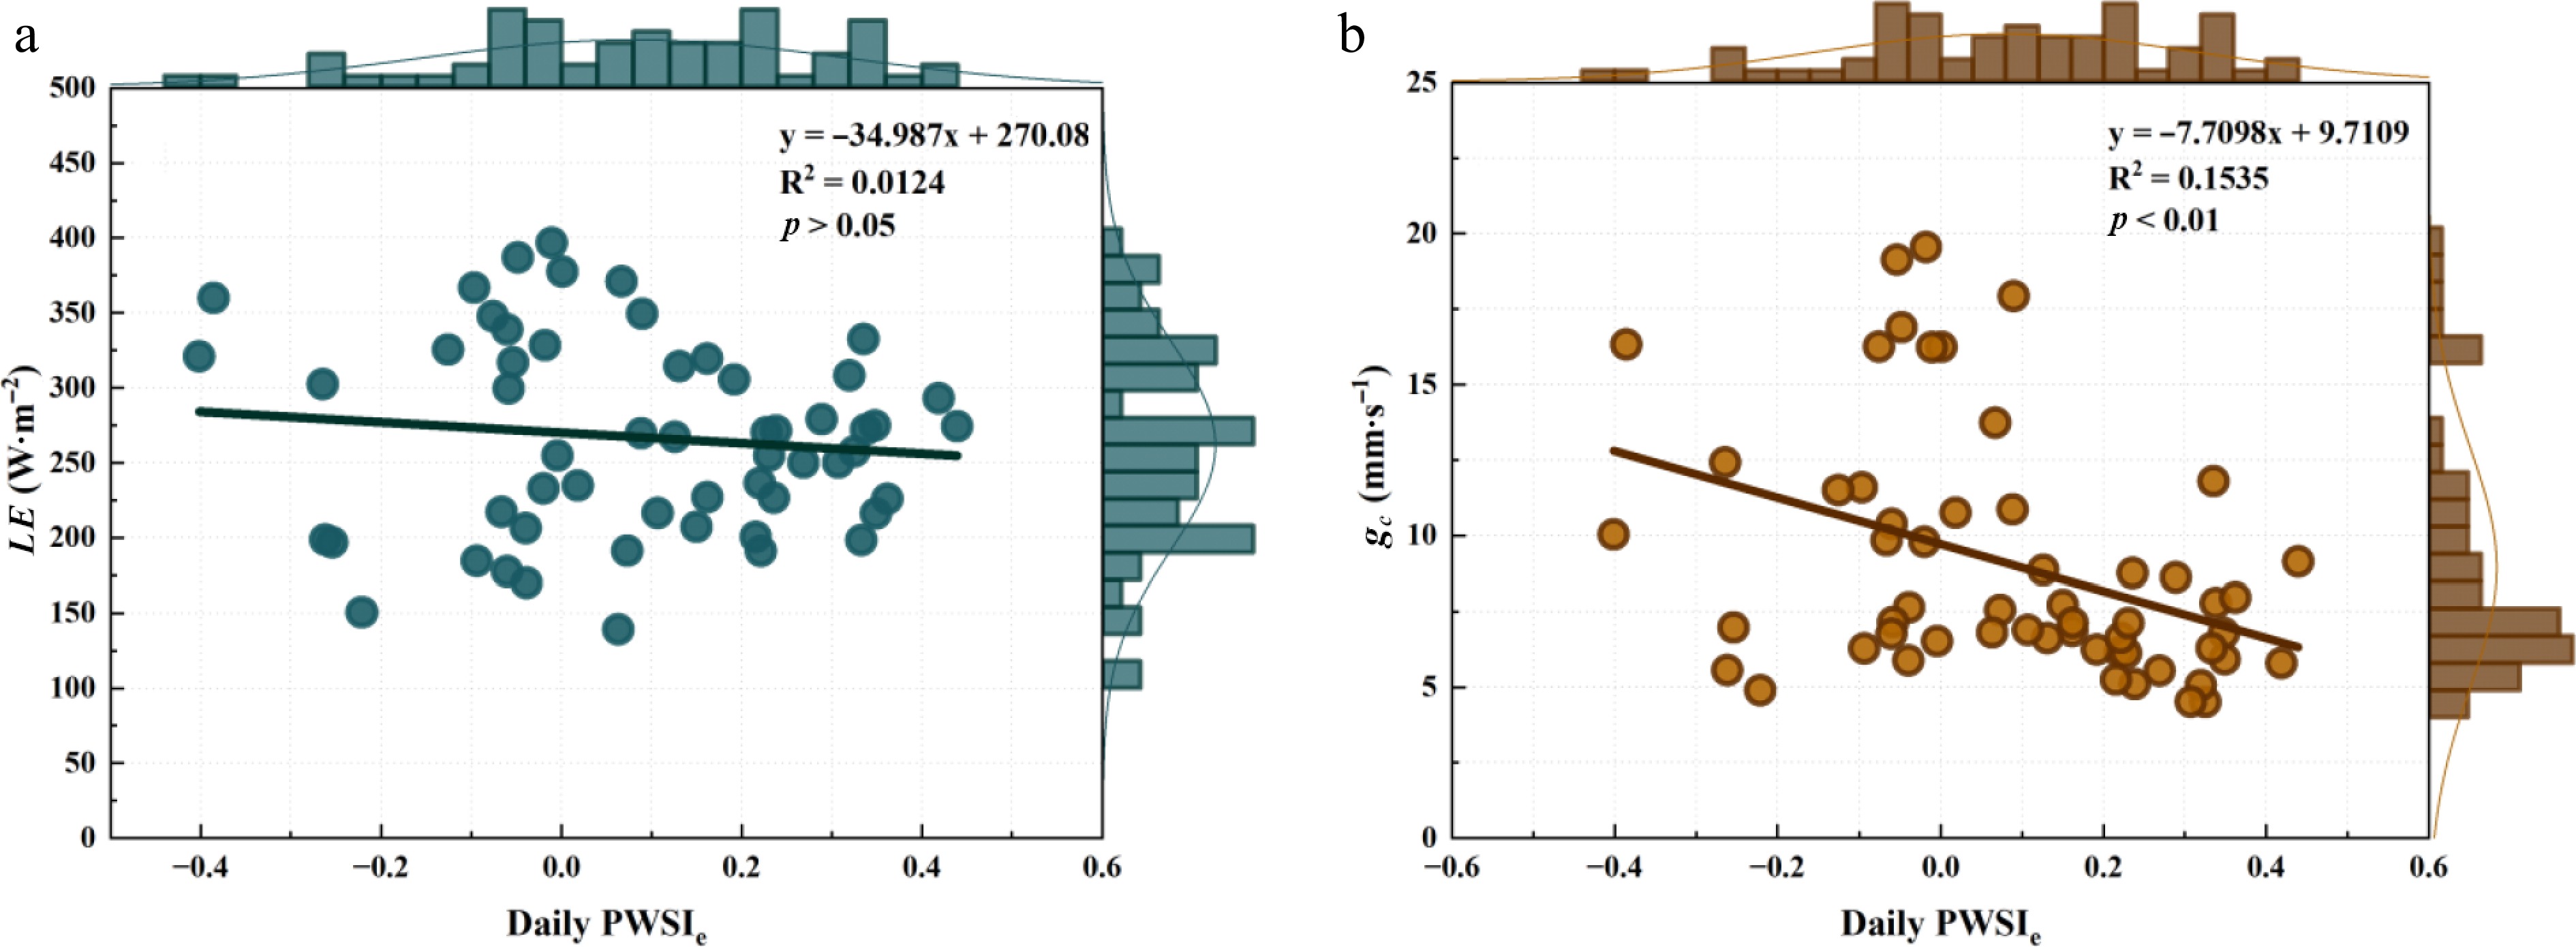
Figure 6.
Performance of the daily empirical plant water stress index (PWSIe) in indicating urban forest ecosystem water status. ** represents p < 0.01; * represents p < 0.05.
PWSIt for urban forest water-status detection
Relationships between the PWSIt and physiological variables
-
During the study period, the daytime mean PWSIt (PWSIt_day) from 08:00 to 17:00 derived by the theoretical method ranged between 0.15 and 0.60. As PWSIt_day increased, gc and LE declined progressively (p < 0.01) (Fig. 7). PWSIt_day explained 45% and 64% of the observed variations in gc and LE, respectively (Fig. 8). These results demonstrate that the theoretically derived PWSIt provides a robust means of tracking water-status changes in humid-region urban forests and enables early detection of ecosystem drought events.
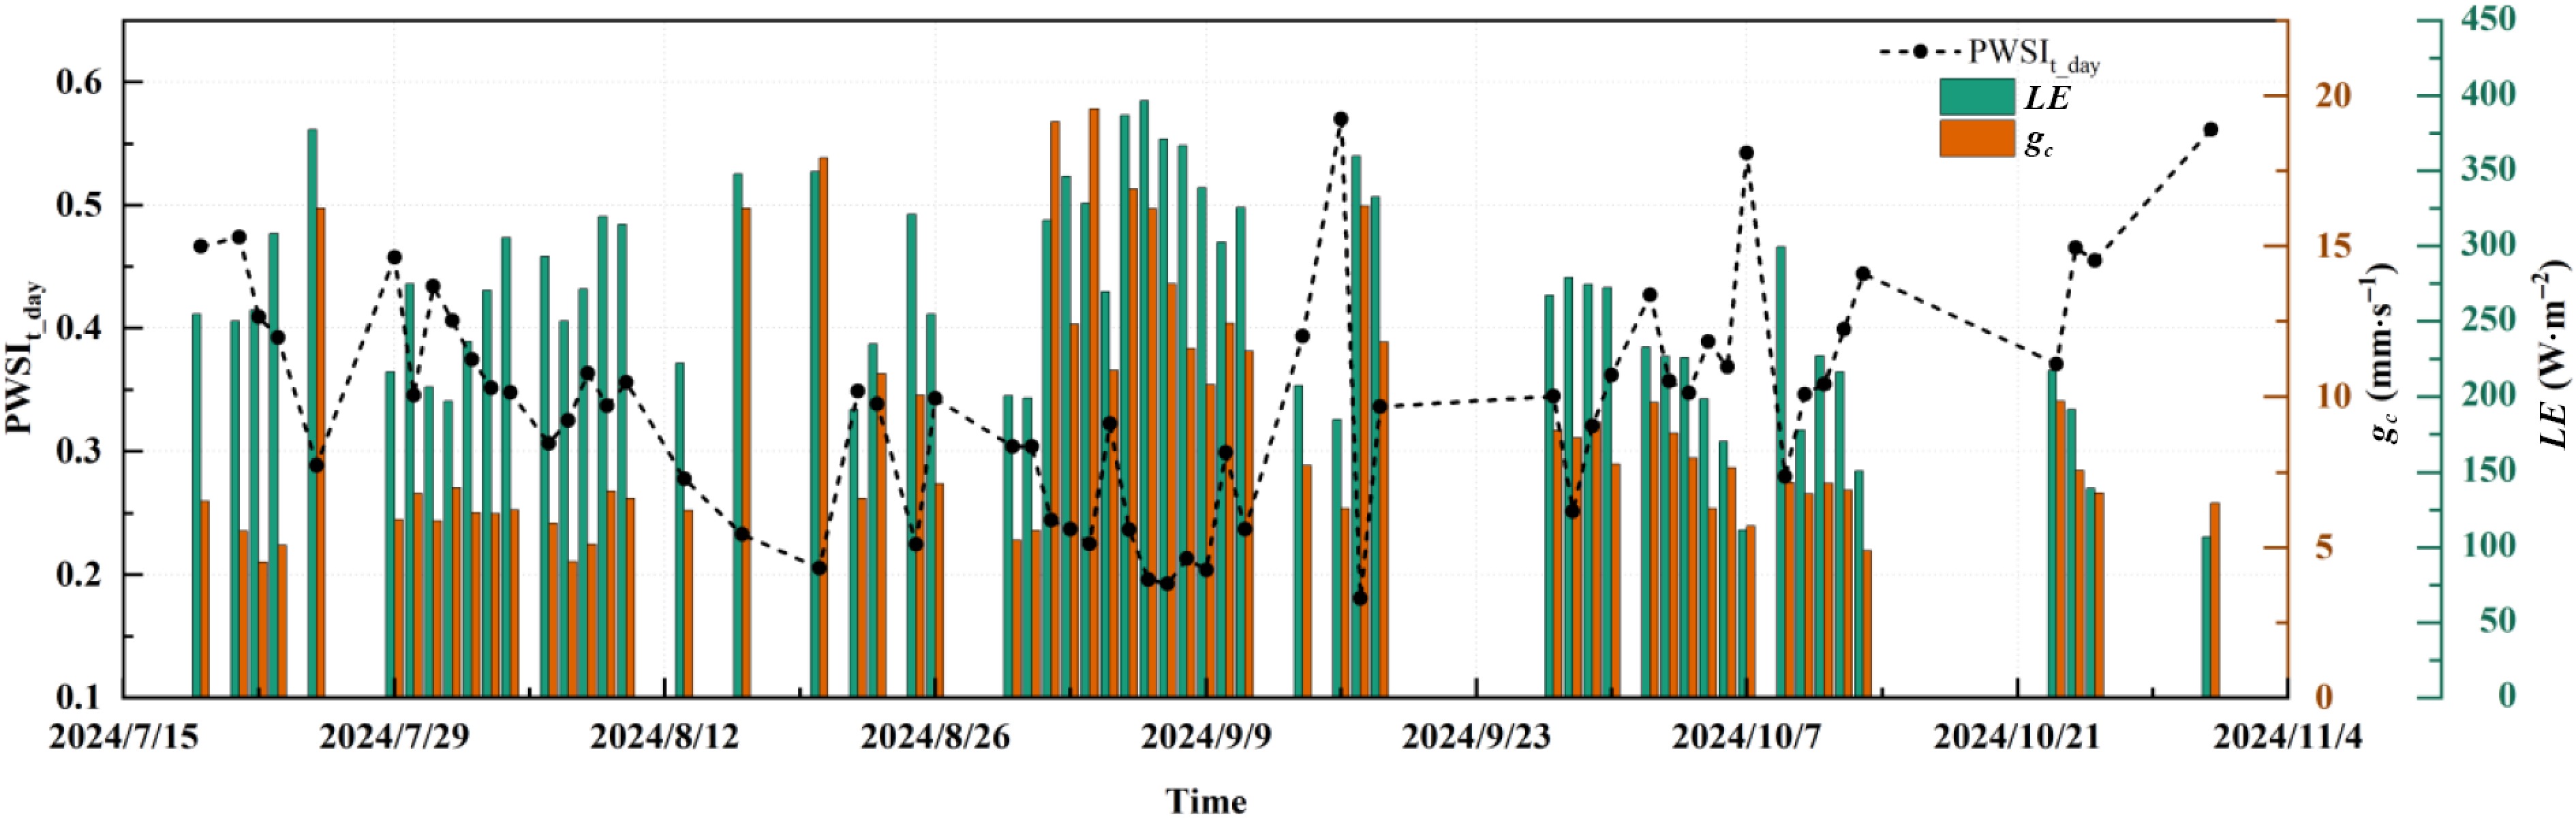
Figure 7.
Daily variations in the daytime mean theoretical plant water stress index (PWSIt_day), canopy conductance (gc), and latent heat flux (LE) on sunny days from July to October 2024. ** represents p < 0.01; * represents p < 0.05.
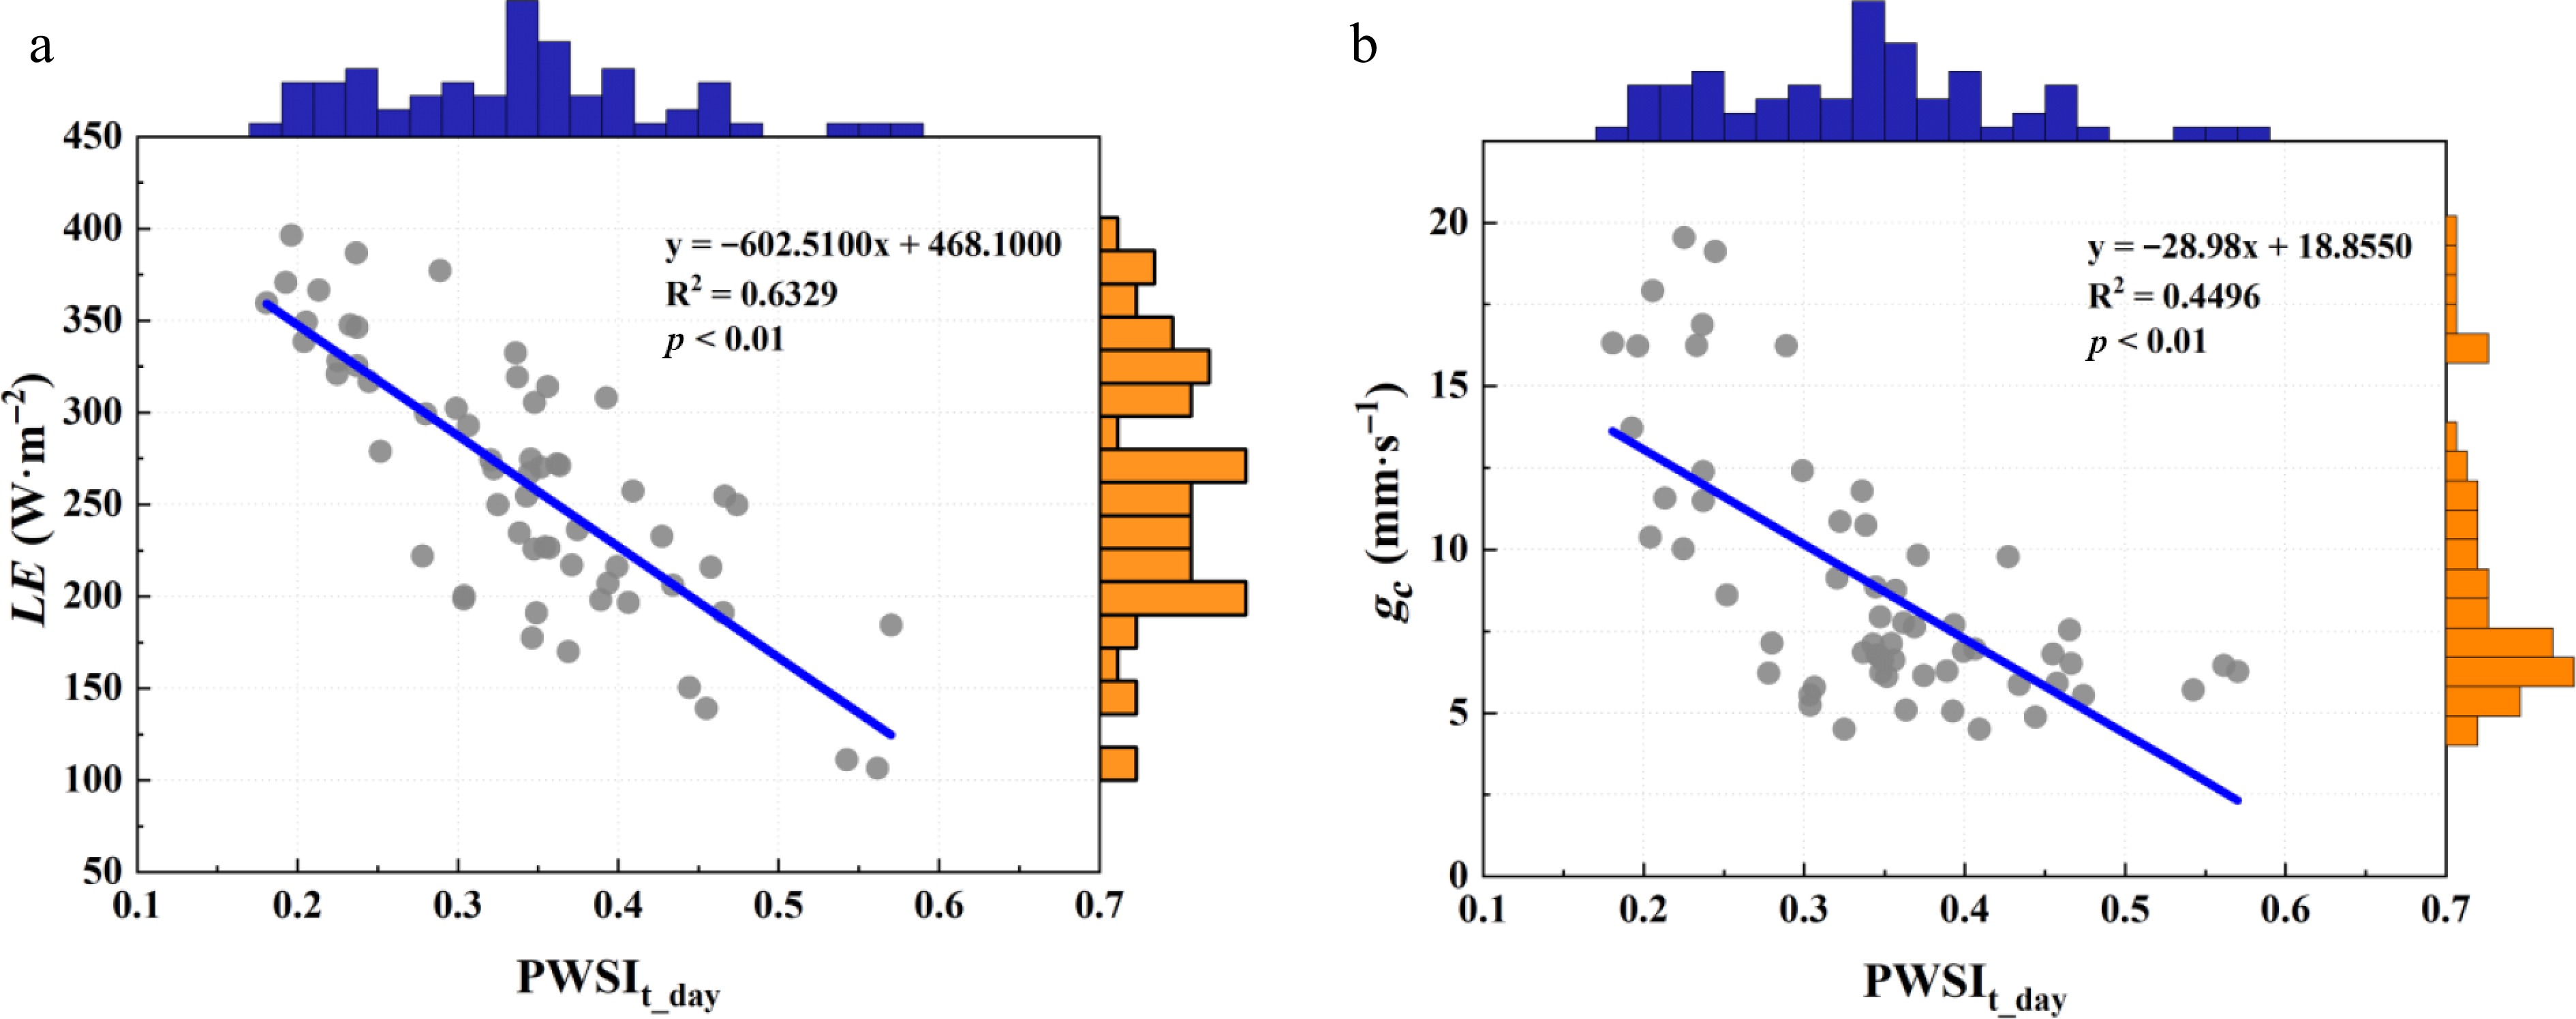
Figure 8.
Performance of the daytime mean theoretical plant water stress index (PWSIt_day) in indicating urban forest ecosystem water status. ** represents p < 0.01; * represents p < 0.05.
The optimal timing for detecting the water status of the urban forest ecosystem
-
Identifying the optimal monitoring window is essential for future mapping of water-deficit conditions across urban forests using unmanned aerial platforms. Table 3 summarizes the relationships between hourly PWSIt and gc and LE at various times. Across all times, increasing PWSIt corresponded to monotonic declines in both gc and LE. However, performance was poorest between 08:00 and 13:00, when PWSIt explained at most 23% of the variance in gc and 11% of that in LE. In contrast, PWSIt performed markedly better from 14:00 to 16:00. At 14:00, it accounted for 45% of the variability in gc; at 15:00 and 16:00, it explained 49% and 54% of the variability in LE, respectively. These findings suggest that PWSIt derived between 14:00 and 16:00 best represents the daily water status of the urban forest ecosystem in the study area.
Table 3. Relationships between theoretical plant water stress index (PWSIt) and canopy conductance (gc) and between PWSIt and latent heat flux (LE) at various times.
Time Slope Intercept R2 8:00 gc −0.0100 0.2976 0.0320 LE −0.0008 0.4058 0.0556 9:00 gc −0.0126 0.2601 0.1315** LE −0.0006 0.3169 0.1051* 10:00 gc −0.0131 0.2804 0.1995** LE −0.0005 0.3061 0.1060* 11:00 gc −0.0081 0.2735 0.1093** LE −0.0002 0.2489 0.0171 12:00 gc −0.0129 0.3831 0.2121** LE −0.0003 0.3433 0.0327 13:00 gc −0.0131 0.4530 0.2288** LE −0.0005 0.4706 0.1084* 14:00 gc −0.0215 0.6037 0.4517** LE −0.0010 0.6855 0.3262** 15:00 gc −0.0250 0.7123 0.3034** LE −0.0018 0.9660 0.4931** 16:00 gc −0.0221 0.7961 0.1857** LE −0.0022 1.1638 0.5400** 17:00 gc −0.0123 0.9101 0.0309 LE −0.0025 1.4561 0.3940** -
As global warming intensifies, seasonal drought events, such as summer and autumn droughts, have become more frequent across humid southern China, posing significant threats to the health of urban forest ecosystems. Currently, the monitoring and assessment of drought in forest ecosystems remain challenging, primarily due to the lack of effective indicators for water deficit[9]. SWC and VPD are commonly employed as indirect indicators of ecosystem water status and are used to assess ecosystem responses and adaptation strategies to drought. However, results reveal that neither SWC nor VPD is strongly associated with gc or LE (Fig. 4). This may be attributed to the fact that gc and LE are heavily influenced by external environmental conditions[41], particularly solar radiation, which serves as a key driver of LE (Fig. 3). Furthermore, plant water status is jointly regulated by soil water availability and atmospheric evaporative demand; thus, relying solely on a single indicator fails to accurately capture the water status of urban forests[35,42,43]. This further illustrates that traditional water status indicators are inadequate for the early detection of drought events in humid-region urban forests.
dT is strongly influenced by environmental factors, which compromise its use for accurate plant water-status monitoring. In this study, dT did not decrease with increasing Ws; instead, the two variables were significantly positively correlated (Fig. 3). Current studies on the influence of Ws on dT remain controversial. For example, Deng et al.[44] found that dT and Ws were negatively correlated when investigating the relationship between dT and environmental factors in a rubber plantation. In contrast, Kim et al.[45] reported that the dT of noble fir increased progressively with rising Ws. This conflicting result may be attributable to wind gustiness. According to the heat-transfer theory, Ws affects dT through convective heat exchange between the canopy and the air[46]. When the energy of convective heat exchange is held constant, higher Ws should reduce dT. However, this energy varies substantially under different environmental conditions, leading to the inconsistent dT responses to Ws reported across studies. Additionally, this study found that dT in the humid-region urban forest was primarily driven by solar radiation (Fig. 3), consistent with the observations of Kim et al.[47]. After removing the influence of radiation, the strong positive correlation between dT and LE disappeared, indicating that Rn was the primary reason why dT did not decrease despite increased heat dissipation (Fig. 3 and Supplementary Fig. S2). This pattern reflects the characteristics of humid-region forests, where the warming effect of Rn on dT is greater than the cooling effect of LE on dT due to the weak atmospheric evaporative demand; consequently, increased heat dissipation does not lead to a decline in dT[30]. This radiative dominance presents a significant challenge for drought detection based on dT in humid regions.
NWSB optimization and PWSIe limitations in humid-region urban forests
-
Developing thermal indices is an effective way to reduce environmental interference in dT and thereby improve the accuracy of plant water-deficit monitoring. Owing to its few-variable requirements (only Ta, RH, and Tc), computational simplicity, practical robustness, and ease of deployment, PWSIe is often prioritized for monitoring plant water status. In PWSIe, both dTll and dTul are derived from the NWSB; consequently, establishing an appropriate NWSB is critical for using PWSIe to track plant water status accurately. Idso et al.[18] suggested that, for crops, a robust NWSB can be established using dTll and VPD data collected 2–3 h after sunrise until 2–3 h before sunset. In contrast, the study of a humid-region urban forest shows that when hourly dTll and VPD data from the entire daytime period on sunny days are pooled together, the relationship collapses: the data are highly scattered and no significant correlation exists (Fig. 5). This result agrees with findings in olive orchards in Seville[48] and grapefruit trees in Molina de Segura[49]. The primary reason is that, in the study area, dT is governed by solar radiation rather than by VPD (Fig. 3).
By applying the time-segment regression method, the influence of diurnal solar radiation variation on the relationship between dTll and VPD in woody plants can be mitigated, thereby enhancing the reliability of NWSB (Table 1). Similar improvements have been documented for perennial woody plants such as pistachio, grapefruit, grapevine, and olive[48−51]. According to the theoretical equation proposed by Jackson et al.[19], the NWSB intercept is governed by aerodynamic resistance and Rn, whereas the slope depends solely on aerodynamic resistance. Consequently, the intercept is expected to increase with rising radiation or decreasing wind speed, while the slope should increase as wind speed declines. This expectation agrees with the findings: due to diurnal solar radiation variation and the gustiness of wind, the intercept of the urban-forest NWSB exhibited a pronounced diurnal pattern—an inverted U-shape that mirrors solar radiation—whereas the slope varied little, averaging −0.82 (Table 1), close to the value of −0.74 reported by Liu et al.[34] for Acacia pycnantha. Comparable results have also been reported by Testi et al.[50] and Egea et al.[48] in pistachio and olive orchards. Furthermore, it was observed that the R2 of the NWSB derived from daytime mean dTll and VPD data was higher than that of most single-hour NWSBs (Table 1). This finding supports the results of Osroosh et al.[52] in an apple orchard, who demonstrated that daytime mean NWSB can mitigate the interference of environmental factors.
Although the NWSB can be established through time-segment regression or by using daytime mean dTll and VPD data, this study shows that PWSIe derived from either single-hour or daytime mean NWSB is a weak indicator for monitoring water status in humid-region urban forests (Table 2, Fig. 6). This outcome conflicts with the findings of Alghory & Yazar[53], who successfully employed PWSIe to assess wheat water status under humid-season conditions; however, it is consistent with the results reported by Testi et al.[50] for pistachio. dT depends on the energy balance and is regulated by Rn and LE. The principle of PWSIe for monitoring plant water status is that VPD drives transpiration, enhancing evaporative cooling and thereby lowering dT. The magnitude of dT reduction varies across different plant water conditions. However, compared with crops, woody plants have lower transpirational cooling capacity, making dT less sensitive to water deficits. Previous studies report that NWSB slopes for crops such as sesame, maize, pumpkin, wheat and soybean are −2.70, −1.97, −3.09, −2.02, and −2.19 °C·kPa−1, respectively, whereas values for perennial woody plants—orange, mandarin, olive, peach and pistachio—are only −0.38, −0.50, −0.35, −1.70, and −1.35 °C·kPa−1[23,51,54−58]. This reduced sensitivity means that rising atmospheric evaporative demand causes smaller dT reductions in woody plants than in crops. Consequently, the resulting NWSB slopes are shallower, and the temperature differences between dTll and dTul required for PWSIe calculations are narrower. Coupled with the weakened driving effect of VPD on plant transpiration in humid-region urban forests, this indirectly amplifies the disturbance of dT by environmental fluctuations, particularly solar radiation (Fig. 3). However, the NWSB does not account for radiation interference. As a result, the measured dT frequently falls outside the dTll–dTul range, generating abnormal PWSIe values (Fig. 6). This leads to a deterioration in reliability and an inevitable worsening of the signal-to-noise ratio. Testi et al.[50] further noted that, even when a well-defined NWSB is available, PWSIe becomes ineffective for monitoring pistachio water status under VPD < 2 kPa. Liu et al.[30] observed similar limitations in a Quercus variabilis plantation and recommended integrating multiple meteorological variables and canopy-structural parameters through data-driven approaches to calculate dTll and PWSIe.
PWSIt enables early drought detection in humid urban forests
-
By explicitly incorporating solar radiation and Ws-dependent aerodynamic resistance into the calculation of dTll and dTul, PWSIt overcomes the challenge in humid-region forests—where the warming effect of Rn on dT outweighs the cooling effect of LE on dT—and thereby accurately tracks variations in gc and LE (Figs 7, 8). Comparable findings have been reported by Ben-Gal et al.[59], Han et al.[60], and Liu et al.[30]. This confirms that PWSIt is suitable for the early detection of water deficits and the timely identification of drought events in urban forests. Previous studies often regard midday as the optimal window for PWSI-based water-status detection, as high transpiration rates and pronounced evaporative cooling amplify differences in dT and gc under different water conditions[34,51]. In contrast, these results indicate that PWSIt performs best between 14:00 and 16:00 (Table 3), a finding consistent with the observations of García-Tejero et al.[39] in a vineyard. Such a difference may be traced to the orientation of the infrared camera. Currently, some studies use a nadir view, which maximizes incident radiation at noon but covers only a small observation area. Owing to site constraints, the study's camera faced northeast; direct solar irradiation of the canopy in this direction peaks between 14:00 and 16:00 (the distributions of solar zenith and solar azimuth angles range from 18° to 67° and from 241° to 262°, respectively), which yields the most pronounced thermal contrast for drought detection. Future work should systematically evaluate how camera orientation influences PWSIt performance and the optimal detection window, thereby laying the groundwork for PWSI deployment on unmanned aerial platforms.
The early-detection capability of PWSIt can translate trees' physiological responses to warming and drought into a quantifiable assessment of adaptive potential. Beyond deepening the understanding of stress-resistance mechanisms, this indicator directly serves climate-smart forestry management: by identifying 'vulnerable' and 'robust' individuals, it lays a critical foundation for building more resilient and adaptable urban forests of the future.
-
SWC and VPD alone are ineffective for detecting early drought events in humid-region urban forests. Within humid-region forests, dT is strongly controlled by solar radiation; combined with the region's low atmospheric evaporative demand and the comparatively weak sensitivity of dT to water deficit in woody plants, this severely limits the ability of the PWSIe to provide both early detection and continuous tracking of water deficits. By contrast, the PWSIt incorporates meteorological and resistance parameters, thereby suppressing solar-radiation-induced noise in dT and reliably reflecting variations in gc and LE, offering a robust method for early detection of drought events in urban forests. When the camera faces northeast, PWSIt values obtained between 14:00 and 16:00 are recommended for assessing forest water status. Future research should systematically evaluate how sensor deployment strategies affect the accuracy of PWSI monitoring.
-
The authors confirm contributions to the paper as follows: study conception and design: Liu L, Liu W; methodology: Yin P, Peng Q; software: Peng Q, Tian Z, Liang X; validation: Ye X, Li H, Liu L; visualization: Xiao Y, Cheng X, Luo K; draft manuscript preparation: Liu L; writing—review and editing: Liu L, Cheng X, Yin P; funding acquisition: Liu L. All authors reviewed the results and approved the final version of the manuscript.
-
The datasets generated during and/or analyzed during the current study are not publicly available due to the author is preparing to build a comprehensive database, but are available from the corresponding author upon reasonable request.
-
The authors declare that there is no conflict of interest.
- Supplementary Fig. S1 The relationship between canopy conductance (gc) and latent heat flux (LE).
- Supplementary Fig. S2 The relationship between canopy-air temperature difference (dT) and latent heat flux (LE) residuals after controlling for net radiation (Rn)
- This article is an open access article distributed under Creative Commons Attribution License (CC BY 4.0), visit https://creativecommons.org/licenses/by/4.0/.
-
About this article
Cite this article
Peng Q, Yin P, Ye X, Li H, Liang X, et al. 2026. Thermal-index monitoring of water status in humid-region urban forests: a canopy-temperature-based approach. Smart Forestry 1: e003 doi: 10.48130/smartfor-0025-0003 

Thermal-index monitoring of water status in humid-region urban forests: a canopy-temperature-based approach
- Received: 29 August 2025
- Revised: 21 December 2025
- Accepted: 25 December 2025
- Published online: 28 January 2026
Abstract: The plant water stress index (PWSI) based on canopy temperature has been widely employed to monitor crop water status in arid and semi-arid regions; however, its utility in forest ecosystems, particularly urban forests in humid regions experiencing pronounced seasonal drought, remains unexplored. This study selected the urban forest in Nanchang, China, as the research object. Through continuous observations of canopy temperature, meteorological variables, latent heat flux (LE), and canopy conductance (gc) from July to October 2024, the study evaluated the performance of traditional water-status indicators: soil water content (SWC) and vapor pressure deficit (VPD), along with two canopy-temperature-derived thermal indices: the empirical PWSI (PWSIe) and the theoretical PWSI (PWSIt) for detecting water deficits in humid-region urban forests. Results showed that neither SWC nor VPD effectively tracked temporal variations in gc or LE in this humid-region urban forest. Under well-watered conditions, non-water-stressed baselines (NWSB) were successfully established using either hourly daytime data or daytime mean data of the canopy-air temperature difference (dT) vs VPD. Nevertheless, owing to the combination of low atmospheric evaporative demand, weak sensitivity of dT to water deficit in woody vegetation, and strong radiative control of dT, PWSIe explained at most 29% of the variance in gc and 31% of that in LE, irrespective of the NWSB formulation. In contrast, PWSIt, derived from the canopy energy balance and the Penman-Monteith equation, exhibited good monitoring performance, with daytime mean PWSIt explaining 45% of the variance in gc and 64% of that in LE. When canopy temperature was acquired using a northeasterly-oriented infrared camera, the optimal assessment window for ecosystem water status was 14:00–16:00 local time. Collectively, our findings demonstrate that PWSIt is a robust indicator for tracking water-status dynamics in humid-region urban forests, providing a reliable early-warning tool for detecting drought events in these ecosystems.