













-
Natural rubber, a vital strategic resource, originated in South America's Amazon Basin[1]. Southeast Asia shifted to rubber cultivation in the 1890s, with demand surging during World Wars I and II. Since the 1990s, the region has dominated global supply (> 80%), and Thailand leads as the top producer and exporter[2−4]. Thailand's rubber plantations, the country's largest man-made forests, play a key role in carbon sequestration, aligning with Thailand's Nationally Determined Contribution for carbon neutrality by 2065[5].
Mapping and monitoring these carbon stocks face two challenges. First, high-precision, long-term mapping is hampered by cloud cover and spectral similarities with tropical forests[6−8]. Remote sensing helps, but current methods have limitations. Most studies have utilized medium- and high-resolution optical datasets such as Landsat and Sentinel-2, constructing vegetation index time series (e.g., Normalized Difference Vegetation Index [NDVI], Enhanced Vegetation Index [EVI], and Normalized Difference Moisture Index [NDMI]) and applying phenological thresholds or normalized difference analyses to achieve high-accuracy mapping[9−13]. Other studies have combined high-resolution imagery with field data and measurements to develop regional classifications[14]. However, these existing approaches demonstrate three fundamental limitations when applied to Thailand's context. First, phenology-based methods perform poorly across Thailand's diverse climatic zones[10,12], where rubber plantations exhibit variable leaf-flushing patterns, including pronounced deciduous phases in seasonal tropical regions vs more evergreen behavior in equatorial climates. Second, threshold-based vegetation indices lack transferability across heterogeneous landscapes, requiring region-specific calibration that undermines large-scale application[15]. Third, none of these studies have integrated plantation age estimation with spatial mapping, despite age being a critical determinant of rubber plantation structure and carbon accumulation patterns. Recent debates questioning high-resolution maps of rubber-driven deforestation further highlight the urgent need for robust, evidence-based approaches to avoid over- or underestimation of environmental impacts[16−18].
The second challenge lies in developing reliable regional models for estimating live biomass carbon stocks in rubber plantations. Current approaches predominantly rely on optical or radar data, which are prone to signal saturation in high-biomass forests, limiting their effectiveness in mature plantation systems[19−21]. Studies applying Sentinel-1 SAR (Synthetic Aperture Radar) data for biomass estimation in Southeast Asian rubber plantations have reported moderate accuracies, with signal saturation typically occurring above 100−150 Mg/ha aboveground biomass[22,23]. LiDAR offers vertical structural insights but lacks spatial and temporal coverage for national-scale applications[24−26]. Stand age is a key variable for modelling carbon accumulation. Conventional methods for obtaining forest age, which include forest inventories, field surveys, and household interviews, are subject to multiple limitations in large-scale applications. While forest inventories provide high-quality data, their coverage is limited, and update cycles are long. Field surveys are expensive and difficult to scale, and social surveys suffer from subjectivity and uncertain data reliability[27]. Remote sensing offers a solution. Landsat time-series data enable detailed characterization of long-term forest changes and disturbance events[28,29]; several mature approaches have been developed, such as the Vegetation Change Tracker (VCT)[30], the spectral trajectory-based LandTrendR[31], the Breaks for Additive Season and Trend (BFAST) algorithm[32], and the Continuous Change Detection and Classification (CCDC) method[33]. However, rubber plantation mapping and age estimation face unique challenges. While several studies have attempted to map rubber plantations in the Greater Mekong Subregion, including Thailand, these efforts have been constrained by limited temporal coverage and spatial resolution. Studies examining land use change in Thailand have documented rubber plantation expansion, yet these analyses have not integrated plantation age estimation with live biomass carbon stock assessment in a spatially explicit framework. To date, no study has combined high-accuracy annual mapping, disturbance-based age estimation, and live biomass carbon stock assessment in a unified framework for Thailand's rubber plantations at the national scale.
To address these challenges, this study developed a framework for dynamic monitoring of rubber plantation extent, expansion, stand age structure, and associated live biomass carbon stock (hereinafter referred to as 'carbon stock') changes at the national scale in Thailand. Specifically, we aimed to generate high-accuracy annual spatial distribution maps of rubber plantations, forest age, and their corresponding carbon stocks to systematically evaluate the spatiotemporal dynamics of Thailand's rubber plantation carbon stocks over recent decades. This framework explicitly links plantation expansion, age structure, and carbon dynamics within a unified analytical framework. The results will provide essential empirical support for the sustainable management of rubber plantations and carbon neutrality management in Thailand.
-
Our methods comprise four main steps (Fig. 1): (1) data preparation, where multi-source satellite datasets and field or Google Earth samples were preprocessed; (2) time-series classification of rubber plantations, in which a phenology-based classification framework using the Random Forest algorithm on Google Earth Engine (GEE) integrated spectral, phenological, terrain, texture, and change-detection features was applied to produce annual rubber maps (2003–2022); (3) stand-age extraction and carbon stock estimation, where rubber stand age was determined using a CCDC segmentation method and carbon stock was estimated with a logistic age-carbon model; and (4) spatiotemporal and environmental analysis, which explored the spatial distribution, temporal trends, and environmental factors (elevation, slope, latitude) influencing the carbon stock of rubber plantations.
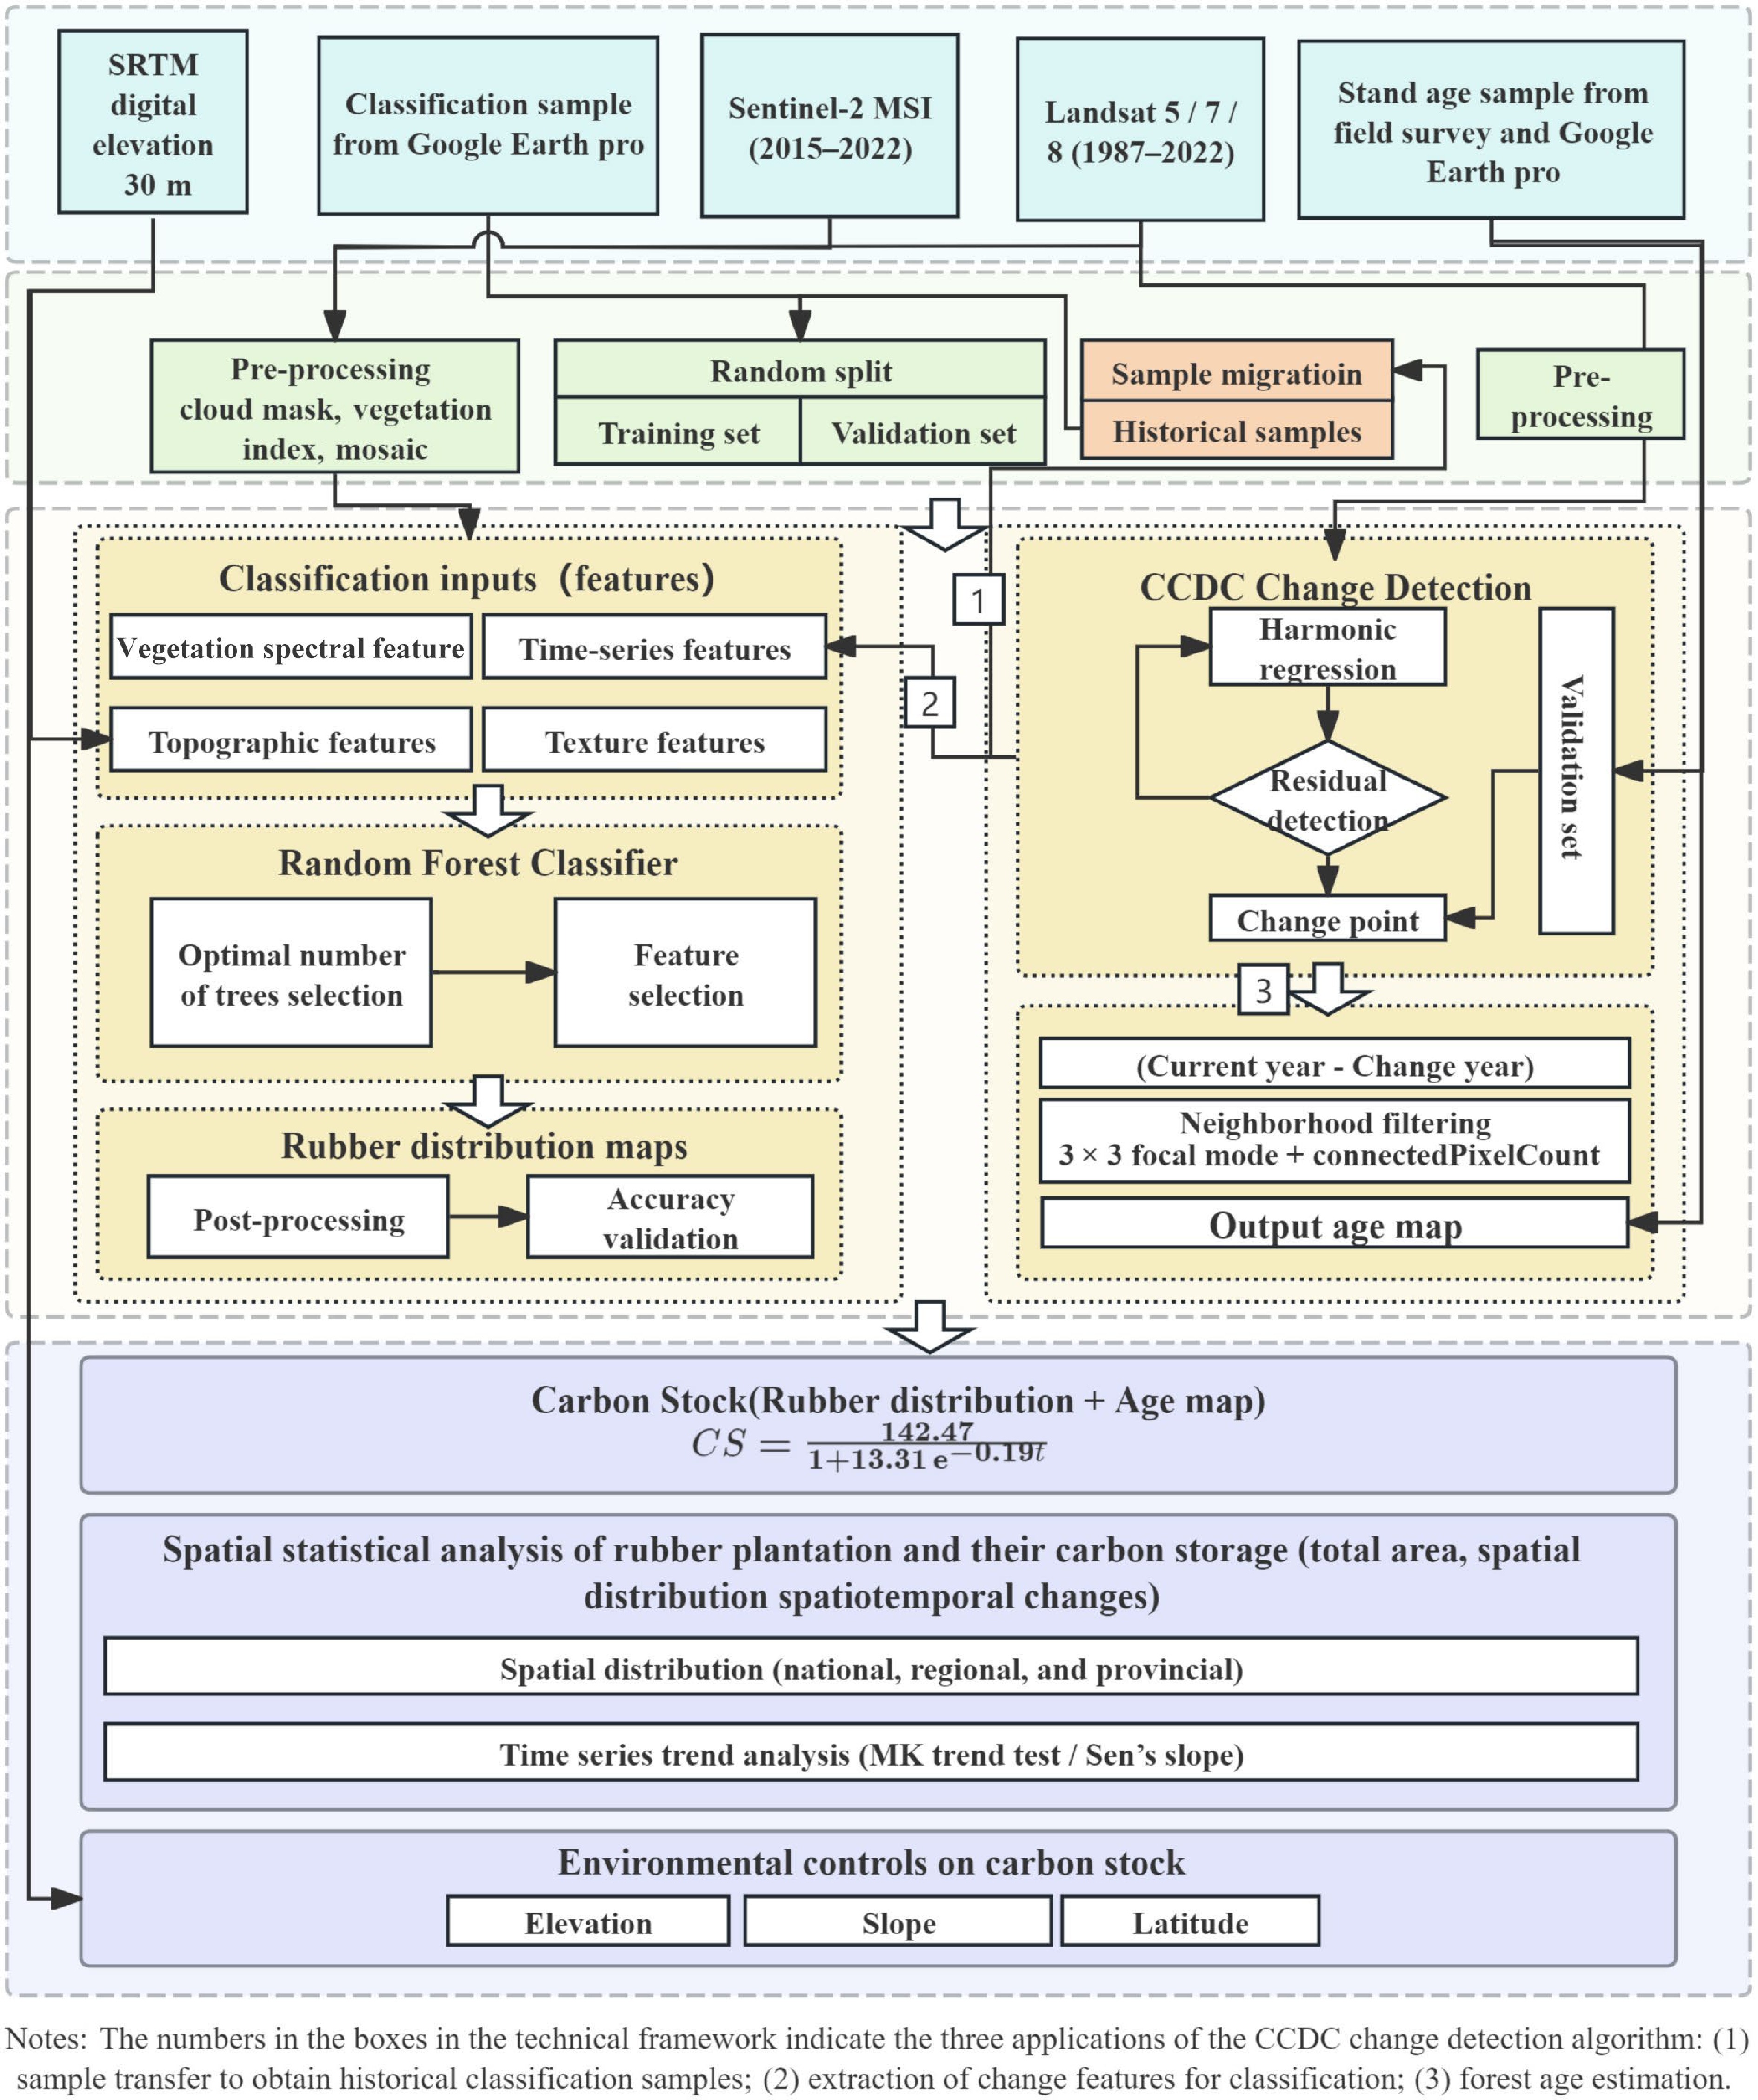
Figure 1.
Workflow of the present study.
Study area
-
Thailand has diverse topography (mountains in the north and west, a central plain, and lowlands on the southern peninsula, Fig. 2), and a strongly seasonal climate, with ~1,622 mm mean annual rainfall (about 1,000–3,500 mm regionally) and temperatures of 24–30 °C. Rubber cultivation is concentrated on the southern peninsula where rainfall commonly exceeds 2,000 mm yr−1, and temperatures range from 25–30 °C[34], but has expanded into eastern and northeastern provinces in recent decades under government promotion and economic incentives[35]. Rubber was introduced to Southern Thailand in the early 20th century[36], and subsequent diversification policies and the 2005–2011 price boom accelerated expansion; production is dominated by smallholders, with some larger estates in the south[37,38]. Plantations are typically monocultures (400–500 trees ha−1), with tapping beginning after 6–7 years and an economic lifespan of ~25–30 years before replanting[39,40].
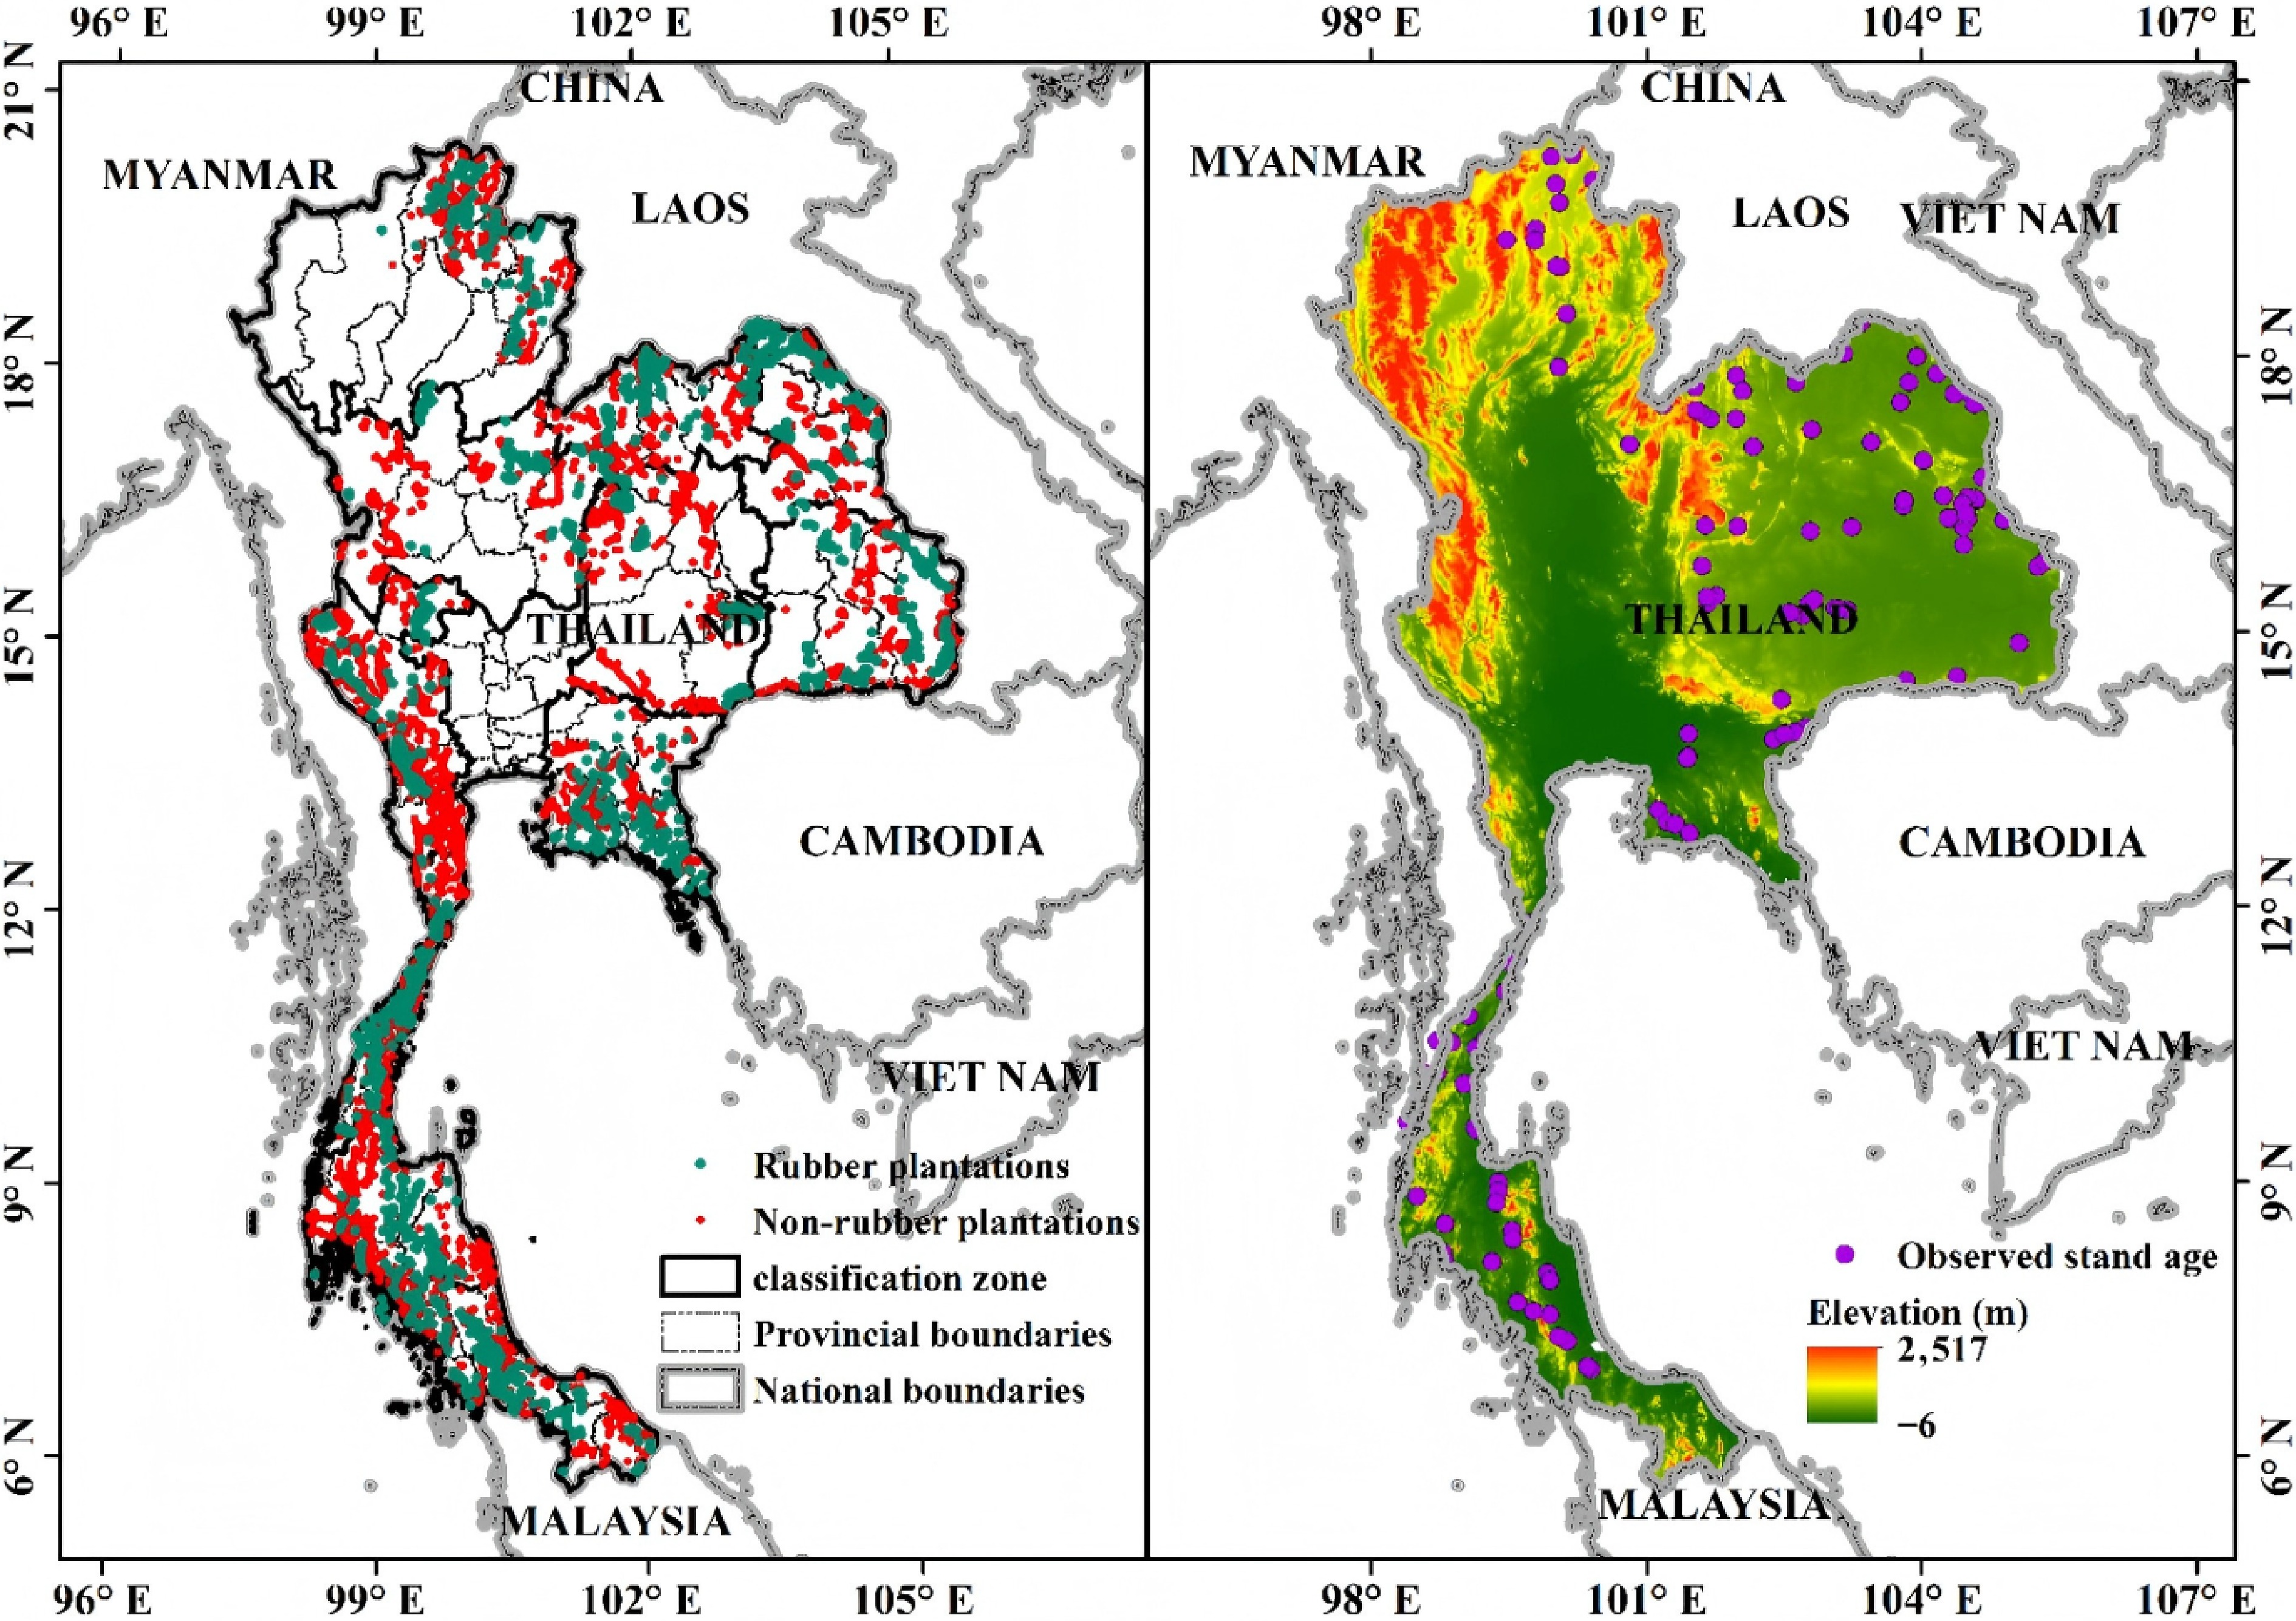
Figure 2.
Map of the study area: (a) Samples (rubber and non-rubber) and classification zones. (b) Stand age sample points and elevation.
Data sources
-
Multiple remote-sensing datasets from 1987−2022 were used to ensure comprehensive spatial and temporal coverage (Table 1). Landsat time-series data—including Landsat 5 TM (1987−2011), Landsat 7 ETM+ (1999−2022), and Landsat 8 OLI (2013−2022)—provided the primary long-term optical observations at 30 m spatial resolution. Sentinel-2 MSI data (2015−2022) supplemented the Landsat archive with higher spatial resolution (10−20 m) and a 5-d revisit cycle, which was particularly valuable for recent years. All available cloud-free or partially cloudy (cloud cover < 30%) scenes were obtained through GEE. Ancillary datasets include the 30 m SRTM (Shuttle Radar Topography Mission Digital Elevation Model) DEM for providing elevation and slope. All datasets were resampled to a spatial resolution of 30 m.
Table 1. Data used in this study.
Dataset Description Period Source USGS/SRTMGL1_003 Global DEM with 30 m spatial resolution; used for terrain analysis (slope, aspect). ~2000 https://developers.google.com/earth-engine/datasets/catalog/USGS_SRTMGL1_003 LANDSAT/LC08/C02/T1_L2 Landsat 8 surface reflectance (30 m, 16-d revisit); for large-area classification and change detection. 2013−2022 https://developers.google.com/earth-engine/datasets/catalog/LANDSAT_LC08_C02_T1_L2 LANDSAT/LE07/C02/T1_L2 Landsat 7 surface reflectance (30 m, 16-d revisit); for land-cover analysis and change detection. 1999−2022 https://developers.google.com/earth-engine/datasets/catalog/LANDSAT_LE07_C02_T1_L2 LANDSAT/LT05/C02/T1_L2 Landsat 5 surface reflectance (30 m, 16-d revisit); for long-term change monitoring. 1984−2011 https://developers.google.com/earth-engine/datasets/catalog/LANDSAT_LT05_C02_T1_L2 COPERNICUS/S2 & S2_SR_HARMONIZED Sentinel-2 multispectral imagery (10−20 m, 5-d revisit); includes Level-1C (TOA reflectance) and Level-2A (surface reflectance, harmonized). Used for vegetation, soil, and urban feature monitoring. 2015−2022 https://developers.google.com/earth-engine/datasets/catalog/COPERNICUS_S2_SR_HARMONIZED High-resolution classification samples Rubber polygons digitized from high-resolution imagery for classification. Google Earth Pro Rubber stand ages in Thailand Field survey rubber plots. [42] Classification training/validation samples primarily came from: (1) On-screen digitization using high-resolution Google Earth Pro imagery; all 2022 samples were derived by visual interpretation of high-resolution imagery. Interpretation symbols are shown in Supplementary Table S1; (2) Sample transfer. Samples from 2003−2021 were obtained via the CCDC-based sample transfer method proposed by Xu et al.[41], which can semiautomatically obtain historical samples based on a benchmark year with ground truth samples.
According to local land-cover composition, a classification system including impervious surface, water, oil palm, cropland, other forests, shrubs, and rubber plantations was designed. For the 2022 samples (Supplementary Table S2), the data were randomly split into a training set and a validation set at a 7:3 ratio. Training and validation samples were separated prior to sample transfer and remained independent throughout the study. Samples for years prior to 2022 were derived by transferring samples from the 2022 benchmark year (Supplementary Table S3), with changed samples filtered out using the CCDC algorithm. Specifically, pixel-level temporal consistency between 2022 and each historical year was evaluated using CCDC-detected breakpoints; samples were retained only when no disturbance was detected and were further cross-checked against high-resolution Google Earth imagery to ensure reliability. To further ensure the reliability of transferred samples, CCDC-based filtering and high-resolution imagery cross-checking collectively guaranteed temporal consistency. The number of training and validating samples used for each year has now been explicitly reported in Supplementary Tables S3 and S4. The proposed sample migration method achieved an average OA of migrated rubber plantation samples exceeding 90%, validated by visual interpretation from Google Earth imagery in this study. Due to GEE computational limits, Thailand was partitioned into 12 classification zones, and training and validation samples were independently collected and transferred within each zone to ensure spatial representativeness. Both sets trace back to the 2022 benchmark, which may introduce residual temporal dependence; this was mitigated by the quality-control procedures described above.
Rubber stand age samples for validation were obtained from two sources. One is the planting year data from Lan et al.[42]. That dataset recorded planting years for 73 rubber plots across Thailand based on field surveys, and stand ages were computed from planting years. The additional age samples were screened using time series Google Earth Pro imagery. After excluding samples with ambiguous transitions, 57 high-quality independent samples were retained for validation (Fig. 2b). The samples were spatially distributed across the major rubber-growing regions of Thailand, with most samples located in Southern Thailand where rubber plantations are concentrated, while additional samples were collected from the eastern, northeastern, and northern regions. Of the 57 validation samples, 22 were obtained from field records reported by Lan et al.[42] and 35 were interpreted from historical Google Earth imagery. These samples range from 4 to 28 years (mean = 11.8), representing three growth stages: young (≤ 6 years, n = 7), growth (7–16 years, n = 38), and mature (≥ 17 years, n = 12).
Time series classification of rubber plantations
Feature extraction and selection
-
The feature set comprised spectral, terrain, phenological, change detection, and texture variables (Table 2).
Table 2. Variable set used for key variable selection in this study.
Feature group Variable (abbr.) Definition/description Ref. Spectral Bands (B) Blue, Green, Red, NIR, SWIR1, SWIR2 NDVI, NDVImin/mean/max $ \dfrac{\text{NIR}-\text{RED}}{\text{NIR}+\text{RED}} $ [44] NDBI $ \dfrac{\mathrm{SWIR}1-\text{NIR}}{\mathrm{SWIR}1+\text{NIR}} $ [45] NDMI $ \dfrac{\text{NIR}-\text{SWIR}2}{\text{NIR}+\text{SWIR}2} $ [43] MNDWI $ \dfrac{\text{GREEN}-\text{SWIR}1}{\text{GREEN}+\text{SWIR}1} $ [46] NBR $ \dfrac{\text{NIR}-\text{SWIR}1}{\text{NIR}+\text{SWIR}1} $ [47] EVI $ 2.5\times \dfrac{\text{NIR}-\text{RED}}{\text{NIR}+6\text{RED}-7.5\text{BLUE}+1} $ [48] Phenology EVI_Jan (EVIj), EVI_Feb (EVIf), EVI_Mar (EVIm) Monthly EVI composites for Jan–Mar [41] Texture SAVG, ENT, ASM, IDM GLCM sum average, entropy, angular second moment, inverse difference moment [43] Change detection RMSE, DensityObs, Mag Root-mean-square error, observation density, maximum amplitude [33] Terrain Elevation, aspect, slope Elevation, aspect, slope [49] Note: RED, BLUE, NIR, SWIR1, and SWIR2 denote reflectance in the red, blue, near-infrared, shortwave-infrared 1, and shortwave-infrared 2 bands, respectively. Spectral and terrain features
-
Spectral features included spectral bands (blue, green, red, near-infrared [NIR], shortwave infrared 1 [SWIR1], shortwave infrared 2 [SWIR2]) and indices: NDVI, Normalized Burn Ratio (NBR), NDMI, Normalized Difference Built-up Index (NDBI), and Modified Normalized Difference Water Index (MNDWI) (see Table 2 for calculation details). Terrain features (slope, aspect, elevation) were derived from the 30 m NASA SRTM DEM.
Phenological features
-
To capture rubber phenology, monthly composites of the EVI for January–March within the phenological window were generated, and a dynamic feature selection approach was applied to account for interannual variability of rubber phenology[41].
Texture features
-
Within the phenological window, monthly image composites for January–March were generated, and principal component analysis (PCA) was performed for each month. For the first principal component of each month, Gray-Level Co-occurrence Matrix (GLCM) textures were computed using a 3 × 3 moving window, including angular second moment (ASM), inverse difference moment (IDM), sum average (SAVG), and entropy (ENT)[43]. At the Landsat spatial resolution, these texture features characterize neighborhood-scale canopy structural heterogeneity rather than individual plantation row patterns.
Change-detection features
-
CCDC-derived metrics, which include observation density, band-wise and index-wise root mean square error (RMSE), and maximum amplitude, were utilized for the blue, green, red, NIR, SWIR1, and SWIR2 bands, as well as the Normalized Difference Fraction Index (NDFI)[41].
Feature selection
-
To ensure that only the most informative and non-redundant predictors were retained, feature importance was quantified using the Gini impurity index derived from the Random Forest algorithm using the training samples. All candidate variables were ranked in descending order of importance, and progressively expanded subsets were constructed by adding the top-ranked variables in increments of 5, starting from the 10 most important features. Each subset was independently used for classification, and the mapped result was evaluated based on overall classification accuracy (OA) using the same validation samples, and the feature combinations yielding the maximum OA were identified as the optimal subset. This systematic feature selection procedure minimized information redundancy and enhanced both the stability and efficiency of the classification model.
Time series classification workflow
Classifier
-
Random Forest was adopted as the classifier (RandomForestClassifier), a representative bagging ensemble based on decision trees. The algorithm trains an ensemble of trees on bootstrapped samples and random subsets of input variables. The final class was obtained by majority vote across Ntrees. The variables PerSplit and maxNodes were set to their default values, and the number of trees was capped at 150.
Year-by-year classification strategy
-
A phased classification framework was developed to accommodate variations in data availability and quality while ensuring temporal continuity (2003−2022) and spatial consistency. For the period 2016−2022, Sentinel-2 and Landsat 8 imagery were integrated to capitalize on the enhanced spatial resolution and spectral information. Between 2013 and 2015, only Landsat 8 data were employed due to the incomplete coverage of Sentinel-2. For the year 2012, a specialized processing workflow was applied to Landsat 7 ETM+ imagery to correct for SLC-off artifacts. Prior to 2011, Landsat 5 served as the sole source of medium-resolution imagery with consistent temporal coverage. All phases followed a unified processing chain, which includes cloud masking, monthly and annual compositing, computation of vegetation and surface indices, extraction of texture features, and integration of terrain data, with adaptations limited to sensor-specific spatial resolutions and band combinations to maintain feature comparability and temporal coherence.
Post-classification processing and accuracy assessment
-
To reduce salt-and-pepper noise, a 3 × 3 majority filter was applied to annual rubber maps. Then, a class-logic check rule framework was proposed by integrating breakpoints derived from CCDC with the growing and management characteristics of rubber plantations: (1) if a long-term sequence of non-rubber years contained a single rubber year and no breakpoints were detected, it was relabeled as a non-rubber year; (2) if a long-term sequence of rubber years contained a single non-rubber year, it was relabeled as a rubber year; (3) if no CCDC breakpoints were identified across all years, which indicates no detected clearing after rubber establishment, for the target pixel, it was labeled as rubber plantations for all years.
Four confusion-matrix-based metrics, including Overall Accuracy, Cohen's Kappa, Producer's Accuracy, User's Accuracy[50], and F1-Score, which considers both accuracy and recall[51], were used to evaluate the mapping accuracy.
Stand age extraction
-
By combining long-term Landsat time series with the CCDC algorithm, a strategy of bidirectional temporal segmentation combined with per-pixel RMSE optimization was implemented to enhance breakpoint credibility and the robustness of initial-year determination[33]. The overall procedure comprises the following four steps.
Feature construction
-
Landsat Collection 2 Tier 1 Level-2 surface reflectance products spanning the study area from 1987 to 2022 were employed. Six spectral bands (BLUE, GREEN, RED, NIR, SWIR1, and SWIR2) and two auxiliary indices (EVI and NBR) were used. EVI and NBR were selected because EVI is sensitive to vegetation vigor and is less prone to saturation under high-biomass conditions, making it suitable for monitoring growth dynamics in rubber plantations[48], and NBR is highly sensitive to disturbance events such as land clearing and fire, which helps accurately capture the establishment time of plantations[47]. The synergistic use of these two indices allows the model to simultaneously anchor the starting point of the plantation via NBR and track the biophysical aging process via EVI, thereby reducing the uncertainty inherent in using a single spectral indicator for age estimation.
Implementation of the CCDC algorithm
-
CCDC fits per-pixel time series with a harmonic model using Robust Iterative Reweighted Least Squares. When residuals of several consecutive observations exceed a threshold, a breakpoint is declared, enabling continuous monitoring of long-term land-cover change. The key parameter settings in this study are shown in Supplementary Table S5.
Stand age calculation, spatial optimization, and validation
-
CCDC outputs multiple segments, starting times, and the corresponding fitting RMSE for each pixel. We extracted information for the first five segments and, in order from later to earlier, searched for the first valid start year (non-zero and earlier than 2023) as the candidate establishment year for that pixel's rubber plantation. The RMSE for that segment was recorded as a quality indicator. The above procedure was performed separately for the forward and reverse results, yielding two independent sets of start years and RMSEs.
At the per-pixel scale, RMSE values from the forward and backward directions were compared[31]. The direction with the smaller RMSE (indicating a better fit) was selected to determine the final establishment year. For pixels where no valid change was detected in either direction, the series start year (1987) was assigned as a conservative estimate[7,52]. Stand age was calculated by subtracting the establishment year from the baseline year of 2022[52]. The equation is as follows:
$ \mathrm{Stand}\;\mathrm{age}=2022-\mathrm{establishment}\;\mathrm{year}+1 $ (1) To suppress salt-and-pepper noise and enhance patch homogeneity, two spatial post-processing steps were applied: (1) a 3 × 3 moving-window mode filter was used to correct isolated anomalous pixels. (2) An eight-neighborhood connectivity analysis was then conducted to further remove small and fragmented patches. Each pixel was examined together with its eight surrounding neighbors to identify isolated patches smaller than three pixels in size.
A total of 57 high-quality validation samples, spanning an age gradient of 4 to 28 years, were used for the assessment. These samples were rigorously screened from an initial set of 73 candidates (comprising field plots and samples interpreted from Google Earth time-series imagery). To ensure maximum reliability, we excluded samples where the planting year could not be unambiguously confirmed due to insufficient historical imagery or conflicting interview records. Statistical comparisons between estimated and observed stand ages were performed, and the coefficient of determination (R2) and root mean square error (RMSE) were used to quantitatively assess accuracy.
Carbon stock estimation
-
A locally developed logistic stand-age inversion model developed by Petsri et al. for rubber plantations in Thailand was used to estimate carbon stock[53]. The model was fitted using data from 723 field plots, including diameter at breast height, height, and dry biomass of different organs (stem, branches, leaves, and roots) (please refer to Table 1 in Petsri et al.[53] for more detailed data). The equation of the model is as follows:
$ CS=\dfrac{142.47}{1+13.31{e}^{-0.19t}} $ (2) where CS is the carbon stock per unit area (t C ha−1) and t is the stand age (years). This local model has been proven to effectively reflect the growth dynamics of rubber plantation stand carbon stock in Thailand with high goodness-of-fit (R2 = 0.98)[53].
To quantify the propagation of errors, we applied a sensitivity analysis based on the average uncertainty of stand-age estimation, which was determined to be 3.16 years in this study. This value represents the average deviation between our remote-sensing-derived ages and the ground-truth records.
At the regional scale, the 30-m rubber plantation data were used, and the carbon-stock equation was applied at the pixel scale to obtain per-pixel carbon stock. Finally, regional overlay and aggregation of pixel values yielded the total carbon stock of rubber plantations.
Trends in carbon stock dynamics were assessed using the Theil–Sen estimator and the Mann–Kendall test. Additionally, we examined the association between carbon stock and topographic variables, including elevation and slope.
-
The time-series classification framework performed well. Overall accuracies exceeded 90% in all years, ranging from 90.20% to 96.55%, with a mean of 94.03% (Fig. 3a). For rubber plantations specifically, the mean producer's accuracy was 94.71%, and the user's accuracy was 92.34%. For 2022, the confusion matrix indicated an overall accuracy of 92.63%, a Kappa coefficient of 0.91, a producer's accuracy of 92.61%, a user's accuracy of 90.93%, and an F1 score of 92.75% (Table 3). The potential influence of class area proportion on classification accuracy was additionally discussed for the rubber plantation class (Supplementary Fig. S1). Primary confusion arose with evergreen forests at plantation boundaries, while minimal overlap occurred with farmland or shrub/grassland. Validation against Google Earth images confirmed high spatial consistency, with clear distinctions between rubber plantations and natural evergreen broad-leaved forests, shrub/grassland (Fig. 3c, d), and farmland (Fig. 3e, f). These results confirm reasonable overall accuracy. A comparison with FAO statistics shows consistent temporal trends (Supplementary Fig. S1). Our estimates are generally higher than FAO-reported harvested areas because our mapping captures total plantation extent, including non-tapping immature stands during rapid expansion periods.
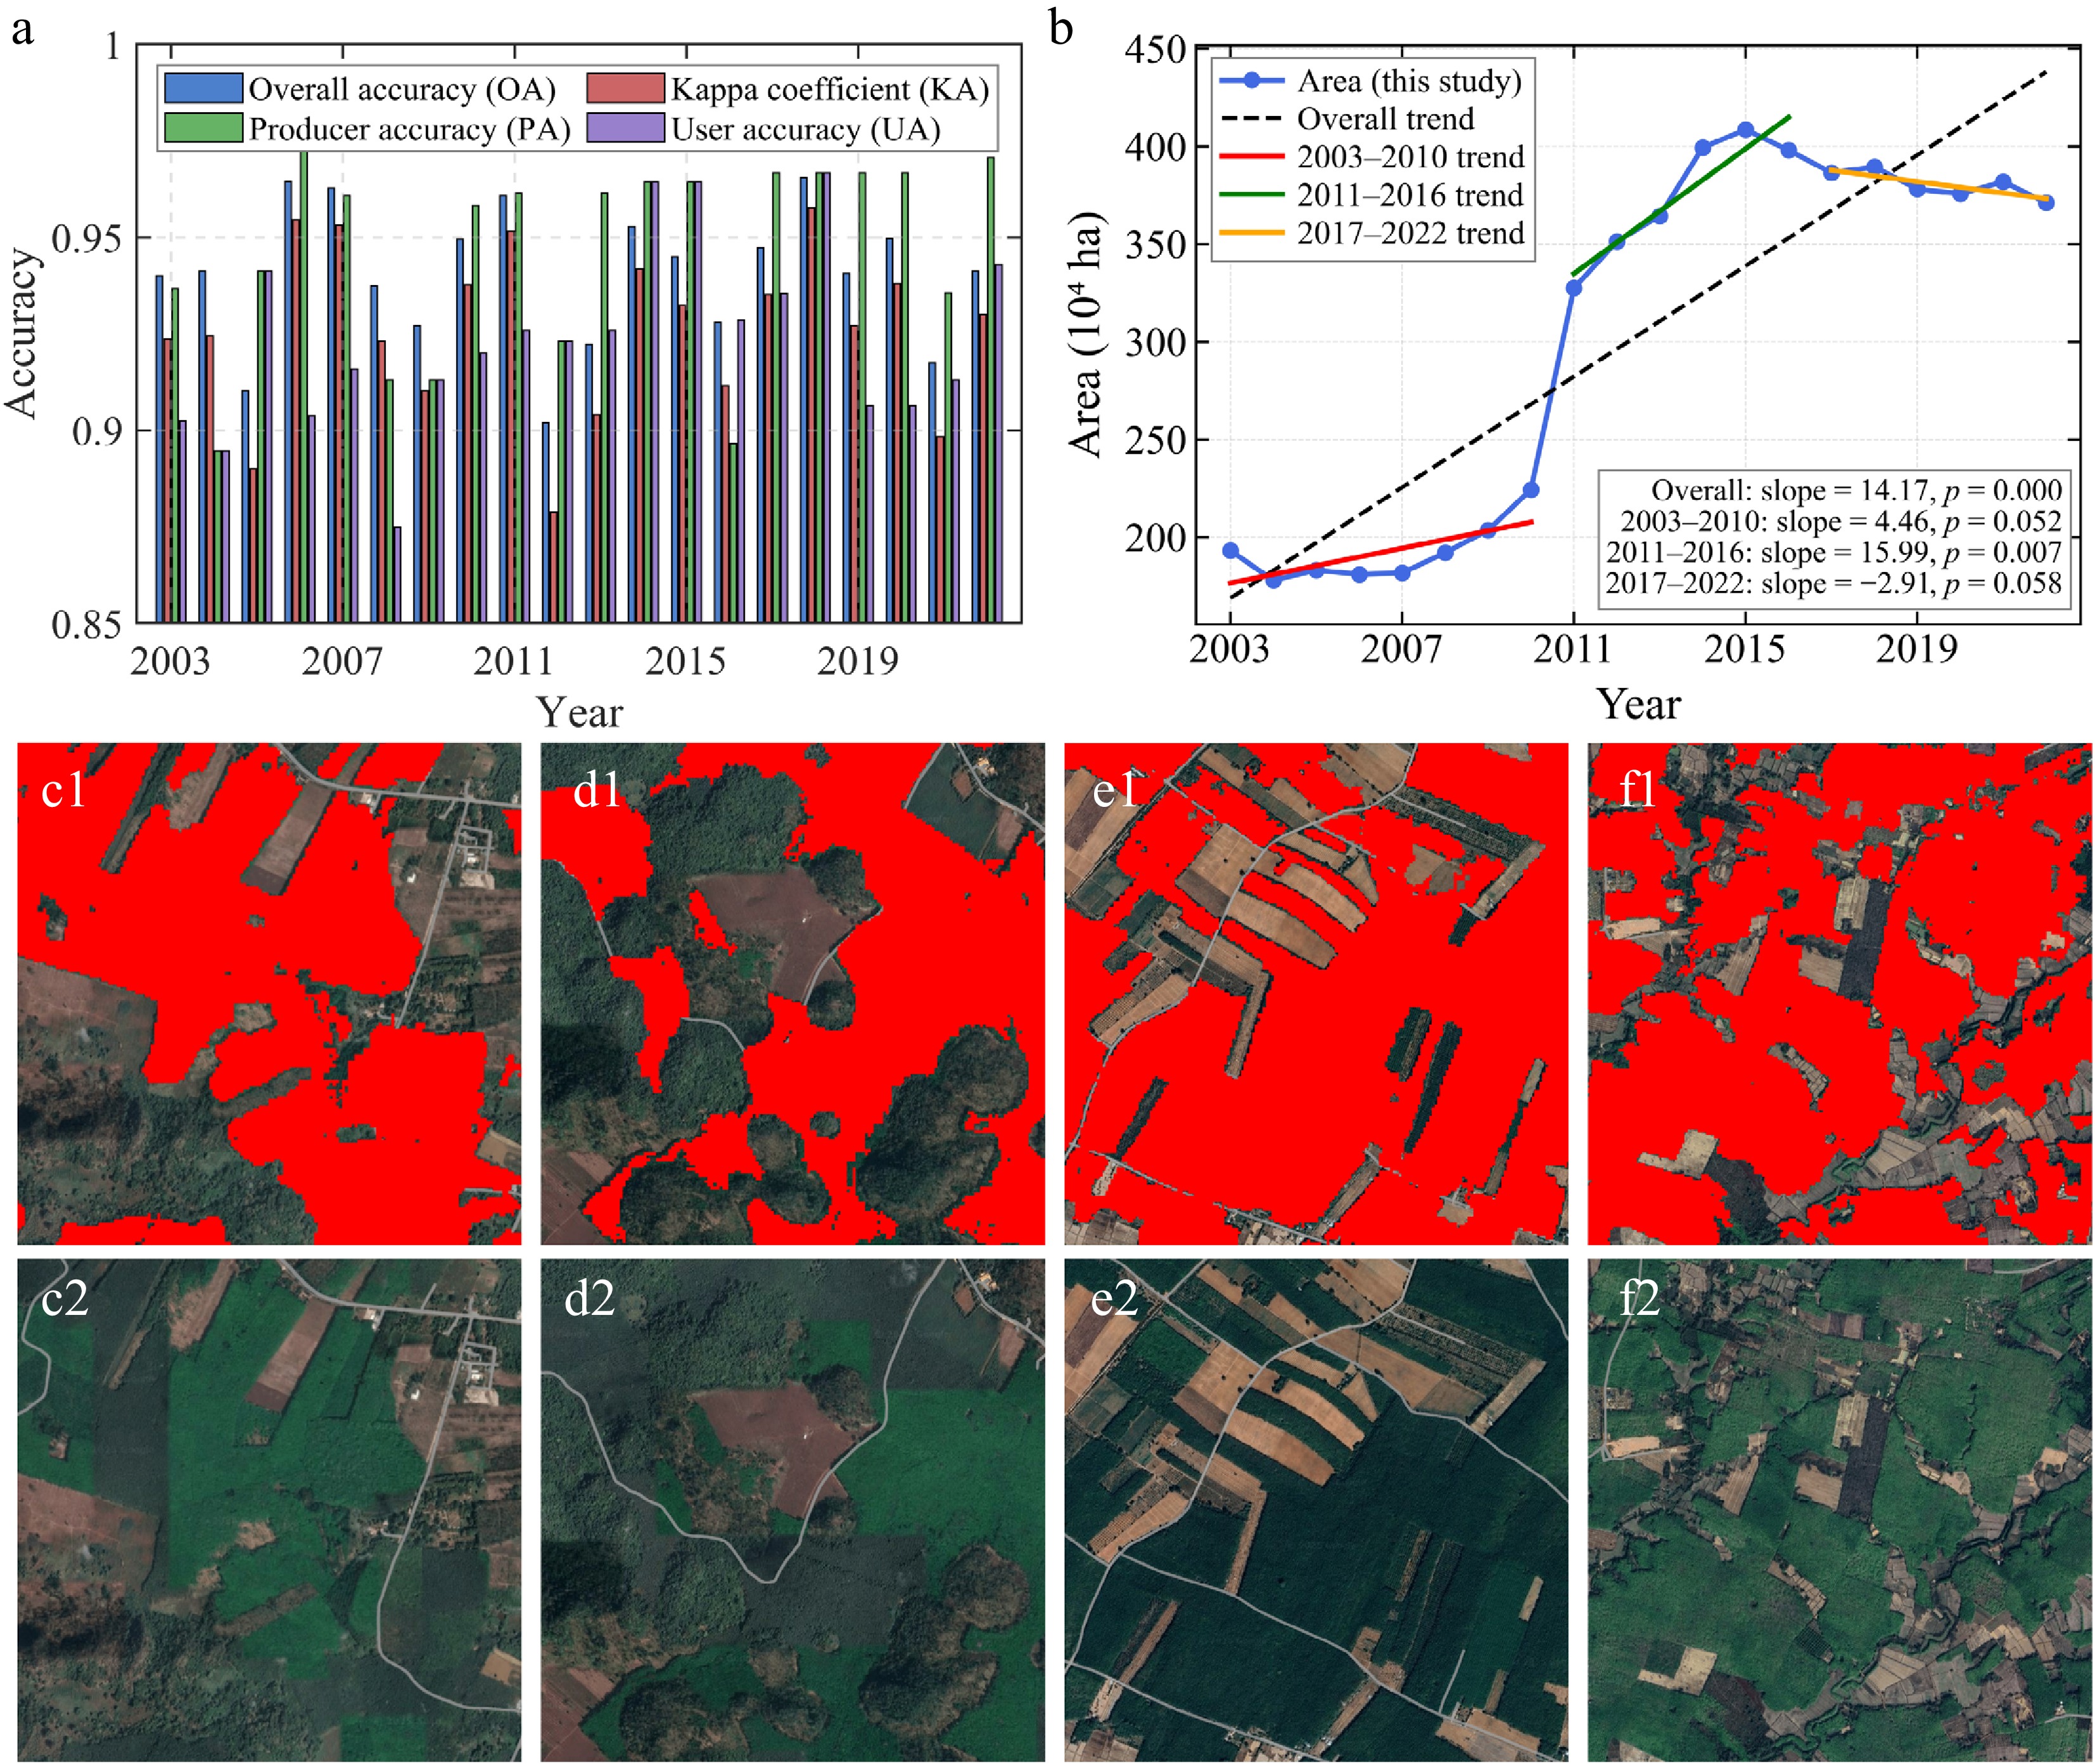
Figure 3.
Rubber classification results: (a) Classification accuracy from 2003 to 2022. (b) Time series of rubber plantation area. (c)−(f) Examination of classified rubber plantations with Google Earth images (2022).
Table 3. National scale confusion matrix of the classification result in 2022.
Class W IPV RP OP CR NRF Shrub Total UA (%) W 228 0 0 0 4 0 3 235 97.02 IPV 0 168 0 0 2 0 0 170 98.82 RP 4 0 401 9 4 11 12 441 90.93 OP 0 0 8 222 2 5 0 237 93.67 CR 12 2 2 3 228 4 2 253 90.12 NRF 0 0 10 3 6 302 14 335 90.15 Shrub 0 0 12 2 5 9 140 168 83.33 Total 244 170 433 239 251 331 171 1,839 PA (%) 93.44 98.82 92.61 92.89 90.84 91.24 81.87 OA (%) 92.63 Kappa 0.91 F1 score (%) 92.75 Note: W = Water; IPV = Impervious; RP = Rubber Plantation; OP = Oil Palm; CR = Cropland; NRF = Non-Rubber Forest. Spatiotemporal dynamics of rubber plantations
-
The plantation area exhibited three phases from 2003–2022 (Fig. 3b). From 2003 to 2010, it grew gradually at 4.46 × 10⁴ ha·yr−1, reflecting steady expansion through promotion and policy support. Rapid growth followed from 2011 to 2016 at 15.99 × 10⁴ ha·yr−1, driven by agricultural development plans and rising rubber prices. From 2017 to 2022, a slight decrease occurred at −2.91 × 10⁴ ha·yr−1, likely due to market saturation, policy regulations, and land competition. Overall, over the whole period, there was an increase that averaged 14.17 × 10⁴ ha·yr−1. In 2003, plantations were concentrated in the south, with limited presence elsewhere (Supplementary Fig. S2), but by 2022, a more complex pattern had emerged: 68.2% in the south, 17.8% in eastern coastal provinces, and 14.0% in central plains and northern regions.
Stand age structure and spatial-temporal patterns
Spatial distribution of stand age
-
Validation of retrieved stand ages showed good correlation with observed values, with most points near the 1:1 line, and RMSE = 3.16 years (Fig. 4a). Discrepancies may stem from progressive replanting practices, creating mixed-age stands that challenge detection algorithms.
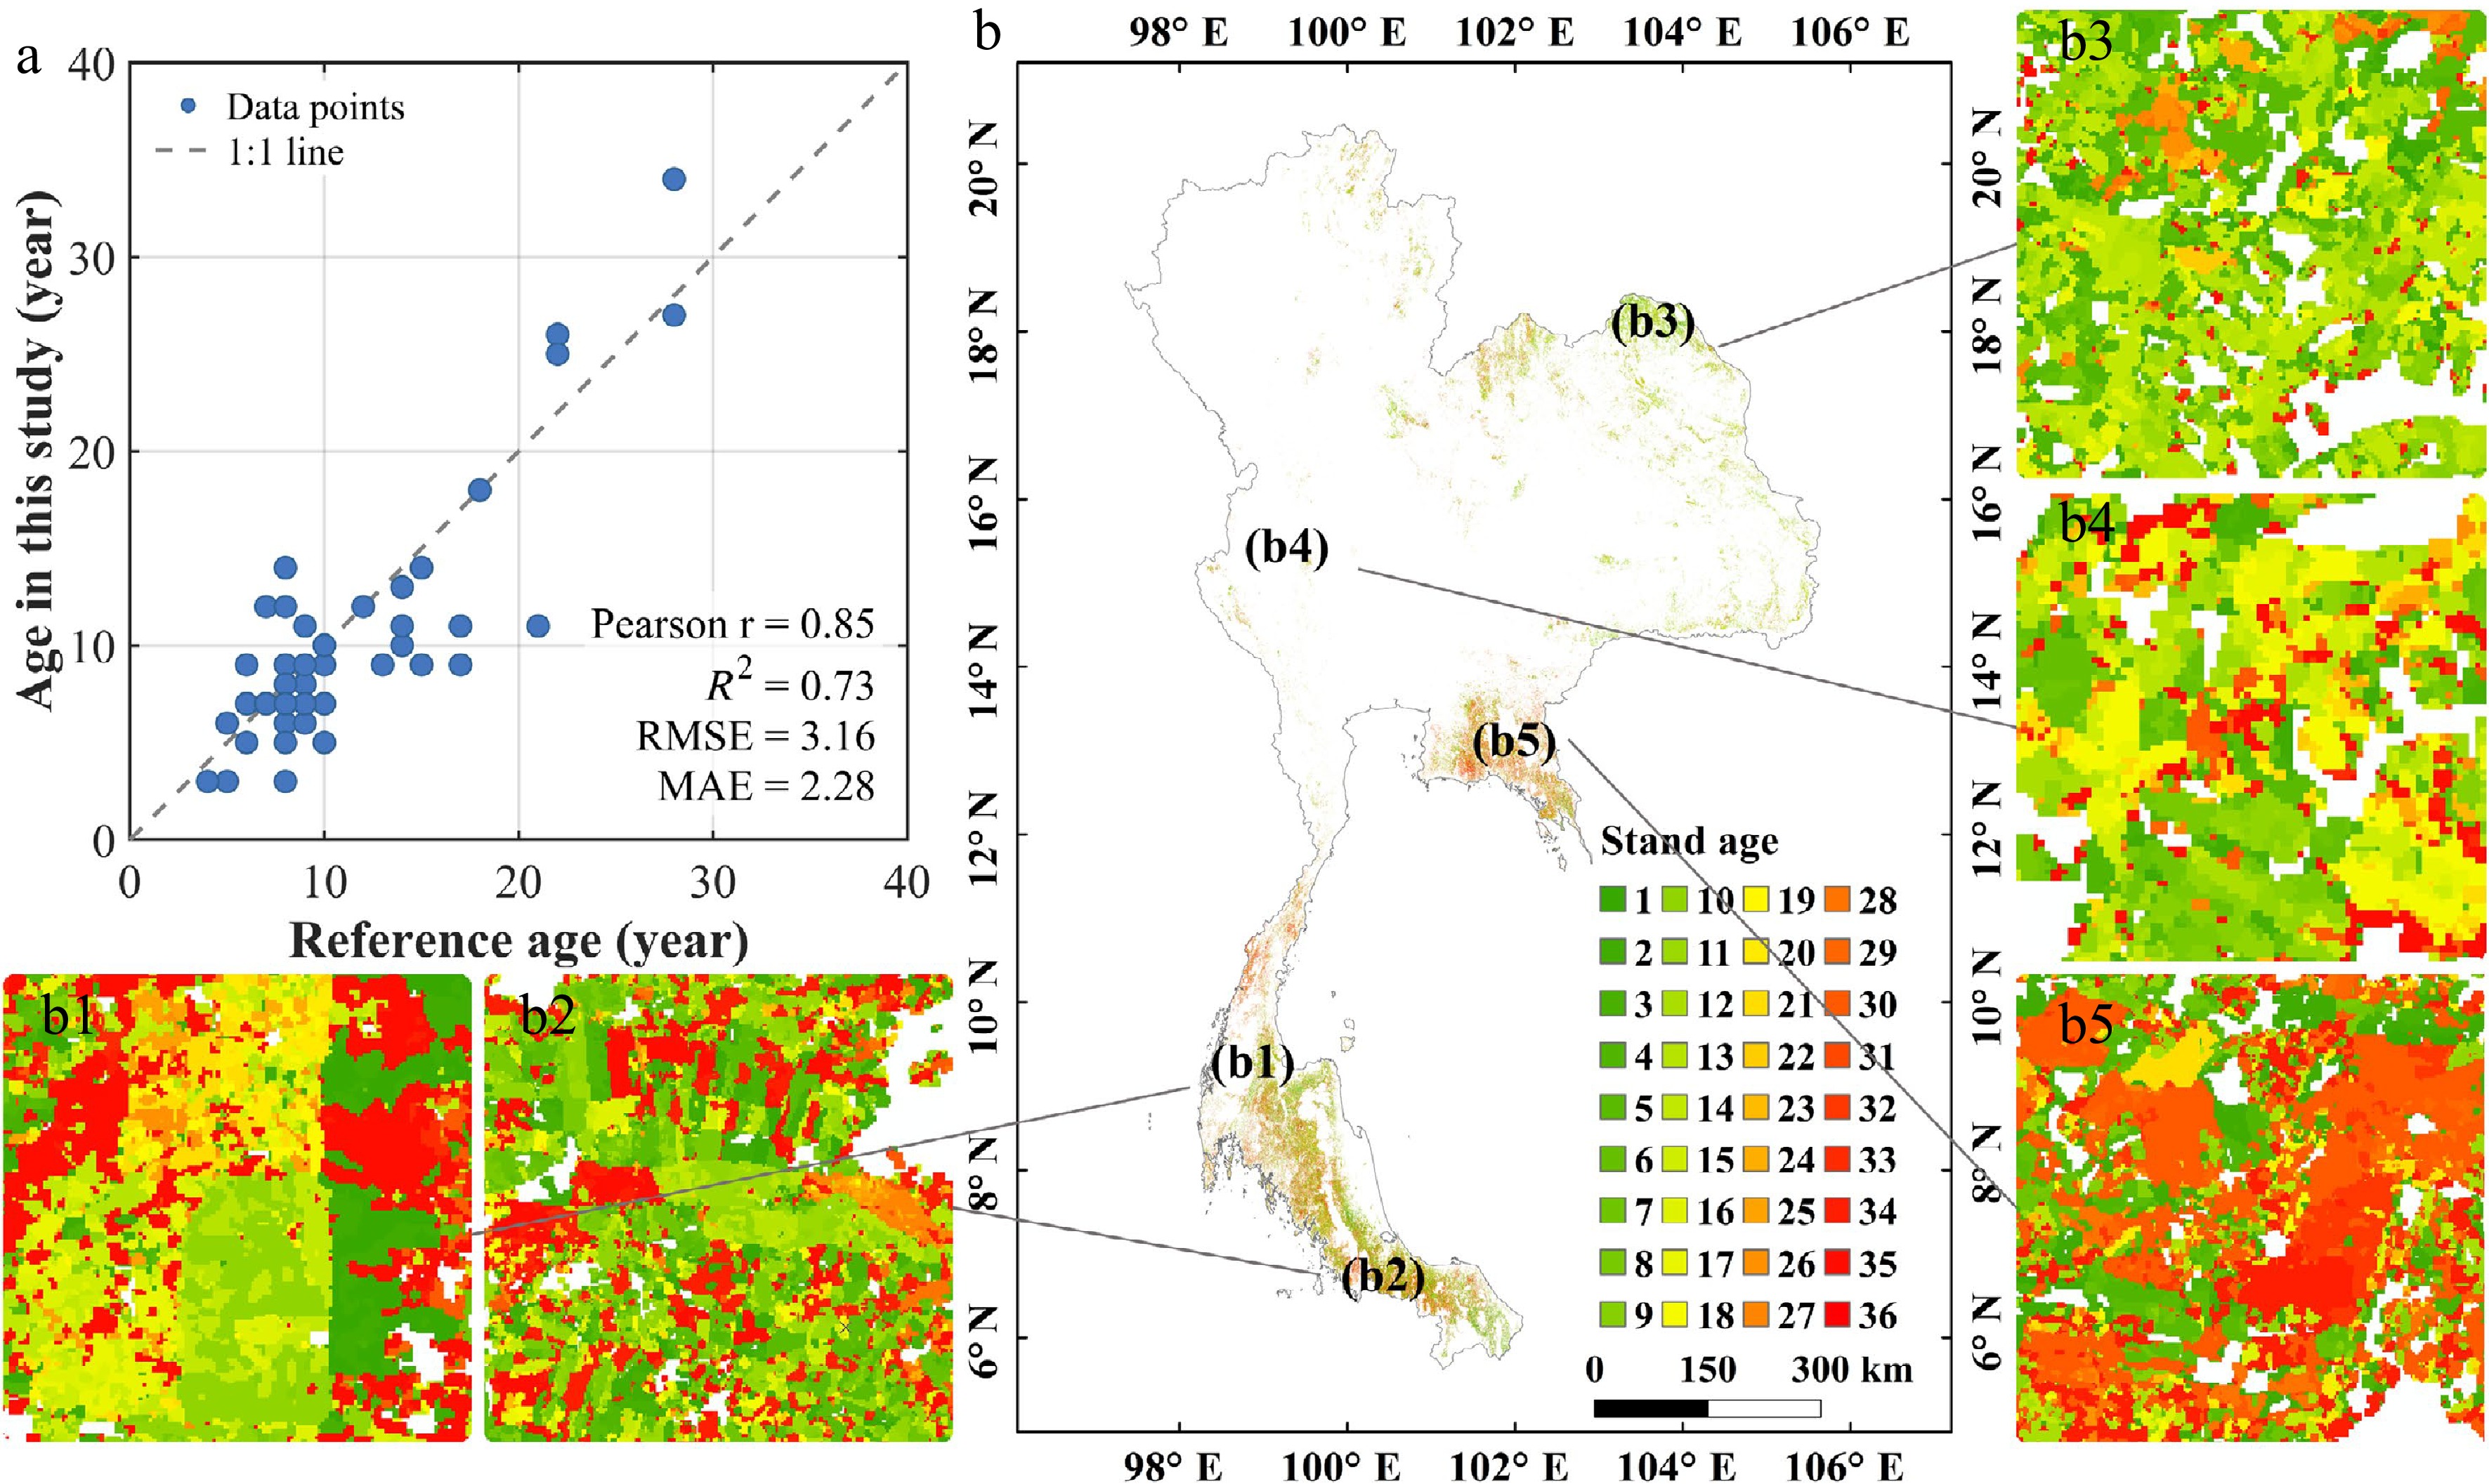
Figure 4.
Stand age results: (a) Stand age validation scatter plot. (b) The retrieved stand age distribution of the year 2022. (b1)–(b5) Zoom areas randomly selected.
Patterns of stand ages varied among regions (Fig. 4b). The south featured large, contiguous areas with complex structures from young to overmature. The northeast was dominated by young plantations (6−15 years) in provinces like Ubon Ratchathani and Loei (Fig. 4b[3]). Central and northern regions showed fragmented, smaller distributions (Fig. 4b[4]). The eastern coastal region exhibited a balanced age structure (Fig. 4b[5]).
Age class structure and temporal dynamics
-
The national landscape is primarily defined by its older growth, with middle-aged and mature stands collectively accounting for nearly 77% of the total (Fig. 5a). Within this distribution, the average age sits at 17.1 years, while younger stands (0−6 years) represent a smaller fraction at 23.2%. Middle-aged areas covered ~1.65 × 10⁶ ha, aligning with peak latex production. Mean stand ages varied regionally (Fig. 5b). The south averaged 17.6 years (median 13.5, SD 10.8), reflecting a long cultivation history. The northeast was the youngest at 13.9 years (median 12.7), indicating recent expansion. Central, eastern, and northern means ranged from 16.2 to 21.3 years. Looking at the trajectory from 2003 to 2022, the age structure underwent a significant transformation (Fig. 5c). While the proportion of young stands contracted from 29.1% to 23.2%, middle-aged and mature stands saw substantial growth, rising to 38.5% (from 30.2%) and 38.3% (from 28.7%), respectively. This transition unfolded in three stages: a stable phase until 2010, followed by a 6-year window (2010–2016) where young stands briefly surged from 27.3% to 31.8%, and concluding with a period of widespread maturation through 2022.
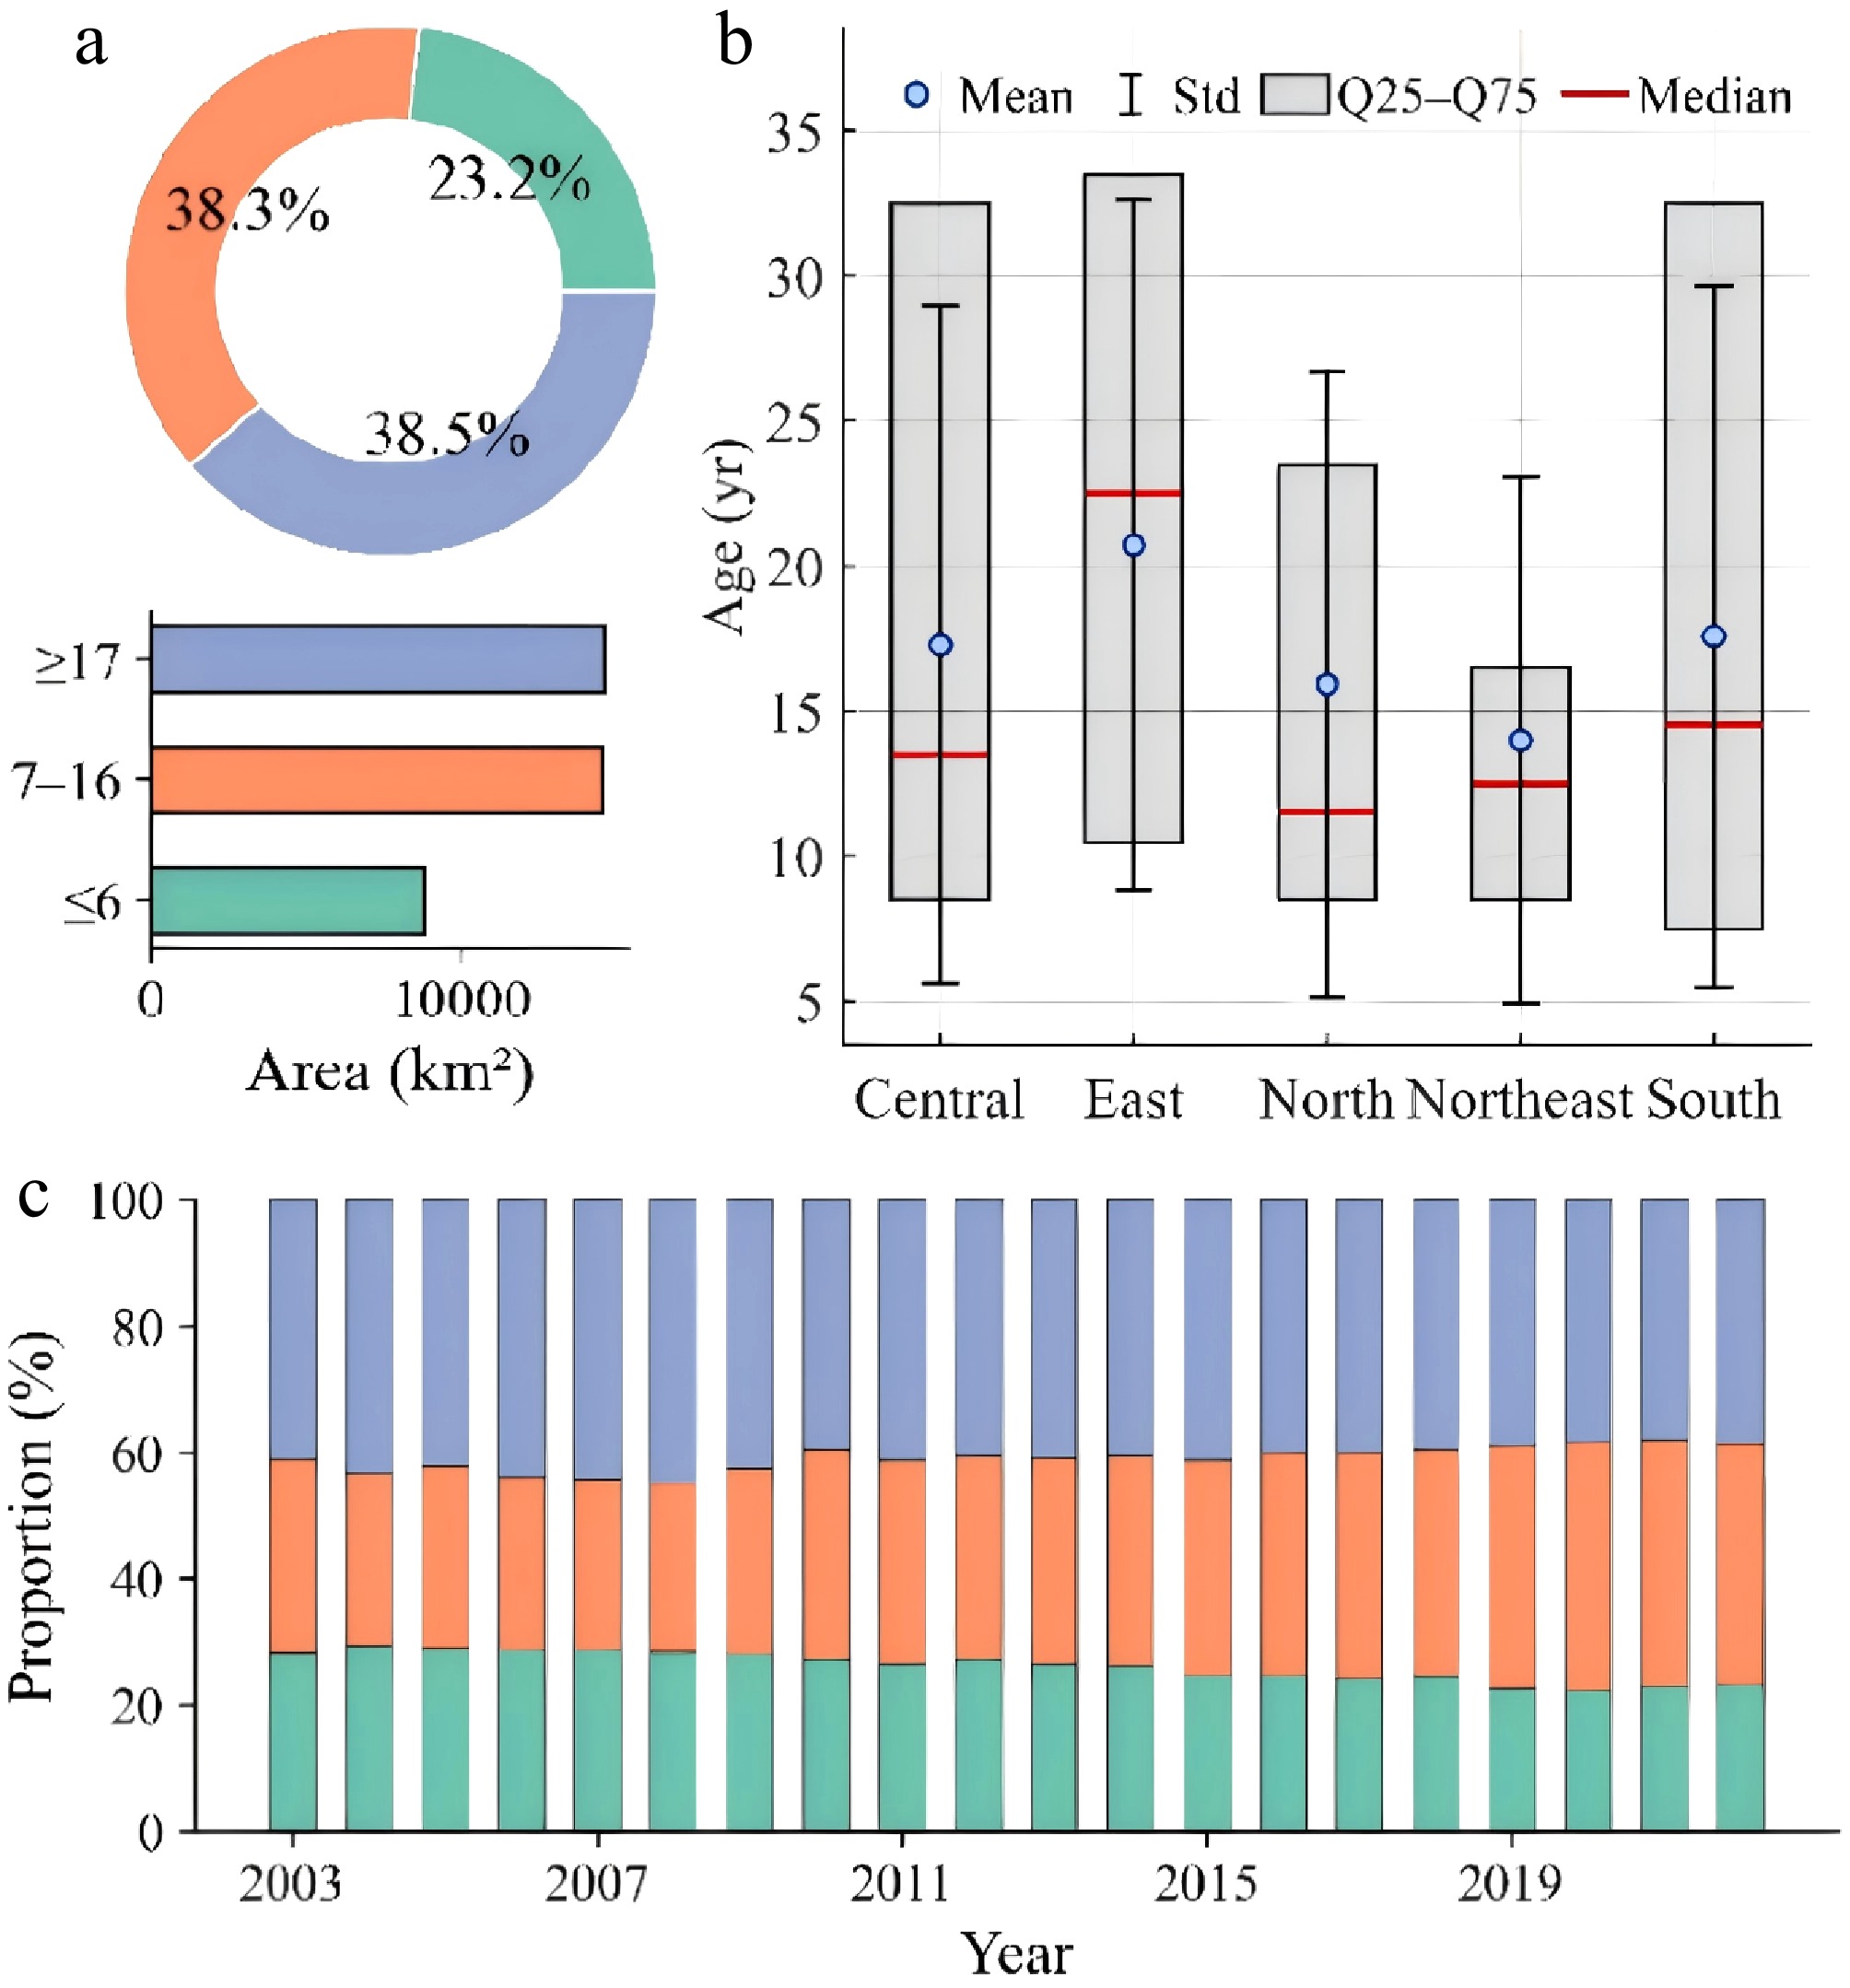
Figure 5.
Stand age statistics: (a) Stand age statistics by region. (b) Stand age stage and the area of each age in 2022. (c) Temporal dynamics of stand age stage from 2003 to 2022.
Carbon stock distribution
Spatial patterns of carbon stock and carbon density
-
Rubber plantation carbon stocks concentrated in the southern and central regions in 2022, with density decreasing northwards (Fig. 6). High-density zones (> 150 t C·ha−1) lined southern coasts (e.g., Songkhla, Narathiwat, Chumphon). Mid-latitudes (12°–16° N) showed moderate density, northern mountains lower (< 120 t C·ha−1), tied to establishment timing and age.
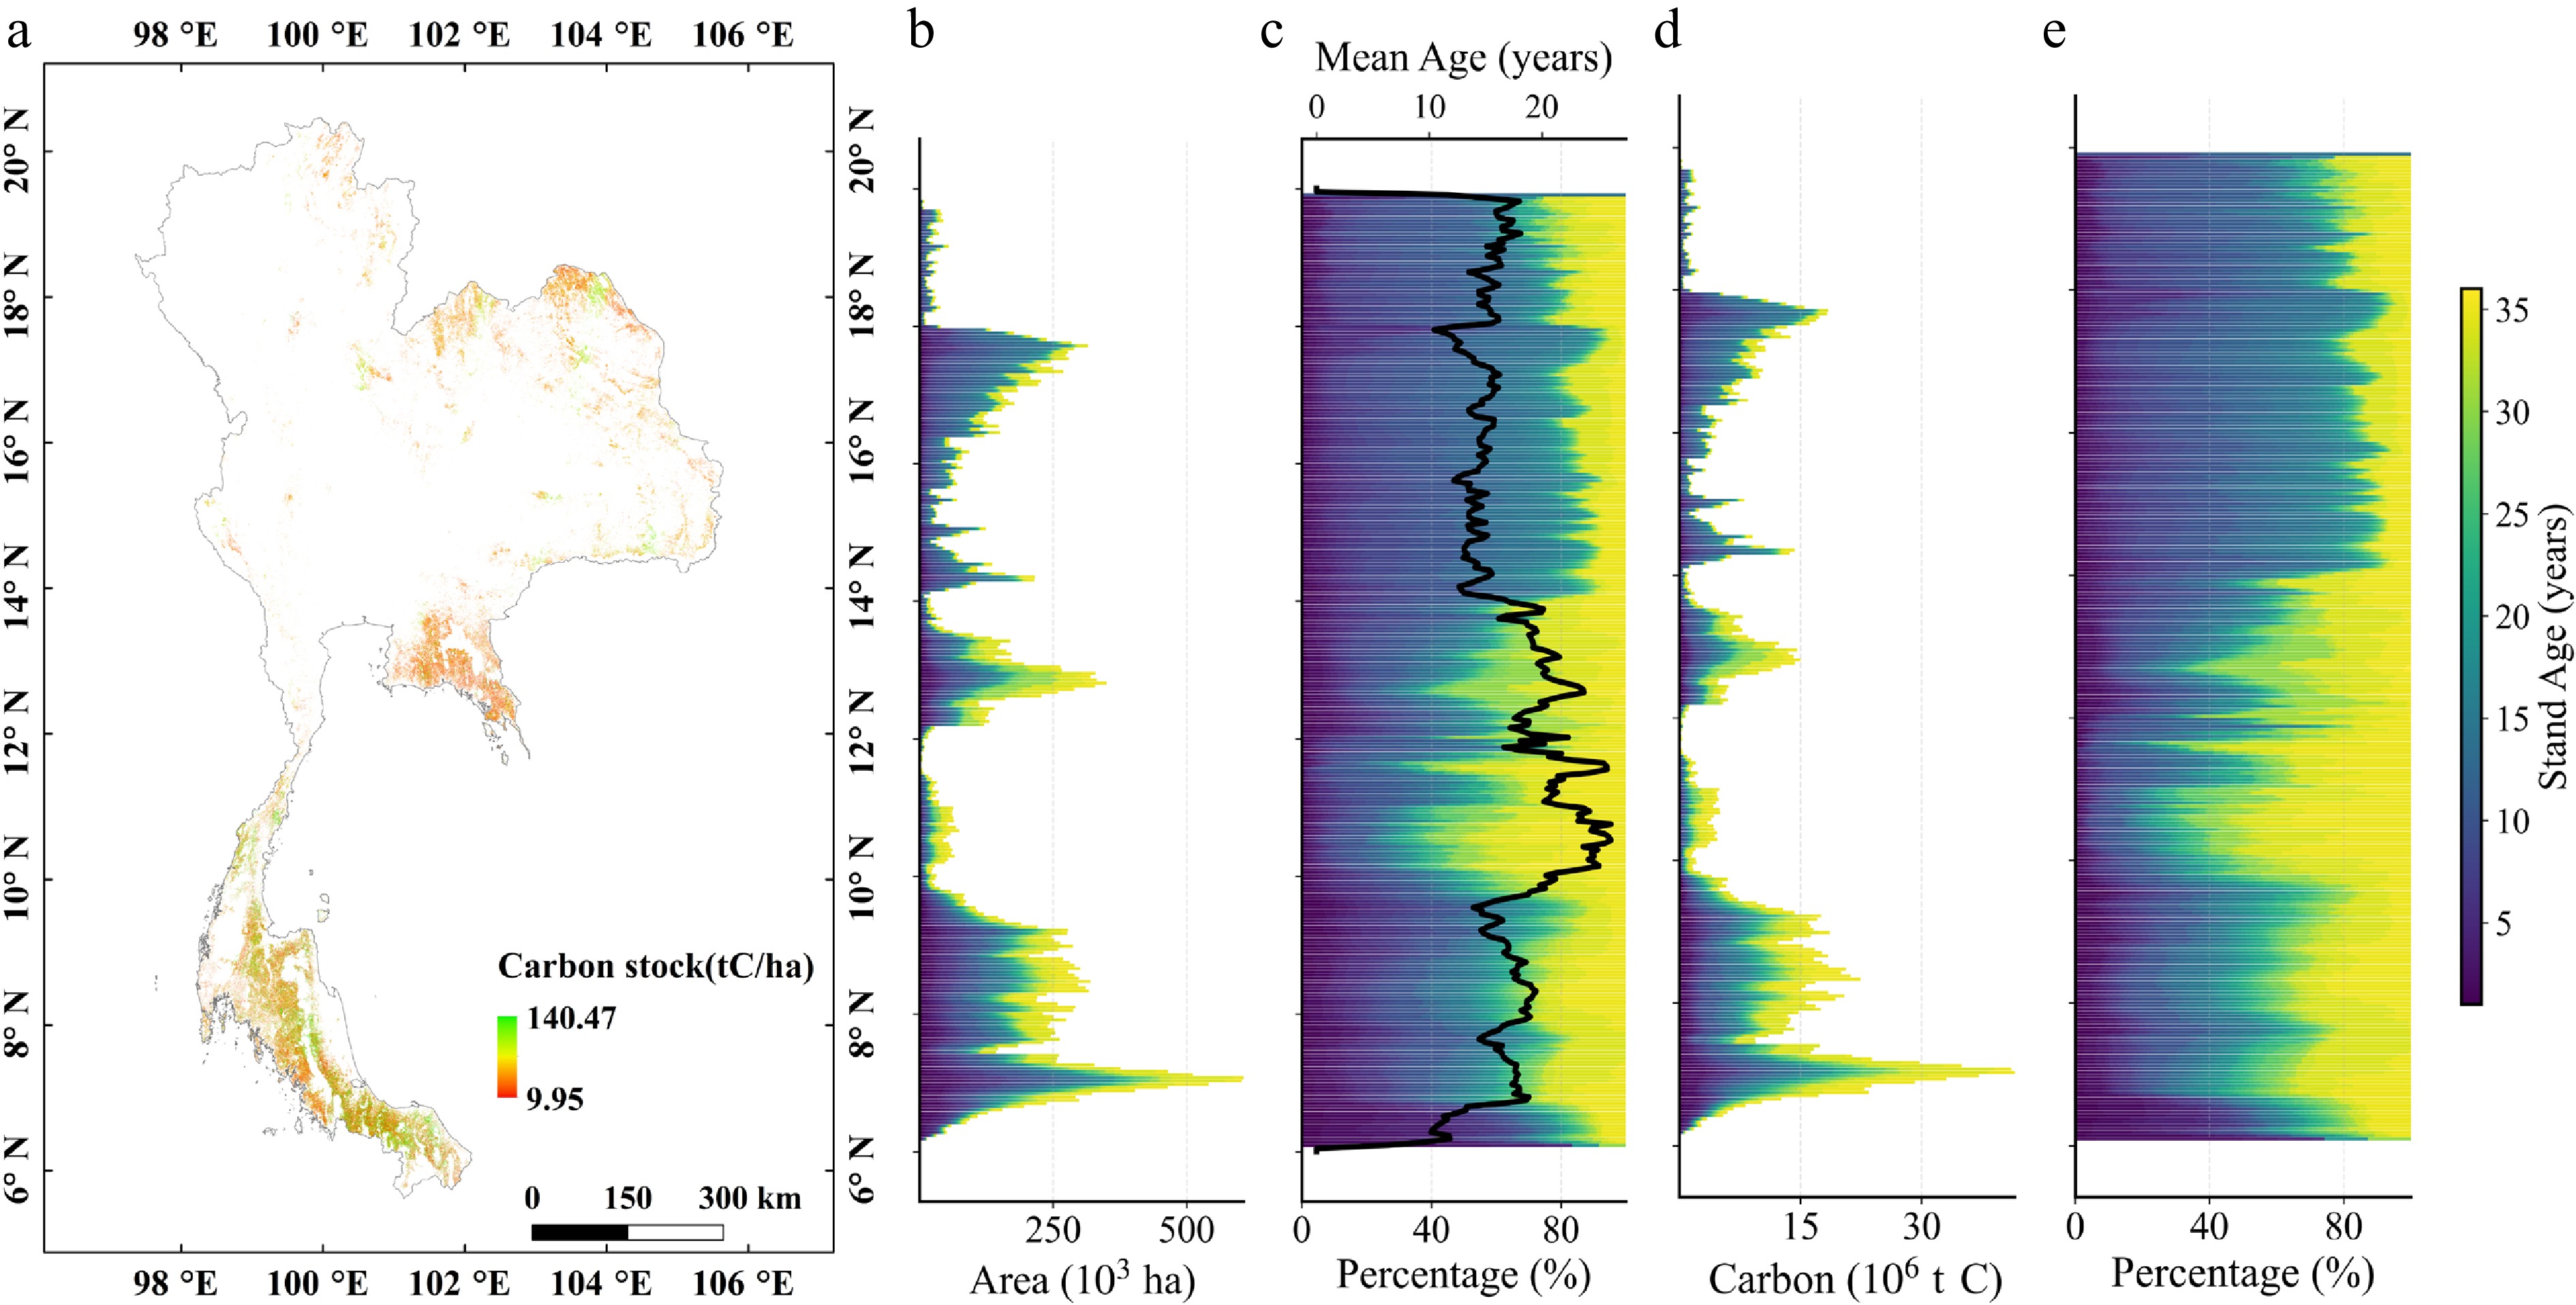
Figure 6.
Carbon stock distribution characteristics: (a) Spatial distribution of carbon stock in 2022. (b) Area of different age variations along the latitudinal gradient. (c) Area percentage of different ages and mean stand age along the latitudinal gradient. (d) Carbon stock of different age variations along the latitudinal gradient. (e) Carbon stock percentage of different ages along the latitudinal gradient.
Latitudinally, plantations are concentrated between 5° and 19° N, with density peaking in the southern belt (7°–9° N) and the central zone (13°–15° N). This spatial arrangement corresponds to a bimodal age-class distribution: younger stands (< 7 years, ~22%) are primarily clustered in the south, while the mid-latitudes are dominated by middle-aged (7–16 years, ~39%) and mature (> 16 years, ~40%) cohorts (Fig. 6b, c).
Stands older than 16 years contributed approximately 45% of the national carbon pool while occupying only about 40% of the area, whereas young stands (< 7 years) accounted for over 20% of the area but only about 18% of the carbon stock (Fig. 6e). The bimodal pattern of the carbon-percentage curve closely matched the latitudinal variation in plantation area (R2 ≈ 0.9), with some deviation between 12° N and 16° N that suggests elevated per-area carbon density in this transitional zone.
Regional variation of carbon density
-
At the provincial scale, more than 62% of carbon stocks are concentrated in all southern provinces, among which Surat Thani, Songkhla, and Nakhon Si Thammarat account for 51.4% of 2022 stocks; top five > 50% of national total/area; top 15:75.3% area, 78.9% stocks (Fig. 7a). Densities ranged from 22.4–62.7 t C·ha−1 (mean 45.3 ± 9.2, median 46.8) (Fig. 7b). The southern provinces, which include Surat Thani, Songkhla, Nakhon Si Thammarat, and Trang, exhibited high carbon densities with low variability. Mean values ranged from 55 to 63 t C·ha−1, with an interquartile range of 5–9 t C·ha−1 and a standard deviation of 3.2–5.1 t C·ha−1. The eastern region showed an average carbon density of 49.1 ± 5.4 t C·ha−1 and a median of 48.7 t C·ha−1. Provincial differences within the east were moderate, with carbon densities ranging from 45 to 53 t C·ha−1.
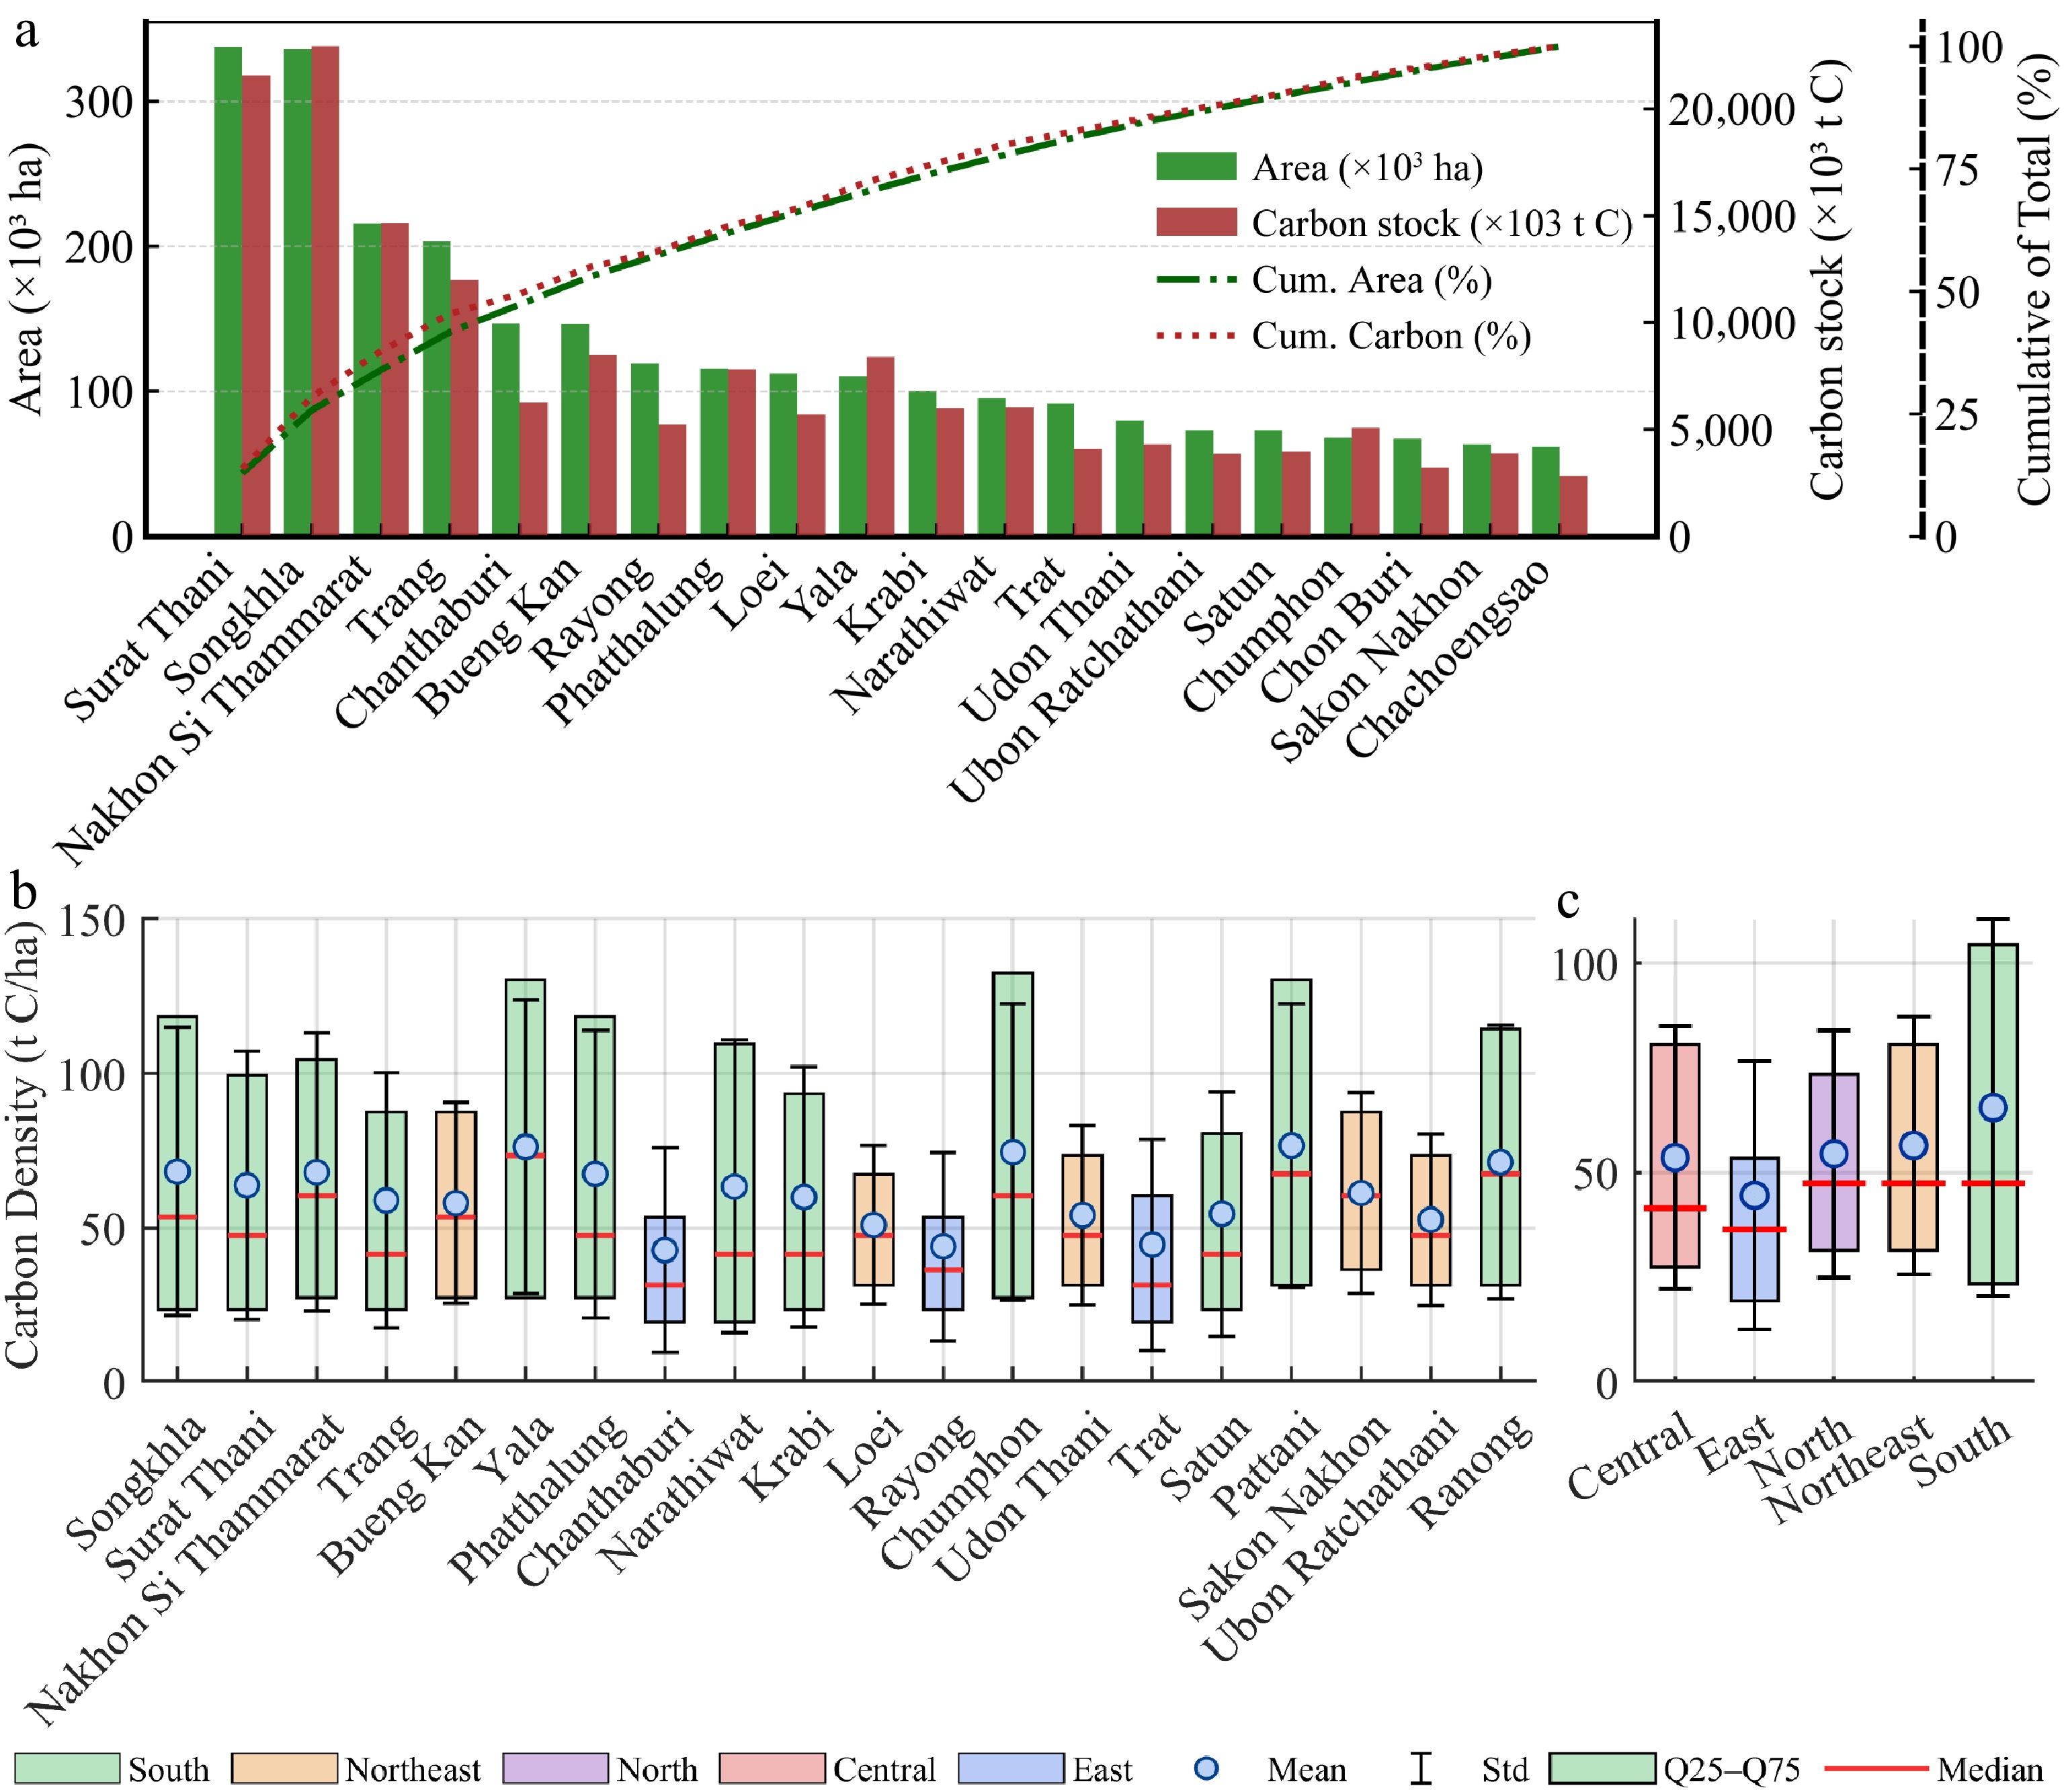
Figure 7.
Regional statistics on carbon stock (2022): (a) Distribution of rubber area and carbon stock by province (top 20 provinces). (b) Carbon density by province (top 20 provinces). (c) Carbon density in each region.
This wide variation was associated with clear ecogeographical patterns at the regional scale (Fig. 7c). The southern region exhibited the highest carbon density (mean of 58.6 ± 7.3 t C·ha−1), with 85.7% of its provinces exceeding 55 t C·ha−1, and low interprovincial variability. This aligns with its optimal hydrothermal conditions (annual precipitation: 2,000–3,000 mm; mean temperature: 26–28 °C) and long history of rubber cultivation. In contrast, the northeastern region had the lowest mean density (37.8 ± 9.5 t C·ha−1), which was 35.5% lower than that of the southern region, and it also exhibited the highest variability. Ecological gradients drive this divergence: northern border provinces, characterized by higher elevations and greater rainfall, sustained carbon densities of 48–52 t C·ha−1. In contrast, the water-limited environments of the central plateau (e.g., Khon Kaen) exhibited much leaner values, typically ranging from 28 to 32 t C·ha−1.
The eastern region, despite a shorter cultivation history, showed a mean carbon density (49.1 ± 5.4 t C·ha−1) comparable to or slightly higher than other non-traditional zones. The central and northern regions displayed intermediate densities (44.3 ± 6.7 and 42.1 ± 8.2 t C·ha−1, respectively), where spatial variation was linked to topography, with lowland provinces (e.g., Chon Buri, Chachoengsao) having higher densities than mountainous ones (e.g., Chiang Mai, Lamphun).
Temporal dynamics of carbon stock
-
Carbon stocks initially diffused and then reconcentrated (Fig. 8a–d). In 2003, areas with high carbon stocks (> 2.0 × 10⁷ t C) were confined to six southern coastal provinces, which include Surat Thani, Songkhla, Nakhon Si Thammarat, Trang, Pattani, and Yala. These provinces together held 73.6% of national carbon stocks, resulting in a south-dominated spatial pattern. By 2010, high carbon stock areas were still concentrated in Southern Thailand, but had expanded north to Phang Nga and Krabi. By 2016, they had spread to about 12 provinces, including the northeast and east. By 2022, the spatial pattern had largely stabilized with only limited further change.
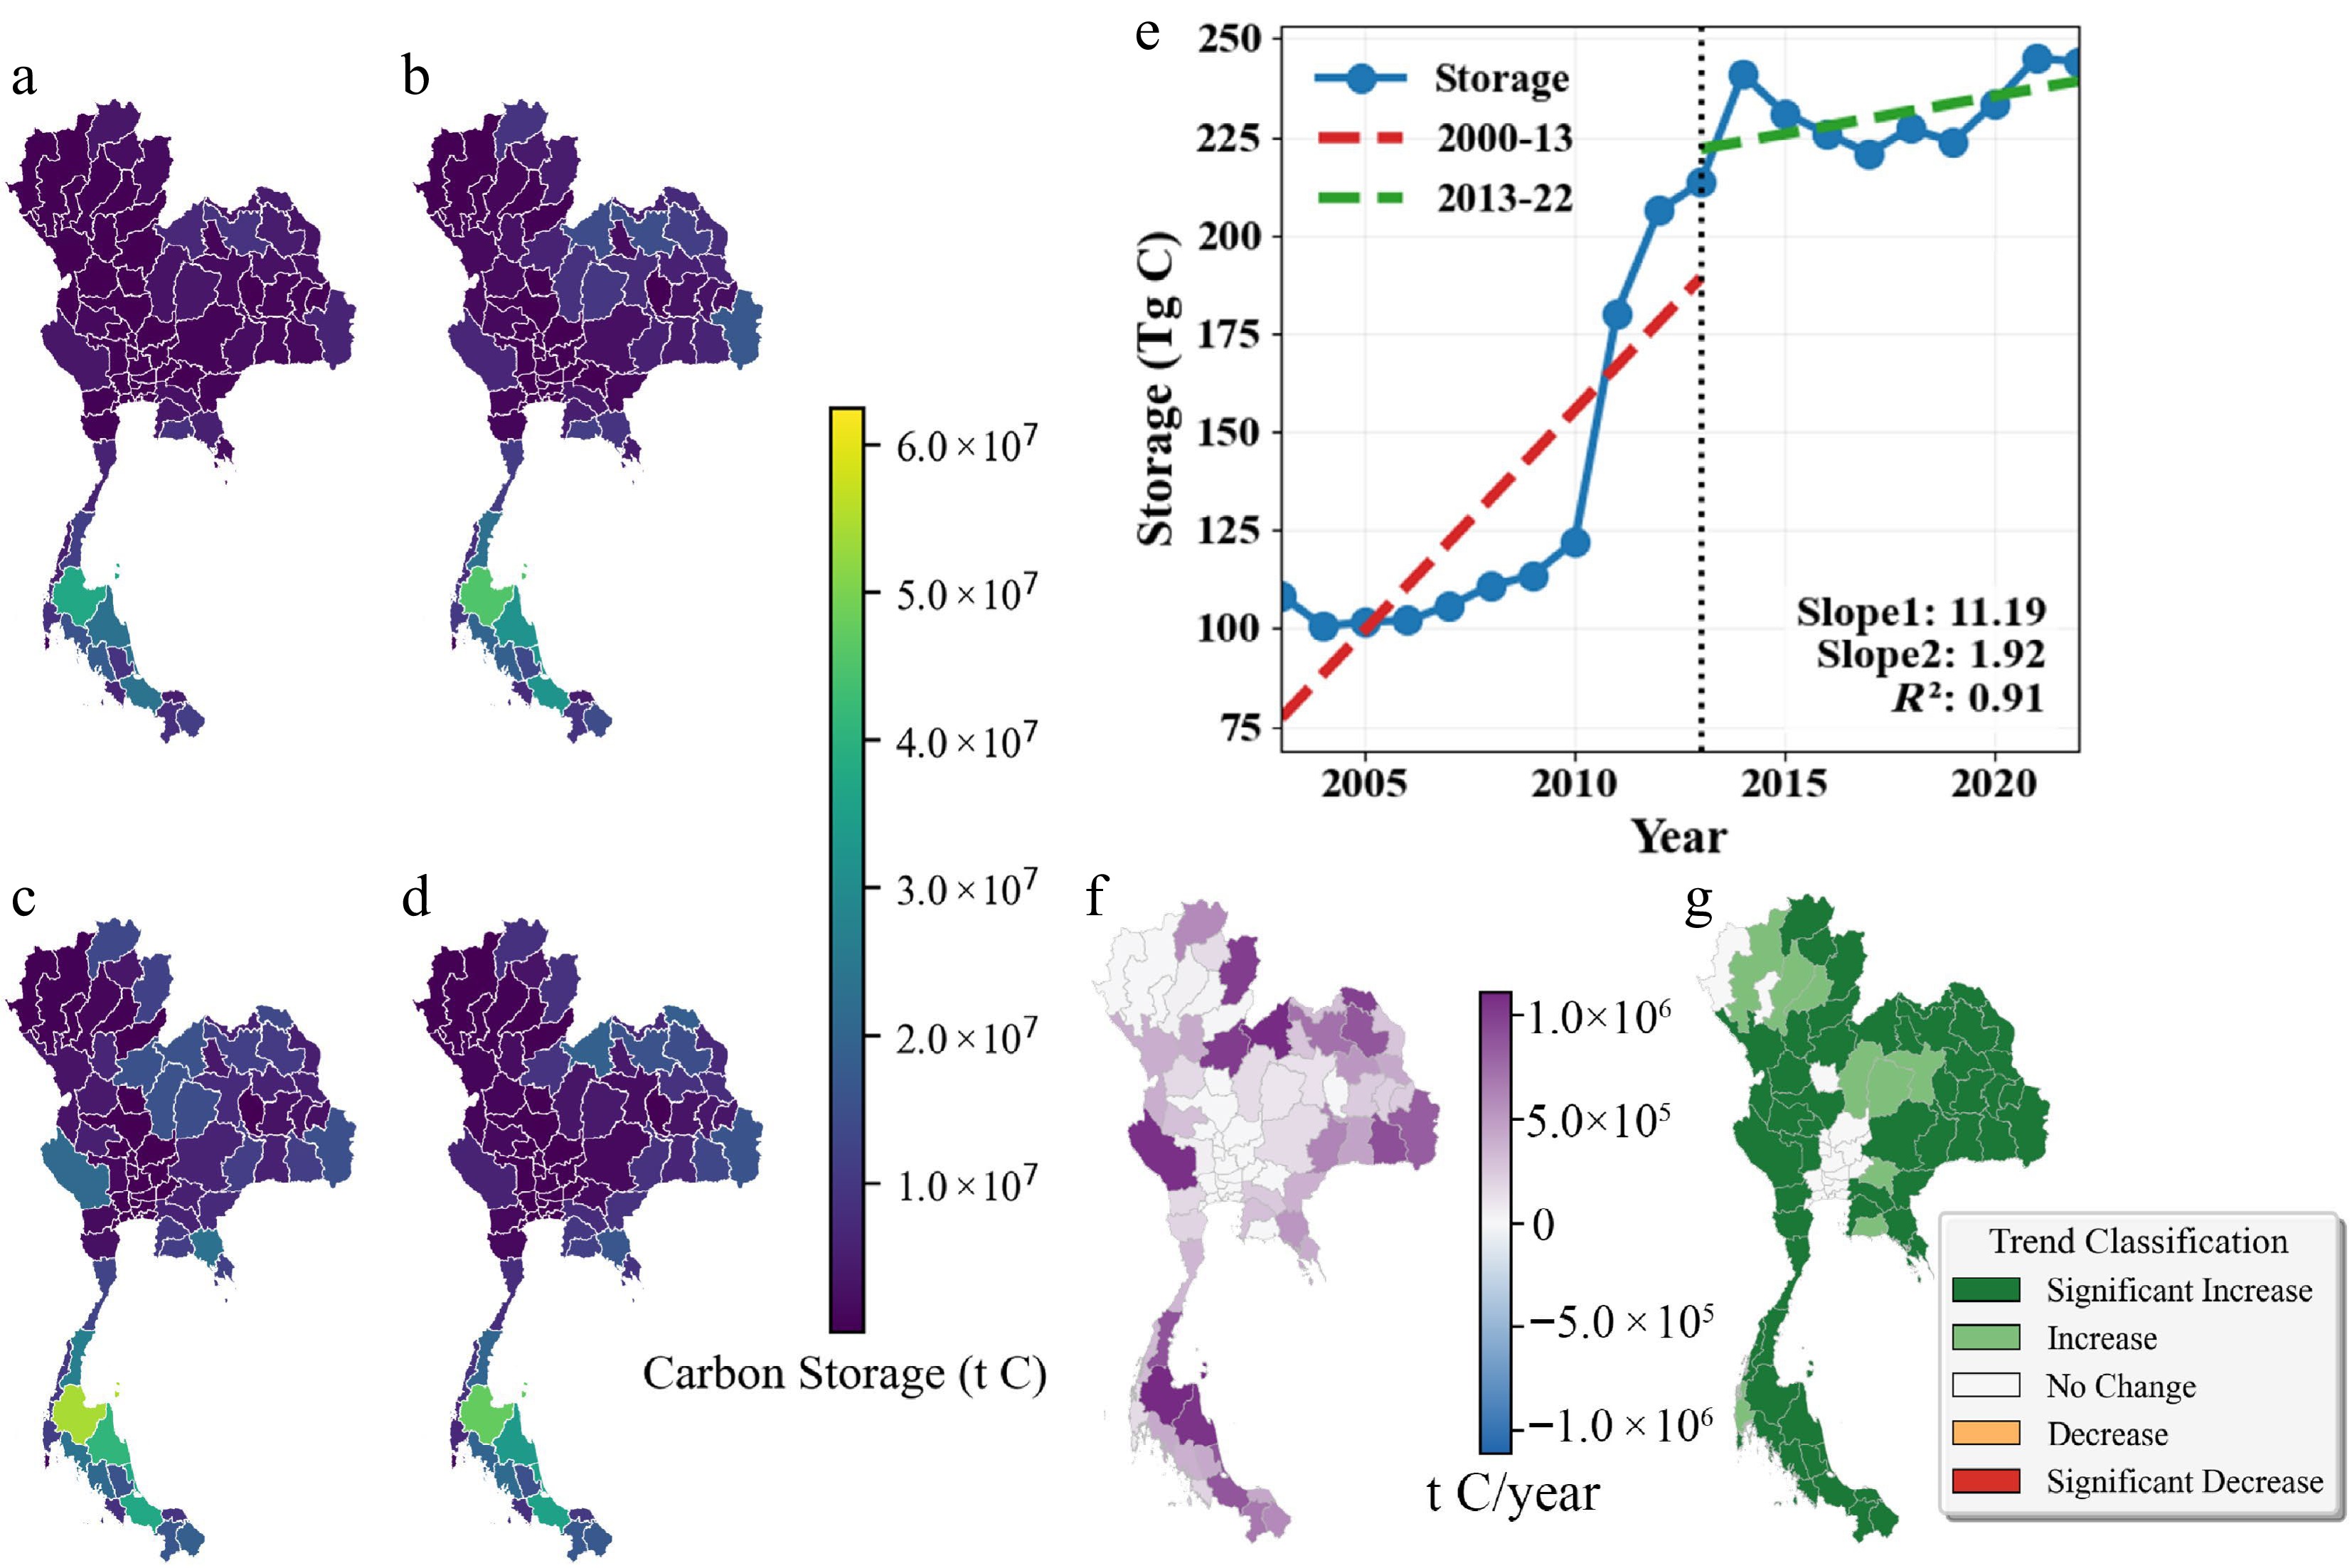
Figure 8.
Spatiotemporal dynamics of carbon stock from 2003 to 2022: (a)−(d) Provincial carbon stock in 2003, 2010, 2016, and 2022. (e) Temporal trends of carbon stock at national and regional scales. (f) Trend magnitude (Sen's slope). (g) Trend significance (Mann–Kendall test).
The segmented regression analysis reveals a significant shift in carbon storage dynamics around 2013. From 2003 to 2013, the carbon storage increased rapidly at a rate of 11.19 Tg C yr–1. However, the growth rate markedly decelerated to 1.92 Tg C yr–1 after 2013, indicating a transition from rapid expansion to a more stable phase. The total national carbon stock of rubber plantations increased markedly from 2003 to 2022, rising from 105 Tg C to 243 Tg C. Similar to the trend in planted area, the national carbon stock of rubber plantations also exhibited three different trends: gradual (2003–2010, 3.09% yr−1 to 124 Tg C); accelerated (2010–2016, 9.01% yr−1 to 208 Tg C, 72.3% from new plantations); and slower (2016–2022, 2.63% yr−1).
A distinct spatial gradient can also be observed in carbon stock change. Among 77 provinces, 79.2% of provinces (namely 61) showed an increasing trend. The highest increase rate occurred in the south (3.47 × 10⁵ t C·yr−1), followed by the northeast (1.92 × 10⁵ t C·yr−1). Significant increases (p < 0.05) were found in 52 provinces (67.5%), concentrated in the southern coastal belt and northeastern plateau (Fig. 8f). Nine provinces (11.7%) showed a non-significant increase, and 16 provinces (20.8%) showed no significant change (Fig. 8g).
Stratified planted area and carbon stock distribution along topography
-
Rubber plantations were largely restricted to low elevations. Areas below 200 m accounted for 84.0% (2.83 × 10⁶ ha) of the total plantation area, with the 0−100 m zone covering 55.5% and the 100−200 m zone covering 28.5%. The planted area decreased sharply with increasing elevation, and regions with elevations larger than 500 m only accounted for 1.2% of the total area. Ninety percent of rubber plantations are planted below 255 m (Fig. 9a). Carbon stock had a similar distribution (Fig. 9e). Age varies little: 0−100 m, 17.6 years; others, 16.1−16.6 years (Fig. 9c).
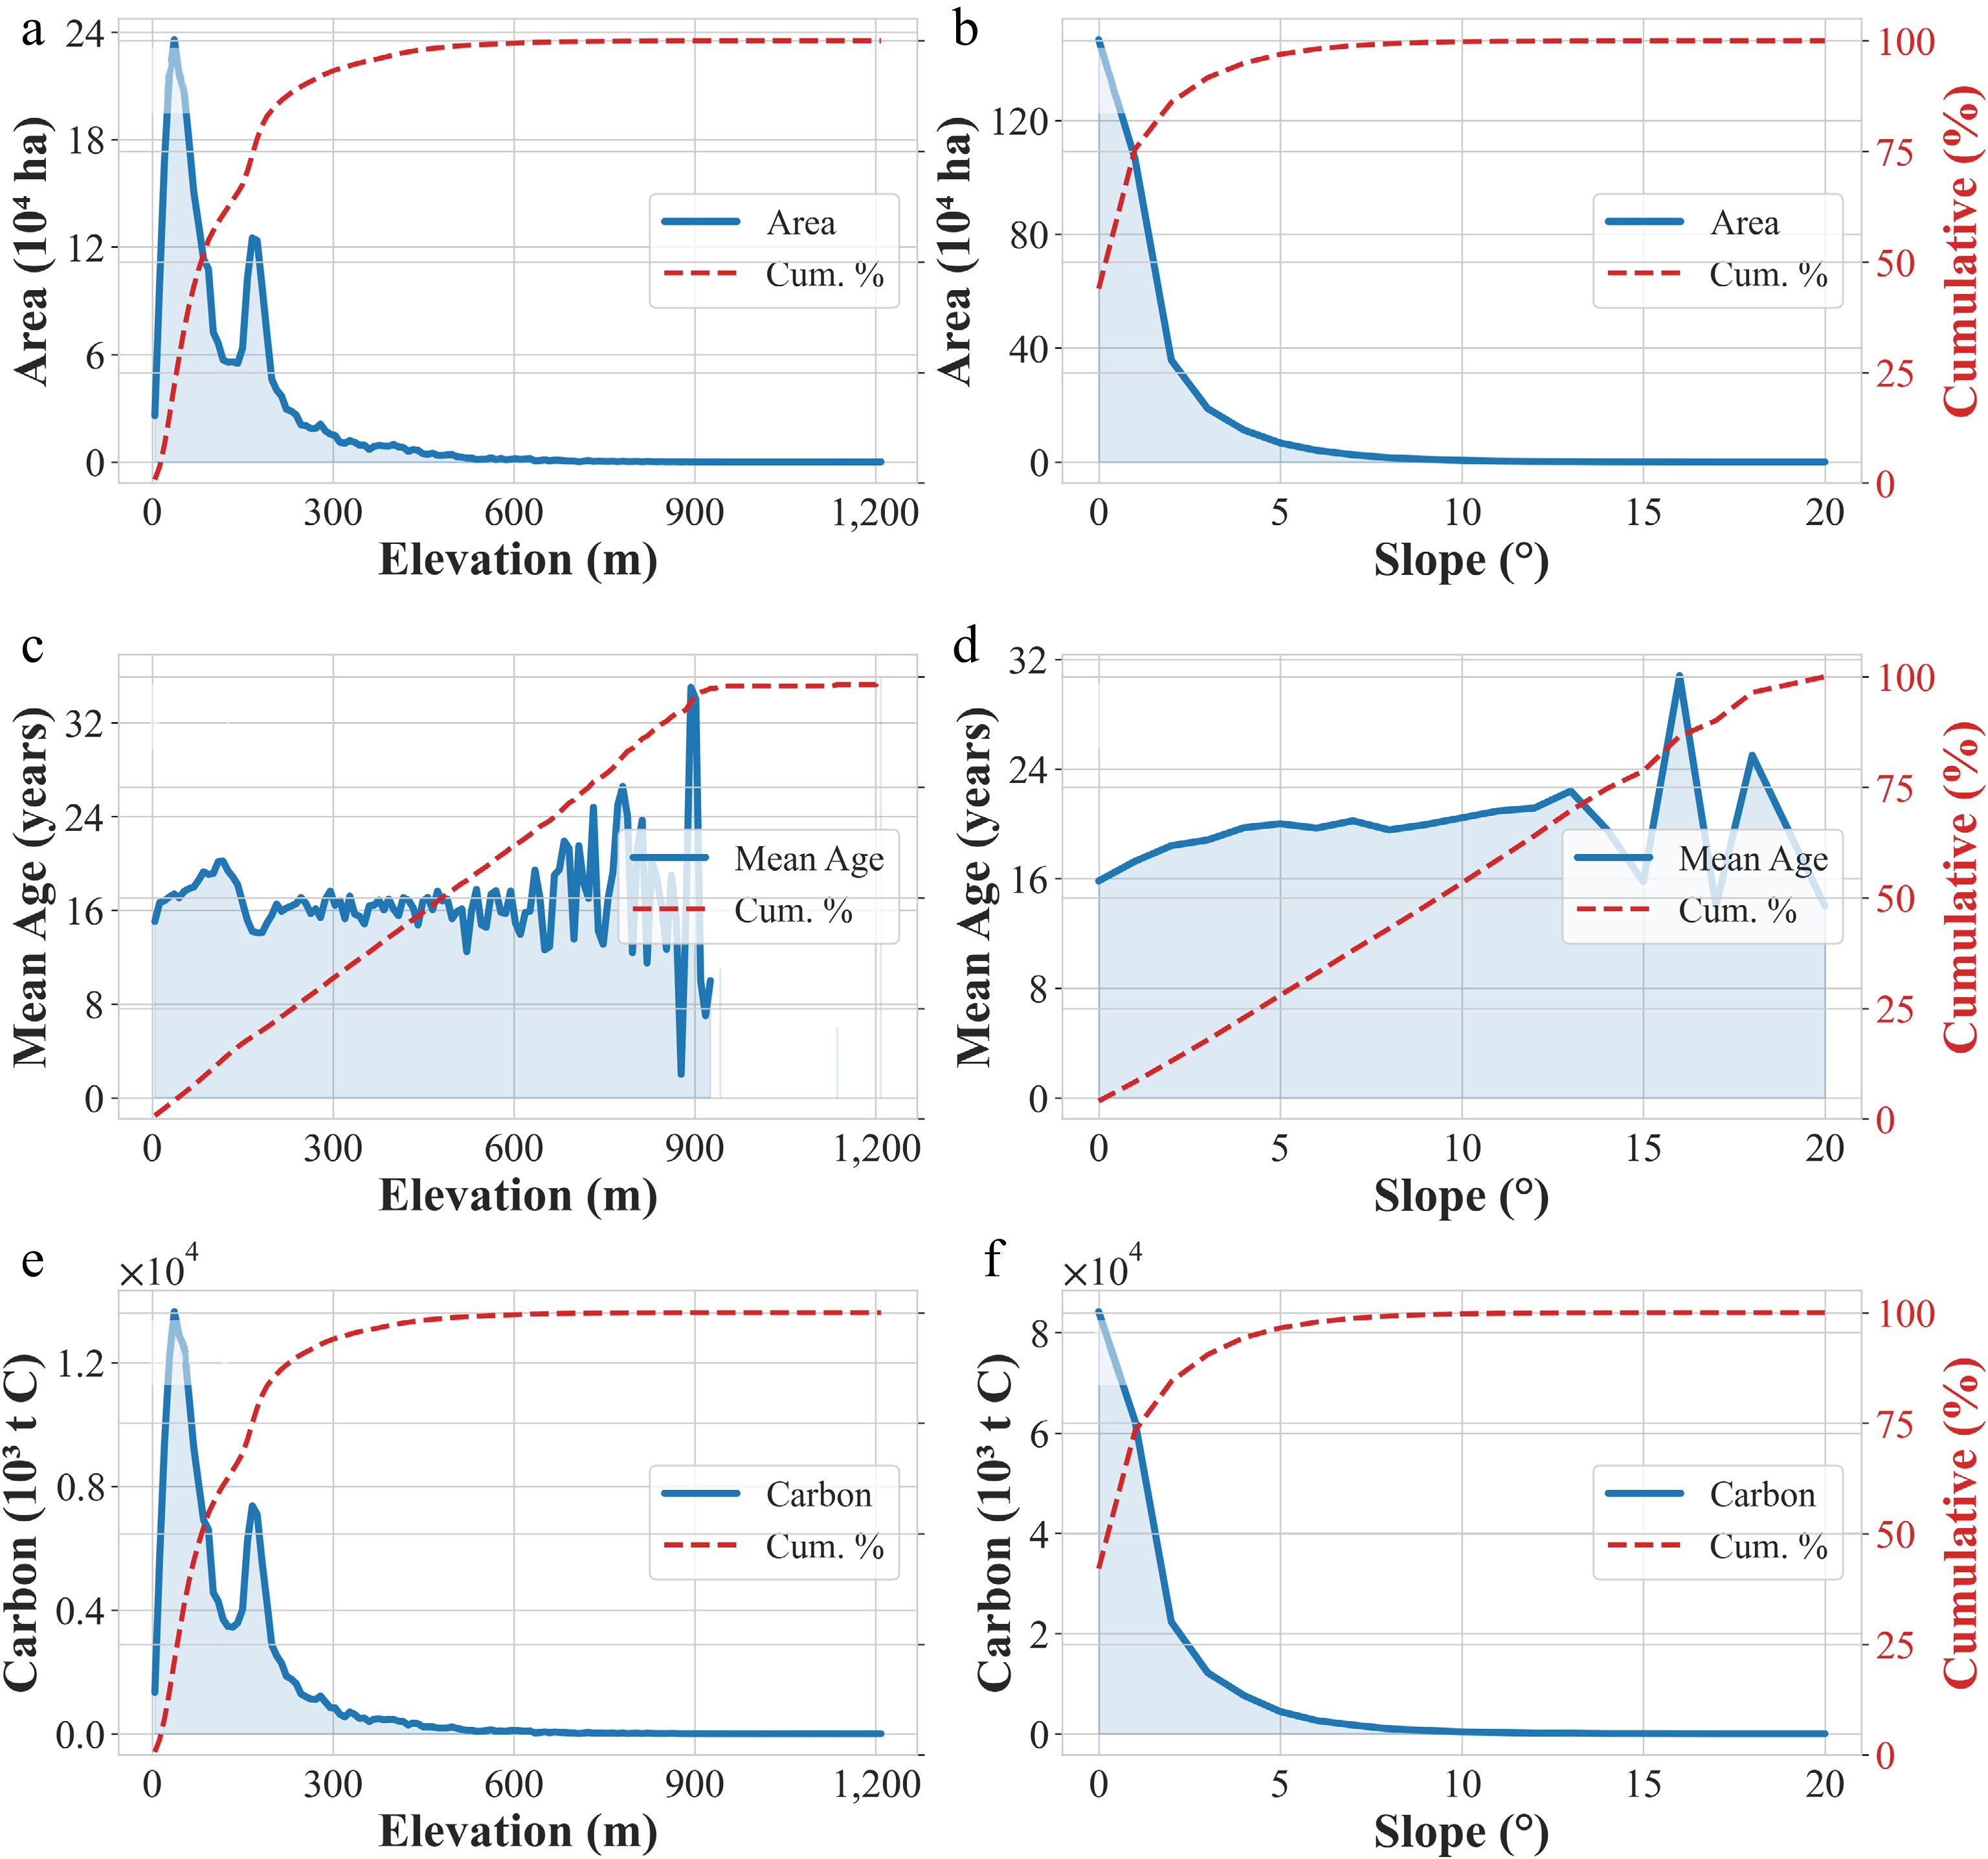
Figure 9.
Planted area and carbon stock variations along topography: (a)−(f) Changes in planting area, carbon stock, and forest age across elevation ranges and slope regions.
Most plantations were on level or near-level land. Slopes below 5° accounted for 95.3% of the total plantation area. Slopes of 5°−15° contributed an additional 0.17 × 10⁶ ha, or 5.0% of the total, while plantations on slopes greater than or equal to 15° were scarce (Fig. 9b). The cumulative distribution further indicates that nearly 90% of plantations occur on slopes less than or equal to 10°. The carbon stock displayed a similar spatial pattern (Fig. 9f). Areas with 0°–5° slopes stored 189.4 Tg C, representing 94.4% of the national total. Regions with slopes of 5°−15° contained 11.3 Tg C, or 5.6% of the total. Stand age distributions varied with slope (Fig. 9f). Plantations on 5°−15° slopes averaged 20.0 years, compared with 16.9 years for 0°−5° slopes.
Approximately 82.4% of Thailand's total carbon stock is concentrated in areas with elevations less than or equal to 200 m and slopes less than or equal to 5°, underscoring the strong preference of rubber plantations for low-elevation and gently sloping terrain. These lowland environments provide favorable conditions for rubber, which contributes to higher biomass accumulation. The joint cumulative analysis further indicates that 90% of rubber plantations occur below 255 m in elevation and slopes of up to 12°, emphasizing the confinement of most cultivation to low, relatively flat areas.
-
Accurate national-scale mapping of rubber plantations underpins reliable carbon accounting but has long been constrained by persistent challenges: cloud contamination in tropical imagery, spectral confusion with evergreen forests, and regional variability in rubber phenology. Conventional spectral-based classification often struggles under these conditions.
By integrating Landsat and Sentinel-2 time series within the CCDC framework, this study shifts from static spectral classification to phenology-driven identification. Rubber trees exhibit a diagnostic annual defoliation phase (typically February–March), during which canopy reflectance diverges from evergreen forests. Capturing this recurrent signal within multi-year temporal trajectories enables robust discrimination and substantially reduces omission and commission errors. To ensure consistency across the transition between sensors, a unified preprocessing framework and comparable spectral variables were employed. While Sentinel-2 provides higher spatial and spectral resolution after 2015, the stable classification performance throughout the study period suggests that the inclusion of temporal phenological features and change detection variables effectively buffers sensor-specific differences, ensuring the robustness of the long-term monitoring. The resulting national map achieved an overall accuracy of 94.03%, outperforming previous efforts in Thailand. Producer's and user's accuracies for rubber plantations reached 96.2% and 93.8%, respectively, confirming strong thematic reliability.
This phenology-based, multi-sensor framework establishes a replicable and scalable monitoring approach that is transferable across Southeast Asia and supports consistent tracking of plantation dynamics for land-use governance and sustainability monitoring.
The need to accurately extract forest age in the carbon stock estimation of the rubber plantation
-
Stand age is a primary determinant of carbon stock in rubber plantations, which follow a sigmoid growth trajectory: slow accumulation during the juvenile phase (1–7 years), rapid increase during the productive phase (8–25 years), and stabilization thereafter. Reliable age information is therefore essential for accurate carbon estimation and sequestration modelling.
Using long-term Landsat time series and the CCDC algorithm, plantation establishment years were identified through abrupt spectral breakpoints at annual resolution. Bidirectional temporal segmentation was applied to enhance breakpoint reliability under uneven historical data density. Stand age estimation achieved an RMSE below four years, improving upon MODIS-based age mapping (~75% accuracy) and many Landsat-based disturbance reconstructions with uncertainties of 5–10 years.
Compared with forest inventory approaches updated every 5–10 years[54,55], this method provides continuous, spatially explicit, annually resolved age surfaces at the national scale. Such temporal precision enables dynamic cohort tracking and the construction of consistent annual carbon stock inventories.
Integrating rubber plantations into national carbon management strategies
-
Previous studies had indicated that rubber plantations typically store 30−100 t C·ha−1, representing approximately 30%−33% of natural tropical forest carbon stocks (exceeding 300 t C·ha−1)[56]. Our findings show Thailand's rubber plantations average 74.8 t C·ha−1, which falls within the upper-middle range and is equivalent to 60%−70% of comparable natural forest carbon stock. These findings confirm that Thailand's rubber belt acts as an important carbon sink[57]. However, the climate mitigation value of these stands depends heavily on their land-use history: converting degraded croplands to rubber boosts stocks, while replacing intact forests results in net carbon debt[4,58]. Because the present study did not explicitly reconstruct pre-conversion land-cover trajectories, the relative contributions of degraded cropland, secondary vegetation, and natural forests to rubber expansion cannot be quantified. Consequently, the reported carbon stocks should not be interpreted as evidence of a net climate benefit without considering the land-use conditions that preceded plantation establishment.
The role of rubber in Southeast Asian forest loss remains a subject of intense debate. Wang et al. recently claimed over 4 Mha of forest loss since 1993, which is two to three times higher than previous estimates, suggesting severely underestimated carbon emissions[16]. However, critics such as Hoang et al. and Sheil et al. argue these figures are inflated, noting that Wang et al. likely confused rubber with other crops like oil palm and utilized overly broad 'forest' definitions that include regrowth and pre-existing plantations[17,18]. They suggest actual impacts are likely 25%–50% lower. Therefore, rigorous, annually resolved mapping is not merely an academic exercise but a prerequisite for ensuring that only compliant, non-deforesting plantations enter the carbon credit pipeline.
This complexity is evident in Thailand, where northeastern expansion risks replacing biodiverse forests. Young stands in the northeast signal recent conversions that fragment habitats and erode biodiversity services like pollination and soil stability[38]. Conversely, mature southern stands (> 17 years) harbour notable ecological co-benefits; when managed as agroforestry with intercropping, these systems can support biodiversity at 30%–70% of natural forest levels[4]. However, from a carbon-finance perspective, these mature stands face 'additionality' hurdles. Since their carbon is already sequestered, they may not qualify for voluntary credits unless it can be demonstrated that carbon funding is essential to prevent their conversion or to implement new management practices, such as extending rotation cycles, that exceed business-as-usual scenarios.
Thailand's dominance in the rubber markets provides a unique lever for global supply chains. Our dataset provides an important spatial basis for baseline analysis, monitoring, and MRV, thereby supporting policy planning and future carbon accounting efforts[59]. Nevertheless, a clear distinction must be maintained between national carbon inventories used for state-level reporting and the more stringent requirements for tradable offsets, which demand rigorous baseline setting and leakage prevention. Our annual maps and biomass-carbon estimates may support preliminary baseline development, monitoring, inventory improvement, and spatial planning.
Uncertainty analysis and future directions
Uncertainty analysis
-
Classification uncertainty arises primarily from spectral confusion between rubber plantations and other perennial vegetation, particularly shrubs and non-rubber forests (NRF), as evidenced by the omission and commission errors in the confusion matrix. Such confusion is more pronounced in heterogeneous landscapes where mixed pixels and transitional zones complicate discrimination. To further mitigate these challenges, incorporating rubber-specific phenological signals (e.g., the unique defoliation-refoliation cycle), textural features to identify regular planting patterns, and topographic constraints (e.g., slope and elevation) could help refine the differentiation between rubber plantations and natural vegetation. Additionally, cloud contamination in tropical regions, despite rigorous quality filtering, may still introduce temporal noise that affects the consistency of phenological feature extraction. To mitigate these challenges, our framework leverages long-term phenological signals and a bidirectional temporal segmentation approach, ensuring a reliable spatial foundation and minimizing the propagation of errors into the subsequent carbon inventory.
Stand age estimation is limited by the start date of the satellite record. Plantations established before 1987 were assigned 1987 as their planting year, which leads to an underestimation of age for older stands. However, these older plantations represent only a small fraction of the total study area. Furthermore, during the 1980s and 1990s, when data density from Landsat 5 was lower than the current multi-sensor era, limited clear observations could lead to minor delays in identifying establishment breakpoints. Similarly, validation is constrained by the availability of reliable historical records. We used 57 plots that were cross-verified using field data and historical Google Earth imagery. Most samples are located in Southern Thailand, the country's primary rubber-producing region. Although these samples span the main agroecological zones of rubber cultivation in Thailand, the total sample size remains modest relative to the full spatial extent of the national plantation network. The lack of verifiable records in the northeast and central regions is a limitation of this study. Mixed-age stands, progressive replanting, and plantation renewal may also contribute to uncertainty, as the detected establishment year typically reflects the dominant disturbance signal within a pixel rather than all stand cohorts.
Carbon stock estimation is sensitive to model parameters, stand structure assumptions, and the limitations of using age as a primary proxy for biomass. While stand age is a dominant driver of carbon accumulation, this approach may not fully account for site-specific variations in management intensity, clonal variability, or initial planting density, all of which can lead to divergent carbon stocks even in stands of the same age. Furthermore, biomass accumulation is influenced by site-specific soil properties and regional climate fluctuations, such as rainfall patterns, which may cause localized deviations from the national average growth trajectory. Additionally, assuming uniform growth across Thailand's diverse environmental gradient likely introduces localized uncertainty. Therefore, the reported uncertainty range should be interpreted as a partial uncertainty estimate primarily reflecting stand-age propagation, while additional uncertainties associated with classification, model structure, environmental heterogeneity, and management variability may further affect local carbon stock estimates.
Beyond these site-specific variations, we evaluated how uncertainties in stand age estimation propagate into the carbon stock results via a sensitivity analysis. We propagated the average age estimation error (3.16 years) through the growth model, yielding an estimated national uncertainty of ± 18.2% for the 2022 carbon stock assessment (i.e., 243 ± 44 Tg C). In addition, the biomass growth model itself carries inherent structural uncertainty, with an approximate coefficient of variation (CV) of 23% for stand-level predictions (Petsri et al.[53]), reflecting residual variability not fully captured by a single population-level growth curve. This structural uncertainty originates from model residual/structural error, which is a different source from the age-propagated uncertainty. However, without covariance information, we do not assume statistical independence between them; consequently, we have not combined the structural uncertainty into the ± 18.2% national estimate. Our analysis reveals that this uncertainty (age-propagated) is stage-dependent: for young plantations (≤ 6 years), an age error of ± 3.16 years leads to a carbon stock variation of −41.5% to +63.6%, while for mature stands (≥ 17 years), the impact narrows to −14.0% to +9.9% as the growth curve stabilizes (Supplementary Table S6). It should be noted that this sensitivity analysis represents a simplified first-order uncertainty estimate based on deterministic RMSE perturbations rather than a full stochastic uncertainty propagation framework. Therefore, the reported ± 18.2% national uncertainty should be interpreted as an indicative uncertainty range rather than a formal confidence interval. These findings indicate that Thailand's rubber plantations store substantial amounts of carbon and may contribute to climate mitigation under appropriate land-use contexts. Despite these site-specific limitations, the age-based model remains a practical tool for national-scale assessment, as stand age was the most consistently available parameter during the study period. Overall, the model provides a reliable representative benchmark for Thailand's rubber plantation carbon accounting.
While challenges remain in capturing gradual transitions or management-driven fluctuations, this framework effectively overcomes the fundamental limitations of traditional approaches. Unlike earlier methods that relied on localized forest inventory data[55] or assumed simplified age-class distributions[54], our approach provides the necessary spatial representativeness and temporal continuity for national-scale assessments.
Future directions
-
Improving rubber plantation monitoring requires advances in both data integration and analytical frameworks. Multi-sensor fusion remains essential: Sentinel-2 red-edge bands enhance sensitivity to vegetation biochemical properties, while SAR complements optical observations in persistently cloudy regions. Future efforts should prioritize robust cross-sensor harmonization to ensure geometric consistency and radiometric stability at large scales. Advances in deep learning, particularly attention-based and temporal modeling architectures, may further improve the extraction of complex spatiotemporal patterns, although computational efficiency and interpretability remain important considerations for operational deployment.
For stand age estimation, integrating multi-source remote sensing features that include spectral, structural, and textural information offers a practical pathway for capturing nonlinear age–signal relationships. While LiDAR provides accurate structural measurements, its large-scale application is constrained by cost and coverage limitations[60,61]. In data-limited regions, combining land-use history reconstruction with socioeconomic and policy records could support probabilistic age modeling frameworks.
Future improvements in carbon stock estimation will depend on moving beyond purely empirical allometric relationships toward models that better capture environmental heterogeneity. Bayesian and spatially explicit frameworks provide opportunities to integrate multi-source uncertainty and environmental covariates. Coupling remote sensing observations with ecosystem process models through data assimilation techniques could further enhance dynamic carbon estimation and enable projections under future climate scenarios. Achieving these advances will require standardized, long-term field monitoring networks to ensure reliable calibration and validation across Southeast Asia. Furthermore, even where plantation age is accurately estimated, the application of a single logistic growth model across Thailand does not account for spatial heterogeneity in site conditions (e.g., soil type, rainfall, temperature gradients from south to northeast) or in management practices (e.g., tapping intensity, fertilisation regimes, replanting cycles). Such heterogeneity is likely to introduce systematic, rather than purely random, biases into the carbon estimates—for example, consistently underestimating carbon in highly productive southern stands or overestimating it in nutrient-poor frontier soils. Regionally stratified allometric models would be needed to resolve these systematic effects.
-
Our study provides a new perspective on Thailand's rubber plantations, stand ages, and carbon stocks from 2003 to 2022. Carbon stocks estimated by the first-order age-propagated model grew by 132% to 243 Tg (equivalent to 890 Mt CO2) across three phases of expansion. The framework integrates phenology-driven mapping, CCDC precision with an RMSE of less than four years, and scalable tools, and these improvements outperform previous methods while offering new opportunities for monitoring and oversight. Future integration with multi-sensor data and models is expected to further improve accuracy and applicability. Our annual maps and biomass-carbon estimates may support preliminary baseline development, monitoring, inventory improvement, and spatial planning for national carbon neutrality.
-
accompanies this paper online at: https://doi.org/10.48130/smartfor-0026-0014.
-
During the preparation of this work, the authors used ChatGPT and DeepSeek in order to assist with language polishing and stylistic refinement. After using this tool/service, the authors reviewed and edited the content as needed and take(s) full responsibility for the content of the published article.
-
The authors confirm their contributions to this study as follows: supervision, methodology: Chen Y, Sheil D, Xu H, Song Q, Lu D; writing – original draft, investigation, formal analysis, conceptualization: Tang L, Chen Y; writing – original draft: Sheil D, Xu H; visualization, validation, software, methodology: Tang L; resources: Chen Y, Sheil D; writing – review and editing: Chen Y, Khongdee N; conceptualization: Khongdee N, Xu H; funding acquisition: Chen Y; methodology: Khongdee N. All authors reviewed the results and approved the final version of the manuscript.
-
The primary remote sensing datasets used in this study are publicly available through Google Earth Engine (Table 1). The products developed in this research are available from the corresponding author upon reasonable request.
-
The authors declare that they have no known competing financial interests or personal relationships that could have appeared to influence the work reported in this paper.
- Supplementary Table S1 Interpretation keys (signatures).
- Supplementary Table S2 Training and validation samples were used across 12 zones in 2022.
- Supplementary Table S3 Statistics of training samples per class from 2003 to 2021.
- Supplementary Table S4 Statistics of validation samples per class from 2003 to 2021.
- Supplementary Table S5 Key parameters of CCDC.
- Supplementary Table S6 Sensitivity analysis of carbon stock (CS) to age estimation error.
- Supplementary Fig. S1 Comparison of rubber plantation area trends between this study and FAO statistics.
- Supplementary Fig. S2 Spatial distribution of rubber plantations during 2003−2022.
- Copyright: © 2026 by the author(s). Published by Maximum Academic Press, Fayetteville, GA. This article is an open access article distributed under Creative Commons Attribution License (CC BY 4.0), visit https://creativecommons.org/licenses/by/4.0/.
-
About this article
Cite this article
Tang L, Chen Y, Sheil D, Khongdee N, Xu H, et al. 2026. National-scale assessment of rubber plantations expansion, stand age structure, and live biomass carbon stock dynamics in Thailand using multi-source remote sensing data. Smart Forestry 1: e017 doi: 10.48130/smartfor-0026-0014 

National-scale assessment of rubber plantations expansion, stand age structure, and live biomass carbon stock dynamics in Thailand using multi-source remote sensing data
- Received: 27 February 2026
- Revised: 20 August 2026
- Accepted: 25 August 2026
- Published online: 28 September 2026
Abstract: Thailand is the world's largest producer and exporter of natural rubber, and an accurate assessment of carbon stocks in its rubber plantations is crucial for national carbon accounting and climate policy. This study developed an integrated framework for dynamic rubber plantation mapping, stand age monitoring, and live biomass carbon stock estimation across Thailand. We conducted time-series mapping using Landsat and Sentinel-2 data on Google Earth Engine, achieving an average overall accuracy of 94.03% for spatial distribution and an RMSE of 3.16 years for stand ages via the Continuous Change Detection and Classification algorithm. Live biomass carbon stocks were estimated with a first-order age-propagated model. Results show that: (1) rubber plantation expansion followed three phases: a stable growth phase (2003–2010), a rapid expansion phase (2011–2016), and a stabilization phase (2017–2022), culminating in a total area of 3.71 × 106 ha by 2022. Approximately 90% of plantations were distributed below 255 m elevation and on slopes of less than 12°; (2) with an average age of 17.1 years, more than 75% of existing plantations are over middle-aged; (3) the total live biomass carbon stock had a 132% increase over 2003 and reached 243 Tg C in 2022 with more than 62% concentrated in southern provinces and more than 67% of provinces showing significant upward trends. Our findings highlight rubber's role and potential as a carbon sink while underscoring ecological trade-offs if it replaces natural forests.
-
Key words:
- Rubber plantations /
- Stand age /
- Live biomass carbon stock /
- Landsat /
- Sentinel-2 /
- Thailand