









-
The harvesting recommendations for even-aged forest management in Finland (
https://metsanhoidonsuositukset.fi/en ) consist of two guidelines: the first is for the clear-felling diameter, and the second is for the thinning basal area. The latter also includes a recommendation for the remaining post-thinning basal area (https://metsanhoidonsuositukset.fi/fi/harvennusmallihaku ). Both guidelines are provided separately for different tree species (Scots pine, Norway spruce, and birch), site fertility categories, and geographical regions (southern, central, and northern Finland). The main site fertility categories are herb-rich, mesic, sub-xeric, and xeric. There are also separate guidelines for three different discount rates (1.5%, 3%, and 5%). The guideline for the 3% discount rate is referred to as the baseline model and is the most used. There are separate guidelines for thinning from below and thinning from above.The basal area at which the stand should be thinned is expressed as a function of the dominant or mean height. The thinning basal area increases with dominant tree height and, in some cases, remains constant after the initial increase. In southern Finland, with a 3% discount rate, the thinning basal areas range from 25 to 33 m2·ha−1 for the typical growing sites of pine and spruce. The recommended mean stem diameter at clear-felling ranges from 26 to 32 cm.
Many private landowners see the forest as an investment which should be managed for good economic profit. Several optimization studies that maximize economic profitability suggest management that differs from the current recommendations. A common result is that optimal stand basal area is highest for young stands, and gradually decreases with increasing tree size[1−4]. Another common optimization result is that thinning from above should be used, especially in older stands[4,5].
Another limitation of the current management guidelines is that they do not consider the effect of fluctuating timber prices on optimal harvesting[6−8]. Temporal variation in timber prices is high (e.g.,
www.metsalehti.fi/puunhinta/puunhinta-2 ). If management guidelines do not advise forest landowners on how to react to price fluctuations, they fail to indicate economically optimal management. Many landowners postpone cuttings when timber prices are low, which is usually the optimal decision[9]. High timber prices may lead to many cutting decisions. Although these decisions are in the right direction, they may not be optimal unless they are based on optimized management guidelines that incorporate temporal timber price fluctuations.Timber prices also vary across stands and cuttings. For example, the stumpage price of sawlog per cubic meter is lowest in the first commercial thinning of an even-aged stand. In later thinnings, it may be 40% higher and, in the final felling, 60% higher (e.g.,
www.metsalehti.fi/puunhinta/puunhinta-2 ). The main reason for these differences is harvesting costs, which are highest in the first commercial thinning of an even-aged stand and lowest in clear-felling. Harvester productivity correlates strongly and positively with the size of the harvested trees[10]. For the forwarder, productivity depends mainly on the volume harvested per ha and on the forwarding distance[10].The effect of harvesting cost on the likely timber price can be considered by using roadside prices and harvesting cost functions in management optimization. However, this is not enough because the price also depends on wood quality and the sawn wood yield of the sawlogs[11]. Timber buyers may have different value categories for sawlogs, which affect the price that they offer to the landowner[5]. Since the criteria and prices of these categories are not open-access information, they cannot be used directly in management optimization.
However, partial solutions are available. As pointed out by Lappi[11], the proportion of sawn wood obtained from a sawlog increases with increasing top diameter of the log. Increasing tapering and increasing log length decrease the proportion of sawn wood that can be obtained from the stem. Because the sawn wood yield can be calculated for different logs and stems, its effect on the likely sawlog price can be estimated[11].
Another difficulty in management optimization is the crosscutting of harvested stems. Usually, there is a set of allowed log lengths. With the same set of possible log lengths, the optimal crosscutting differs for the landowner and timber buyers[11]. The landowner wants to maximize the sawlog yield because the stumpage price is higher for sawlogs than for pulpwood. However, if the buyer is a pulp mill (or an integrated saw- and pulp mill), the optimal crosscutting minimizes sawlog yield if the company makes greater profit with pulpwood than with sawlogs[11]. As discussed by Lappi[11], this is acceptable and logical because the company's duty is not to maximize the landowner's profit. Even when the buyer is an independent sawmill (without pulp production), it may not be interested in the topmost sawlogs of large trees or sawlogs obtained from small trees because the quality of the sawn wood obtained from these logs is often low.
Two approaches to using optimization in the development of management guidelines have been proposed in the literature. The first one optimizes the management of a high number of stands and then fits models for the thinning basal area and clear-felling diameter using the optimization results[12]. A more recent approach optimizes the guidelines directly in a one-step process[8,13]. The guidelines are described by models, and the parameters of these models are optimized.
There are also two approaches to incorporate temporal timber price fluctuations in management optimization. The first one uses the reservation price function[7]. The reservation price is the required timber price to start harvesting. It can be expressed as a function of mean tree diameter, stand basal area, etc.[8,14]. The function may be different for thinning and clear-felling. The other approach is to develop models for thinning basal area and clear-felling diameter by using timber price as one predictor. In both cases, stochastic timber prices are used in calculations.
The objective of this study was to develop timber-price-sensitive guidelines for thinning basal area and clear-felling diameter that show how the landowner should adapt to fluctuating timber prices. Special effort was put into a plausible estimation of the price that the landowner would obtain from the timber. Factors considered included harvesting cost, crosscutting, and sawn wood yield. The objective variable was the net present value (NPV), calculated at a 3% discount rate. The NPV was compared with the NPV obtained from management based on the current Finnish recommendation for thinning and final felling. The calculations were done for the pine and spruce forests of southern Finland.
-
A random sample of the field plots of the Finnish National Forest Inventory (NFI) was selected from the plots measured in southern Finland. Only one plot per cluster of eight plots was used. The distance between clusters is 8 km. This guarantees a wide spatial distribution of the sampled plots. The NFI plot data are the same as those used earlier in Heinonen et al.[15]. Two soil fertility categories for both Scots pine- and Norway spruce-dominated plots were used. These categories were mesic and sub-xeric for Scots pine, and herb-rich and mesic for Norway spruce. These are the most common growing sites of pine and spruce. Only mineral soil plots were selected. The mean tree diameter had to be between 10 and 24 cm (Supplementary Table S1). In the selected pine plots, the proportion of pine had to be at least 90% of the stand basal area. For spruce, which is often mixed with pine, birch, and aspen, the proportion of spruce had to be at least 80%. These criteria yielded the following numbers of plots for management optimization: sub-xeric pine 56 plots; mesic pine 60 plots; mesic spruce 43 plots; and herb-rich spruce 51 plots.
In addition, about 1,000 pines and spruces of different sizes were randomly selected from the NFI plots (Supplementary Table S2). The trees were used to optimize the crosscutting of the stems. The crosscutting results were used to calculate and model the proportion of sawlog in the usable stem volume and the proportion of sawn wood in the sawlog volume.
Calculation of sawlog yield
-
The crosscutting of about 1,000 stems was optimized to find the proportion of marketable stem volume. It was assumed that the allowed sawlog lengths range from 4.0 to 6.1 m at 0.3-m intervals (i.e., 4.0, 4.3, …, 5.8, 6.1 m). The minimum over-bark top diameter was 15 cm for pine and 16 cm for spruce. These are the most common specifications of pine and spruce sawlogs in Finland. The length of a pulpwood log was 4 m, and its minimum top diameter was 7 cm.
Since the stumpage price of sawlogs is higher than that of pulpwood, the crosscutting that is optimal for the landowner maximizes the sawlog yield. However, wood buyers do not maximize the landowner's benefit. If the buyer is a pulp company or an integrated pulp and sawmill company, it most probably tries to minimize the sawlog yield[11]. This is because the company makes a greater profit with pulp than with sawn wood. Therefore, in this study, crosscutting was optimized for minimum sawlog yield (and maximum pulpwood yield) to obtain the likely proportion of harvested sawlogs.
Finding the optimal combination of different log lengths is a combinatorial optimization problem, which can be solved with several different methods. In this study, simulated annealing was used in the same way as in Pukkala[16]. The taper models of Laasasenaho[17] were used to calculate the stem diameter at different heights and to calculate the volumes of the crosscut logs.
Calculation of sawn wood yield and price correction
-
The top diameters and volumes of the crosscut sawlogs were used to estimate the proportion of sawn wood obtained from the log. First, the function of Lappi[11] was adapted to calculate the percentage of sawn wood in a cylinder with the same diameter as the top diameter of the log. The function was as follows:
$ SWP=60.274+0.9509d_{\text{Top}}-0.0092d_{\text{Top}}^2\ $ (1) where, SWP is the percentage of sawn wood of the cylinder volume, and
$ {d}_{\text{Top}} $ $ {d}_{\text{Top}} $ $ SWV=0.01\times SWP\times\pi\times\left(0.01d_{\text{Top}}/2\right)^2\times LL\ $ (2) where, SWV is the volume of sawn wood (m3), and LL is the log length (m). Doing this over all logs crosscut from the stem produced the total volume of sawn wood for a tree. The ratio between the total sawn wood volume and the total sawlog volume was used to calculate a similar price adjustment factor as proposed by Lappi[11]. The value of the sawlog part of the stem was computed as:
$ AdjVal=\left[75\times SWV_{\text{Tot}}+25\times\left(SLV_{\text{Tot}}-SWV_{\text{Tot}}\right)\right]/SLV_{\text{Tot}}\ $ (3) where, AdjVal is the value of 1 m3 of sawlog, adjusted by the amount of sawn wood that can be obtained from the stem. SWVTot is the total volume of sawn wood in all sawlogs of a tree, and SLVTot is the total volume of all sawlogs. The difference (SLVTot−SWVTot) is the volume of sawing residues (chips and sawdust), which can be used for pulping or as bioenergy. It can be assumed that the value of sawing residues (per m3) is the same as the value of pulpwood[11].
The adjusted sawlog value (in €·m−3) was calculated for all stems for which the crosscutting was optimized (around 1,000 stems per species). Then, the sawlog-adjusted values of trees were divided by the average AdjVal among all crosscut stems. The results were used as a sawlog price multiplier, which was modelled as a function of breast height diameter (DBH) and tree height. The model for the price multiplier takes into account that increasing DBH increases the sawn wood yield. With a given DBH, increasing tree height should also increase the price multiplier because slowly tapering tall trees decrease the volume of outer parts of logs that are processed into wood chips.
The purpose of the price multiplier was to predict the likely timber price the landowner would receive for sawlogs. The exact price is always the result of negotiation and bidding among wood buyers. However, calculating the timber price as the difference between roadside prices and harvesting costs, and accounting for the effect of sawn-wood yield on sawlog price, should sufficiently mimic wood buyers' behavior and criteria when they calculate the price they can offer the landowner.
Development of management guidelines
-
The management guidelines consisted of clear-felling diameter and thinning basal area. Stand development was simulated in 5-year steps using the tree-level diameter increment and survival models of Pukkala et al.[18]. When the guidelines were used, the clear-felling criterion was evaluated first. If the mean tree diameter was too small for clear-felling, the stand basal area was checked to determine whether it exceeded the thinning basal area. If this was not the case, the stand was left to grow for 5 years, and the same checks were repeated.
The clear-felling diameter was modelled as a function of sawlog price, pulpwood price, and stand basal area:
$ D_{\text{Clearcut}}=a_0+a_1P_{\text{Sawlog}}+a_2P_{\text{Pulpwood}}+a_3G\ $ (4) where, DClearcut is the basal-area-weighted mean diameter (cm), PSawlog is the sawlog price (€·m−3), PPulpwood is the pulpwood price (€·m−3), and G is the stand basal area (m2·ha−1). The thinning basal area was modelled as a function of mean tree diameter and timber prices. The importance of sawlog price was assumed to increase with increasing tree size. The model for thinning basal area is:
$ G_{\text{Thin}}=\exp\left[b_0+b_1\ln\left(D\right)+b_2D+b_3\ln\left(P_{\text{Sawlog}}D\right)+b_2\text{ln}(P_{\text{Pulpwood}})\right] $ (5) where, GThin is the thinning basal area (m2·ha−1), and D is the basal-area-weighted mean diameter (cm). The thinning type and intensity were not optimized for a few reasons. First, timber from very light thinning is difficult to sell; the removal per ha needs to be at least 50–60 m3·ha−1. Second, very strong thinning makes the stand vulnerable to wind damage. Heavily thinned spruce stands are also vulnerable to bark beetle attacks, as strong thinning temporarily decreases the trees' resistance. Therefore, very heavy thinning should be avoided.
Several previous studies suggest that the economically optimal thinning type is thinning from above[4,5]. The optimal cutting often resembles diameter-limit cutting that removes all trees larger than a certain limiting diameter. However, this type of cutting may not be realistic in Finnish forests, which are often spatially heterogeneous, with subareas dominated by small trees and other areas dominated by large trees. In addition, trees of all sizes are removed for quality reasons and from extraction roads. In young stands, where no trees have reached the sawlog size, the optimal thinning may be thinning from below[5], which removes the weakest individuals before they die from excessive competition. Therefore, the optimal thinning strategy may be to switch from low to high thinning when a certain proportion of trees have reached the log size.
To accommodate this possibility in management optimization, an additional parameter was included in the guidelines: the mean diameter at which thinning type changes from thinning from below to thinning from above (c):
$ D_{\text{Switch}}=c\ $ (6) If switching is not optimal, the solution would suggest a very low switching diameter (thinning from above is always optimal) or a high diameter (thinning from below is always optimal).
The proportion of trees removed from different diameter classes was calculated with the following formula[8,13]:
$ T\left(d\right)=\dfrac{1}{\exp\left[1+\left(a_1(d-a_2)\right)\right]} $ (7) where, T(d) is the proportion of removed trees at diameter d (cm). The value of parameter a1 was 0.2 in thinning from below and −0.2 in thinning from above. Parameter a2 was first set equal to the mean diameter, after which its value was iteratively adjusted until the thinning intensity was 25%–35% of the stand basal area. Figure 1 shows an example of thinning from below and thinning from above. In practice, the thinning removal was mostly near 35% of basal area, as most thinnings were thinning from above, where a2 equal to mean diameter usually leads to higher than 35% removal.
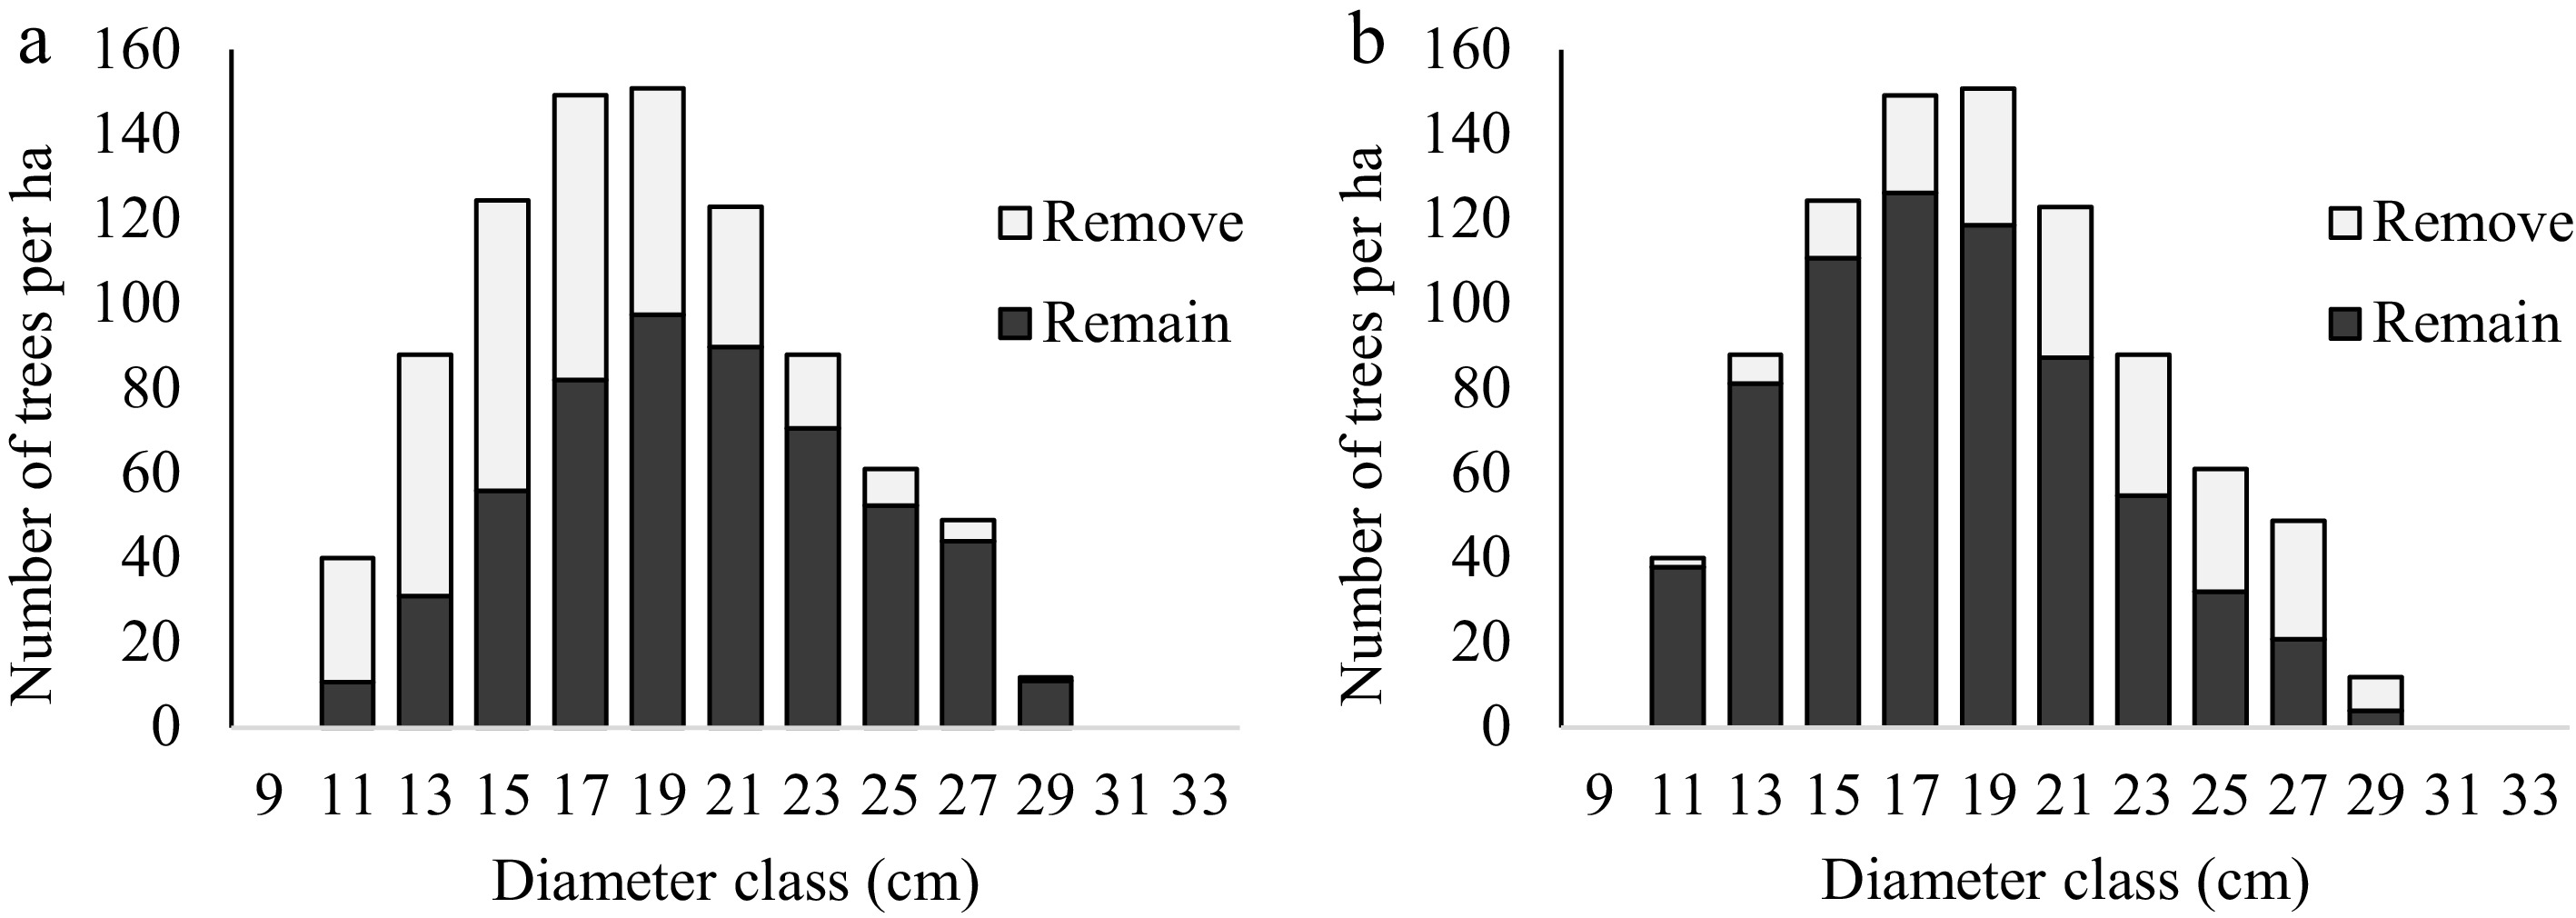
Figure 1.
(a) Thinning from below and (b) from above when 30% of the basal area is removed.
The parameters of three management guidelines (Eqs. [4]–[6]) were optimized simultaneously in the same way as used earlier by Jin et al.[13], Pukkala[19], and Tong et al.[8]. The management of all plots representing a certain tree species and site fertility category (43–60 plots) was simulated until clear-felling, and the NPV of the simulated schedules was calculated over all plots. The total NPV of the plots was maximized in the optimization. Based on the simulation feedback, the parameters of the management guidelines were adjusted. This was repeated many times until the stopping criterion of the optimization algorithm was reached. Several methods could be used for parameter optimization. The method used in this study was differential evolution[20,21]. The parameters of the algorithm were based on preliminary analyses and a previous study[22]. The population size was 100, the number of iterations was 50, and the optimization was repeated five times for each problem.
Price scenarios
-
The temporal fluctuations in timber prices were incorporated in the analysis by calculating the NPV of a management schedule under 100 stochastic timber price scenarios for the roadside price of pine and spruce sawlogs and pulpwood. The scenarios were produced by using the models of Leskinen & Kangas[23]. The model considers temporal autocorrelation in timber prices and cross-correlations of the prices of different timber assortments (Fig. 2).
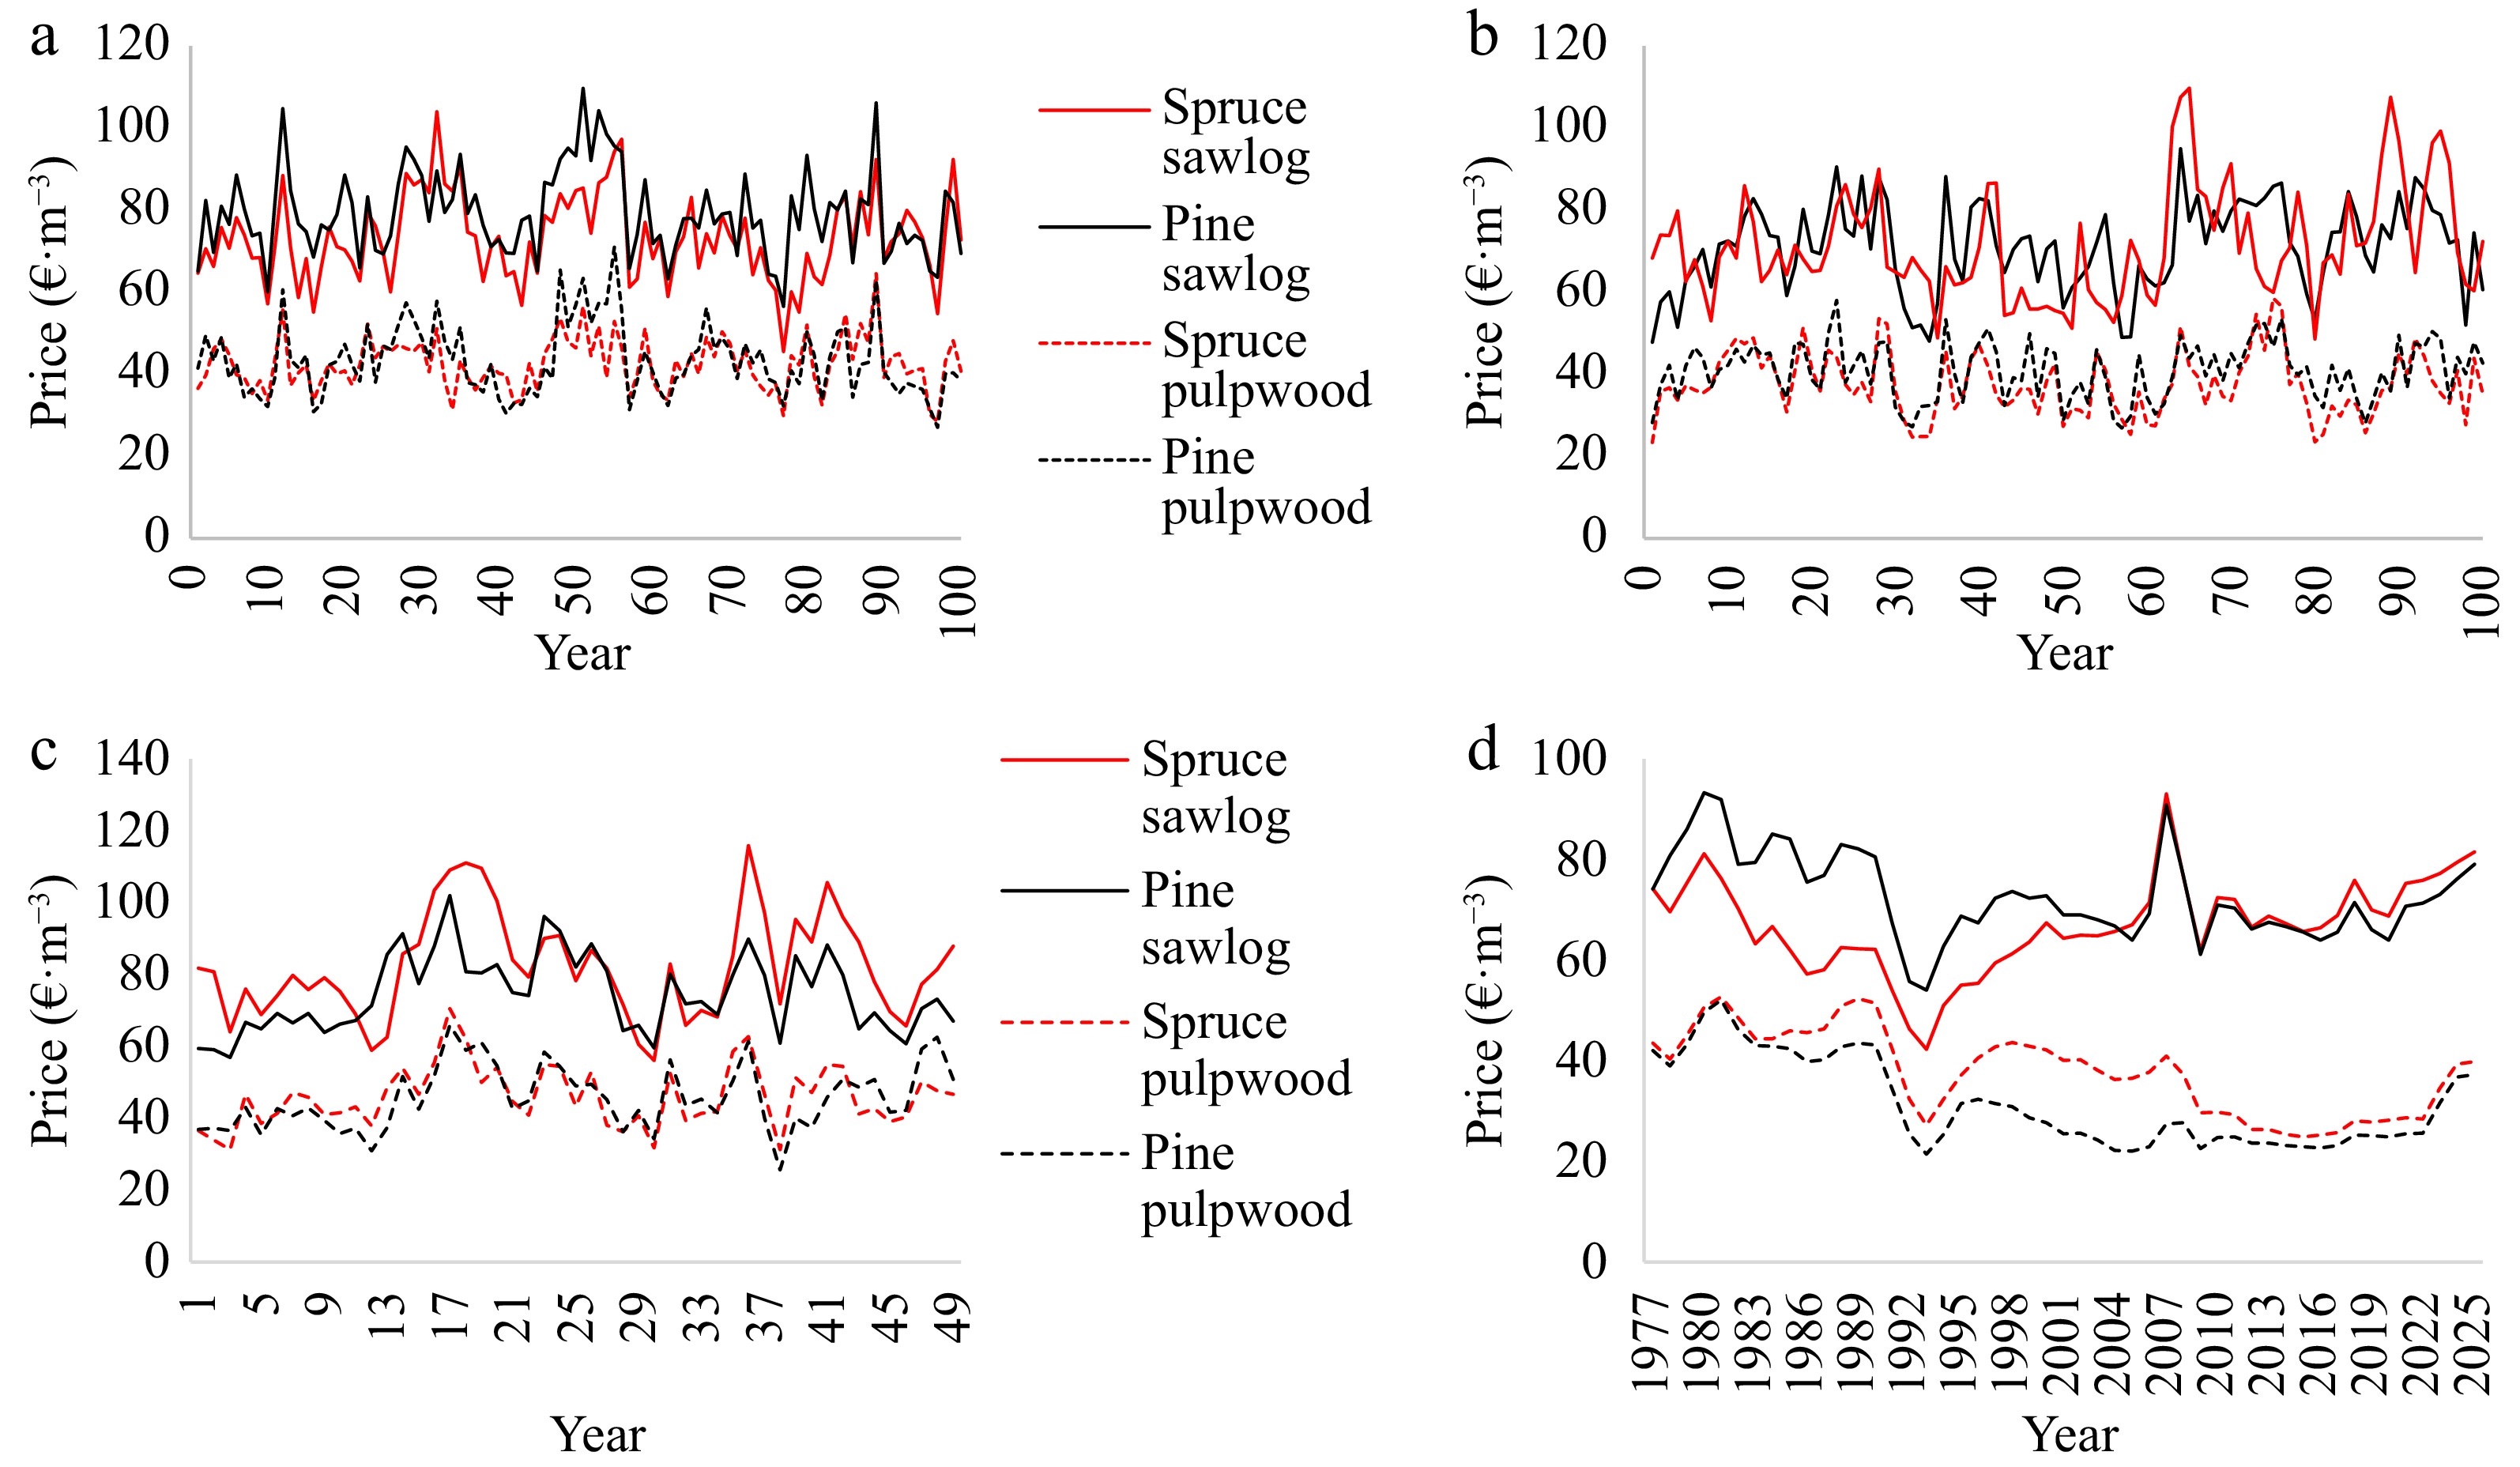
Figure 2.
(a), (b) Examples of stochastic 100-year roadside timber price scenarios. (c) Stochastic 49-year scenario. (d) A 49-year scenario based on timber price statistics for southern Finland. All scenarios describe real timber prices. The cost-of-living index has been used to remove the effect of inflation.
Calculation of the NPV for a management schedule under 100 timber price scenarios produced a distribution of NPVs (in €·ha−1) for each cutting schedule evaluated during optimization. The maximized objective function was the sum of the mean NPVs of all plots included in the analysis (43–60 plots):
$ OF=\sum\nolimits_{j=1}^{J}\left(\sum\nolimits_{i=1}^{100}{NPV}_{ij}\right)/100 $ (8) where, OF is the objective function value, J is the number of plots, and NPVij is the NPV of plot j under timber price scenario i.
Simulation continued until clear-felling. The NPV of the next rotation was considered by adding the bare land value to the net income of clear-felling. The bare land value was calculated using models of Pukkala[24] (Supplementary Text S1).
-
The results of optimized crosscutting for about 1,000 stems of pine and spruce were used to calculate the usable volume and sawlog volume for each stem. The stems for which the sawlog volume was greater than zero were used to fit the following models for the sawlog yield (logit-transformed proportion sawlog):
$ y=a_0+a_1\ln\left(d\right)+a_2d+a_3h\ $ (9) where,
$ y=\text{ln}(\dfrac{p}{1-p}) $ 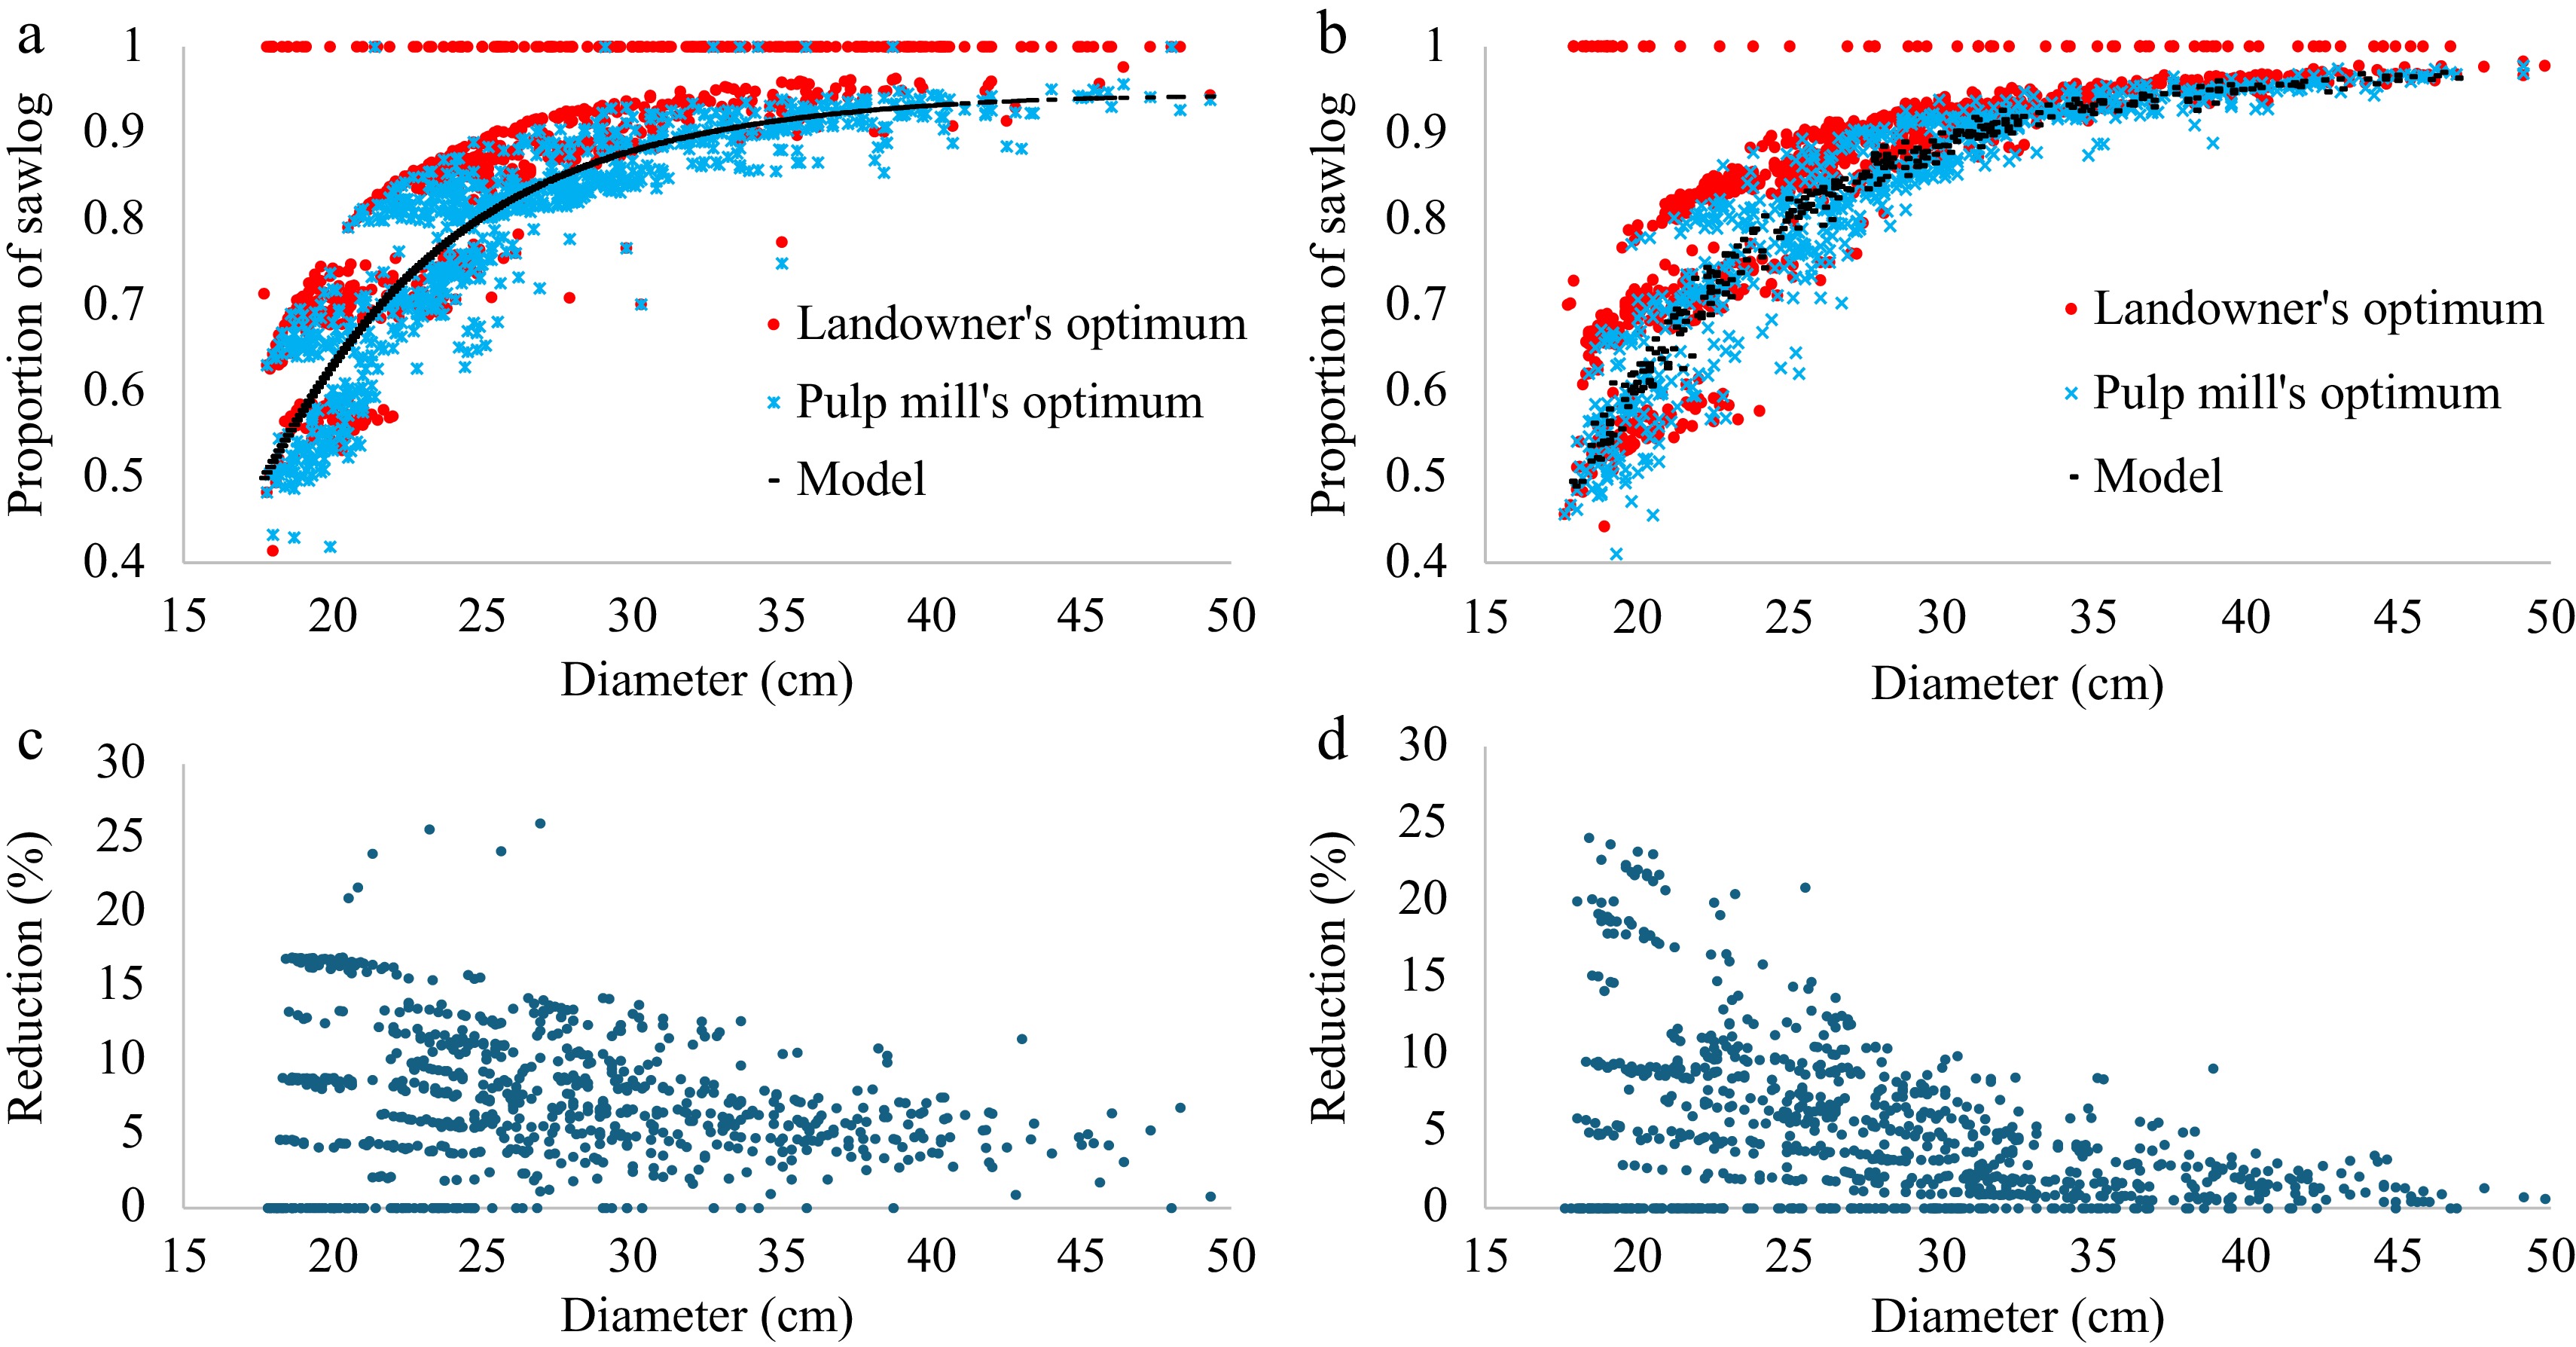
Figure 3.
(a), (b) Optimal crosscutting when sawlog yield is maximized (landowner's optimum) or minimized (pulp mill's optimum), and model predictions for the pulp mill's sawlog yield. The lower diagrams (c), (d) show the relative reduction in sawlog volume when the landowner's optimum is replaced by the pulp mill's optimum. Diagrams (a) and (c) are for pine and diagrams (b) and (d) are for spruce.
The parameters of Eq. (9) (Table 1) suggest that increasing DBH increases the proportion of sawlogs until it levels off and begins to decline toward very large stem diameters. In spruce, tree height was also a significant predictor with a positive sign. The model predicts that, with a given DBH, the proportion of sawlogs is higher in tall and slender spruces.
Table 1. Parameters of models for the logit-transformed proportion of sawlogs (of usable stem volume).
Predictor Parameter Pine Spruce Estimate t-value Estimate t-value Intercept a0 −17.6771 −18.17 −15.7233 −27.52 ln(d) a1 7.0033 16.70 5.8150 23.98 d a2 −0.1385 9.29 −0.0926 −11.30 h a3 − − 0.0341 10.64 RMSE 0.3914 0.2758 R2 0.699 0.788 Sawlog price correction models
-
The sawlog price multiplier was based on the proportion of sawn wood that could be obtained from the logs crosscut from the stem. The model is as follows:
$ M=a_0+a_1\ln\left(d\right)+a_2\text{ln}(h)\ $ (10) where, M is the sawlog price multiplier, d is the DBH (cm), and h is the tree height (m). For both species, tree height was a more significant predictor for the price multiplier than DBH (Table 2). In spruce, the sign of the regression coefficient of DBH was negative, which means that with a given height, the proportion of sawn wood obtained from sawlogs would decrease with increasing DBH.
Table 2. Parameters for the model of the sawlog price multiplier.
Predictor Parameter Pine Spruce Estimate t-value Estimate t-value Intercept a0 0.5231 82.54 0.6198 121.60 ln(d) a1 0.0533 25.01 −0.0580 −28.39 ln(h) a2 0.1024 43.14 0.1857 71.99 RMSE 0.0110 0.0102 R2 0.869 0.874 Figure 4 shows that the sawlog price multiplier calculated for the crosscut stems correlated positively with both DBH and tree height, but the correlation was stronger with tree height. Tall, slowly tapering trees are good material for sawmills because they produce less wood chips, which are unwanted byproducts, at least for independent sawmills.
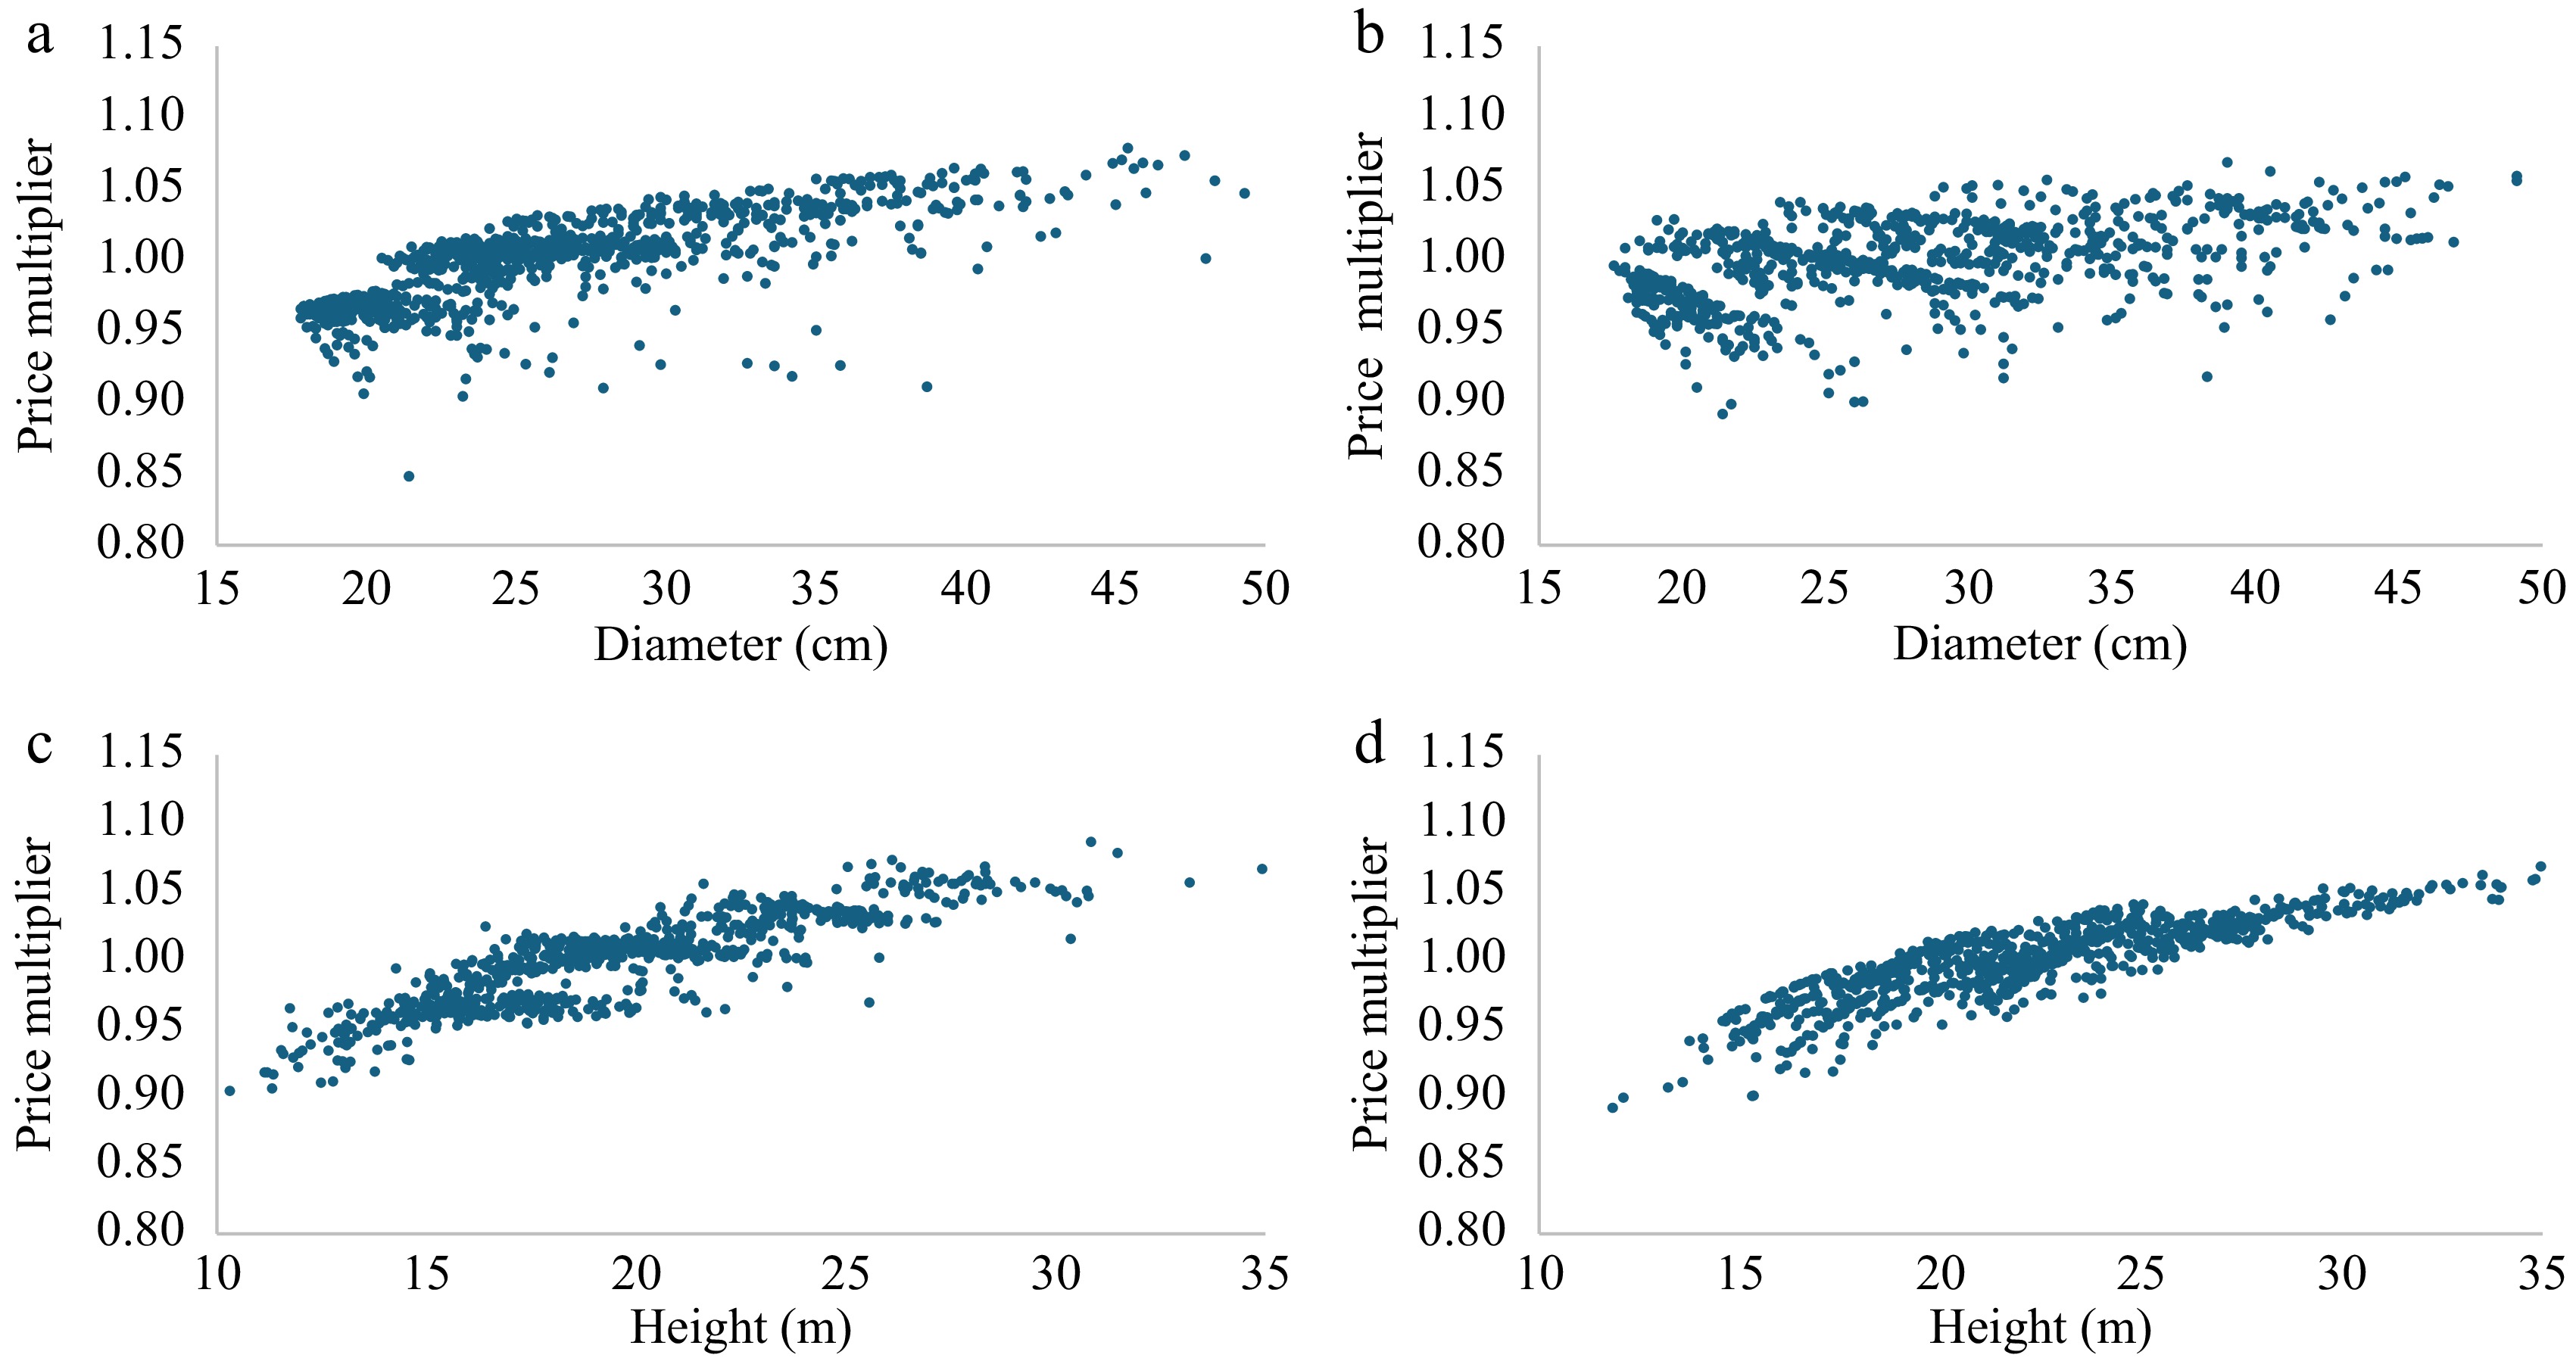
Figure 4.
Relative sawlog price under the assumption that the price depends on the proportion of sawn wood that can be obtained from the sawlogs. Diagrams (a) and (c) are for pine and diagrams (b) and (d) are for spruce.
Figure 5 shows the combined effect of DBH and tree height on the sawlog proportion and sawlog price multiplier in spruce. Because increasing slenderness (decreasing tapering) increases both sawlog yield and the price multiplier (sawn wood yield), the price of 1 m3 of usable volume is about 5–6 €·m−3 (7%–12%) higher in a tall spruce than in a short, quickly tapering spruce.
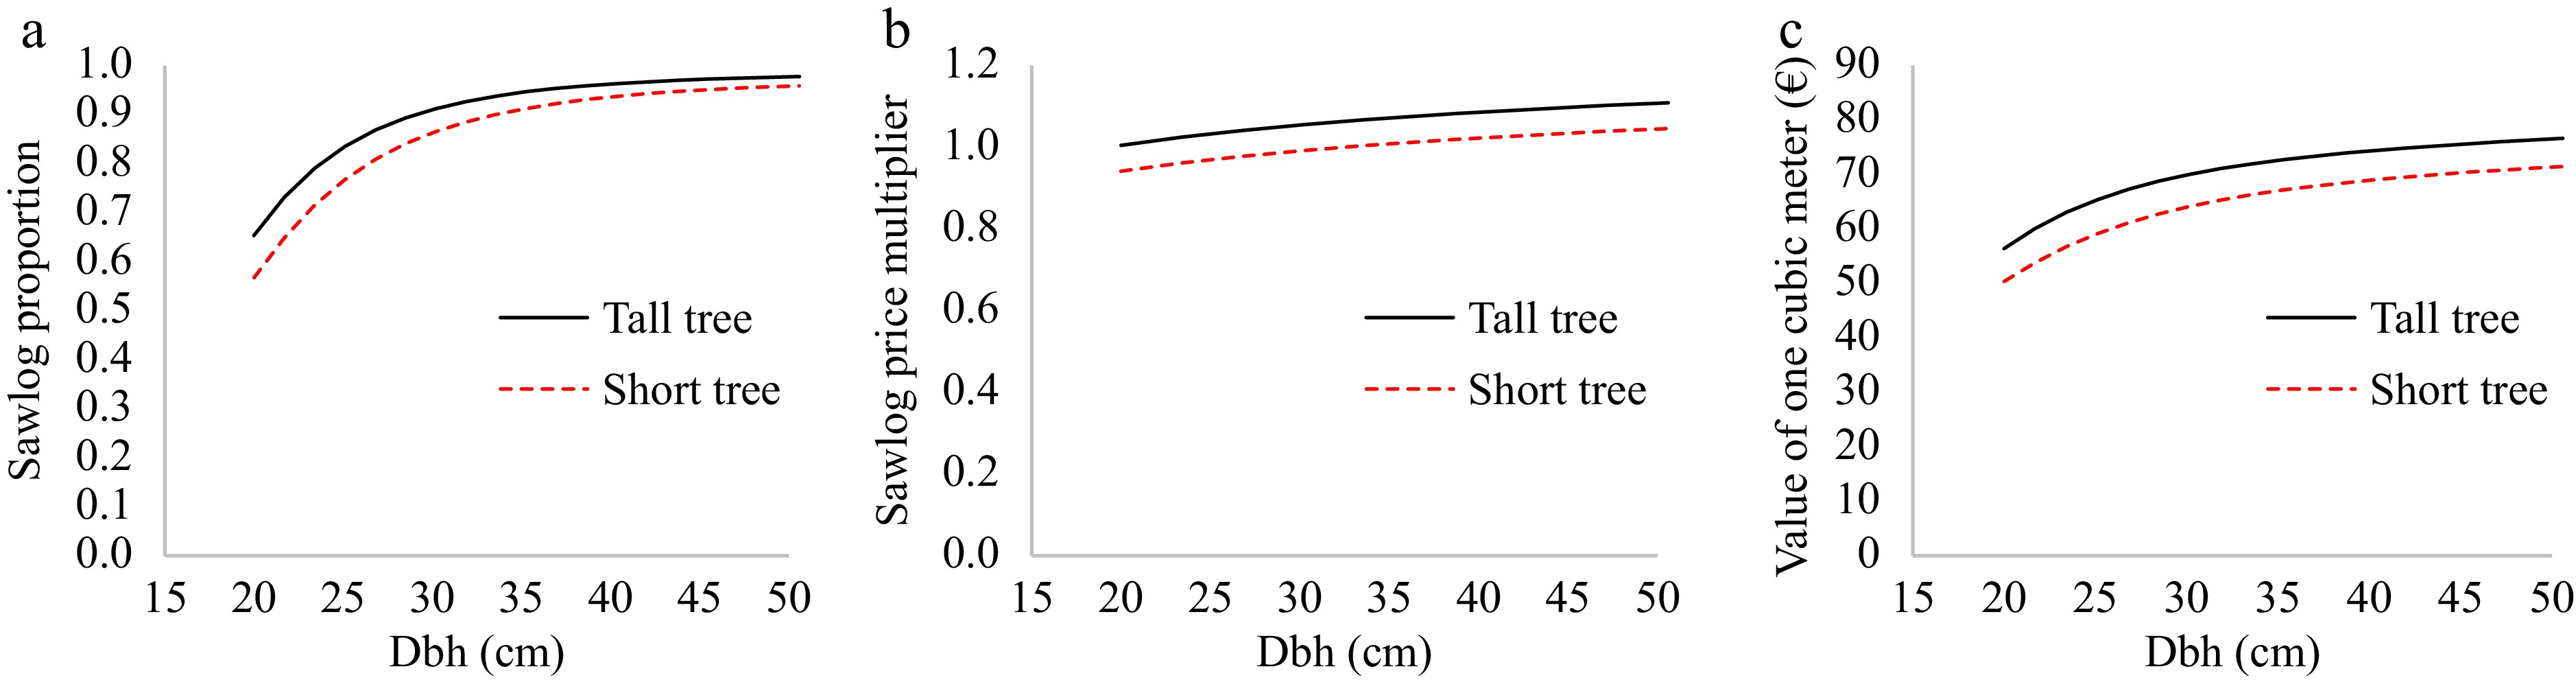
Figure 5.
(a) Dependence of the proportion of sawlog volume of usable volume on DBH in short (30% shorter than average) and tall (30% taller than average) spruce, (b) the sawlog price multiplier, and (c) the average roadside price of usable stem wood in €·m−3.
Optimized management guidelines
-
The optimal clear-felling diameter decreased with increasing basal area and timber price (Table 3). The effect of sawlog price was stronger than the effect of pulpwood price. With typical basal areas (25 m2·ha−1) and a sawlog price of 75 €·m−3, the clear-felling diameter was 27.4 cm for sub-xeric pine, 30.8 for mesic pine, 32.5 for mesic spruce, and 35.8 cm for herb-rich spruce. In the current guidelines, the recommended range is 25–30 cm for sub-xeric pine, 26–32 cm for mesic pine, 26–30 cm for mesic spruce, and 28–32 cm for herb-rich spruce. Therefore, the optimized guidelines of this study suggest larger clear-felling diameters for spruce than the current official recommendations. For pine, the results agree with the current recommendations.
Table 3. Parameters of the models for clear-felling diameter (Eq. [4]), thinning basal area (Eq. [5]), and the diameter at which thinning from below is changed to thinning from above (Eq. [6]).
Predictor Parameter Pine Spruce Mesic Sub-xeric Herb-rich Mesic Clear-felling diameter (Eq. [4]) Intercept a0 56.5829 45.8596 72.5192 64.8701 PSawlog a1 −0.3129 −0.1341 −0.2846 −0.3446 PPulpwood a2 −0.0230 −0.0932 −0.2989 −0.0839 G a3 −0.0513 −0.1713 −0.1097 −0.1147 Thinning basal area (Eq. [5]) Intercept b0 −1.3922 1.4633 4.4442 −0.8991 ln(D) b1 4.7676 4.2347 2.9134 4.7651 D b2 −0.2486 −0.2325 −0.1469 −0.2473 ln(PSawlogD) b3 −0.3603 −0.6706 −0.4602 −0.4412 ln(PPulpwood) b4 −0.4664 −0.3429 −0.8665 −0.4733 Mean diameter to start thinning from above (Eq. [6]) Constant c 15.38 15.78 10.16 13.05 The models and Fig. 6b show that, under fluctuating timber prices, the sawlog price strongly affects the mean stem diameter at which clear-felling is optimal. If the sawlog price decreases by 5 €·m−3, clear-felling should be postponed until the mean stem diameter is 0.7 (sub-xeric pine) to 1.7 cm (mesic spruce) larger. A good price (90 €·m−3) calls for clear-felling at a smaller mean diameter, but not smaller than the lower limit of the current recommendations.
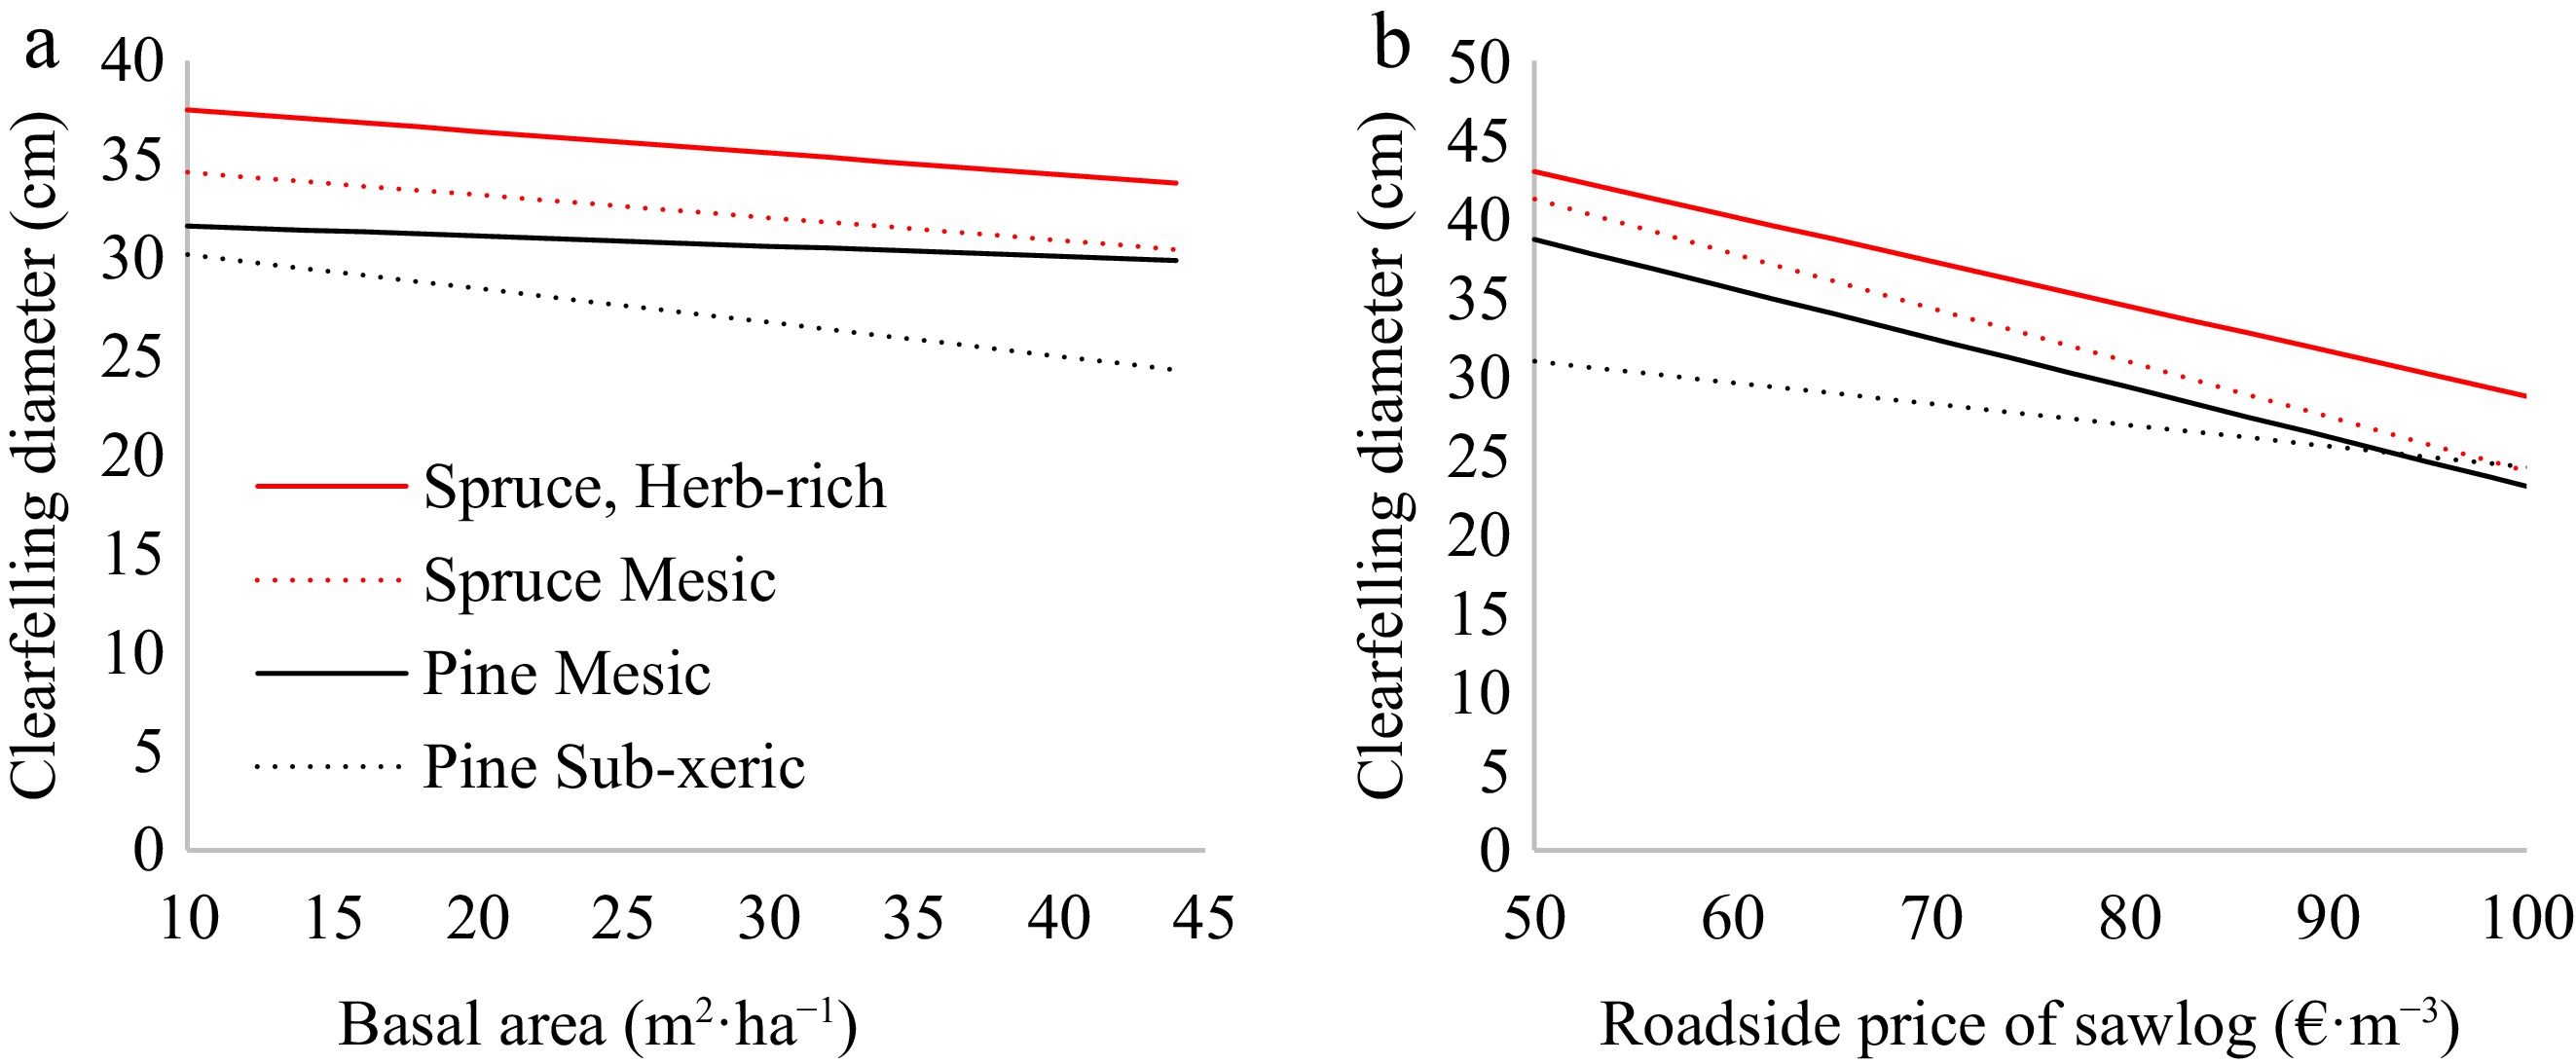
Figure 6.
Effect of (a) stand basal area and (b) roadside price of sawlog on the clear-felling diameter of pine and spruce stands on different sites when the roadside price of pulpwood is 42 €·m−3. In diagram (a), the roadside price of sawlog is 75 €·m−3.
The optimal thinning basal area differs substantially from current recommendations (Fig. 7). The results of this study suggest that young stands with a mean DBH less than 20 cm should be dense, after which the basal area should be reduced as tree size increases. If timber prices increase, the thinning basal area should decrease, and vice versa. If the mean tree diameter is 25 cm and the prices of all timber assortments increase by 20%, the optimal thinning basal area decreases by 14%–21%, with the largest decreases in mesic pine and the smallest in herb-rich spruce. A 20% decrease in timber price would increase the thinning basal area by 20%–34%.
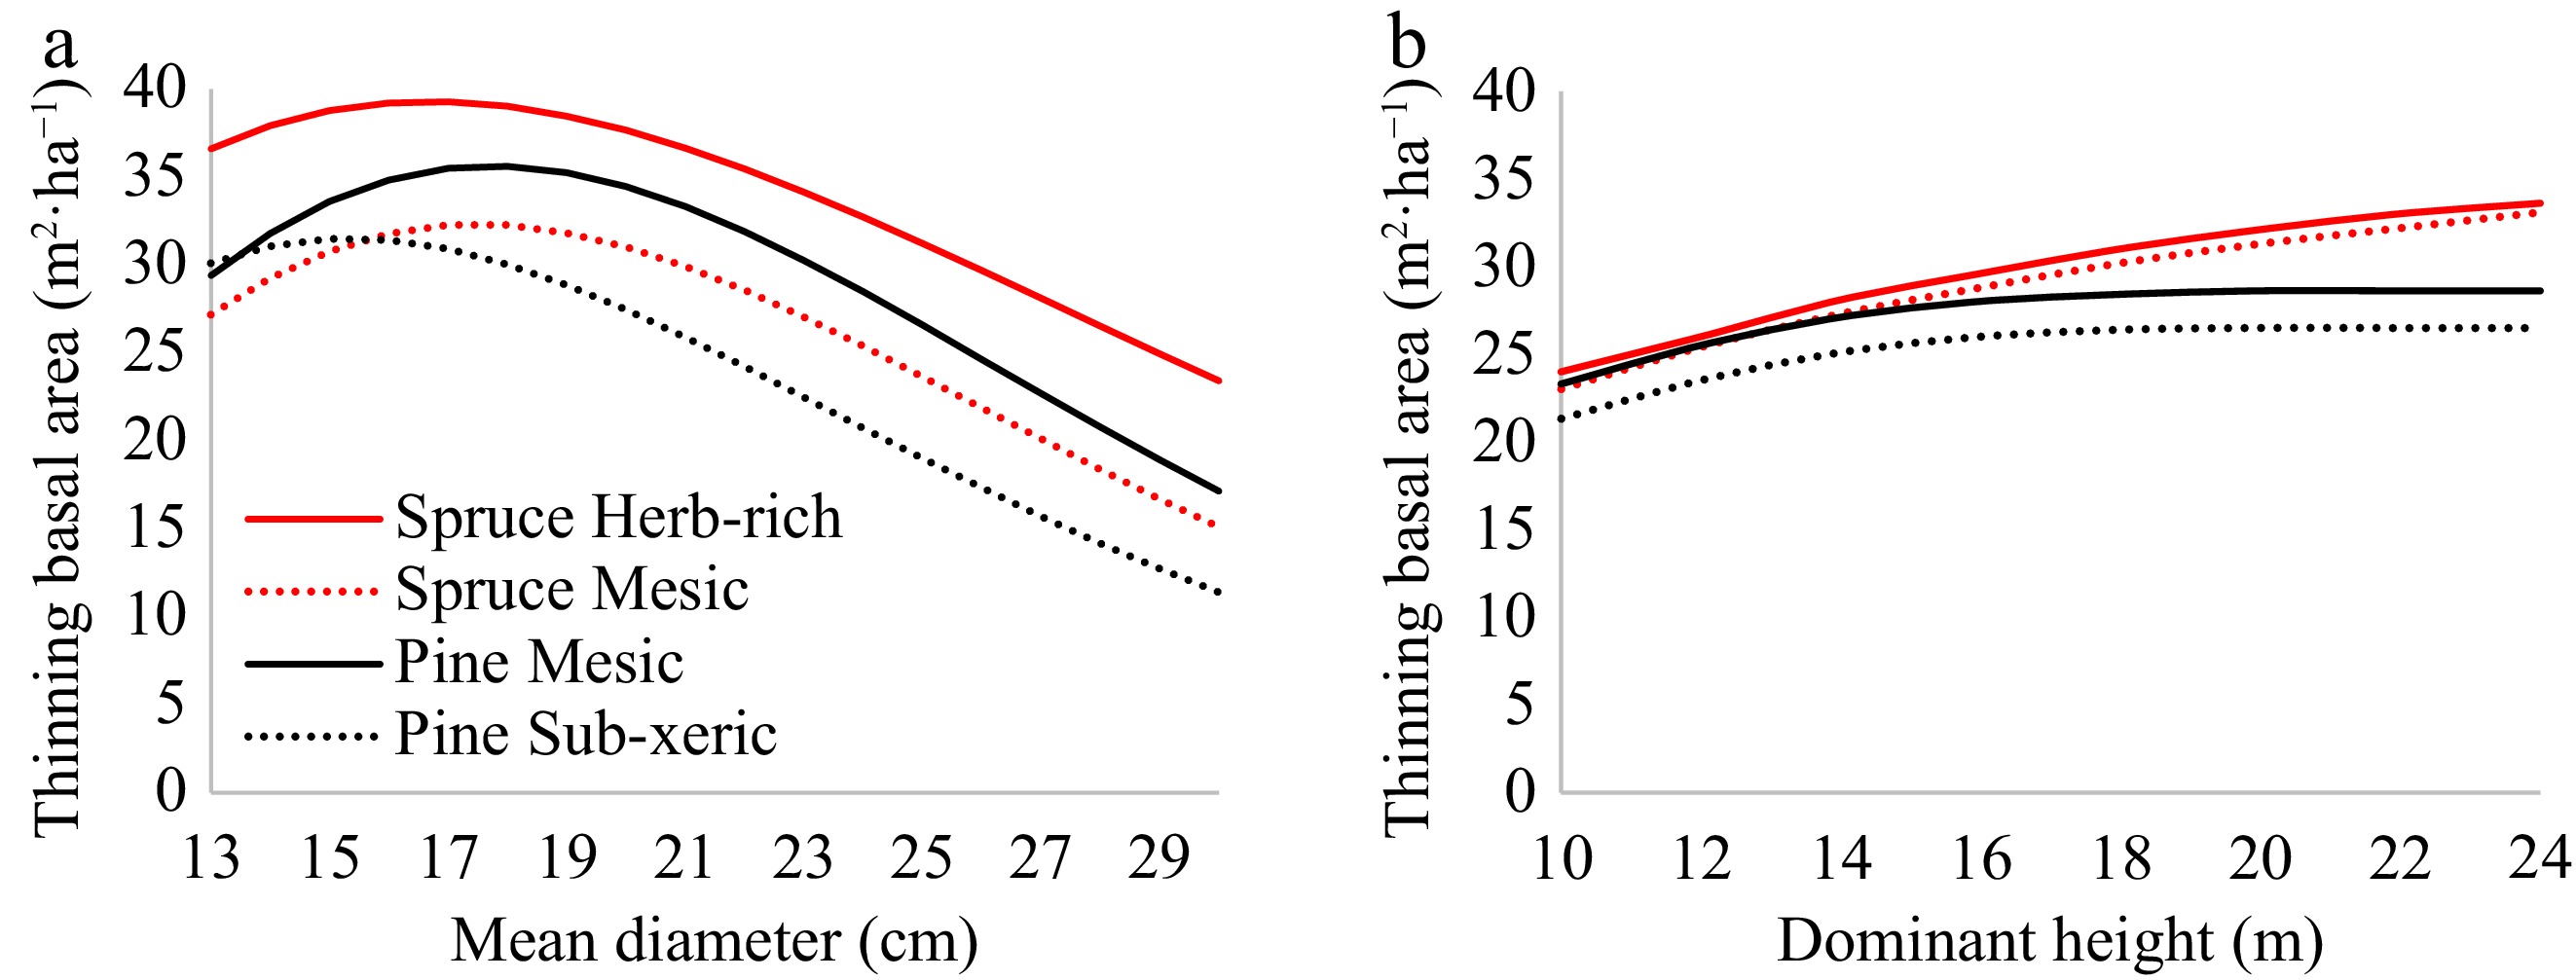
Figure 7.
(a) Optimal thinning basal area of pine and spruce stands on different sites when the roadside price is 75 €·m−3 for sawlog and 42 €·m−3 for pulpwood. (b) The currently recommended thinning basal area in low-thinning management for the same stand types.
The mean DBH at which thinning from below should be changed to thinning from above was 15–16 cm for pine, 10.16 cm for herb-rich spruce, and 13.05 cm for mesic spruce. The results for pine indicate that thinning should be done from above when a part of the trees reaches the sawlog size, i.e., give at least one sawlog. Considering that the thinning basal areas are high for young stands, the small switching diameters for spruce imply that thinning from below is rarely optimal in spruce stands.
Figure 8 shows that repeated optimization runs produced somewhat different guidelines, but the main features of the guidelines remained the same. Despite the variation, the average NPV obtained for the stands under 100 timber price scenarios varied only slightly. The standard deviation of the NPVs, calculated from repeated optimizations for mesic pine, was only 1.09% of the average NPV among the optimizations.
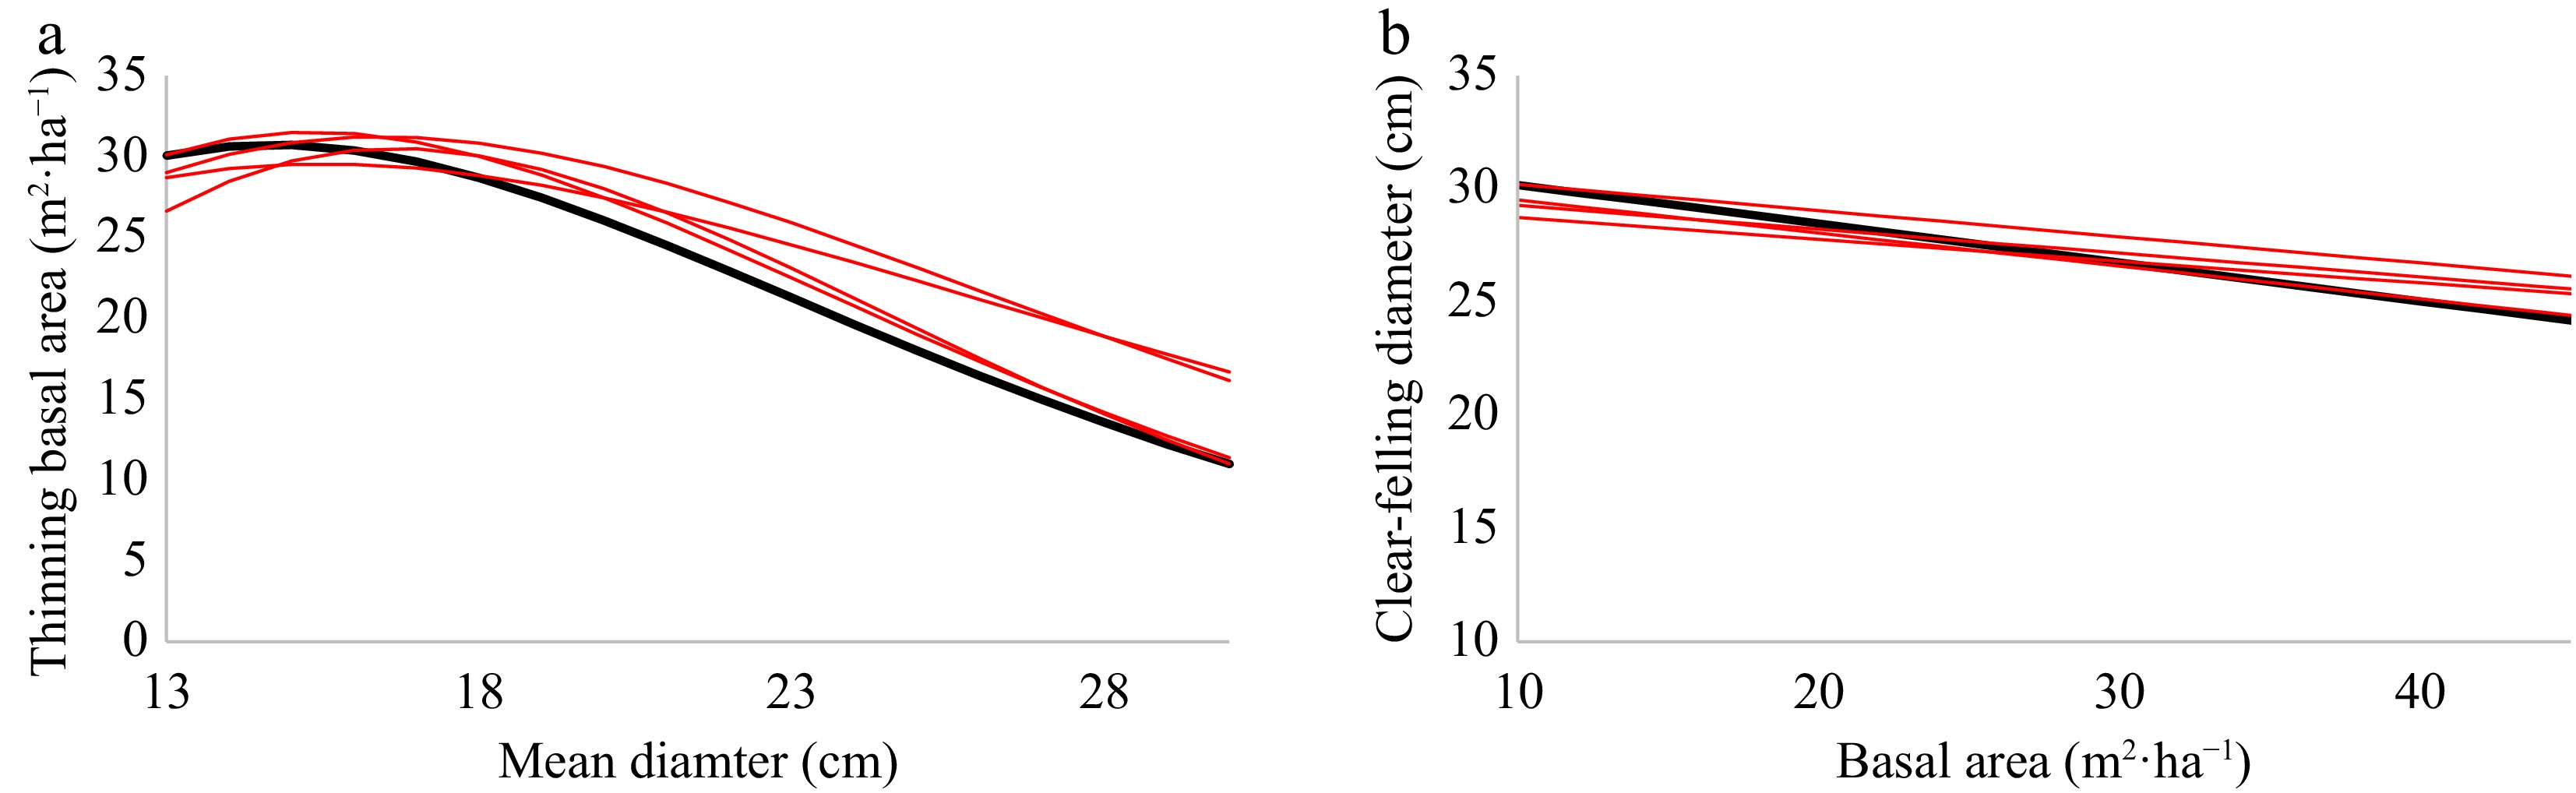
Figure 8.
Variation in (a) thinning basal area and (b) clear-felling diameter in sub-xeric pine in five optimizations when the roadside price is 75 €·m−3 for sawlog and 42 €·m−3 for pulpwood. The thick black lines are the baseline results shown in Figs. 6a and 7a. The y-axis of (b) is cut at 10 cm for better visibility.
Figure 9 shows examples of the timing of cuttings when the management of the same stand is simulated under five different timber price scenarios, and cuttings are based on the optimized guidelines of this study. The first thinning of the red scenario is later than suggested by the guideline (for average timber prices). Most probably, the timber price of this scenario is low when the basal area hits the guideline, and postponing the thinning is therefore optimal. In the grey scenario, timber prices are probably good when the second thinning is actual, and the stand is therefore thinned below the guideline. The clear-felling diameters vary widely across different timber price scenarios, from 28 to 37 cm. In the red and blue scenarios, the sawlog price is most probably exceptionally good when the mean DBH is around 28, making it optimal to clear-fell the stand. The yellow scenario is an example where it is worthwhile, after the last thinning, to wait a long time for a good timber price.
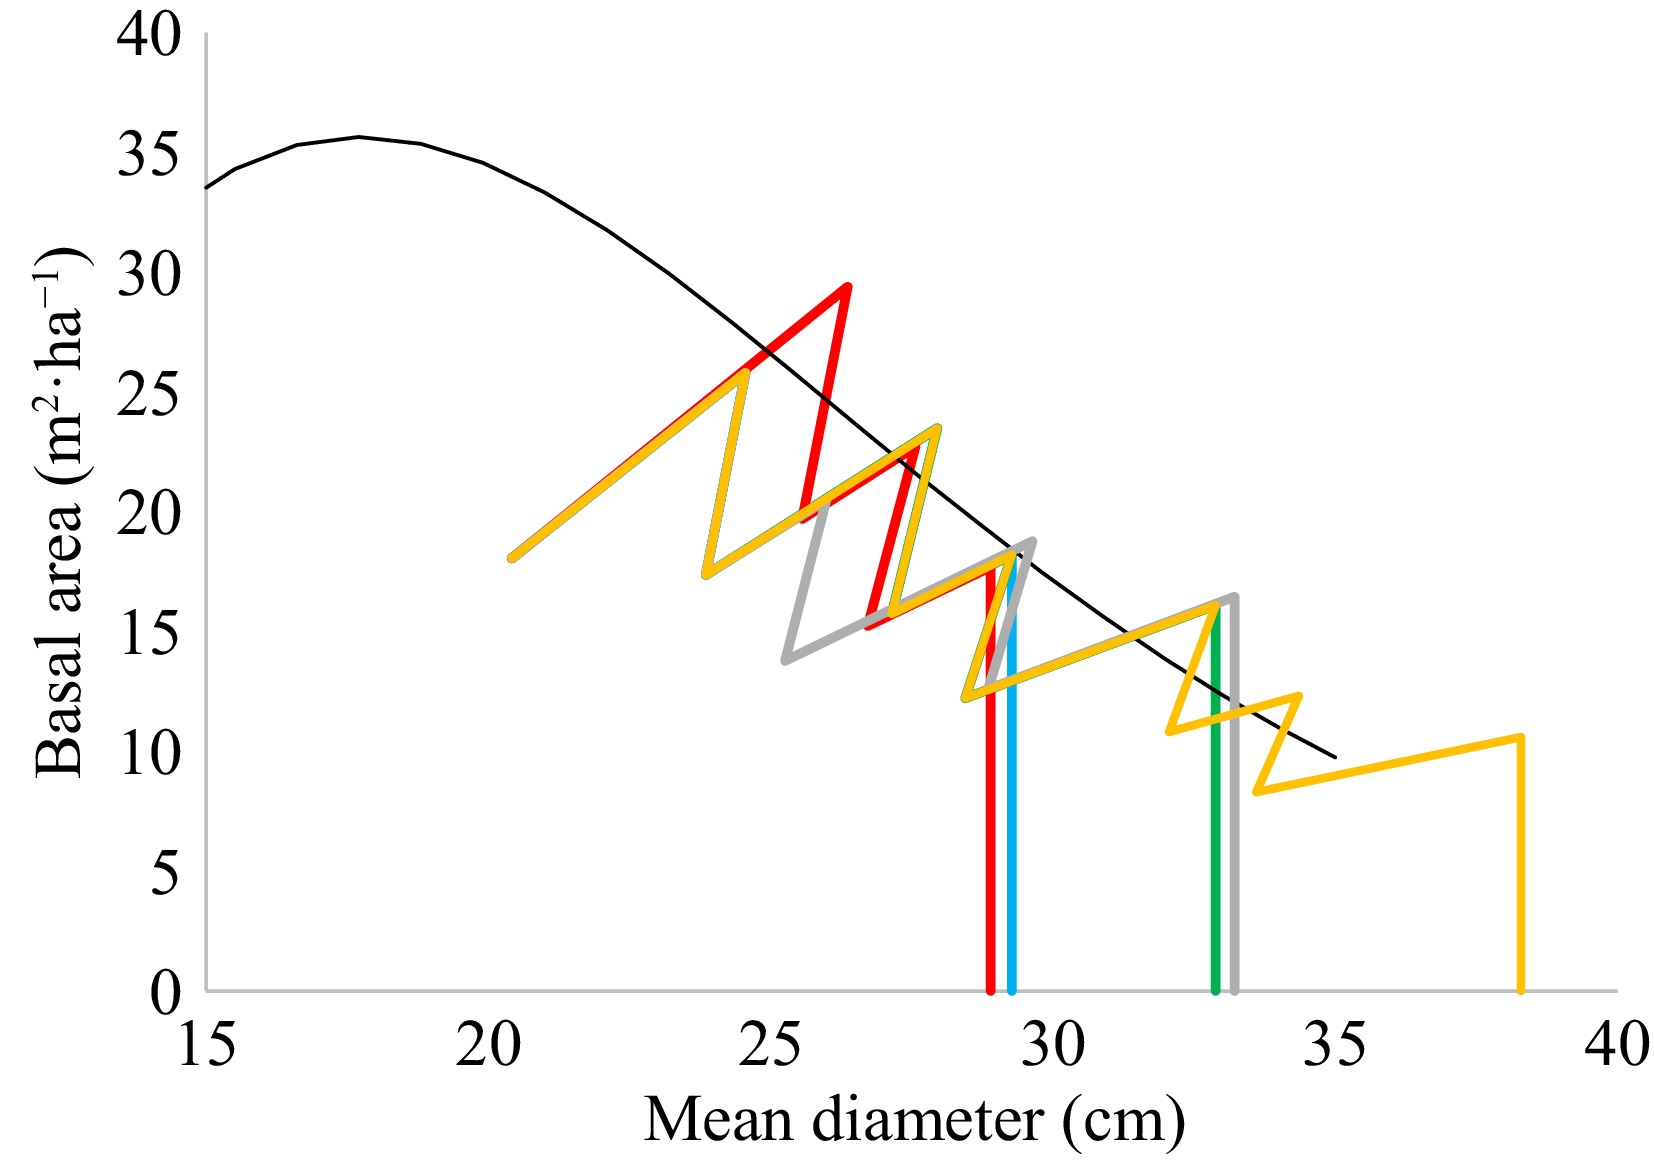
Figure 9.
Optimal cutting schedule of a mesic pine stand under five different timber price scenarios (red, blue, green, grey, and yellow lines). The thin black line is the thinning basal area when the roadside price is 75 €·m−3 for sawlogs and 42 €·m−3 for pulpwood.
How smart are the new guidelines?
-
The management of the plots under the same 100 timber price scenarios was simulated according to the current official management recommendations for clear-felling diameter, thinning from below, and thinning from above. Then, the mean NPV was calculated over all scenarios and plots. The lowest NPV was obtained for the current recommendations for thinning from below. In Fig. 10, the NPV of this guideline is indicated as 100 (%), and the results of the other guidelines are expressed relative to that.
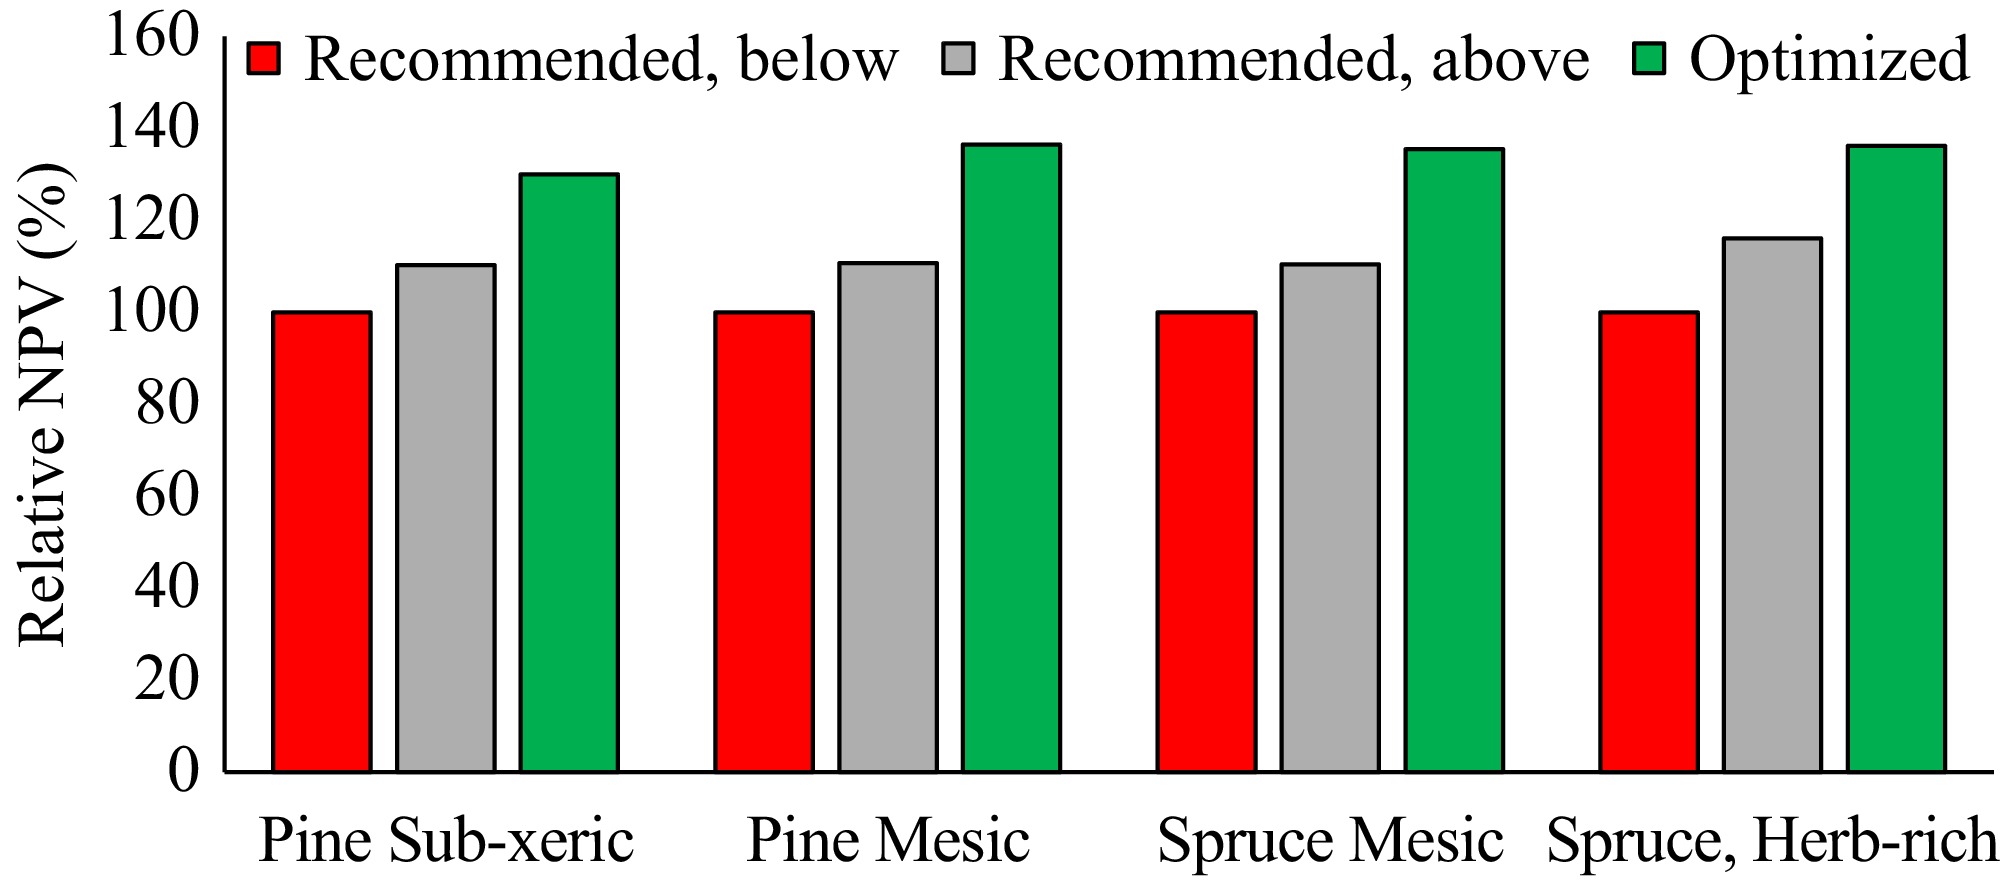
Figure 10.
Relative net present values (NPV) when cuttings are simulated according to the current recommendations for thinning from below (red), thinning from above (grey), or the optimized guidelines of this study (green). The results are based on simulations for 43–60 plots under 100 different timber price scenarios.
The average NPV improved by 30%–36% when the recommendations for thinning from below were replaced by the guidelines developed in this study (Fig. 10). The improvement was 17%–23% when the guidelines were compared to the currently recommended guidelines for thinning from above. The improvements were of the same magnitude for both species and all sites. Repeated optimizations for sub-xeric pine revealed that these conclusions are quite robust. In five repeated optimizations, the improvement ranged from 29% to 32% for thinning from below, and from 16% to 20% for thinning from above.
-
Following the management guidelines developed in this study would increase the landowner's economic profit by 30%–36% compared to the current recommendations for thinning from below. This is a substantial improvement. However, it cannot be concluded that every landowner could increase his/her profit by this amount. This is because the landowners do not necessarily follow the current recommendations, and not all landowners use thinning from below.
The major benefit of the guidelines in this study is that they show the optimal way to adapt to fluctuating timber prices. Because many landowners already adapt their timber sales to price fluctuations, the benefits to these landowners would be smaller than calculated in this study, which assumed that management guidelines are followed strictly. Previous studies suggest that adaptation to timber prices increases the landowner's profit by about 20%[7–9,25]. As the margin for the currently recommended low-thinning forestry was larger than 20%, it may be concluded that the new guidelines also offer benefits other than advising the optimal way to react to timber price variations.
The fact that landowners already adjust their timber sales to price variation cannot be used as an excuse to ignore the effect of timber price on optimal management in the guidelines. Without clear, science-based guidelines, it is difficult for the landowner to make cutting decisions in the right way. For example, an increase in timber prices may lead to a clear-felling decision even when the optimal decision would be thinning from above. Clear-felling prevents the landowner from selling timber from the same stand for decades; i.e., the landowner cannot benefit from future price peaks. Using thinning from above instead of clear-felling is a way to improve economic resilience and decrease economic risk, because it allows substantial incomes without eliminating the possibilities to get incomes soon again if the economic situation becomes favorable for timber sales.
Timber price variation was the only source of uncertainty considered in this study. Timber prices have always varied cyclically[23], and this uncertainty is always present in forestry decision-making. The other sources of uncertainty, such as bark beetle outbreaks and windthrows, are more erratic, making it difficult to consider them in quantitative management optimization. In addition, these damages often depend on the management of adjacent stands and not so much on the stand itself.
The thinning guidelines of this study advise keeping young stands dense, as compared to the current official recommendation. Thinning from above should commence in pine stands when the basal-area-weighted mean diameter is 15–16 cm. In practice, this means that thinning should be from above when the largest trees of the stand have reached the sawlog size. The result is not surprising given the substantially higher unit price and the lower harvesting cost of sawlog-sized trees compared to pulpwood-sized trees[10].
In spruce, the thinning type should be switched from below to above earlier. However, because the thinning basal area is high for young stands, the guidelines suggest that young stands are rarely thinned. Thinning from below should be done only in very dense young stands. In other cases, it is optimal to wait until sawlog-sized trees can be harvested in thinning from above. The result that the thinning type should be changed during the rotation is not new. For example, Hyytiäinen et al.[5] found that the first commercial thinning of a spruce stand should be thinning from below, but later thinnings should be from above. In pine, the first thinning was uniform (the same harvest intensity in all diameter classes), and subsequent thinnings were from above.
Not all landowners follow the official management guidelines. Consequently, all stand densities, cutting types, and clear-felling diameters suggested by the optimized guidelines are commonly encountered in Finnish forests. The dataset behind the growth and survival models used in this study is large, comprising 9,599 plots and 72,280 tree-level growth measurements[18]. The dataset represents all forest structures found in Finnish forests. The performance of the growth models has been tested in large independent validation datasets that include 2,721 experimental plots and 294,808 tree-level growth measurements[26]. The experimental plots represented even-aged, uneven-aged, two-storied, and non-managed forests. The model used in this study was able to produce unbiased growth estimates for most trees and plots.
From the economic perspective, the shape of the curves for thinning basal area is not surprising, and similar results have been obtained in earlier studies[2–4,27]. The opportunity cost of young, pulpwood-sized trees is low. On the other hand, young trees grow fast, and the trees pass value thresholds when one or more sawlogs can be obtained from their stems. As a result, the relative value increment of young trees is high even if the stand is dense[28]. Later, when the trees get larger and more valuable, their opportunity cost increases and the value jumps cease. Therefore, the relative value increment of the trees decreases, and it becomes necessary to decrease competition by thinning. Thinning from above is the logical cutting because it decreases the opportunity cost relatively more than the value increment. Therefore, the relative value increment of the stand increases, making it profitable to continue growing.
Another positive influence of dense young stands is their favorable effect on stem shape because a high stand density decreases diameter increment more than height increment. A slender stem shape increases the sawlog yield, as shown in this study and Lappi's[11] study. Slow diameter growth at a young age also increases wood density[29] and may decrease the number of knots in the wood[30]. Consequently, both the strength and visual quality of sawn wood improve. As these effects were not modeled in this study, the benefits of avoiding strong thinning in young stands may be even more substantial than calculated in this study. However, the main benefit would accrue to the sawmill, as the quality and value of the sawn wood are not fully reflected in the sawlog price.
The optimal clear-felling diameters obtained in this study are larger than the current recommendations, especially for spruce. The reason might be that this study estimated the likely sawlog 'price premiums' of large and slender trees, making it optimal to grow large and tall trees. The effect of sawlog quality on optimal management has also been considered in previous studies. In Hyytiäinen et al.[5], both the clear-felling diameter and the rotation length increased in pine forests when the effect of sawlog quality on timber price was considered.
Even if timber buyers' way of calculating the price offer may be clandestine[11], it is important to estimate the likely price level plausibly. Otherwise, optimization calculations would lead to biased recommendations[5]. For example, if the effect of stem diameter and tapering on sawn wood yields and sawlog price is ignored, optimization may lead to rotation lengths shorter than optimal, and perhaps also non-optimal thinning at a young age.
When predicting the proportion of sawlogs in the commercial stem volume, it was assumed that crosscutting was done according to the preferences of the wood buyers. This is a reasonable assumption because, in over 90% of cases, landowners sell standing trees, and wood buyers decide the parameters of crosscutting. If pulpwood generates more profit than sawlogs, it is optimal to minimize sawlog yield and maximize pulpwood yield[11]. This is especially true for small-sized sawlogs, obtained from small trees or upper parts of tall trees, because the sawn wood obtained from these logs is often of low quality, and the sawn wood yield is low. Suitable ways for the landowners to avoid 'crosscutting losses' are to avoid selling small-sized trees. Since crosscutting losses were considered in this study, they were a partial reason for the conclusions that young stands should be rarely thinned, thinning should be from above, and trees should be left to grow larger than currently recommended.
-
The developed management guidelines for southern Finland advise keeping young even-aged stands of pine and spruce denser than currently recommended if the aim is to maximize the net present value with a 3% discount rate. On the contrary, the optimal thinning basal areas are lower than recommended for more mature stands. Thinning from above should be used, except for young stands where thinning from below is advised. The clear-felling diameter depends on stand density and timber price. In most cases, clear-felling of spruce stands should be done at a larger mean tree diameter than currently recommended. Under timber price fluctuations, the guidelines developed in this study would result in 17%–36% higher net present values than the current recommendations for even-aged pine and spruce stands, depending on tree species and site fertility.
Not applicable.
-
accompanies this paper online at: https://doi.org/10.48130/smartfor-0026-0016.
-
The author confirms sole responsibility for the following: study conception and design, data collection, analysis and interpretation of results, and manuscript preparation.
-
The datasets are available from the author upon reasonable request.
-
The author declares that he has no known competing financial interests or personal relationships that could have appeared to influence the work reported in this paper.
- Supplementary Table S1 Statistics on the sample plots for which the management was optimized.
- Supplementary Table S2 Statistics on the level data used to optimize cross-cutting.
- Supplementary Text S1 Equations for bare land value.
- Copyright: © 2026 by the author(s). Published by Maximum Academic Press, Fayetteville, GA. This article is an open access article distributed under Creative Commons Attribution License (CC BY 4.0), visit https://creativecommons.org/licenses/by/4.0/.
-
About this article
Cite this article
Pukkala T. 2026. How smart are Finland's forest management guidelines in terms of economic profitability? Smart Forestry 1: e019 doi: 10.48130/smartfor-0026-0016 

How smart are Finland's forest management guidelines in terms of economic profitability?
- Received: 14 May 2026
- Revised: 21 September 2026
- Accepted: 24 September 2026
- Published online: 23 October 2026
Abstract: The management guidelines for even-aged Finnish forests specify the basal area at which the stand should be thinned and the mean tree diameter at which it should be clear-felled. The thinning basal area depends on dominant tree height. The guidelines ignore the effect of timber price on cutting recommendations, even though timber price strongly influences the optimal timing of cuttings. Under fluctuating timber prices, management optimization should focus on adapting cutting decisions to price variations. This study optimized guidelines for adaptive clear-felling and thinning in pine- and spruce-dominated stands in southern Finland when the management objective is economic profitability, described by net present value calculated with a 3% discount rate. Before optimization, a new model for the proportion of sawlogs was developed, based on optimal crosscutting for timber buyers. In addition, the proportion of sawn wood in the sawlog volume was modeled as a function of diameter at breast height and tree height. The model showed that increasing tree size and slenderness increases the proportion of sawn wood in sawlogs. The modeled sawn wood yield was used to calculate a sawlog price correction. The new guidelines advised clear-felling spruce stands at a greater mean tree diameter than currently recommended. The thinning basal area was higher than recommended for young stands and lower than recommended for more mature stands. Under timber price fluctuations, the guidelines developed in this study resulted in 17%–36% higher net present values than the current recommendations for even-aged pine and spruce stands, depending on tree species and site fertility.
-
Key words:
- Adaptive management;
- Management optimization;
- Timber price;
- Wood quality