


-
Peach (Prunus persica) is an important temperate stone fruit native to China and grown worldwide[1]. Peach cultivars are generally localized and used in limited production areas with similar climates largely due to chilling requirements and other adaptive factors. Based on fruit ripening times, peach cultivars used in a production area can be classified roughly into early, mid, and late seasons, or classified more finely[2]. Cultivars from different maturity groups may differ in the fruit ripening process, tree growth habits, and orchard management regimes[3,4]. Peach fruit is climacteric and has a small harvest window and short storage/shelf life for each cultivar. As a result, commercial fresh market peach production in an area usually relies on a series of cultivars with different harvest times and chilling requirements to ensure season-long supplies; thus, continuous cultivar releases from breeding programs are highly demanded in main production areas[2,5] or for new markets[6,7]. As the valued and consumed part, peach fruit is usually evaluated annually in variety trial blocks to augment data on performance and facilitate decisions on releases. The evaluation is to ensure that the fruit of released cultivars possesses desired physiochemical characteristics and no apparent drawbacks.
Characteristics of ripening peach fruit vary by genotypes, which are influenced by on-tree and post-harvest factors and can change rapidly and concomitantly with the expression of involved genes and the production of ethylene[3,4,8−11]. The characteristics may be external or internal, physiological or phytochemical, and transcriptional or metabolic, such as skin and flesh colors, size, weight, firmness, soluble solids content (SSC), titratable acidity (TA), volatiles, and so on. Peach fruit ripening process, flesh firmness and quality, alcohol dehydrogenase gene expression, and ethanol production were related to harvest time and postharvest treatments with ultra-low oxygen and high dioxide[3]. Size, chelate-soluble and alkaline-soluble pectin in the cell walls, and intrinsic viscosity and softening-involved enzyme activities differed between melting and non-melting flesh peach fruit in the late ripening stage[4]. According to a high-density rootstock trial on a low-chill, early-ripening peach cultivar, rootstocks impacted significantly on yield, some minerals, sugars, and acids of ripening fruit, but little on fruit weight, skin pigmentation, shape, or SSC[8]. In a study to monitor nondestructively the on-tree flesh softening rate of peach fruit using the absorbance index of the skin, the index decreased linearly at a higher rate about two weeks before harvest, altered dramatically and coincided with the 'color break' of the skin, but SSC changed insignificantly[9]. A high-performance liquid chromatography and gas chromatography-mass spectrometry study was conducted to characterize comprehensive sugars, organic acids, and aroma volatiles in peach. The study revealed that not sugars or acids, but aroma volatiles and flavor compounds could distinguish the surveyed peaches, suggesting that sugars and acids provide the basic flavors, but aroma volatiles and flavor compounds determine unique flavors among different types of peaches[10]. Another study revealed a wide range of color, sugar, and acid composition, SSC/TA ratio, firmness, and L/a/b color space among tested peach cultivars. Soluble sugars included sucrose (54%), fructose (31%), and glucose (15%). In all the cultivars, the dominant malic acid accounted for 50% to 60%, and the remaining was about an equal amount of citric and quinic acid. Differences were also found between normal-acid and low-acid cultivars[11]. All the results may be useful to understand factors and changes in peach fruit on-tree and post-harvest ripening process, determine characteristics/compounds related to fruit eating quality and consumers' preferences, and provide guidance on harvest timing, release decision, and future breeding direction.
The peach breeding program at the USDA-ARS Southeastern Fruit and Tree Nut Research Laboratory in Byron, GA has served the high-chill production area in the southeastern states since 1937[5]. Over the past several decades, tens of thousands of hybrids have been grown and evaluated in seedling blocks, hundreds of advanced selections chosen, propagated and assessed in variety blocks, and limited promising candidates further tested in different trial locations, leading to the release of several dozen peach scion cultivars[12−19]. Most recent cultivars released from this program produce fruit with similar attractive high-coverage blush, yellow melting freestone flesh, palatable acidity, and good firmness for handling, and still dominate the production profile in the southeastern area. As part of our conventional breeding effort, we established a trial to collect data on fruit characteristics of advanced peach selections from the Byron program. In this report, we analyzed the data and revealed the variability and regularity of fruit characteristics of ripening peaches of different seasons, harvests, and trial locations.
-
Four cultivars and 30 advanced selections in different maturity seasons were used in this study (Supplementary Table S1). Trees were grafted on 'Guardian' rootstock and planted randomly in three trial orchards (TO1-3), four to six trees of each accession together in each orchard to facilitate management and evaluation. TO1 was a variety block in SEFTNRL, Byron, GA, where advanced selections and standard cultivars were planted for testing and annually evaluated. TO2 and TO3 were two commercial trial blocks in Fort Valley, GA, USA where growers planted and managed the tested peach trees. Appropriate standard orchard managements were applied independently in three orchards, including weed, pest, and fungal disease control, and horticultural operations. Differences among the three trial orchards were unidentified, but generally, overall management in the two commercial orchards was presumably more robust and guide-compliant than that in the research orchard. These selections and cultivars were arbitrarily divided into four maturity season groups (MG1-4), approximately in the harvest windows of cultivars Gala, Harvester, Cresthaven, and O'Henry, respectively.
Fruit sampling, measuring, and preparation procedures
-
Twenty ripening, healthy, relatively uniform fruits were weekly harvested randomly across the tree canopy during the time that a yellow background appeared on the fruit surface and the texture remained firm and handleable. Most selections at a TO were expected to have two weekly harvests (WH), first on a day in week 1 (WH1) when clear yellow background and full blush appeared on fruit, and second after 6−8 d (WH2). Due to weather, labor, and time constraints, the two harvests might be delayed on the same peaches in different TO to WH2 and WH3, or WH3 and WH4, which were used to reflect the delayed harvest time. In rare cases, a few peaches ended with 3 or 4 weekly harvests, but across different TO. Fruits from each harvest were transported to the lab within 2 h, and were not washed or treated before being measured. Five of the fruits from each selection/cultivar were labeled for rating, measuring, and recording fruit characteristics individually, as previously described[20]. Non-destructive measures were always performed before destructive ones. The blush coverage was rated on the scale of 0−9 (0 = no blush, to 9 = almost full blush). Fruit weight (g) was measured using a SFL501 scale (ThermoFisher Scientific, Waltham, MA, USA). Circumference-based equatorial (latitudinal) and back-suture-line polar (longitudinal) diameter (cm) of each fruit was recorded using a circular measuring tape (Cranston Machinery Co., Oak Grove, OR, USA). Given the strong correlation between the two diameters, the average of the two diameters from each fruit was used in the subsequent statistical analysis. Fruit firmness (kg force) was measured on a cheek side using Wagner Fruit Tester FT-20 with the tip FT-516 (Wagner Instruments, Greenwich, CT, USA). Pit was recovered from longitudinally cut halves in the back-suture line, cleaned free of flesh, and weighed (g) using the same SFL501 scale. The juice of the halves was squeezed and collected using a Jupiter Commercial Juice Press (Focus Products Group LLC, Lincolnshire, IL, USA) for measurement of volume (mL), SSC (°Brix), and TA (g/100 mL or % in the weight and volume ratio) and pH values using a measuring cylinder, a PAL-1 Refractometer (ATAGO, Bellevue, WA, USA), and a HI84532 Mini Titrator (Hanna Instruments, Woonsocket, RI, USA), respectively. So, each juice volume was taken from a whole fruit. TA was calculated and expressed as g/100 mL or percentage (%) of the predominant acid, malic acid, in peach juice, according to the titrator's manual. Values of the Hunter L, a and b color scale were measured using Chroma Meter CR-400 (Konica Minolta, Inc., Japan) for fruit blush (at a large red spot), ground (at a yellow spot), back and suture (near the equatorial line), shoulder and tip (near the stem and apex), flesh1 and 2 (at area 1 and 2), pit (at one cheek side), and the pit hole, respectively. The Hunter L, a and b color space is usually visualized by the L axis (scale), representing the lightness from pure black (L = 0) to pure white (L = 100); a, the color of green (−a, negative values) and red (+a, positive); and b, the color of blue (−b) and yellow (+b), respectively.
Statistical analysis
-
We transformed the numerical blush ratings using the function
$ \mathrm{log}\dfrac{x/10}{1-x/10} $ We estimated the marginal means by genotype, by TO, by WH, by WH within genotype, and by WH within TO. In addition, we used linear contrasts of the genotype marginal means to generate estimates for each MG: overall, separately by TO, and separately by WH. Because WH4 was not represented across all MG and TO, we excluded WH4 from our estimation of the genotype, MG, and TO means. The Kenward-Roger method was used to approximate degrees of freedom for calculating 95% confidence intervals and assessing the significance of test statistics. We took pairwise contrasts between all pairs of genotypes, WH, TO, and MG, and calculated the t-statistic for each comparison. The Sidak adjustment was used to correct the p-values for multiple comparisons, maintaining α = 0.05. All means and confidence interval endpoints were back-transformed to their original scales for presentation.
Lastly, we calculated Pearson correlations between each pair of variables. Statistical analysis was done in R software v4.4.3[21], including the packages lme4 v1.1-36[22], emmeans v1.10.7[23], and performance v0.13.0[24]. Statistical functions in Microsoft Excel were also used to calculate regression and the coefficient of determination (R-squared value) between fruit weight and other characteristics, fitting linear and logarithmic regressions where appropriate.
-
Fruit characteristics varied greatly and showed different distribution patterns among the TO, MG, and WH, respectively. For example, most characteristics had an approximately normal distribution, except that SSC/TA ratio, pH, and blush rating (Fig. 1). SSC/TA ratio and pH were skewed towards the smaller ranges for typical acidity in most selections, and blush rating towards 8−9 with high blush coverage on most selections. There are some potentially meaningful differences between groups. In general, later-maturing MG3 and MG4 tended to have higher fruit weights, bigger sizes, and higher SSC, and MG4 was the highest (Fig. 1), compared to the two early groups, MG2 and MG1, which tended to have higher pH values and lower SSC. As expected, most peaches selected for testing were acid type (Fig. 1g & i), and a few were subacid and acid-less types. Intriguingly, the distributions of TA and pH values had two distinct peaks, corresponding to acid type and subacid/acid-less type, although additional refinement using the tasted flavor of each genotype may be needed.
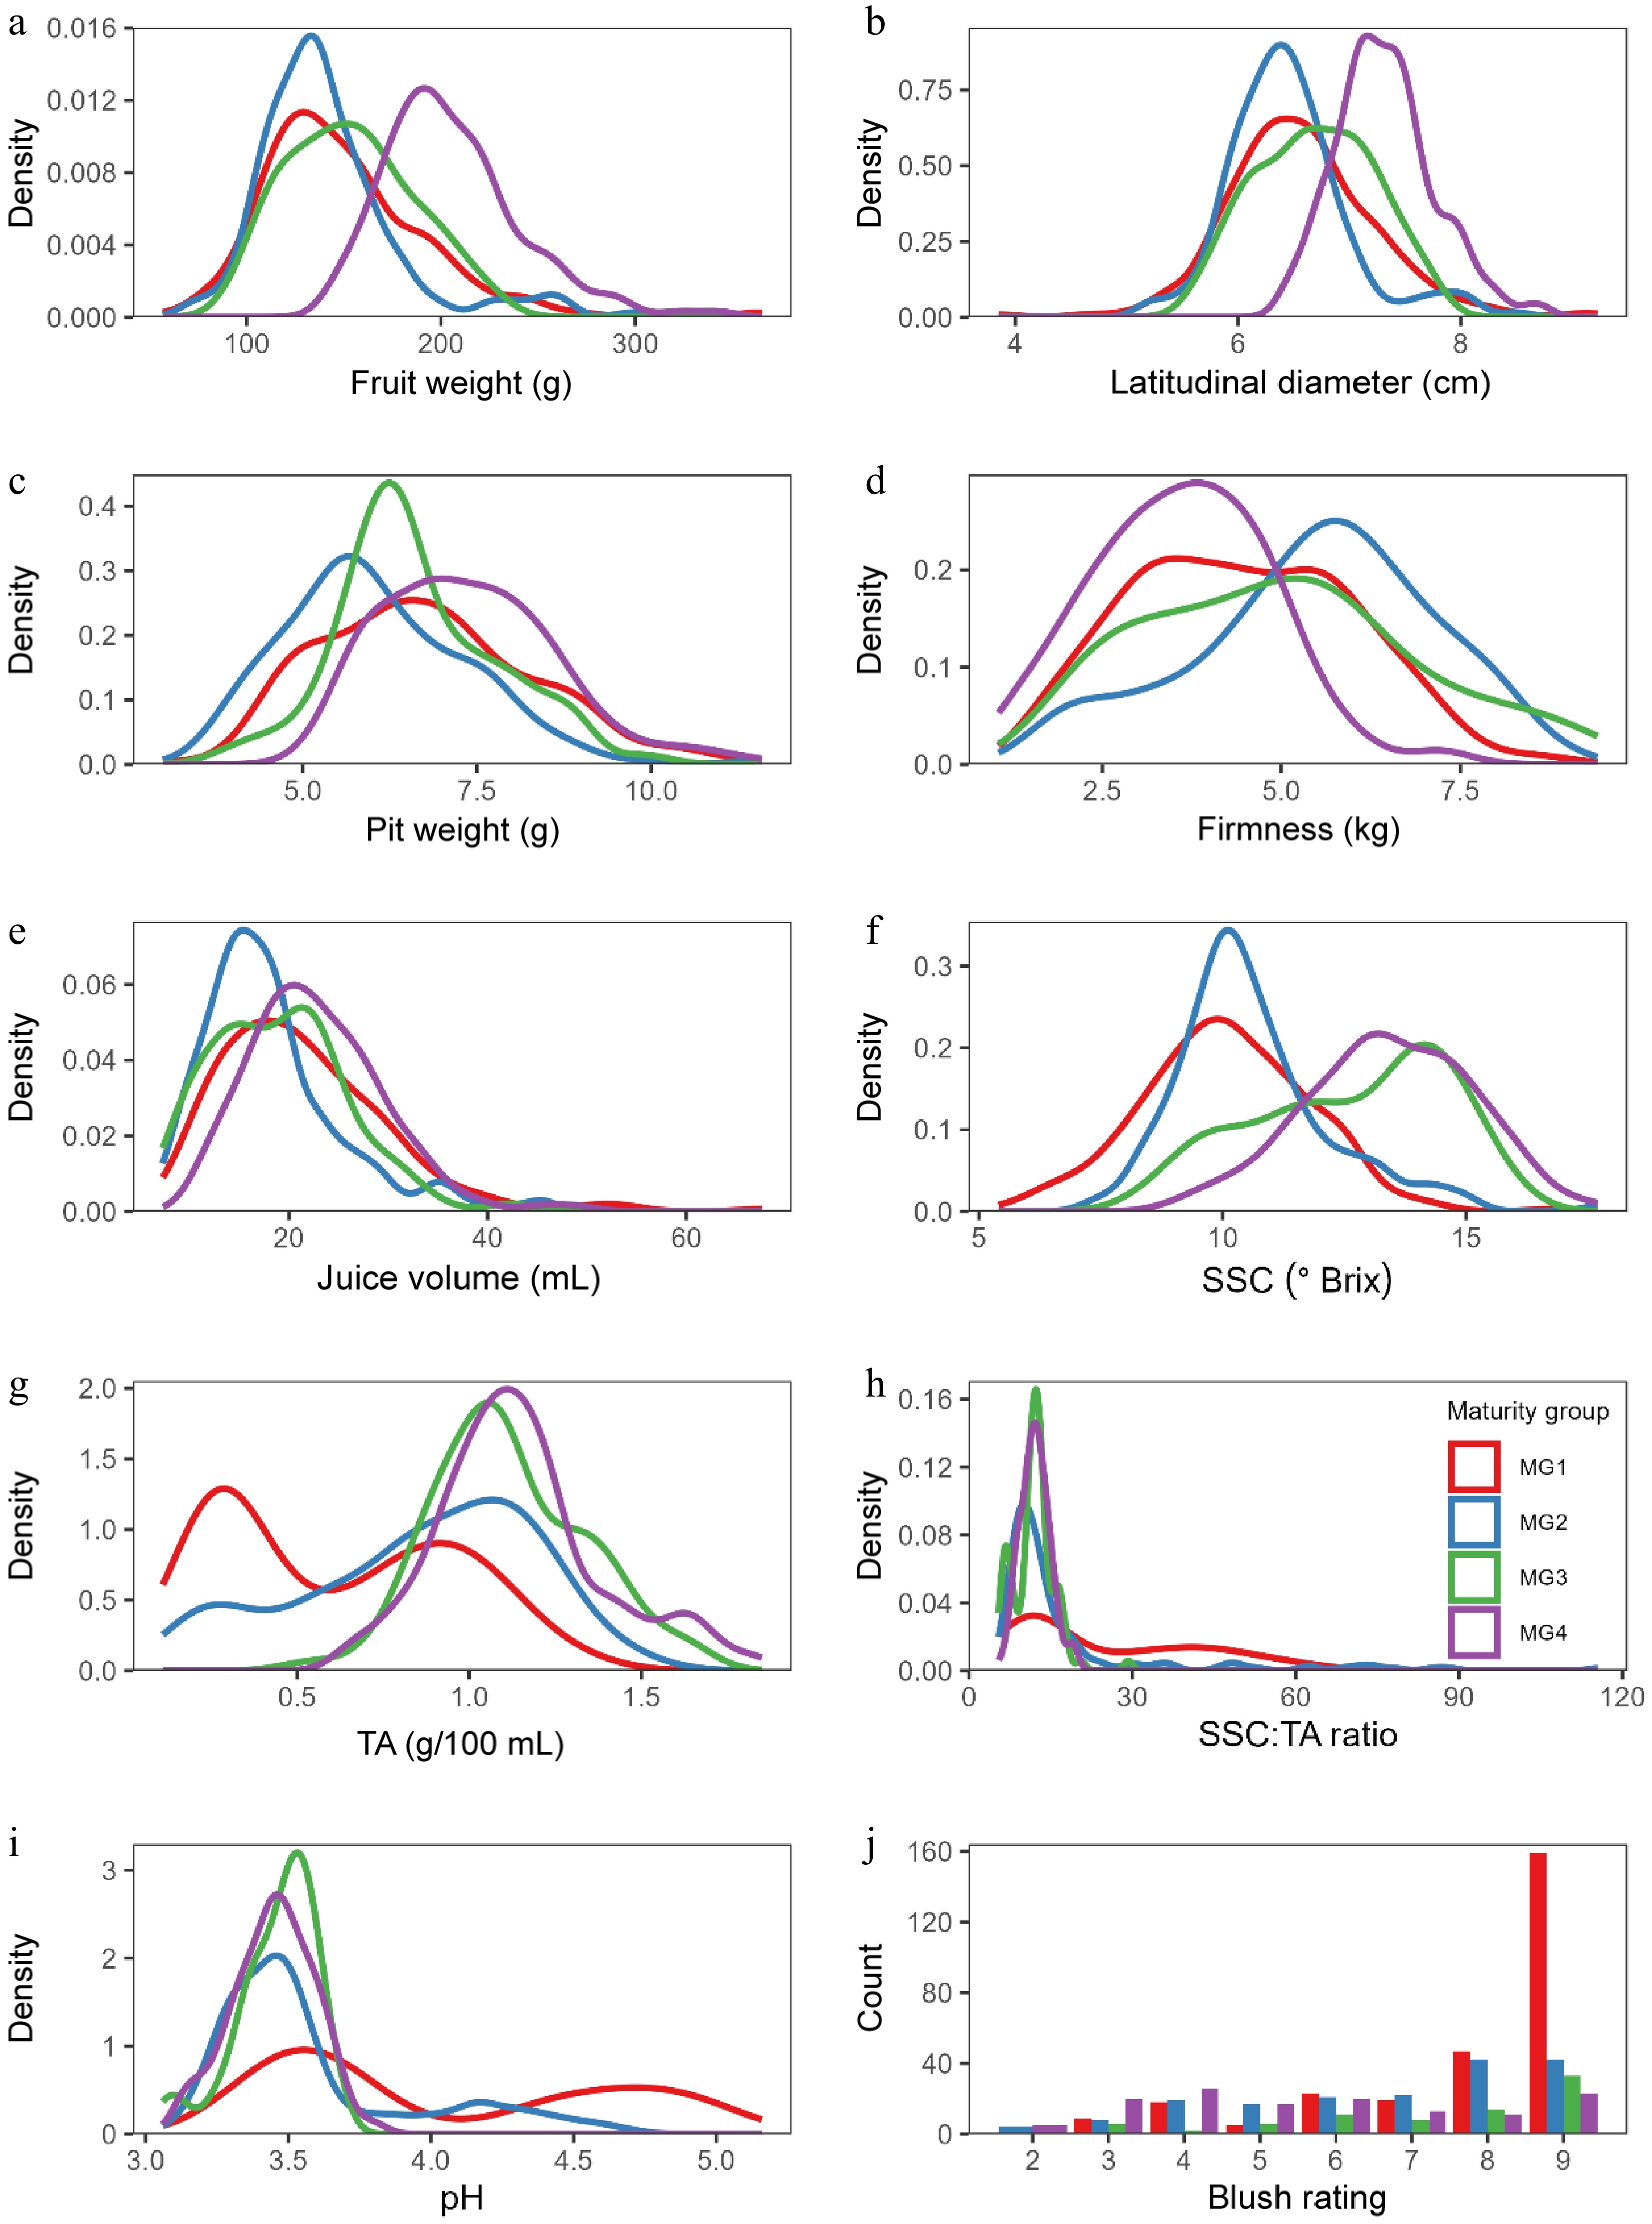
Figure 1.
(a)−(i) Distribution of fruit characteristics by maturity season groups MG1−4, with smoothed kernel density plots for continuous traits, and (j) bar plot for the discrete blush rating score trait. SSC = soluble solids content, TA = titratable acidity.
Variability of ripening peaches from different MG, TO, and WH
-
Many fruit characteristics differed significantly among the three TO, four MG, and four WH, respectively (Table 1). Differences in fruit and flesh weight, average diameter, firmness, juice volume, SSC, and SSC/TA ratio were statistically significant between the three TO, suggesting orchard management and location were important factors for the sizing and development of other fruit characteristics. Fruit from the two commercial trials TO2 and TO3 were substantially larger than those from the variety block TO1 in the Byron research station, likely also due to overall better commercial management and other unknown factors. Across all genotypes, fruit weight and SSC generally increased from early to late maturity seasons (Fig. 2), which would be expected as selections in early maturity season groups generally had shorter growth days than those in later maturity season groups. Fruit diameter, juice volume, flesh weight, and pit weight across genotypes showed similar trends with the maturity seasons (data not shown). Fruit firmness, TA, SSC/TA ratio, and pH among genotypes did not have a clear trend with the maturity seasons. Broadly similar trends of fruit weight and size-related fruit characteristics were also observed across the different WH. The fruit characteristics data of ripening peaches from different orchards, seasons, and harvests could be valuable for comparison with future trials.
Table 1. Means, 95% confidence intervals, and letters of statistical significance of peach fruit characteristicsz.
Fruit weight (g) Pit weight (g) Flesh weight
(g)Average
diameter (cm)Firmness (kg) Juice volume (mL) SSC (°Brix) TA (%) SSC/TA ratio pH Blush rating
(0−9)TO1 144 (141, 148)a 6.62 (6.42, 6.82)ab 138 (135, 142)a 6.53 (6.46, 6.60)a 4.40 (4.14, 4.65)a 17.4 (16.7, 18.1)a 11.9 (11.6, 12.3)c 0.77 (0.74, 0.81)b 15.4 (14.8, 16.1)b 3.66 (3.63, 3.69)a 7.1 (6.9, 7.4)a TO2 158 (154, 162)b 6.37 (6.17, 6.57)a 152 (148, 156)b 6.79 (6.72, 6.86)b 4.78 (4.52, 5.03)b 19.2 (18.4, 20.0)b 10.8 (10.5, 11.2)b 1.11 (1.07, 1.16)c 10.1 (9.67, 10.5)a 3.69 (3.66, 3.71)a 7.3 (7.1, 7.5)a TO3 172 (166, 177)c 6.90 (6.66, 7.15)b 164 (158, 170)c 7.02 (6.93, 7.10)c 4.72 (4.41, 5.03)ab 25.4 (24.1, 26.9)c 9.9 (9.6, 10.3)a 0.43 (0.41, 0.47)a 26.4 (24.4, 28.6)c 4.02 (3.99, 4.05)b 8.4 (8.2, 8.6)b MG1 145 (142, 148)b 6.77 (6.63, 6.92)b 138 (135, 142)b 6.53 (6.48, 6.59)b 4.48 (4.28, 4.67)b 20.0 (19.2, 20.7)b 10.0 (9.8, 10.2)a 0.58 (0.55, 0.61)a 25.2 (23.5, 26.8)c 3.98 (3.96, 4.00)c 8.2 (8.1, 8.4)d MG2 139 (135, 142)a 5.99 (5.84, 6.15)a 132 (129, 136)a 6.44 (6.37, 6.51)a 5.46 (5.20, 5.72)c 17.3 (16.5, 18.1)a 10.6 (10.3, 10.9)b 0.82 (0.79, 0.85)b 17.2 (16.4, 18.0)b 3.60 (3.58, 3.63)b 7.1 (6.8, 7.3)b MG3 149 (143, 155)b 6.61 (6.37, 6.85)b 143 (137, 149)b 6.68 (6.58, 6.78)c 5.14 (4.79, 5.48)c 17.7 (16.5, 18.9)a 12.5 (12.1, 12.9)c 1.07 (1.03, 1.12)c 11.6 (11.0, 12.2)a 3.46 (3.42, 3.49)a 7.7 (7.4, 8.0)c MG4 206 (199, 213)c 7.32 (7.07, 7.57)c 199 (191, 206)c 7.34 (7.25, 7.42)d 3.51 (3.22, 3.81)a 23.1 (21.6, 24.5)c 13.4 (13.1, 13.7)d 1.11 (1.06, 1.15)c 12.3 (11.7, 12.9)a 3.46 (3.43, 3.49)a 6.5 (6.2, 6.9)a WH1 147 (144, 150)a 6.77 (6.62, 6.92)c 140 (137, 144)a 6.60 (6.55, 6.66)a 5.13 (4.93, 5.33)b 18.3 (17.6, 18.9)a 10.7 (10.4, 10.9)a 0.91 (0.88, 0.95)b 12.4 (11.9, 12.9)b 3.72 (3.70, 3.74)b 7.1 (6.9, 7.3)a WH2 157 (154, 161)b 6.49 (6.34, 6.63)b 152 (148, 155)b 6.77 (6.71, 6.82)b 4.15 (3.95, 4.34)a 20.0 (19.3, 20.7)b 11.4 (11.2, 11.6)b 0.81 (0.79, 0.84)a 14.4 (14.0, 14.9)c 3.76 (3.74, 3.78)c 7.7 (7.5, 7.9)b WH3 162 (155, 170)b 6.16 (5.89, 6.44)a 155 (147, 163)b 6.85 (6.73, 6.96)b 4.24 (3.86, 4.62)a 19.4 (18.0, 20.9)ab 12.7 (12.3, 13.1)c 0.81 (0.77, 0.86)a 15.4 (14.5, 16.4)c 3.60 (3.56, 3.64)a 7.8 (7.4, 8.1)b WH4 153 (138, 170)ab 5.70 (5.19, 6.25)a 147 (132, 165)ab 6.70 (6.43, 6.97)ab 3.82 (2.90, 4.74)a 19.8 (16.5, 23.8)ab 12.0 (11.1, 13.0)bc 1.10 (0.98, 1.23)c 10.6 (9.27, 12.2)a 3.53 (3.44, 3.62)a 9.0 (8.5, 9.4)c z Statistical analysis was performed among the three trial orchards (TO1−3), four maturity groups (MG1−4) approximately close to the seasons of 'Gala', 'Harvester', 'Cresthaven', and 'O'Henry', and four weekly harvests (WH1−4), respectively, using linear mixed models and Sidak p-value adjustment for multiple comparisons (α = 0.05) in R software with the lme4 and emmeans packages. Means with the same letters within each factor are not significantly different. 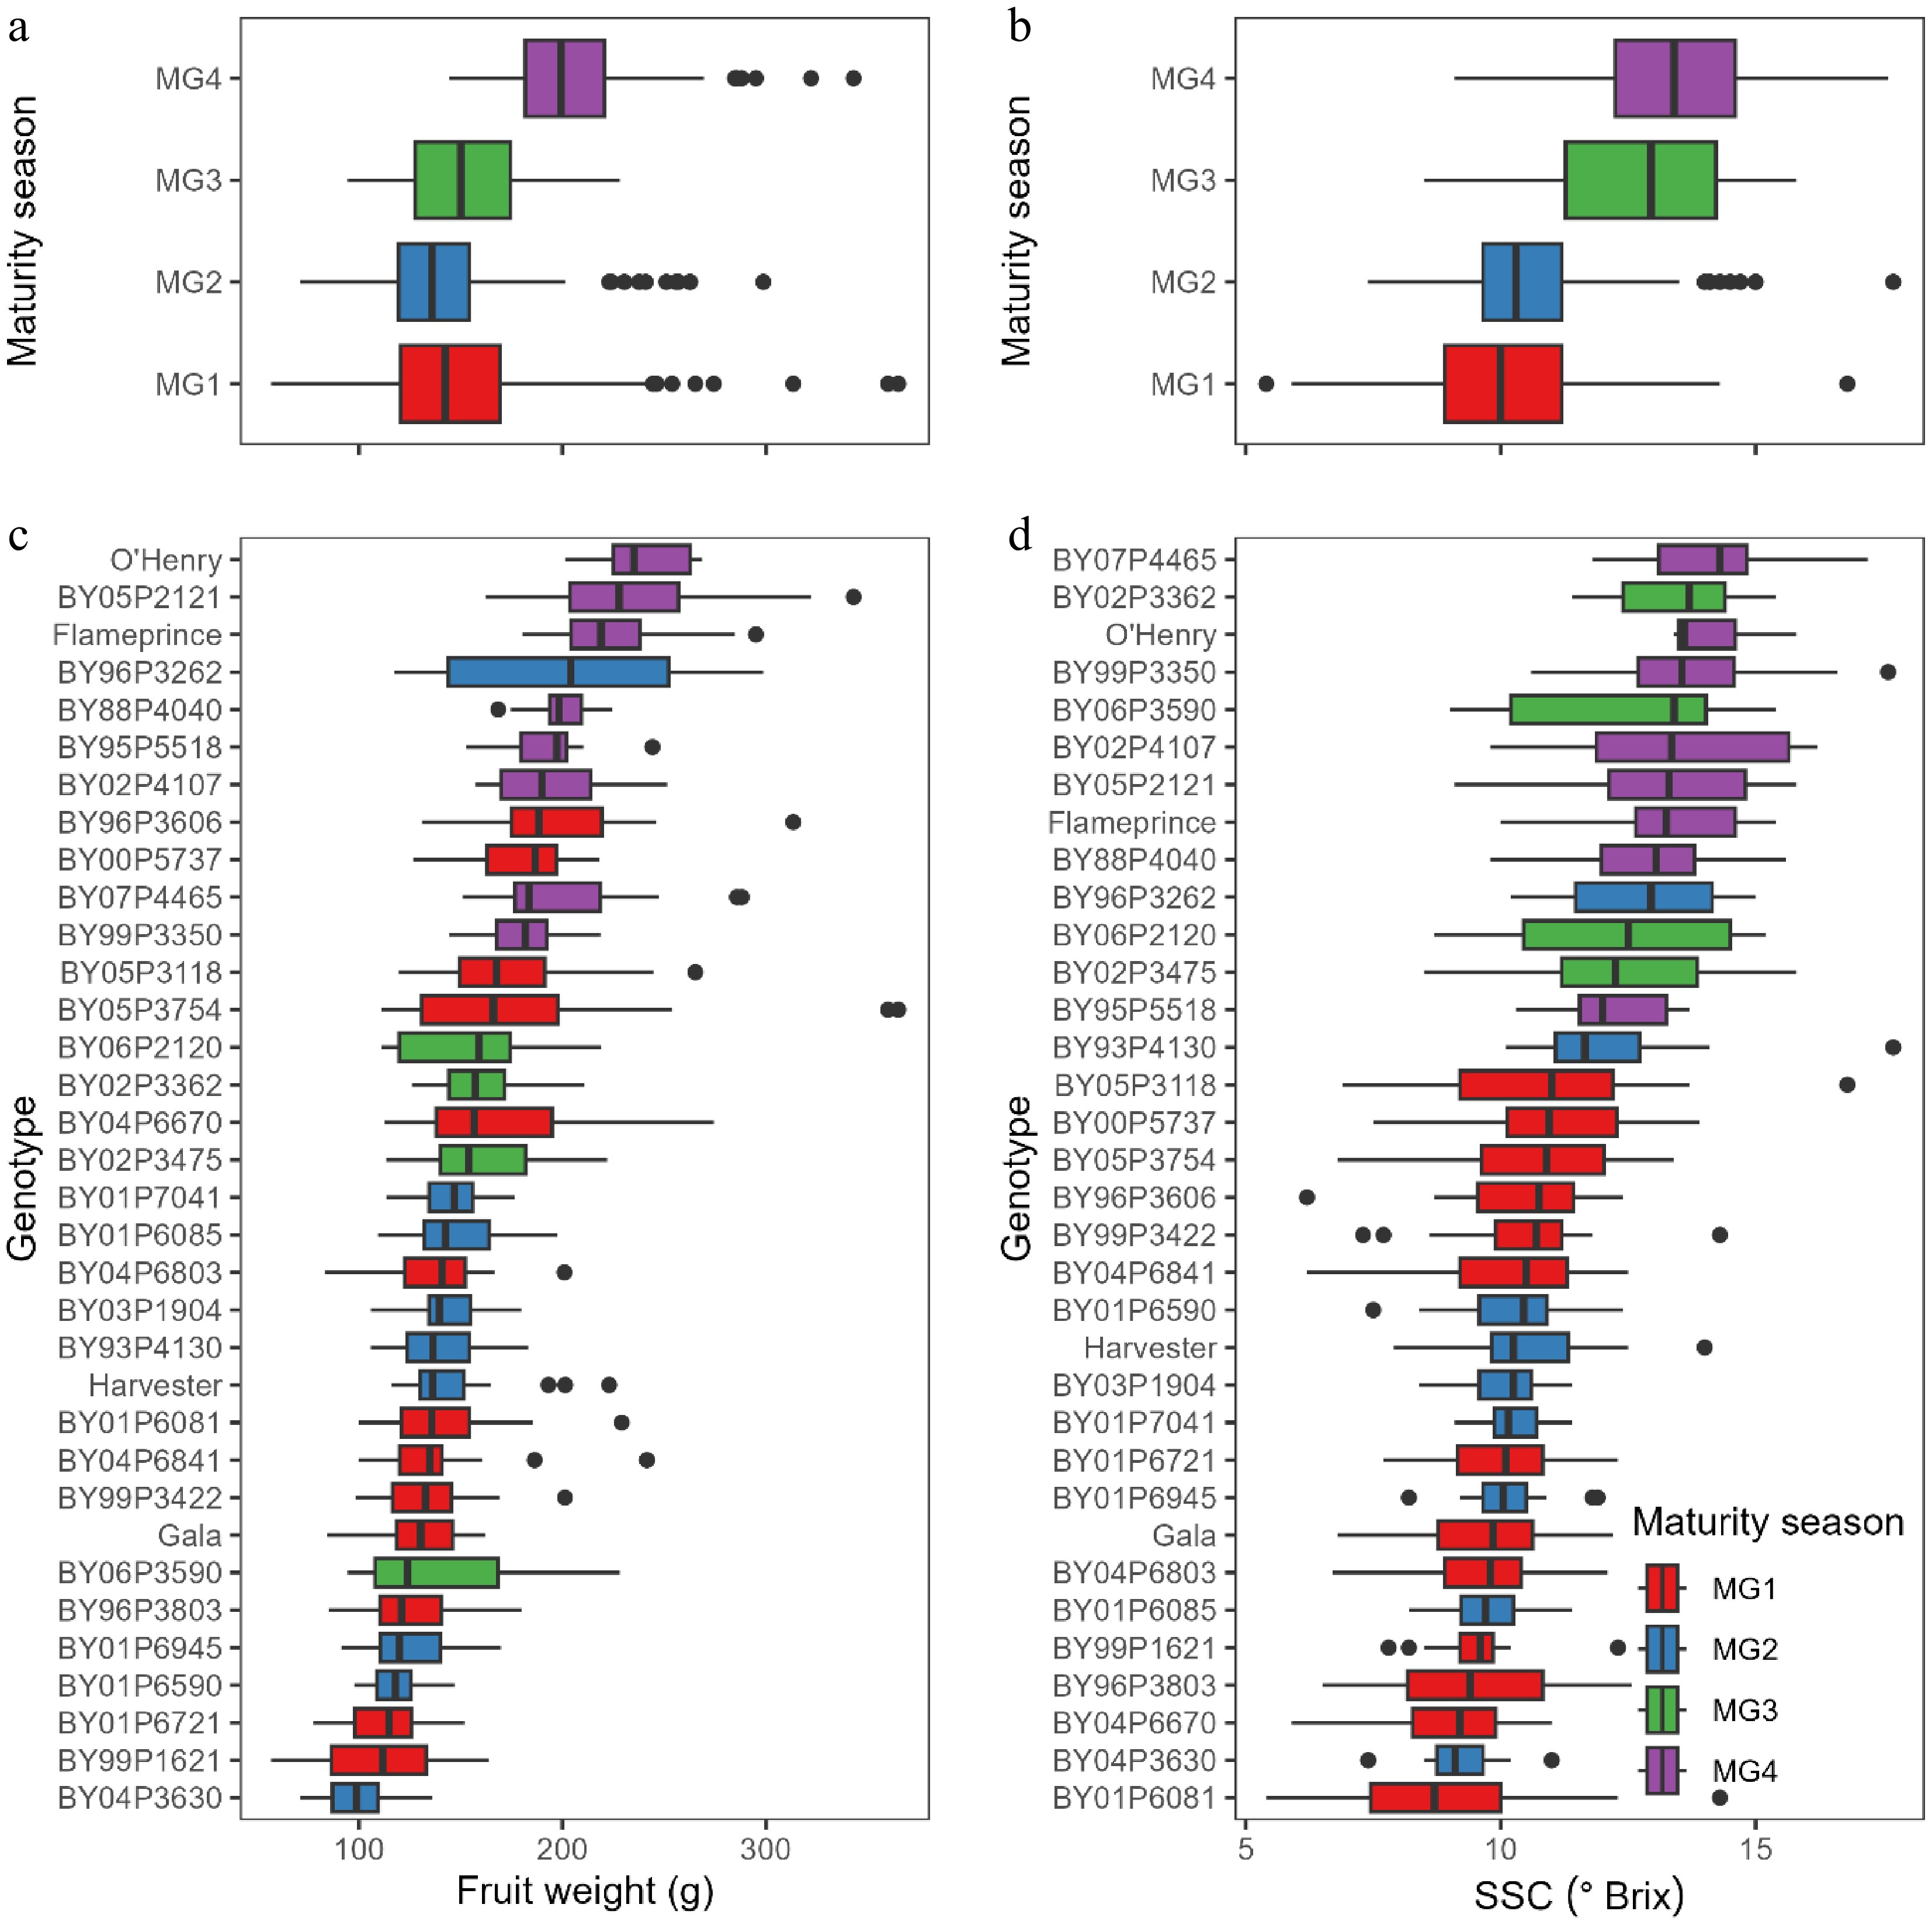
Figure 2.
Boxplots illustrating distributions (medians and central 50%) of fruit characteristics by (a), (b) maturity season groups MG1−4, and by (c), (d) genotypes in the groups. Genotypes are sorted by decreasing order of median value of the characteristic. SSC = soluble solids content.
Pearson correlations between fruit characteristics and some regression analysis
-
Pearson correlations varied greatly between fruit characteristics (Fig. 3). The highest positive correlations were observed between fruit weight, flesh weight, and the average of equatorial and polar diameters. The next high-correlation group, to a weaker extent, was between any of the four fruit size characteristics with juice volume and pit weight, respectively. As expected, firmness showed negative correlations with most fruit characteristics, including the five size-related characteristics (weights and diameters), juice volume, and SSC. Firmness had weak negative correlations with the equatorial diameter, SSC, blush rating value, and juice volume, which were consistent with the trend that peach fruit on trees continued to get bigger, sweeter, redder, and juicier while softening in the ripening process. In this context, the data might be useful to determine appropriate harvest timing.
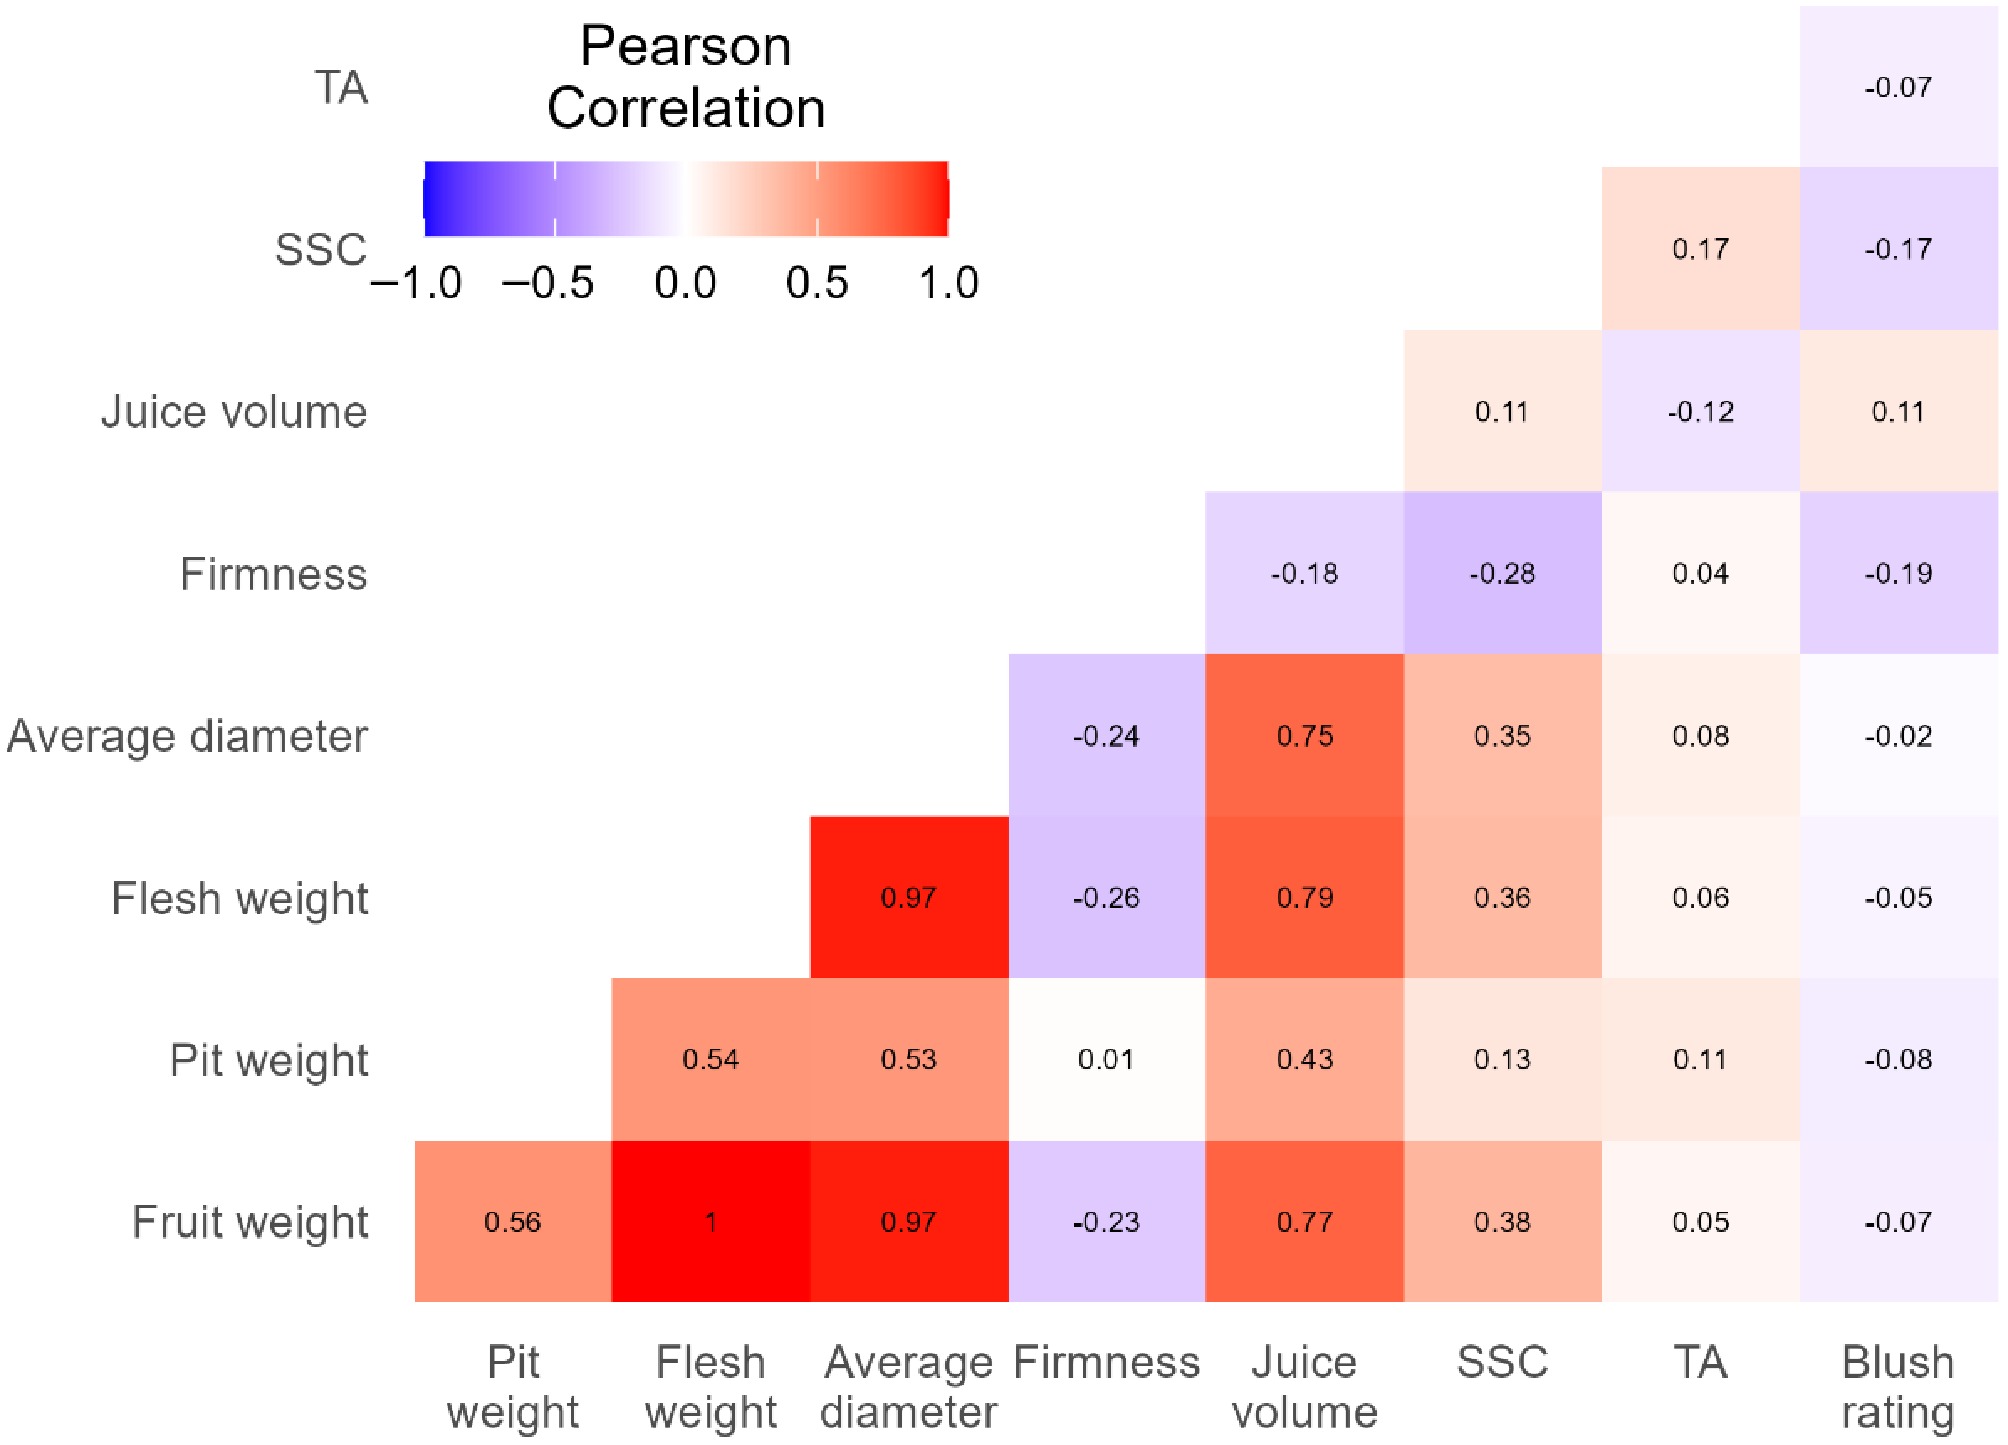
Figure 3.
Pearson correlations between pairs of fruit characteristics. The blue to red color scale from −1.0 to 1.0 represents the range from the highest negative to highest positive correlations and the values near 0.0 indicate trivial to no correlations. High positive correlations (≥ 0.75) are between any two of fruit weight, flesh weight, diameter, and juice volume. Other correlations are moderate or weak.
Regression analysis revealed the strength of the relationship between fruit weight and other fruit characteristics (Fig. 4). There was a strong correlation of fruit weight with either diameter, any of which was easy to measure and could be used as an indicator of fruit sizes. Logarithmic regression and trendlines of fruit weight with both equatorial (latitudinal) and polar (longitudinal) diameters showed a slightly better fit with higher R2 values (R2 = 0.9463 and 0.9360) (Fig. 4a, b), respectively, compared to those (R2 = 0.9339 and 0.9232) of the linear regression (data not shown). The calculated flesh weight was highly correlated with and predictable of fruit weight (Fig. 4c), whereas pit weight was much less correlated (Fig. 4d). Fruit juice volume was correlated with fruit weight to a lesser extent (Fig. 4e), but SSC was much less correlated (Fig. 4f).
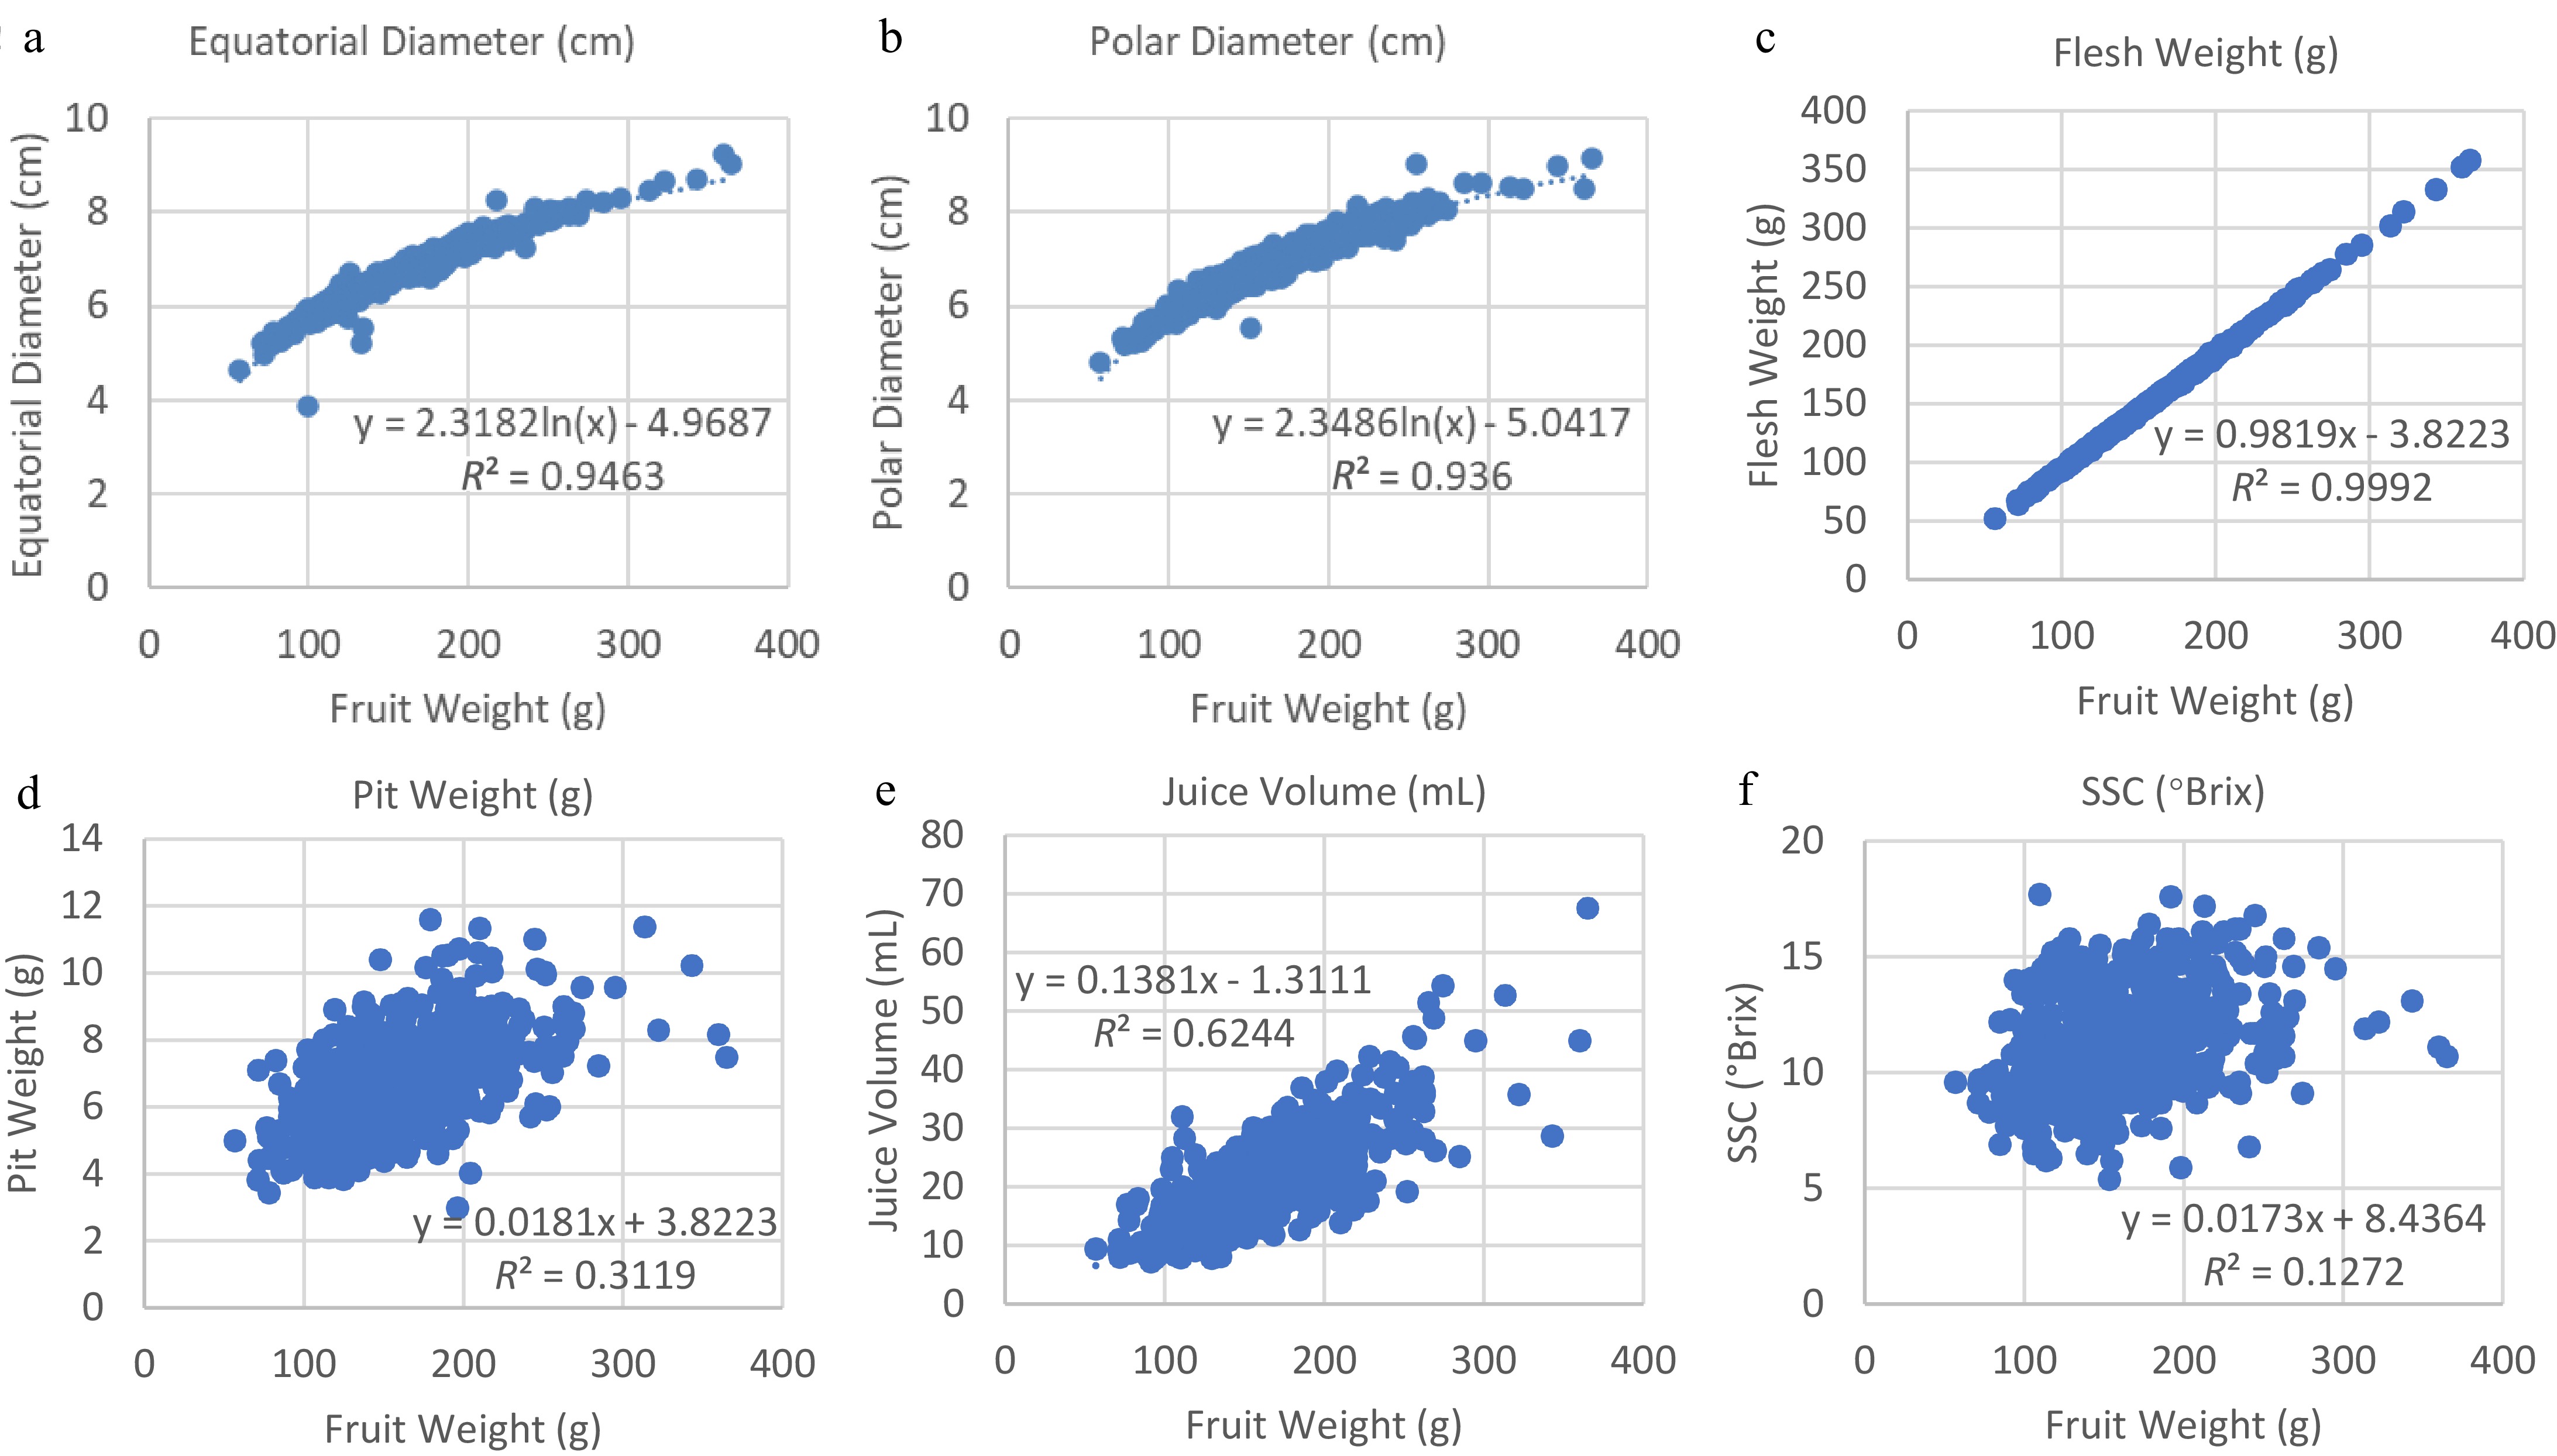
Figure 4.
Regression and coefficient of determination (R2 value) of fruit weight with (a) equatorial diameter, (b) polar diameter, (c) pit weight, (d) flesh weight, (e) juice volume, and (f) SSC (soluble solid contents).
Relationships and changes of Hunter L, a, and b color space values
-
The average values of the Hunter a and b color scale measured at different fruit spots varied significantly among the four MG (Table 2). According to their pair plots, L (lightness) and b (−blue, +yellow) of ripening peach fruit were highly linearly correlated but a (−green, +red) was not linearly correlated to L and b (Fig. 5). Instead, there was a unimodal relationship where highest values of a were found at intermediate values of L and b. Almost all the tested peaches produced highly blushed fruit. When fruit was young and immature, the fruit surface and blush typically looked dull. When fruit started ripening with the color break, attractive bright blush and yellow ground color appeared on the peach fruit surface, which were both reflected in the values of L and b and their strong correlation. As a result, the change of brightness (represented by values of L) and yellow (b) was more obvious than that of red (a), which might explain the correlation between L and b and the lack of correlation with a. In this context, because L and b are so closely related, values of only a and b represented almost all the variation in color of measured spots on peach fruit and were sufficient for subsequent analysis and interpretation of the color changes.
Table 2. Means, 95% confidence intervals, and letters of significance of values of the Hunter a and b color scale measured at different fruit spotsy.
Blush Ground Back Suture Shoulder Tip Flesh1 Flesh2 Pit hole Pit Hunter a MG1 17.76
(16.95, 18.58)bc19.67
(18.86, 20.48)c21.92
(21.11, 22.73)b22.78
(21.97, 23.59)b18.27
(17.46, 19.08)b21.84
(21.03, 22.65)b3.00
(2.10, 3.90)a3.40
(2.51, 4.30)a2.19
(1.25, 3.13)a10.97
(10.12, 11.82)aMG2 16.73
(15.72, 17.74)ab17.57
(16.56, 18.58)b20.07
(19.06, 21.08)a20.20
(19.18, 21.21)a17.38
(16.37, 18.39)ab22.58
(21.57, 23.59)b5.98
(4.94, 7.03)b6.10
(5.06, 7.15)b8.69
(7.64, 9.73)b16.85
(15.82, 17.89)bMG3 15.29
(13.80, 16.79)ab17.84
(16.34, 19.33)b21.76
(20.26, 23.25)ab21.19
(19.69, 22.68)ab17.13
(15.63, 18.62)ab23.19
(21.70, 24.69)b10.94
(9.45, 12.44)c10.95
(9.46, 12.45)c14.37
(12.87, 15.86)d10.21
(8.71, 11.70)aMG4 18.68
(17.40, 19.95)c14.15
(12.87, 15.42)a20.98
(19.70, 22.25)ab20.20
(18.93, 21.47)a15.92
(14.65, 17.19)a18.66
(17.39, 19.94)a11.26
(9.99, 12.53)c11.55
(10.28, 12.83)c11.15
(9.87, 12.42)c10.00
(8.70, 11.30)aHunter b MG1 6.76
(6.10, 7.43)a20.17
(19.52, 20.83)a12.57
(11.91, 13.22)a12.52
(11.86, 13.18)a12.99
(12.33, 13.65)a11.20
(10.54, 11.85)a21.43
(20.70, 22.15)a20.44
(19.71, 21.16)a15.77
(15.00, 16.53)c21.65
(20.97, 22.34)cMG2 7.39
(6.57, 8.22)ab20.87
(20.05, 21.69)a13.86
(13.04, 14.68)b12.53
(11.71, 13.35)a12.69
(11.87, 13.51)a14.30
(13.48, 15.12)b23.22
(22.37, 24.07)b22.84
(21.99, 23.68)b14.10
(13.25, 14.95)b16.94
(16.10, 17.78)bMG3 6.14
(4.93, 7.36)a22.47
(21.25, 23.68)b14.31
(13.09, 15.53)b12.38
(11.16, 13.60)a13.92
(12.71, 15.14)a14.00
(12.78, 15.21)b27.18
(25.96, 28.40)c27.70
(26.49, 28.92)c5.58
(4.36, 6.80)a8.32
(7.10, 9.54)aMG4 8.38
(7.35, 9.42)b26.66
(25.63, 27.70)c18.84
(17.81, 19.88)c15.64
(14.60, 16.67)b16.01
(14.97, 17.04)b20.98
(19.94, 22.01)c28.73
(27.70, 29.77)c28.69
(27.65, 29.72)c4.97
(3.94, 6.01)a8.31
(7.26, 9.37)ay Statistical analysis was performed among the four maturity groups (MG1−4) using linear mixed models and Sidak p-value adjustment for multiple comparisons (α = 0.05) in R software with the lme4 and emmeans packages. Means with the same letters within each factor are not significantly different. 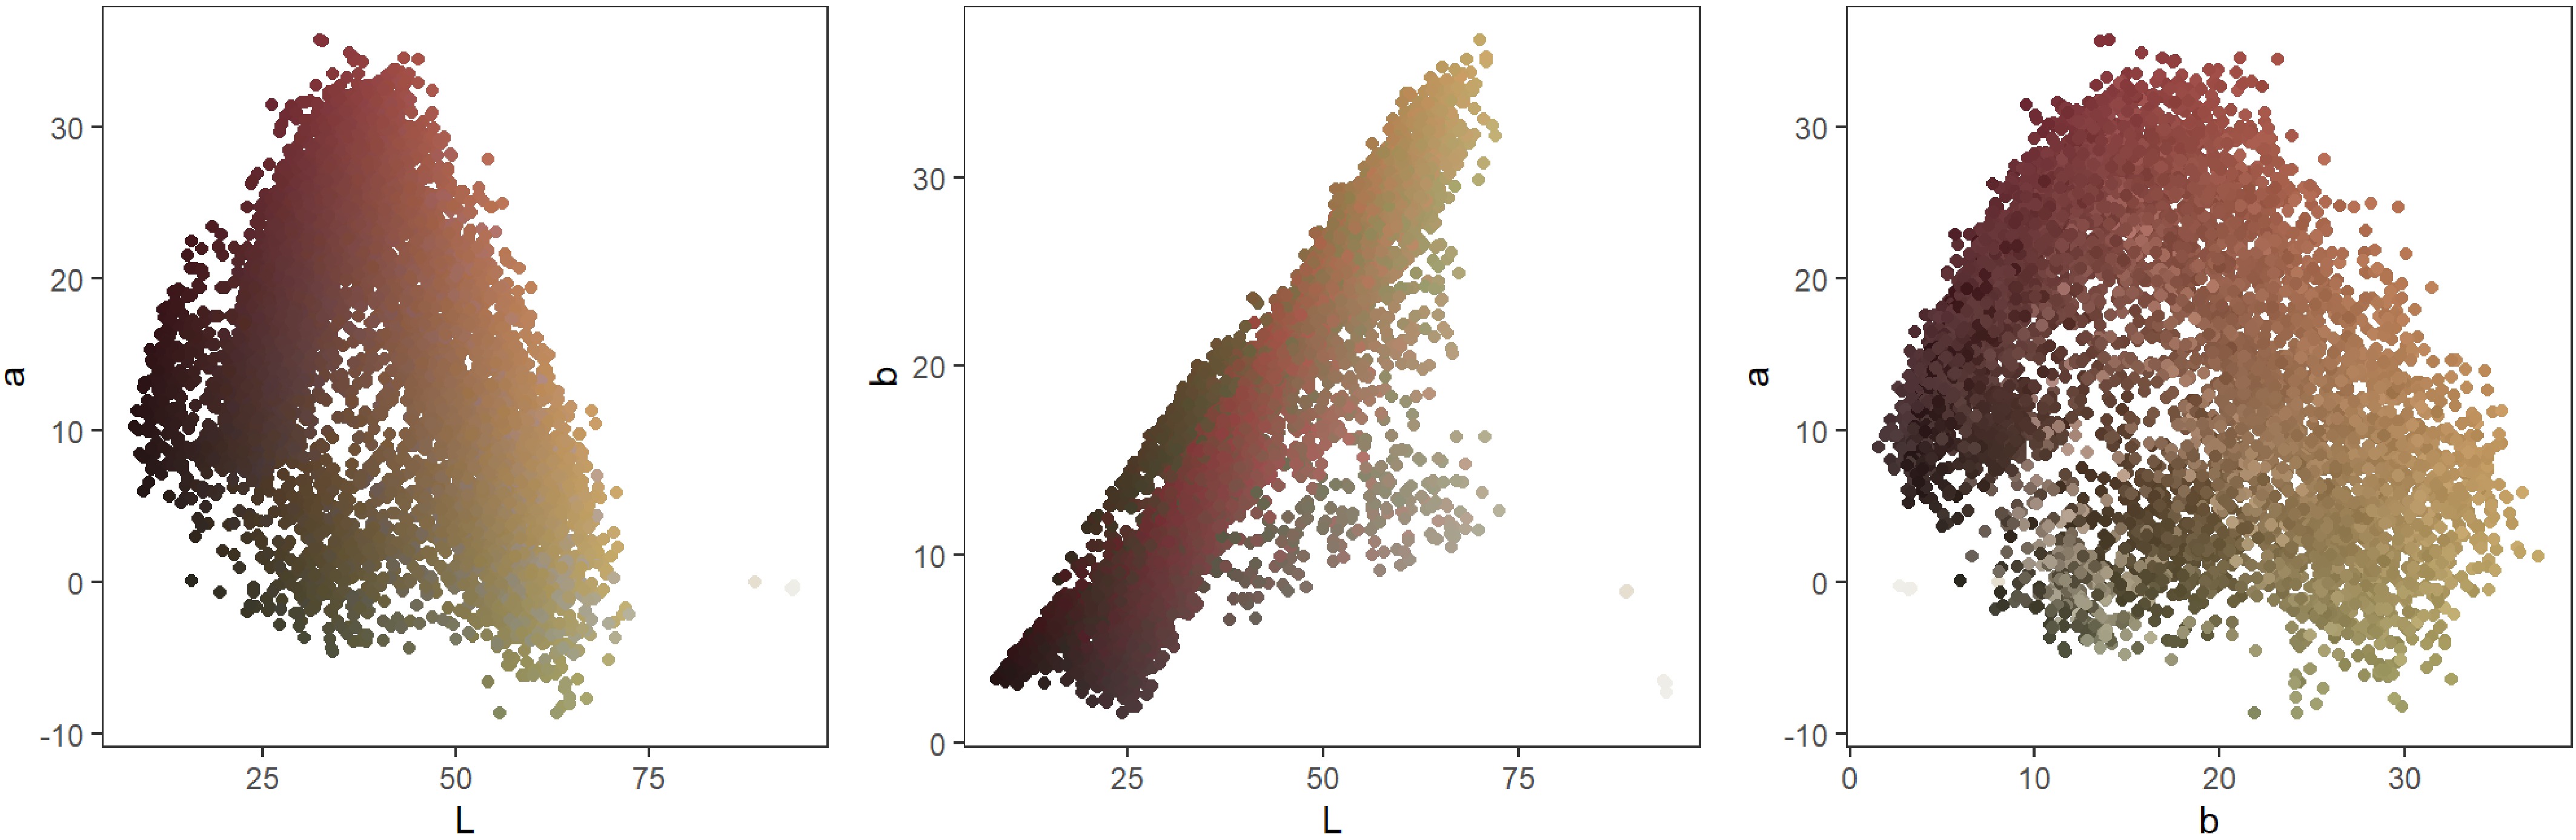
Figure 5.
Relationships of L vs a, L vs b, and b vs a, respectively, based on all L, a, and b values. The color of the data points is the approximate color of the peach.
-
Commercial peach production needs many sequentially ripening cultivars to cover the anticipated market season. Trials are an essential part of the time-consuming peach breeding pipeline, and peach fruit characteristics are among the most important breeding objectives to be evaluated annually to augment data on performances and facilitate decision on releases. In this report, we analyzed data on fruit characteristics from a peach trial and demonstrated the variability and regularity of these fruit characteristics at the ripening stage among TO, MG, and WH. Histograms also showed how the data of each fruit characteristic was distributed. The data presented here may be valuable to facilitate future selections and releases.
Previous reports revealed that the peach fruit softening and ripening process was triggered by ethylene and regulated transcriptionally with softening-related genes[25,26]. Many physio-chemical and quality attributes of ripening peach fruit were significantly influenced by cultivars and harvest locations[27]. Our results revealed that several fruit attributes had systematic differences among the same genotypes planted in the three TO, suggesting non-genotype factors also played important roles in their performance and fruit characteristics. For example, fruit sizes were significantly larger in two commercial orchards than in blocks in the research station, but Brix tended to be higher in the research station than in the other orchards. However, orchard soil conditions, culture and management practices were not a part of this study, and thus relevant information was unavailable to illustrate how they might contribute to these differences.
Hunter color was measured previously, but usually on a limited scale. For example, the Hunter color data measured in two spots of fruit from 12 peach genotypes, the least blushed area of the skin, and the flesh under the same area, revealed a trend of increasing a values with decreasing mesocarp firmness[11]. Our study was one of the first to measure the color in ten locations on each fruit from 34 genotypes and generate such a large volume of Hunter L, a, and b color data. These data revealed more interesting trends in peaches, such as the strong linear correlation between L (lightness) and b (−blue, +yellow) of ripening peach fruit and the lack of correlation with a (−green, +red). Although we assumed that red indicates ripeness and used it as a visual indication of ripening progress, the inherently high blush of fruit from most tested peaches, even at a young age, apparently made it difficult to use the a values (−green to +red) to indicate the maturity and ripening status. When ripening starts, immature dull red didn't have a 'break' stage, but only gradually became more attractive and brighter. In contrast, yellow ground color was newly developed (or called a break of the color) and appeared to be simultaneous with lightness on the peach fruit surface, which might explain the strong correlation between the values of b and L. Without the color data from the immature and unripe fruit, it would be difficult to say which of the three values could be used a digital indicator for the status of peach fruit ripening. In this context, color data on fruit at the entire development stages may be needed for monitoring the changes of the three values at the background color break stage and potentially using one or all of them as a digital indicator for optimal harvest timing and possible sorting and packing peach fruit based on the indicator. In addition, it may also be interesting to further investigate how the L or b values might be related to the previously described absorbance index of the ripening peach skin. The index coincided with the skin 'color break' and decreased quickly and linearly about two weeks before harvest. Further investigation of the values from all the peaches and refinement of value ranges to match appropriate physical properties may be needed for this potential usage.
Peach fruit quality (flavor or eating quality) is determined by genotypes (including types of fruit)[10,28], and is also substantially influenced by rootstocks, culture practices, harvest time, postharvest storage, and/or consumers' perception[3,4,8,27,29−32]. In terms of genotypes, several studies suggested that among different types of peach fruit, the basic flavors are determined by sugars and acids, and unique or distinct flavors are distinguished by aroma volatiles and flavor compounds[10,28,29]. In terms of consumers' perception and acceptance, sensory evaluations by a diverse group of people, though time-consuming, could provide useful sensory information on tested peaches and guidance on future selections. In addition, genes involved in ethylene signal transduction have been identified and characterized[25,26], as have some key genes responsible for sugar, organic acids, and aroma volatile compounds[33−36]. Characterization of these genes may facilitate the development of molecular markers and marker-assisted selection of peaches with desired genes. Therefore, measuring the four categories of chemical compounds or rating sensory quality based on tasting and smelling, along with using marker-assisted selection, is essential for breeding for desired fruit quality.
Due to an intensive schedule of fruit harvest and characterization, along with some unforeseen circumstances, not all peaches from all three locations were harvested as planned - two harvests (WH1 and WH2), a week apart. Harvests from a handful of selections were delayed to a third (WH3) or fourth (WH4) week at some of the locations. Therefore, the numbers of samples among the four WH were uneven; we only obtained a few samples for WH3 and even fewer for WH4. As a result, our estimates for the means of the last two WH may be less precise. Likewise, there were many more data points from the Byron research station (TO1) due to many fewer missed harvests. As a result, the comparisons between MG means may be more reliable at TO1 than at the other locations.
-
Ripening peach fruit characteristics varied greatly among the trial orchards, maturity season groups, and weekly harvests, respectively. In general, higher fruit weights, bigger sizes, and higher SSC were observed more often in later-matured groups and commercial orchards. Pearson correlations also varied greatly. The highest positive correlations were observed between fruit weight and diameters, any of which could be used as an indicator of fruit sizes. Firmness showed weak negative correlations with most fruit characteristics, including the five size-related characteristics (weights and diameters), blush rating value, juice volume, and SSC. The Hunter L, a, and b color scale values showed regularity and variation. L (lightness) and b (−blue, +yellow) values of ripening peach fruit were highly linearly correlated. Additional color data on peach fruit at the unripe stage may be needed in the future if it is intended to use the values to establish a digital indicator for fruit ripeness to guide harvest timing and fruit sorting.
The authors would like to thank Bryan Blackburn and Luke Quick for their technical assistance, including help for collecting the data from the tested trees and managing peach orchards in the station. The research was partly supported by the USDA National Programs of Plant Genetic Resources, Genomics and Genetic Improvement (Project No. 6042-21000-006-000D). This article reports the results of research only. Mention of a trademark or proprietary product is solely for the purpose of providing specific information and does not constitute a guarantee or warranty of the product by the USDA and does not imply its approval to the exclusion of other products that may also be suitable.
-
The authors confirm their contributions as follows: conceiving and designing the study, interpreting the results, and drafting the manuscript: Chen C; performing statistical analysis and interpretation: Read QD; editing and revising the manuscript: Chen C, Read QD. All authors reviewed the results and approved the final version of the manuscript.
-
The datasets generated during and/or analyzed during the current study are available from the corresponding author on reasonable request.
-
The authors declare that there is no conflict of interest. This article has been written by U.S. government employees in the course of their official duties as defined by the U.S. Copyright Act, 17 U.S. Code § 105.
- Supplementary Table S1 Four cultivars and thirty advanced selections in different maturity groups used in this study.
- Copyright: © 2025 by the author(s). Published by Maximum Academic Press, Fayetteville, GA. This article is an open access article distributed under Creative Commons Attribution License (CC BY 4.0), visit https://creativecommons.org/licenses/by/4.0/.
-
About this article
Cite this article
Chen C, Read QD. 2025. Variability of ripening peaches from different orchards, seasons, and harvests in the southeastern USA. Technology in Horticulture 5: e032 doi: 10.48130/tihort-0025-0027 

Variability of ripening peaches from different orchards, seasons, and harvests in the southeastern USA
- Received: 03 April 2025
- Revised: 25 June 2025
- Accepted: 02 July 2025
- Published online: 09 September 2025
Abstract: Peach trials are an essential component of the conventional breeding pipeline. In this study, we analyzed data from a peach trial and revealed the variability of fruit characteristics of ripening peaches across different seasons, harvests, and trial locations. Fruit characteristics varied greatly and showed different distribution patterns among the trial orchards, maturity season groups, and weekly harvests, respectively. In general, higher fruit weights, larger sizes, and higher soluble solids content (SSC) were more often found in later-matured groups, and in commercial orchards. Pearson correlations also varied greatly. The highest positive correlations were observed between fruit weight, flesh weight, and the average of equatorial and polar diameters, any of which could be used as an indicator of fruit size. Firmness showed weak negative correlations with most fruit characteristics, including fruit weight, diameters, blush rating, juice volume, and SSC, which were consistent with the trend that peach fruit on trees continued to get bigger, redder, juicier, and sweeter while softening in the ripening process. The Hunter L, a, and b color scale values demonstrated regularity and variation. L (lightness) and b (−blue, +yellow) values of ripening peach fruit were highly linearly correlated, but L and a (−green, +red) or b and a were not. The data is also valuable for understanding the peach fruit ripening process, optimizing appropriate harvest timing, and determining potential new releases.